SALMON PANEL. PANEL LEADER Trond Valderhaug ANALYST Georg Liasjø. Mike Cusack, Troy Enz, Sebastian Goycoolea, Patrice Flanagan, Egil Ove Sundheim
|
|
|
- Myron McKinney
- 6 years ago
- Views:
Transcription

1 SALMON PANEL PANEL LEADER Trond Valderhaug ANALYST Georg Liasjø Mike Cusack, Troy Enz, Sebastian Goycoolea, Patrice Flanagan, Egil Ove Sundheim


2 THE SALMON PANEL Trond Valderhaug Georg Liasjø Mike Cusack Troy Enz Sebastian Goycoolea Patrice Flanagan Egil Ove Sundheim 2
3 Overview Supply Better purchasing environment; supplies are stable, increased in 215 Increase in Canadian production; Chile volumes will remain consistent in 216 Slight increase in world supply 2-3%; strongest growth is in Canadian side A biological situation that needs to be controlled; what kind of efforts are underway to correct? Trade Trade ban in Russia has moved Norwegian product to US market Wild Capture trends Narrative: global currency, comparison by species Trends/shift in the market Different needs for different guests? What does the guest value the most? Millennials needs/concerns as a consumer Expansion of retail market Value added and convenience emerge as important buying factors 3
4 Farmed salmon markets Total supply grew 3-4% in 215 Growth in Norway, Canada and UK, slight decline in Chile Russian embargo on Norwegian/EU salmon maintained Continued growth in new markets Lower prices (Chile vs. Norway) Very low supply growth in 216 Strengthening dollar 4
5 ~75% of world salmon supply is farmed Estimated Total World Salmon Supply: Farmed & Wild 4, WILD FARMED TOTAL 3,5 3, KTONNES (WFE) 2,5 2, 1,5 1, e Source: Kontali, AquaBench 5
6 Atlantic Salmon dominates farmed supply Estimated Total World Salmon Supply: Farmed 25 ATLANTIC SALMON PACIFIC SALMON TROUT 2 KTONNES (WFE) e Source: Kontali, AquaBench 6
7 Norway and Chile dominate farmed Atlantic production Share of World Farmed Atlantic Production, 215e Faroes 3% Other countries 1% Canada 6% Australia 2% USA 1% Ireland 1% UK 7% Chile 26% Norway 53% Source: Kontali, AquaBench 7
8 215, supply: Slight increase in Norway; Chile down 2,5 World Supply of Farmed Atlantic Salmon NORWAY CHILE OTHERS TOTAL HARVEST 2, KTONNES (WFE) 1,5 1, e Source: Kontali, AquaBench 8
9 Total farmed Atlantic supply grew about 3% Farmed Atlantic Salmon By Region (215e Vs. 214) e Δ y-o-y kt Δ y-o-y % 3, 2,5 1% 12% 1% 2, 8% KTONNES (WFE) 1,5 1, 5 3% 3% 6% 4% 2% -5-1% Norway Chile Others World total % -2% Source: Kontali, AquaBench 9
10 Chilean production likely to continue decrease Total Salmonids Trout Coho FARMED SALMON, CHILE TROUT, CHILE COHO, CHILE SMOLT RELEASE SMOLT RELEASE (AVG. Y AND Y - 1) SMOLT RELEASE (AVG. Y AND Y - 1) KTONNES (WFE) MILL. SMOLT KTONNES (WFE) MILL. SMOLT KTONNES (WFE) MILL. SMOLT Source: Kontali, AquaBench 1
11 Chilean production likely to continue decrease Chilean Atlantic Salmon Production and Smolt Release (1 Year Prior) ATLANTIC SALMON, CHILE SMOLT RELEASE (Y - 1) KTONNES (WFE) e 216e 217e MILL. SMOLT Source: Kontali, AquaBench 11

12 Global trade flow of farmed Atlantic salmon Source: Kontali, Marine Harvest 12


13 August (214) Russian import ban closed one of Norway s largest markets; ban maintained in
14 Changes in Russian sourcing Atlantic Salmon Consumption, Russia (By Origin) FROM NORWAY FROM CHILE OTHER Q AVERAGE, LTM KTONNES (WFE) Source: Kontali 14
15 The EU and the US absorbed the supply growth Atlantic Salmon Consumption By Market Q1-Q3, 213 Q1-Q3, 214 Q1-Q3, KTONNES (WFE) EU USA Russia Japan Greater China ASEAN Latin America Other markets Source: Kontali 15
16 Total US Atlantic imports up 12-13% in US Farmed Atlantic Salmon Imports By Month KTONNES (PRODUCT WEIGHT) Jan Feb Mar Apr May Jun Jul Aug Sep Oct Nov Dec Source: NOAA 16
17 US Atlantic salmon market 215 (January October, WFE) Share By Product, 214 and 215 Fresh, whole 27% Other 2% Share By Country, 214 and 215 Norway 14% Other UK Faroe Isl. 3% 4% 4% Fresh fillet 55% Chile 53% Frozen fillet 16% Canada 22% Fresh, whole 21% Other 2% Faroe Isl. 6% UK 5% Other 6% Frozen fillet 21% Fresh fillet 56% Source: NOAA Norway 11% Canada 14% Chile 58% 17
18 Growing imports from most markets US Atlantic Salmon Imports, By Country 3 CANADA CHILE FAROE ISLANDS NORWAY UK OTHERS 25 KTONNES (PRODUCT WEIGHT) Jan-14 Feb-14 Mar-14 Apr-14 May-14 Jun-14 Jul-14 Aug-14 Sep-14 Oct-14 Nov-14 Dec-14 Jan-15 Feb-15 Mar-15 Apr-15 May-15 Jun-15 Jul-15 Aug-15 Sep-15 Oct-15 Source: NOAA 18
19 Monthly Imports: Fresh Fillets 14 US Monthly Imports: Atlantic Fresh Fillets KTONNES (PRODUCT WEIGHT) Jan Feb Mar Apr May Jun Jul Aug Sep Oct Nov Dec Source: NOAA 19
20 Chile dominates fresh fillet imports US Monthly Imports: Fresh Farmed Fillets Share, LTM KTONNES (PRODUCT WEIGHT) Jan-14 CHILE NORWAY CANADA OTHER FAROE ISLANDS UK Feb-14 Mar-14 Apr-14 May-14 Jun-14 Jul-14 Aug-14 Sep-14 Oct-14 Nov-14 Dec-14 Jan-15 Feb-15 Mar-15 Apr-15 May-15 Jun-15 Jul-15 Aug-15 Sep-15 Oct-15 Other 3% Canada 4% Norway 12% Faroe UK Islands 3% 2% Chile 76% Source: NOAA 2
21 Monthly Imports: Frozen Fillets US Monthly Imports: Atlantic Frozen Fillets KTONNES (PRODUCT WEIGHT) Jan Feb Mar Apr May Jun Jul Aug Sep Oct Nov Dec Source: NOAA 21
22 Chile & Norway dominate frozen fillet imports US Atlantic Salmon Imports: Frozen Fillets Share, LTM KTONNES (PRODUCT WEIGHT) CHILE NORWAY OTHER FAROE ISLANDS CANADA UK Jan-14 Feb-14 Mar-14 Apr-14 May-14 Jun-14 Jul-14 Aug-14 Sep-14 Oct-14 Nov-14 Dec-14 Jan-15 Feb-15 Mar-15 Apr-15 May-15 Jun-15 Jul-15 Aug-15 Sep-15 Oct-15 Other 6% Norway 25% Faroe Islands 1% Canada % UK % Chile 68% Source: NOAA 22
23 Monthly Imports: Fresh Whole 14 US Monthly Imports: Fresh Atlantic Whole KTONNES (PRODUCT WEIGHT) Jan Feb Mar Apr May Jun Jul Aug Sep Oct Nov Dec Source: NOAA 23
24 Canada dominates fresh whole imports US Atlantic Salmon Imports: Fresh Whole Share, LTM KTONNES (PRODUCT WEIGHT) Jan-14 CANADA FAROE ISLANDS NORWAY UK CHILE OTHERS Feb-14 Mar-14 Apr-14 May-14 Jun-14 Jul-14 Aug-14 Sep-14 Oct-14 Nov-14 Dec-14 Jan-15 Feb-15 Mar-15 Apr-15 May-15 Jun-15 Jul-15 Aug-15 Sep-15 Oct-15 Norway 1% Faroe Islands 9% UK 8% Chile 2% Others 1% Canada 7% Source: NOAA 24
25 Atlantic salmon prices fell in 215 (as in 214) Fresh Farmed Atlantic Salmon Prices 6. Norway, whole fish Canada, whole fish Chile, fresh fillets (D-trim, Miami) USD/lb Source: NOAA, Urner Barry 25
26 Indexes of foreign currency values Indexes Of Exchange Rates (As Of December 215) USDNOK USDJPY USDCAD USDGBP USDCLP USDEUR Jan-13 Feb-13 Mar-13 Apr-13 May-13 Jun-13 Jul-13 Aug-13 Sep-13 Oct-13 Nov-13 Dec-13 Jan-14 Feb-14 Mar-14 Apr-14 May-14 Jun-14 Jul-14 Aug-14 Sep-14 Oct-14 Nov-14 Dec-14 Jan-15 Feb-15 Mar-15 Apr-15 May-15 Jun-15 Jul-15 Aug-15 Sep-15 Oct-15 Nov-15 Dec-15 Source: FactSet 26 26
27 Projected Atlantic supply growth: ~1% World Supply Of Farmed Atlantic Salmon SUPPLY GROWTH 25% 2% Y-O-Y GROWTH (PERCENT) 15% 1% 5% % -5% Source: Kontali, ABG Sundal Collier 27
28 Strong correlation between change in supply and change in price 15 H1 vs. 14 H1 Source: Marine Harvest, Kontali
29 Projected Atlantic supply World Supply Of Farmed Atlantic Salmon 2,5 NORWAY CHILE OTHERS TOTAL HARVEST 2, KTONNES (WFE) 1,5 1, 5 Source: Kontali, ABG Sundal Collier 29
30 Price divergence, Chile vs. Norway (partly driven by supply) Salmon Price Norway Norway (NOK/kg) Salmon Price Chile (US Market) Chile (USD/lb) European Supply (Norway + UK + Faroes) American Supply (Chile + Canada) SUPPLY, EUROPE SUPPLY GROWTH, EUROPE SUPPLY, AMERICA SUPPLY GROWTH, AMERICA KTONNES (WFE) 1,6 1,4 1,2 1, % 15% 1% 5% % -5% Y-O-Y GROWTH (PERCENT) KTONNES (WFE) % 5% 4% 3% 2% 1% % -1% -2% -3% -4% Y-O-Y GROWTH (PERCENT) Source: ABG Sundal Collier, Kontali, Sernapesca, AquaBench, FHL, Urner Barry 3
31 Price divergence explained #1: Variation in supply growth Price, Atlantic Salmon Norway vs. Chile NOK/kg (gwe) Growth diff Q1'6 Q3'6 Q1'7 Difference (Chile Norway) In Supply Growth And Price Q3'7 Q1'8 Q3'8 Q1'9 Q3'9 Q1'1 Q3'1 Q1'11 Q3'11 Q1'12 Q3'12 Q1'13 Q3'13 Q1'14 NOK/kg gwe 1 Q3'14 Q1' Diff Chile, Miami Hist. avg. Norway Diff Chilean supply growth vs. European supply growth Source: ABG Sundal Collier, Kontali, Sernapesca, AquaBench, FHL, Urner Barry 31
32 Price divergence explained #2: FX matters (strong USD)! Price, Atlantic Salmon Norway vs. Chile NOK/kg (gwe) Diff Chile, Miami Hist. avg. Norway Jan-13 Mar-13 May-13 Jul-13 USDNOK Vs. Usdeur Sep-13 USDNOK Nov-13 Jan-14 Mar-14 May-14 Jul-14 Sep-14 USDEUR Nov-14 Jan-15 Mar-15 May-15 Jul-15 Sep-15 Nov-15 Source: ABG Sundal Collier, Kontali, Sernapesca, AquaBench, FHL, Urner Barry, FactSet 32
33 Supply driver, Chile: Negative operating margins 1. USD/kg EBIT/Kg, Listed Chilean Salmon Producers (Atlantic Salmon Only).9 Reference price (USD/lbs) Q1'12 Q2'12 Q3'12 Q4'12 Q1'13 Q2'13 Q3'13 Q4'13 Q1'14 Q2'14 Q3'14 Q4'14 Q1'15 Q2'15 Q3' Farming EBIT/kg Reference price (rhs) Source: Multiexport, AquaChile, Australis, Blumar, Camanchaca 33
34 III. Wild Salmon Markets Alaska 215 Second largest salmon harvest on record, only exceeded by 213 harvest levels Sockeye Bristol Bay Second largest run in the last 2 years and 12% above forecast Fraser River 248,4 fish harvested in the Fraser River, In-season forecast decreased sustainably from pre-season forecast Pinks..The number of pink salmon came closer to the 213 record year Prince William Sound pink salmon harvest was largest on record at 98.3 million fish 34
35 Global Wild Salmon Supply CHUM COHO PINK SOCKEYE CHINOOK 7, 6, 5, METRIC TONS 4, 3, 2, 1, E Source: Kontali, Canada Dept of Fisheries, ADFG
36 Estimated Catch of Russian Wild Salmon CHUM COHO PINK SOCKEYE METRIC TONS E Source: Kontali
37 Alaska Wild Salmon Harvests CHINOOK SOCKEYE COHO PINK CHUM 35, 3, 25, MT 2, 15, 1, 5, Source: ADFG 37
38 Alaska and BC Sockeye Harvest ALASKA CANADA 6 5 MILLIONS OF FISH Sources: Alaska Department of Fish and Game, Canada Department of Fisheries and Oceans 38
39 US Sockeye Salmon Imports From Canada 9 FRESH FROZEN CANNED MT Source: National Marine Fisheries 39
40 Alaska Sockeye Salmon Production HARVEST (IN LBS) FROZEN CANNED BASED ON POUNDS/48 TALL FRESH 3,, 25,, 2,, POUNDS 15,, 1,, 5,, Source: ADF&G, Alaska Department of Tax and Revenue; Annual Alaska Salmon Production Report 4
41 Bristol Bay Sockeye Forecast TOTAL FORECAST TOTAL HARVEST MILLIONS OF FISH projected Source: ADF&G 41
42 Sockeye Salmon Wholesale Price $9. FROZEN H&G FROZEN FILLETS FRESH H&G CANNED BASED ON 48 TALL CASE $8. $7. PRICE PER LB USD $6. $5. $4. $3. $2. $1. $- Source: Alaska Department of Revenue 42
43 Alaskan Sockeye Canned Production 3,, TALLS HALFS QUARTERS OTHER 25,, 2,, POUNDS 15,, 1,, 5,, Source: Alaska Department of Tax and Revenue; Annual Alaska Salmon Production Report 43
44 Alaska Pink Salmon Total Harvest HARVEST 8,, 7,, 6,, ROUND POUNDS 5,, 4,, 3,, 2,, 1,, Source: ADFG 44
45 Alaska Pink Salmon Production FROZEN FRESH CANNED 3,, 25,, FINISHED POUNDS 2,, 15,, 1,, 5,, Source: State of Alaska Dept of Revenue 45
46 Pink Salmon Wholesale Prices FROZEN H&G CANNED TALLS/CAN $2.5 $2. PRICE $1.5 $1. $.5 $ Source: Alaska Department of Revenue 46


47 Consumers want and expect healthier choices when they are eating out today Consumers are increasingly looking for ways to bring their at-home health aspirations into the food service realm. 84% have changed their dining habits in past few years Making good food choices outside the home has little to do with nutritional information and everything to do with increasingly nuanced and sophisticated quality cue. 25% Choose freshest, cooked-to-order menu items 42% Order healthier options 31% Try new flavors and styles of food 34% Avoid sugaradded beverages 18% Choose locally sourced, seasonal items 18% Explore more global or ethnic types of food 18% Order more 17% Choose restaurants that allow meal customization/ subs Q6. Compared to a few years ago, which of these things are you doing MORE often than before? plant-based foods Source: Sustainable Food Service (214); Base: Total Respondents (n=1554) 47


48 Guests care first about what is in their food, and then how it came to be GUEST IMPORTANCE Tier 1: WHAT S IN IT? Tier 2: HOW WAS IT MADE? GUESTS WANT TO KNOW GUESTS ARE LOOKING FOR ABOUT WHAT IS IN THE FOOD THEY ARE BUYING. What ingredients are in your products From where you source the ingredients that contribute to quality and flavor of the food (e.g., terroir) Inherent positives Absence of negatives Short ingredient list Recognizable ingredients HOW THEIR FOOD CAME TO BE. How a company's products are sourced and manufactured to assure quality and safety standards How you treat the animals that are used in your products Growing methods Humane treatment of animals Issues of scale Production techniques Source: The Hartman Group Insights On Health & Wellness And Sustainability 48

 Pesticide free (37%) Real (36%) Hormone free (31%) Natural (31%) No artificial flavors/colors/preservati ves (31%) MSG free (31%) Locally")
49 Consumers increasingly demand fresh, real, less processed options at food service Fresh continues to be a most valued quality distinction marker, whereas descriptors such as locally grown and seasonal are now almost as salient as calorie and fat information. Menu labels that indicate attributes such as fresh, real, locally grown and the absence of harmful ingredients (i.e., pesticide or hormone free) are also most personally relevant to consumers as they are perceived as quality cues. TOP 1 MOST IMPORTANT MENU LABELS Fresh (55%) Pesticide free (37%) Real (36%) Hormone free (31%) Natural (31%) No artificial flavors/colors/preservati ves (31%) MSG free (31%) Locally grown produce (31%) Less processed (3%) Humane treatment of animals (3%) 49

 consumers adopt Core")


50 17% Consumer engagement with sustainability varies THE CORE is the segment most intensely involved in sustainability Promoting sustainability for the benefit of the greater good is a defining feature of their values, and it consistently drives decision making 67% 16% THE MID-LEVEL represents the majority of consumers and the greatest opportunity because of both their size and relatively high level of interest in sustainability Inner Mid-Level (34%) consumers adopt Core attitudes and behaviors, but more typically make decisions based on benefits to themselves Outer Mid-Level (33%) consumers are occasionally influenced by sustainability in their purchases when it intersects with personal benefits THE PERIPHERY is least involved in sustainability Periphery consumers rarely consider sustainability explicitly in their decision making, but it does play a role in their value system more generally Where consumers reside within the World of Sustainability defines the intensity of their engagement with and decisions made around sustainability topics. The gap between aspirations and behavior narrows as consumers become more engaged and the scope of their sustainability-driven behaviors grows. 5
51
52 APPENDIX
53 Economics matter; so does the economy Farmed Atlantic Salmon Consumption Per Capita vs. GDP Per Capita Kg/capita (WFE) France Netherlands 2.5 Israel Germany KG/CAPITA (WFE) Russia Ukraine Brazil ThailandArgentina China/HK/Viet. Mexico Portugal Spain South Korea Italy UK Singapore Belgium USA JapanCanada GDP/CAPITA, USDK (CURRENT) GDP/capita, USDk (current) Source: ABG Sundal Collier 53
54 The EU and the US absorbed the supply growth Atlantic Salmon Demand By Country Atlantic Salmon Demand, EU and The US EU USA RUSSIA JAPAN GREATER CHINA ASEAN LATIN AMERICA OTHER MARKETS EU USA KTONNES (WFE) Q3'14 Q4'14 Q1'15 Q2'15 Q3'15 KTONNES (WFE) KTONNES (WFE) Atlantic Salmon Demand, Russia, Japan And G. China RUSSIA JAPAN GREATER CHINA Atlantic Salmon Demand, ASEAN, L. America And Others ASEAN LATIN AMERICA OTHER MARKETS 1 KTONNES (WFE) Source: Kontali 54
55 Norway exported more to almost everywhere except Russia, Ukraine, Finland & greater China Norwegian Salmon Exports, January-November NOV-15 NOV-14 Czech Portugal Finland Japan Germany Netherlands Baltics UK Russia Poland Source: NSEC 55
56 Chile exported more to everywhere except the EU, Japan and others Chilean Salmon Exports, January-October OCT-15 OCT-14 Other Europe China South Korea Others Japan Other FarEast Russia Other Am. EU Brazil USA Source: Kontali 56
57 Exports of fresh Chilean products up Chilean Atlantic Salmon Exports, January-October Other Smoked/Salted Frozen fillets Fresh fillets Frozen Fresh Source: NOAA 57
58 Atlantic salmon prices fell in 215 (Chilean salmon prices decreased the most) Average US Import Prices, Selected Farmed Atlantic Salmon Products Fresh Fillets Whole Fresh Chile Norway Canada Norway Faroe Islands USD/kg product weight Jan-14 Feb-14 Mar-14 Apr-14 May-14 Jun-14 Jul-14 Aug-14 Sep-14 Oct-14 Nov-14 Dec-14 Jan-15 Feb-15 Mar-15 Apr-15 May-15 Jun-15 Jul-15 Aug-15 Sep-15 USD/kg product weight Jan-14 Feb-14 Mar-14 Apr-14 May-14 Jun-14 Jul-14 Aug-14 Sep-14 Oct-14 Nov-14 Dec-14 Jan-15 Feb-15 Mar-15 Apr-15 May-15 Jun-15 Jul-15 Aug-15 Sep-15 Frozen Fillets Chile Norway USD/kg product weight Jan-14 Feb-14 Mar-14 Apr-14 May-14 Jun-14 Jul-14 Aug-14 Sep-14 Oct-14 Nov-14 Dec-14 Jan-15 Feb-15 Mar-15 Apr-15 May-15 Jun-15 Jul-15 Aug-15 Sep-15 Source: NOAA 58


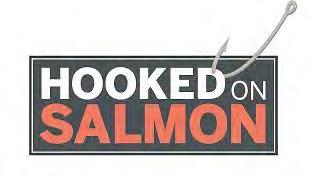
59 Some US retailers expand into new non-antibiotic categories Source: IntraFish 59
Bristol Bay and World Salmon Markets in 2016
 Bristol Bay and World Salmon Markets in 2016 Gunnar Knapp Professor Emeritus of Economics Institute of Social and Economic Research University of Alaska Anchorage Gunnar.Knapp@gmail.com January 24, 2017
GLOBAL SALMON PRODUCTION
 GLOBAL SALMON PRODUCTION Trends in Production and Market Development By Ragnar Nystoyl, Head of Analysis Kontali Analyse Vigo October 1st 2018 Agenda Supply Development Farmed Salmonids Wild-caught Salmon
08 / Industriveien 18 Phone: N Kristiansund Fax:
 Aquaculture Bulletin HEADLINES 08 / 2006 - a guideline for investors in the aquaculture business * Still high prices on the wholesale markets in the EU, with total supply of Atlantic salmon up with 4.6
Q Financial Report Presentation
 Nourishing the future Q3 2014 Financial Report Presentation Andrés Lyon, CEO Cristián García-Huidobro, CFO Santiago, November 7, 2014 Agenda I. Highlights II. III. IV. Financial Statements Productive Performance
Salmon Market Analysis 2007
 Salmon Market Analysis 2007 April 2008 Systemizing the World of Aquaculture and Fisheries Industriveien 18, NO-6517 Kristiansund N Norway Tel.: +47 71 68 33 00 Fax: +47 71 68 33 01 E-mail: mail@kontali.no
The Salmon Industry: Twenty-Five Predictions for the Future
 The Salmon Industry: Twenty-Five Predictions for the Future by Gunnar Knapp Professor of Economics Institute of Social and Economic Research University of Alaska Anchorage 3211 Providence Drive Anchorage,
Overview of World Salmon Markets
 CHAPTER VI Overview of World Salmon Markets Key Points Introduction North American wild salmon are sold in numerous product forms and markets around the world. To understand what is happening to prices
Market Insights. June 30, 2018
 June 30, 2018 Economic Overview 2 Global & Regional Growth Forecasts IMF GDP Forecasts (% change YoY) 2010 2011 2012 2013 2014 2015 2016 2017 2018 Advanced Economies 1.7% 1.2% 1.3% 2.1% 2.3% 1.7% 2.3%
Market Insights. March 29, 2019
 March 29, 2019 Economic Overview 2 Global & Regional Growth Forecasts IMF GDP Forecasts (% change YoY) 2010 2011 2012 2013 2014 2015 2016 2017 2018 Advanced Economies 1.2% 1.4% 2.1% 2.3% 1.7% 2.4% 2.3%
TEGMA Fall Transportation Symposium
 TEGMA 2017 Fall Transportation Symposium John Wilson Senior Vice President Dairy industry trends 1997 1998 1999 2000 2001 2002 2003 2004 2005 2006 2007 2008 2009 2010 2011 2012 2013 2014 2015 2016 Million
Recent Events in the Market for Canadian Snow Crab
 Recent Events in the Market for Canadian Snow Crab Overview The quantity of snow crab produced and exported by Canada increased dramatically through the late 1990s, but has levelled off and remained quite
Foreign overnights in the Nordic countries 2015
 Foreign overnights in the Nordic countries 2015 Sources: Statistics Statistics Statistics Statistics July 2016 VISIT FINLAND STATISTICS Contents Foreign overnights in the Nordic countries.4 Overnights
DG AGRI DASHBOARD: CITRUS FRUIT Last update:
 8.000 7.000 6.000 5.000 4.000 3.000 2.000 1.000 0 1996 1997 1998 1999 2000 2001 2002 2003 2004 2005 2006 2007 2008 2009 2010 2011 2012 2013 2014 2015 2016 2017 Small citrus (group mandarines): clementines,
World supply and demand of tilapia
 World supply and demand of tilapia by Helga Josupeit FAO Rome, October 2010 World tilapia production World tilapia production has been booming during the last decade, with output doubling from 830000 tonnes
Lobster Market Analysis. Policy and Economics Branch DFO Gulf Region May 2008
 Lobster Market Analysis Policy and Economics Branch DFO Gulf Region May 2008 1 Commercially landed lobster species (Volume landed in 2006 x 1,000 m.t.) LOBSTERS (251) CLAWED LOBSTERS (170) UNCLAWED LOBSTERS
Global Containerboard Outlook
 Global Containerboard Outlook European Conference March 2018 Gleb Sinavskis Economist, European Paper Packaging Copyright 2018 RISI, Inc. Proprietary Information Gleb Sinavskis Economist, European Paper
Fishery. Fishing vessels (Dept. of Finance)
") Fishery Fishing vessels (Dept. of Finance) The Newfoundland and Labrador fishery recorded a difficult year in 29 due to low market prices, continued pressure from low-cost producers, and an appreciating
Fishery Fishing vessels (Dept. of Finance) The Newfoundland and Labrador fishery recorded a difficult year in 29 due to low market prices, continued pressure from low-cost producers, and an appreciating
DG AGRI DASHBOARD: CITRUS FRUIT Last update:
 14 000 12 000 10 000 8 000 6 000 4 000 2 000 0 1996 1997 1998 1999 2000 2001 2002 2003 2004 2005 2006 2007 2008 2009 2010 2011 2012 2013 2014 2015 2016 Small citrus (group mandarines): clementines, satsumas
OCEAN2012 Fish Dependence Day - UK
 OCEAN2012 Fish Dependence Day - UK Europeans are now so dependent on fish products originating from external waters that half the fish they consume are sourced outside the EU Fish dependence: The EU s
Ragnar Tveteras. University of Stavanger Norway
 Ragnar Tveteras University of Stavanger Norway Professor Ragnar Tveteras is a business economist at the University of Stavanger s Department for Industrial Economics, Risk Management and Planning. His
Spring 2016 Alaska Salmon Industry Analysis
 Spring 2016 Alaska Salmon Industry Analysis The Seafood Market Information Service is funded by a portion of the seafood marketing assessment paid by Alaska seafood producers. McDowell Group provides the
STORM FORECASTS: The only independent source of animal health and animal agriculture historical market data and forecasts
 The only independent source of animal health and animal agriculture historical market data and forecasts June 2016 1 What is STORM FORECASTS? STORM FORECASTS is the only independent source of animal health
New Growth Segments for the Air Cargo Industry
 Page 1 New Growth Segments for the Air Cargo Industry 4 th Air Cargo Economics Conference Prague, April 22-23, 2004 Page 2 Assumptions Primary commodity sectors and their growth Perishables: are they really
Key Figures and Trends for the Agricultural Machinery Industry
 Key Figures and Trends for the Agricultural Machinery Industry Update: November 2015 (monthly) Contact: Philip Nonnenmacher VDMA Agricultural Machinery Association philip.nonnenmacher@vdma.org Subject
Global Construction Outlook: Laura Hanlon Product Manager, Global Construction Outlook May 21, 2009
 Global Construction Outlook: Short-term term Pain, Long-term Gain Laura Hanlon Product Manager, Global Construction Outlook May 21, 2009 What This Means for You The world is set to be hit this year with
Seafood Investment Forum Gerardo Balbontín CEO. New York, May 22 nd, 2013
 Seafood Investment Forum Gerardo Balbontín CEO New York, May 22 nd, 2013 Agenda 1. Blumar overview 2. Business areas 3. Market outlook 4. Financials & investment considerations Blumar overview 2 Blumar
Beef Cattle Market Update
 Beef Cattle Market Update August 8, 2017 Dr. Scott Brown Agricultural Markets and Policy Division of Applied Social Sciences University of Missouri brownsc@missouri.edu http://amap.missouri.edu Twitter
Cattle Market Outlook & Important Profit Factors for Cattle Producers
 Cattle Market Outlook & Important Profit Factors for Cattle Producers Dr. Scott Brown Agricultural Markets and Policy Division of Applied Social Sciences brownsc@missouri.edu http://amap.missouri.edu $
Fishery. Harvesting. Snow Crab Professional Fish Harvesters Certification Board
 Fishery T he Newfoundland and Labrador fishery faced several challenges in 8, including continued competition from low-cost producers, as well as high fuel costs and unfavourable exchange rates for most
Prepared by: McDowell Group, Inc. Andy Wink CAP Meeting
 Prepared by: McDowell Group, Inc. Andy Wink CAP Meeting 7.28.15 Alaska Seafood Overview Fishery & Market Update Key Issues Ketchikan Seafood Industry Who and What is Alaska Seafood? About 60,000 fishermen,
Change, Challenges and Opportunities for Wild Fisheries
 Change, Challenges and Opportunities for Wild Fisheries Gunnar Knapp Professor of Economics University of Alaska Anchorage September 2002 This is a slightly modified version of a presentation which I gave
Beef Outlook. Regional Dealer Event. February 9, Dr. Scott Brown Agricultural Markets and Policy Division of Applied Social Sciences
 Beef Outlook Regional Dealer Event February 9, 2018 Dr. Scott Brown Agricultural Markets and Policy Division of Applied Social Sciences brownsc@missouri.edu http://amap.missouri.edu $ Per Cwt. MED. & LRG.
Japanese Market Potential
 Growth Strategy (announced on 14 June 2013) : Japan is BACK. Overall Target: 2% Real GDP Growth in the next 10 years JPY1.5 million Increase of GNI/capita after 10 years Unleash the Potential of Private
Status and futures in the fishmeal industry
 Status and futures in the fishmeal industry By Gunn Strandheim Irish Pelagic Seminar Killybegs, Ireland 11th of November - 211 Global fishmeal production Subject. Resource situation in the fishmeal industry
Percent
 Outline Outline Growth is picking up Percent 6 Advanced economies Emerging and developing economies 5 4 4.9 5.0 4.3 4.4 4.6 4.7 4.7 3.7 3.7 3 2 2.0 2.3 1.6 2.2 2.3 1.9 1.7 1 1.1 1.3 0 2012 2013 2014 2015
Chilean Atlantic Salmon Export Report
 ch 211 Chilean Atlantic Salmon Export Report No. 3-211 uary 211 figures) Systemizing the World of Aquaculture and Fisheries Chilean Atlantic Salmon Export Report No. 3-211 uary 211 figures) Ch. from last
SQUID, OCTOPUS, HERRING & MACKEREL PANEL
 SQUID, OCTOPUS, HERRING & MACKEREL PANEL January 19, 2016 Miami, FL THE SQUID, OCTOPUS, HERRING & MACKEREL PANEL Ruth Levy Jim Kenny Mike Daniels Ferran Pauner Egil Sundheim Brady Schofield 2 OVERVIEW
Winter 2015/ Halibut & Blackcod Market Bulletin
 Winter 215/216 - Halibut & Blackcod Market Bulletin The Seafood Market Information Service is funded by a portion of the seafood marketing assessment paid by Alaska seafood producers. McDowell Group provides
2017/18 Corn Outlook
 217/18 Corn Outlook 217 Ag Econ In service Training Dr. S. Aaron Smith, Assistant Professor, Department of Agricultural and Resource Economics, University of Tennessee https://ag.tennessee.edu/arec/pages/cropeconomics.aspx
Energy Security: Markets and Policy
 Energy Security: Markets and Policy Pierre Noël EPRG, University of Cambridge Critical Infrastructure Conference, London, 20 April 2011 Contents Global Oil and the Middle East European Gas and Russia Japan
Have You Ever Heard the Phrase
 Setting the Stage with Dairy Outlook Mark Stephenson Director of Dairy Policy Analysis Have You Ever Heard the Phrase! 3M Money Makes Milk! 5M More Money Makes More Milk! 7M Much More Money Makes Much
Pork Outlook. Professor of Agricultural Economics. Midwest/Great Plains & Western Outlook Conference Indianapolis, August 2007
 Midwest/Great Plains & Western Outlook Conference Indianapolis, August 2007 Pork Outlook Ron Plain Professor of Agricultural Economics University of Missouri-Columbia http://web.missouri.edu/~plainr/ Long
Sulphur Market Outlook
 Sulphur Market Outlook Meena Chauhan Head of Sulphur and Sulphuric Acid Integer Research The Fertilizer Institute Outlook and Technology conference Fort Lauderdale, Florida Founded in 2002, Integer Research
Economic Outlook March Economic Policy Division
 Economic Outlook March 212 Economic Policy Division Real GDP Outlook Percent Change, Annual Rate 2 1 1 - -1 197 197 198 198 199 199 2 2 21 U.S. GDP Actual and Potential Quarterly, Q1 197 to Q4 211 Real
Global trade: how does it look?
 Edmonton, December 2018 Global trade: how does it look? Marie-France Paquet The Office of the Chief Economist Global Affairs Canada Overview 1. Canadian economy at a glance 2. Provincial economy at a glance
SWISS Traffic Figures May 2004
 SWISS Traffic Figures May 2004 SWISS continues seat load factor improvement in May SWISS s load factor for May was 4.8 percentage points better than for the same period last year. Seat load factor for
Commemorative Books Coverage List
 Commemorative Books Coverage List England International Football 2018 Date of Paper Pages Event Covered (Daily Mirror ) 3 Apr 1905 Pages 8 and 14 England 1 Scotland 0 (Home Championship) 5 Apr 1909 Page
The Changing Global Economy Impacts on Seaports and Trade Dr. Walter Kemmsies
 The Changing Global Economy Impacts on Seaports and Trade Dr. Walter Kemmsies Chief Economist, PAGI Group, JLL (Port, Airport & Global Infrastructure) Agenda Where are we in the cycle? What are the barriers
AREA TOTALS OECD Composite Leading Indicators. OECD Total. OECD + Major 6 Non Member Countries. Major Five Asia. Major Seven.
 Reference series Composite leading indicators OECD Composite Leading Indicators AREA TOTALS 7-03- 19 OECD Total 19 OECD + Major 6 Non Member Countries 19 Major Seven 19 Major Five Asia 19 Euro area 19
Global economic cycle has slowed
 Year-on-year % change Confidence index, 50= no change Global economic cycle has slowed 25% 70 20% International trade growth 65 15% 10% Industrial production growth 60 5% 55 0% 50-5% Business confidence
Cheese (American, Italian, Hard, Soft, Fresh and Others) Market - Global Industry Analysis, Size, Share, Growth, Trends and Forecast,
 Market - Global Industry Analysis, Size, Share, Growth, Trends and Forecast,") Cheese (American, Italian, Hard, Soft, Fresh and Others) Market - Global Industry Analysis, Size, Share, Growth, Trends and Forecast, 2013-2019 ResearchMoz include new market research report" Cheese (American,
Cheese (American, Italian, Hard, Soft, Fresh and Others) Market - Global Industry Analysis, Size, Share, Growth, Trends and Forecast, 2013-2019 ResearchMoz include new market research report" Cheese (American,
SA economic review Kevin Lings. August 2018
 SA economic review Kevin Lings August 2018 South Africa real GDP growth year-on-year %y/y 8 7 6 5 Ave 4.3% 4 Ave 2.5% 3 2 Ave 0.9% 1 0-1 -2-3 00 01 02 03 04 05 06 07 08 09 10 11 12 13 14 15 16 17 18 2
Global Boxboard Market Review
 Global Boxboard Market Review Sailing In A World Of Volatility And Uncertainty European Conference March 2018 Alejandro Mata Senior Economist, European Forest Products Copyright 2018 RISI, Inc. Proprietary
The Golf Related Products Produced by IAR Team Focus Technology Co., Ltd.
 The Golf Related Products 2012.12 Produced by IAR Team Focus Technology Co., Ltd. Contents 1. The Current Export Situation of China Golf Related Products At 2012...3 1.1. The Export Analysis of Chinese
Monthly Digest February 2016 No. 2016/04. Copyrights Statistics Botswana 2016
 STATISTICS BOTSWANA BOTSWANA INTERNATIONAL MERCHANDISE TRADE STATISTICS Monthly Digest February 2016 No. 2016/04 Copyrights Statistics Botswana 2016 Contact Statistician: Malebogo Rakgantswana Email: mrakgantswana@gov.bw
Seafood Industry Factsheet
 Seafood Industry Factsheet Cod Market overview: Cod The three species, tuna salmon and cod dominate the UK retail seafood market by volume. This report summarises both the UK imports and exports of cod
From the Ocean To the Plate
 From the Ocean To the Plate 0 About American Seafoods Company founded in 1988 25 th anniversary celebrated in 2013 Largest Catcher/Processor operator in the U.S. (6 active vessels) Largest CP quota holder
Livestock Market Trends
 Livestock Market Trends Farm$mart Agricultural Conference January 18, 2014 John Bancroft Market Strategies Program Lead john.bancroft@ontario.ca 519-271-6974 Today s Discussion 2014 FCC Market Drivers
COMPARISON OF FIXED & VARIABLE RATES (25 YEARS) CHARTERED BANK ADMINISTERED INTEREST RATES - PRIME BUSINESS*
 CHARTERED BANK ADMINISTERED INTEREST RATES - PRIME BUSINESS*") COMPARISON OF FIXED & VARIABLE RATES (25 YEARS) Fixed Rates Variable Rates FIXED RATES OF THE PAST 25 YEARS AVERAGE RESIDENTIAL MORTGAGE LENDING RATE - 5 YEAR* (Per cent) Year Jan Feb Mar Apr May Jun Jul
COMPARISON OF FIXED & VARIABLE RATES (25 YEARS) Fixed Rates Variable Rates FIXED RATES OF THE PAST 25 YEARS AVERAGE RESIDENTIAL MORTGAGE LENDING RATE - 5 YEAR* (Per cent) Year Jan Feb Mar Apr May Jun Jul
Seafood Industry. The 2012 Juneau and Southeast Alaska Economic Indicators 11/1/12 Page 60
 Seafood Industry In 2011, fishermen in Southeast landed 395,628,268 pounds of fish with an ex vessel value of $391,091,684. This harvest resulted in 272.6 million pounds of product, with a wholesale value
Overview of market trends through 2005 Forecasts for 2006 and 2007
 Overview of market trends through 2005 Forecasts for 2006 and 2007 Ed Pepke, Ph.D. Forest Products Marketing Specialist Food and Agricultural Organization & UN Economic Commission for Europe Geneva, Switzerland
Global Outlook for Agriculture Trend versus Cycle
 Global Outlook for Agriculture Trend versus Cycle Michael Swanson Ph.D. Wells Fargo October 2017 Everything is connected we just don t see how. Connection corollary: Nothing natural moves in a straight
2017/18 Soybean Outlook
 217/18 Soybean Outlook 217 Ag Econ In service Training Dr. S. Aaron Smith, Assistant Professor, Department of Agricultural and Resource Economics, University of Tennessee https://ag.tennessee.edu/arec/pages/cropeconomics.aspx
Economic potential of Agriculture and Pig production in Baltic region. Mindaugas Jurgelis, analyst 30 May, 2012
 Economic potential of Agriculture and Pig production in Baltic region Mindaugas Jurgelis, analyst 30 May, 2012 1 Global tendencies of food production 2 Food prices near historical peak level FAO food price
Outline. Overview of globalization. Global outlook for real economic activity & inflation. Risks to the outlook
 2017 International Economic Outlook Everett Grant Research Economist Globalization & Monetary Policy Institute Federal Reserve Bank of Dallas October 2017 The views expressed are those of the author and
US Economic Activity
 US Economic Activity GDP has been in positive territory for seven consecutive quarters, and the advance estimate shows the US economy grew at a 1.0% rate in the fourth quarter 2015. US Economic Activity
Swine Market Outlook
 2018 IOWA PORK REGIONAL CONFERENCES NASHUA, CARROLL, LE MARS, & WASHINGTON, IA FEBRUARY 19-22, 2018 Swine Market Outlook Lee Schulz, Department of Economics, Iowa State University (515) 294-3356; lschulz@iastate.edu
Session 4. Growth. The World Economy Share of Global GDP Year 2011 (PPP)
") Session 4. Growth Stylized Facts on Standards of Living across Countries Characterizing Growth over 1 Years: The US Economy Growth Dynamics of the G7 Countries and the OECD Economies Characterizing Growth
Session 4. Growth Stylized Facts on Standards of Living across Countries Characterizing Growth over 1 Years: The US Economy Growth Dynamics of the G7 Countries and the OECD Economies Characterizing Growth
Finland s sawmilling industry
 Finland s sawmilling industry Howard Sidney-Wilmot Stora Enso - Sales Director UK, Ireland & Benelux September 2015 Stora Enso Wood Products 13/10/2015 1 Finland s forest products 19bn total value 11bn
Opening address for dinner-debate
 Opening address for dinner-debate Mohammed Barkindo Acting for the OPEC Secretary General European Parliament Strasbourg, France 4 July 2006 1 Outline Importance of EU-OPEC Energy Dialogue Current oil
Steel Market Outlook. AM/NS Calvert
 Steel Market Outlook AM/NS Calvert Agenda Economic indicators Key steel consuming markets and forecasted demand Steel consumptions trends Global steel markets and raw materials Comments on trade 1 U.S.
The economic value of the EU shipping industry. Andrew P Goodwin
 The economic value of the EU shipping industry Andrew P Goodwin 2 nd April 2014 Introduction Shipping is a vital facilitator of world trade 135 % Increase in world GDP in the last two decades 180 % Increase
Feeding fish to fish is this a responsible practice?
 Feeding fish to fish is this a responsible practice? Andrew Jackson Technical Director International Fishmeal & Fish Oil Organisation Humber Seafood Summit 15 July 2010 IFFO International Fishmeal and
Index, nominal terms, 2010 = Energy. Agriculture Metals
 Outline Broad commodity price trends Index, nominal terms, 2010 = 100 180 150 Energy 120 90 60 Agriculture Metals 30 Jan-07 Jan-08 Jan-09 Jan-10 Jan-11 Jan-12 Jan-13 Jan-14 Jan-15 Jan-16 Jan-17 Source:
Cattle & Beef Outlook
 Cattle & Beef Outlook Friday, August 18, 2017 Glynn Tonsor Dept. of Agricultural Economics, Kansas State University Overarching Beef Industry Economic Outlook Supplies Expansion continues, but has moderated
IBSA Goalball World Rankings 31 December 2017 Men's Division
 IBSA Goalball World Rankings 31 December 2017 Men's Division Rank No v Oc t Se p Au g Ju l Team Region Score Goal Diff Results Gol p Gme Last Plyd Weight 1st 5 6 6 1 2 Brazil Americas 661.802 4.564 0.872
I. World trade in Overview
 I. Table I.1 Growth in the volume of world merchandise exports and production by major product group, 1995-3 ( change) 1995-21 22 23 World merchandise exports 7. -.5 3. 4.5 Agricultural products 3.5 2.5
2016 River Use Statistics -by Steve Sullivan
 Grand Canyon River Office 2016 River Use Statistics -by Steve Sullivan Topics River Use Statistics Overview Commercial River Use Statistics Noncommercial River Use Statistics Noncommercial River Lottery
Russian seafood embargo What s next?
 Russian seafood embargo What s next? Introduction of speakers Historical update Rounds of sanctions and scope of the embargo What impacts for Russia and US+EU trade partners Scenarii for the future? Q&R
Why is Aquaculture and Aquatic Animal Health so Important?
 OIE Workshop for Aquatic Animal Focal Points Dubrovnik, Croatia 16-18 November 2010 Why is Aquaculture and Aquatic Animal Health so Important? Barry Hill President OIE Aquatic Animal Health Standards Commission
NEW COMMERCIAL VEHICLE REGISTRATIONS EUROPEAN UNION 1. July and August 2017
 PRESS EMBARGO: NEW COMMERCIAL VEHICLE REGISTRATIONS EUROPEAN UNION 1 July and August 2017 Next press release: Tuesday 24 October 2017 1 Data for Malta unavailable Page 1 of 12 Commercial vehicle registrations:
2012 Annual Conference THE HEAT IS ON! A New World Competition
 2012 Annual Conference THE HEAT IS ON! A New World Competition Going for Gold! Review of Global Hotel Performance with a focus on Olympic performance Elizabeth Winkle, STR Global InterContinental Buckhead
Car Production. Brazil Mexico. Production in thousands. Source: AMIA Asociacion Mexicana de la industria automotriz.
 Car Production Production in thousands 4000 3000 2000 1000 Brazil Mexico 0 2013 2014 2015 Source: AMIA Asociacion Mexicana de la industria automotriz. Mexico s Expanding Middle Class Percent of population
International Trade Economic Forecasts An Overview of Orange County and Southern California Exports
 International Trade Economic Forecasts An Overview of Orange County and Southern California Exports Mira Farka Adrian R. Fleissig Institute for Economic and Environmental Studies Orange County / Inland
FINAL REPORT for Sports Tourism Report For the Year 2013
 FINAL REPORT for Sports Tourism Report For the Year 2013 Prepared for The Cyprus Tourism Orgaization September 201 CONTENTS Page 1. Main Findings 2 2. Appointment and Methodology 3. General Indicators:
State of American Trucking
 State of American Trucking October 11, 2018 Rod Suarez Economic Analyst American Trucking Associations rsuarez@trucking.org Business Cycles U.S. Expansions Duration October 1949 - July 1953 May 1954 -
10/18/2015. Outline. Commodity Outlook
 Commodity Outlook Stephen R. Koontz Professor & extension economist Department of Agricultural & Resource Economics Colorado State University Stephen.Koontz@ColoState.Edu http://webdoc.agsci.colostate.edu/koontz
RISI EUROPEAN CONFERENCE. (Barcelona, 6 March 2018) The European Economy Things look good just now. Can this last?
 The European Economy Things look good just now. Can this last?") RISI EUROPEAN CONFERENCE (Barcelona, 6 March 2018) The European Economy Things look good just now. Can this last? Andrea Boltho Magdalen College University of Oxford and Oxford Economics CONCLUSIONS OF
RISI EUROPEAN CONFERENCE (Barcelona, 6 March 2018) The European Economy Things look good just now. Can this last? Andrea Boltho Magdalen College University of Oxford and Oxford Economics CONCLUSIONS OF
Economic & Financial Market Outlook
 Economic & Financial Market Outlook BC Pension Forum March 1, 2013 Chris Lawless, Chief Economist Overview Global forces Recent economic performance ~ US, Europe, Japan, China ~ Other emerging markets
BMO Capital Markets 2014 Farm to Market Conference New York, New York. May 21, 2014
 0 BMO Capital Markets 2014 Farm to Market Conference New York, New York May 21, 2014 1 Forward Looking Statement Warning This presentation contains forward-looking statements about the business, financial
Opportunities in a Challenging Global Business Environment: Can the World Avoid a Double-Dip?
 Opportunities in a Challenging Global Business Environment: Can the World Avoid a Double-Dip? Ross DeVol Chief Research Officer (310) 570 4615 rdevol@milkeninstitute.org www.milkeninstitute.org Presentation
Current Hawaii Economic Conditions. Eugene Tian
 Current Hawaii Economic Conditions Eugene Tian Department of Business, Economic Development & Tourism At the PATA/TTRA 2016 Annual Outlook & Economic Forecast Forum February 3, 2016 Positive Signs in the
Goldman Sachs U.S. Emerging/SMID Cap Growth Conference. New York, New York
 Goldman Sachs U.S. Emerging/SMID Cap Growth Conference New York, New York November 20, 2014 Forward Looking Statement Warning This presentation contains forward-looking statements about the business, financial
STATISTICS BOTSWANA INTERNATIONAL MERCHANDISE TRADE STATISTICS. Monthly Digest February 2018
 STATISTICS BOTSWANA INTERNATIONAL MERCHANDISE TRADE STATISTICS Monthly Digest February 2018 Contact Statistician: Malebogo Rakgantswana Email: mrakgantswana@statsbots.org.bw Tel: (+267) 367 1300 Statistics
UK Trade Statistics 2017
 Value ( million) Rate of Exchange (USD against GBP) ORNAMENTAL AQUATIC TRADE ASSOCIATION LTD. "The Voice of the Ornamental Fish Industry" 1 st Floor Office Suite, Wessex House 4 Station Road, Westbury,
2019 Global Travel Forecast: Air, Hotel and Ground Prices
 2019 Global Travel Forecast: Air, Hotel and Ground Prices Methodology 28 countries and 10 US cities Airlines, Hotel, Rental Car Forecast in USD, guidelines on currency exchange forecast Forecast projections
Trade Growth - Fundamental Driver of Port Operations and Development Strategies
 Trade Growth - Fundamental Driver of Port Operations and Development Strategies Marine Terminal Management Training Program October 15, 2007 Long Beach, CA Paul Bingham Global Insight, Inc. 1 Agenda Economic
Hog Market Outlook & Pricing Methods
 Banff Pork Seminar January 11, 2018 Hog Market Outlook & Pricing Methods Ron Plain Professor Emeritus of Agricultural Economics University of Missouri-Columbia http://web.missouri.edu/~plainr/ The way
Big data analytics for enrichment of rural area content tourism in Okhotsk sub-prefecture of Japan
 Big data analytics for enrichment of rural area content tourism in Okhotsk sub-prefecture of Japan Ali Bakdur, Fumito Masui, Michal Ptaszynski Kitami Institute of Technology, Dept. of Computer Science,
OECD employment rate increases to 68.4% in the third quarter of 2018
 Paris, 17th January 2019 News Release: 3rd Quarter 2018 OECD employment rate increases to 68.4% in the third quarter of 2018 The OECD area employment rate the share of the working-age population with jobs