Lewis River Bull Trout. Habitat Restoration Project Identification Assessment. Final Report
|
|
|
- Marvin Richardson
- 6 years ago
- Views:
Transcription
1 Lewis River Bull Trout Habitat Restoration Project Identification Assessment Final Report Final Report Submitted: November 9, 2017 Submitted to: Lewis River Aquatic Coordination Committee Submitted by: Jamie Lamperth 1, Abi Groskopf 2, and Bryce Michaelis 3 1 Washington Department of Fish and Wildlife, 804 Allen Street, Suite 3, Kelso, WA Mount St. Helens Institute, NE Yale Bridge Road, Amboy, WA United States Forest Service, NE Yale Bridge Road, Amboy, WA 98601
2 TABLE OF CONTENTS EXECUTIVE SUMMARY... 1 METHODS... 3 Field Surveys... 3 Stream Reach Selection... 3 In-stream Habitat Surveys... 8 Redd Locations and Microhabitat Characteristics Data Analysis Logistic Regression Summarizing Field Data Habitat Variable Selection Model Selection Electivity Index Redd Microhabitat Characteristics RESULTS Model Results Electivity Index Redd Microhabitat Characteristics Habitat Outside of Known Spawning Locations DISCUSSION AND RECOMMENDATIONS HABITAT RESTORATION CONCEPTUAL SCOPING DESIGNS Little Creek Rush Creek Side Channels Drift Creek... 31
3 Clear Creek Clearwater Creek Muddy River REFERENCES APPENDIX A APPENDIX B APPENDIX C APPENDIX D PROPOSAL FORM APPENDIX E
4 List of Tables Table 1. Stream-specific linear regression equations relating... 7 Table 2. Stream reaches that were selected to model bull trout redd occurrence and to assess for potential habitat restoration sites Table 3. Counts of redd occupancy in 100 m reaches with complex and simple channels. Numbers in parentheses are expected counts for each cell Table 4. Descriptive statistics of 100 m reaches by level of bull trout redd occurrence in Pine Creek and P8 combined. Variables that were retained through the variable selection process to model bull trout redd occurrence are in bold type. Statistics for each variable are derived from non-transformed values Table 5. The best supported models out of all possible model subsets predicting bull trout redd occurrence as a function of select habitat variables in the upper Lewis River basin, WA. Log-transformed (loge(x+1)) values of Pool (m 2 ), Fines (m 2 ), and Boulder (m 2 ) were used in the models Table 6. Parameter estimates and odds ratios for the bull trout redd occupancy model with the lowest AICc score Table 7. Habitat selection of side channel habitats by Table 8. Descriptive statistics of select microhabitat variables associated with bull trout redds. 23 Table 9. Habitat attributes of streams considered for habitat restoration scoping designs.... Error! Bookmark not defined. 4
5 List of Figures Figure 1. Map showing the reaches surveyed for this project. Redd lines indicate reaches that were surveyed to develop a bull trout redd occupancy model. Yellow lines show reaches that were outside of known spawning locations and met specific selection criteria based on habitat accessibility, restoration potential, and thermal suitability Figure 2. Map showing 2013 maximum daily stream temperatures in the upper Lewis River basin... 6 Figure 3. Locations of bull trout redds observed in the Pine Creek basin, WA in 2014 and the location of 100 m reaches by level of bull trout redd occurrence Figure 4. A map showing 100 m reaches by levels of bull trout redd occurrence and channel complexity in the Pine Creek basin, WA Figure 5. Stream depth preference by spawning bull trout in the Pine Creek basin, WA. Depth is the mean depth of 100 m reaches. The preference index values (proportion of habitat used/proportion of habitat not used) are indicated for each stream depth bin Figure 6. Proportion of 100 reaches with a complex channel by stream in the upper Lewis River basin, WA. Bull trout are known to spawn in Rush Creek, P8, and Pine Creek Figure 7. Proportion of 100 m reaches with suitable stream reach depth for spawning bull trout by stream in the upper Lewis River basin, WA. The most preferred depth is cm. Habitat preference decreases with increasing depth. Bull trout are known to spawn in Rush Creek, P8, and Pine Creek Figure 8. Proportion of 100 m reaches with both a complex channel and a suitable stream reach depth for spawning bull trout by stream in the upper Lewis River basin, WA. The most preferred depth is cm. Habitat preference decreases with increasing depth. Bull trout are known to spawn in Rush Creek, P8, and Pine Creek Figure 9. Location of 100 m reaches with both a complex channel and a suitable stream depth for spawning bull trout in the upper Lewis River basin, WA. The most preferred depth is cm. Habitat preference decreases with increasing depth... 26
6 EXECUTIVE SUMMARY The primary goal of this project is to identify locations in the upper Lewis River basin to implement habitat restoration actions intended to increase the quality and quantity of suitable spawning and/or rearing habitat for bull trout (see Appendix D Project Proposal). The agencies and organizations associated with the project proposal (i.e., US Forest Service, US Fish and Wildlife Service, WA Department of Fish and Wildlife, PacifiCorp, Cowlitz Indian Tribe, Lower Columbia Fish Recovery Board, and Mount St. Helens Institute) agreed to focus on spawning habitat and designed a two-phase study to accomplish the project goal (see Appendix E Study Plan). The objective of the first phase of the study was to characterize suitable spawning habitat within the basin. To do this, we modeled the occurrence of bull trout redds as a function of instream habitat using field data (i.e., habitat surveys and redd surveys). By necessity, the data used to develop this model were collected in streams known to support bull trout spawning (i.e., the Pine and Rush creek basins). The objective of the second phase of the study was to identify areas within the basin that lacked the suitable spawning habitat characteristics identified in the first phase of the study. In-stream habitat data were collected from select reaches throughout the basin that were outside of known spawning locations, were most likely to be used by migratory bull trout (i.e., physically accessible and thermally suitable) and had some degree of restoration potential based on local knowledge and federal administrative constraints (i.e., habitat restoration cannot occur in the Mount Saint Helens Volcanic National Monument). Model results showed that bull trout redds in the Pine Creek basin in 2014 were 4 times more likely to occur in reaches with complex channels (i.e., more than one channel with flowing water during base flow conditions) than reaches with only one main channel, and redd occurrence was negatively related to stream depth. Data from Rush Creek were not included in the model because only one redd was observed in The result from an independent habitat selection analysis suggested bull trout moderately selected side channel habitat for spawning. Taken together, these results suggest that habitat complexity and depth at the reach scale are important factors influencing bull trout spawning site selection within thermally suitable habitat. Areas throughout the study area that lacked these habitat features were mapped. Additional factors that should be considered for any restorations project is the thermal environment and the 1
7 proximity of the proposed site to currently occupied habitats. Evidence from multiple studies suggests cold water is an essential component of suitable spawning and early rearing habitat for bull trout and cannot be discounted. The source populations that would colonize any restored habitat will come from the Pine and Rush Creek basins; the closer the restoration site is to these populations the more likely a colonization event will occur. Overall, this study recommends restoration actions that increase channel complexity in the coldest accessible stream reaches within the basin. 2
8 METHODS Field Surveys Stream Reach Selection In order to model associations between stream habitat and bull trout redd locations, habitat and redd surveys were conducted in all known spawning tributaries in the Lewis River basin above Swift Reservoir: Pine Creek, P8 (tributary to Pine Creek), and Rush Creek (Figure 1). Additional habitat surveys were conducted in areas outside of known spawning locations to expand the assessment of potential habitat restoration sites. These reaches were selected using several criteria including habitat accessibility, restoration potential, and thermal suitability. The migratory life history type is the only life history type of bull trout known to inhabit the Lewis River basin so any habitat restoration actions need to take place in reaches accessible to migratory fish. Due to this limitation, reach selection was limited to areas downstream of migration passage barriers. The one exception was in Drift Creek. Local biologists suggested extending the survey reach above the passage barrier. Migration passage barriers in the basin include impassable waterfalls and dewatered channels above stream sources of emerging groundwater. Restoration potential was considered when selecting reaches outside of known spawning locations. Reaches with little or no restoration potential were trimmed from the basin and included Crab Creek, Little Creek, the upper portion of Smith Creek, Muddy River upstream of the Smith Creek confluence, and all tributaries to Swift Reservoir except Drift Creek. Little Creek was excluded because there are existing plans for restoration actions in this basin. The upper portion of Smith Creek and the Muddy River upstream of the Smith Creek confluence were excluded because these reaches are located with the Mount Saint Helens National Volcanic Monument where federal law prohibits modifications to the landscape. The remaining reaches were excluded because they were determined by local biologists to be unsuitable for bull trout based on previous work funded by PacifiCorp Energy (Meridian Environmental 2007). 3
 and stream temperature has been shown to be the most important component of suitable spawning and rearing habitat (Dunham et al. 2003; Isaak et al. 2010).")
9 The thermal environment was included as a factor in identifying potential restoration sites because bull trout are among the most thermally sensitive species of North American salmonids (Selong et al. 2001) and stream temperature has been shown to be the most important component of suitable spawning and rearing habitat (Dunham et al. 2003; Isaak et al. 2010). We elected to use maximum daily temperature to determine thermal suitability as it is among the best temperature predictors (Dunham et al. 2003). To ensure we included a sufficient amount of habitat to assess, we chose to include reaches with 25% probability of juvenile bull trout occurrence in Washington streams which corresponds to a maximum daily temperature of 17.5 o C (Dunham et al. 2003). The presence of juvenile bull trout is assumed to indicate spawning and early rearing habitat (Dunham et al. 2003) Figure 1. Map showing the reaches surveyed for this project. Red lines indicate reaches that were surveyed to develop a bull trout redd occupancy model. Yellow lines show reaches that were outside of known spawning locations and met specific selection criteria based on habitat accessibility, restoration potential, and thermal suitability. 4
10 To identify thermally suitable reaches in the basin, temperature data loggers (HOBO Pendant, Onset Computer Corporation, Pocasset, MA; accuracy ± 0.53 C) were deployed during the summer months of 2013 and 2014 to measure maximum daily temperatures (Figure 2). In addition to the data loggers deployed specifically for this project, temperature data were used from loggers deployed at monitoring sites for the Mount Saint Helens Water Quality Monitoring Program and the USFS Aquatic and Riparian Effectiveness Monitoring Program (Appendix A). In general, temperature sites were selected to capture thermal gradients related to elevation within the individual streams of interest. With this approach we could take advantage of the strong association between elevation and temperature (Dunham and Chandler 2001; Isaak and Hubert 2001) and model maximum temperature as a function of elevation using linear regression. Multiple data loggers were deployed in streams with extensive habitat availability (e.g., Clear and Clearwater creeks) with at least one each near the upper and lower bounds of the available habitat. Only one data logger was deployed in streams with little accessible habitat (e.g., Cussed Hollow and Spencer Creek) as temperature gradients were assumed to be negligible owing to the minimal elevation differences between the upper and lower bounds of the accessible habitat. Only temperature data collected in 2013 were used to identify thermally suitable reaches because stream temperatures were cooler in 2013 compared to 2014 thereby increasing the amount of suitable habitat to assess and 2014 data were not available from several of the key sites (e.g. Muddy River above Clear Creek). 5
11 Figure 2. Map showing 2013 maximum daily stream temperatures in the upper Lewis River basin. Of all the stream reaches that met the passage barrier and restoration potential criteria, only three were limited by our thermal suitability criterion (see Appendix A). These reaches were in Clear Creek, Clearwater Creek, and the Muddy River. Linear regression was used to model the lower bound of thermally suitable habitat in these reaches (Table 1). For Clear and Clearwater creeks, two temperatures were used as the inputs, one each near the upper and lower extent of available habitat. The lower bound of thermally suitable habitat was modeled at 1361 feet elevation in Clear Creek and 1528 feet elevation in Clearwater Creek. For the Muddy River, data were only available from one site (Muddy River Above Clear Creek) and that site was downstream of the temperature limit (>17.5 o C) so additional data inputs were needed from higher elevation sites to model Muddy River temperature. Clear Creek and Clearwater Creek temperature sites were considered as options and the Clearwater Creek sites were selected 6
12 because the temperature at the Muddy River site was warmer than would be expected based on the Clear Creek regression but it was a reasonable value when compared to the Clearwater Creek regression. Therefore, Clearwater Creek and Muddy River data were pooled (3 sites) and the lower bound of thermally suitable habitat was modeled at 1498 feet elevation. This elevation is located 0.33 km above Clearwater Creek; however, the extent of the reach for survey purposes was extended downstream to the Clearwater Creek confluence based on recommendations by local biologists. The reaches that met the selection criteria based on habitat accessibility, restoration potential, and thermal suitability are presented in Table 2 and Figure 1. Table 1. Stream-specific linear regression equations relating maximum daily temperature ( o C) to elevation (feet). Stream Linear Regression Equation Clear Creek MaxTemp = * (Elevation) Clearwater Creek MaxTemp = * (Elevation) Muddy River MaxTemp = * (Elevation) Table 2. Stream reaches that were selected to model bull trout redd occurrence and to assess for potential habitat restoration sites. Bull Trout Stream Upper Bound Lower Bound Spawning Status P8 Passage Barrier Mouth Known - Yes Pine Creek Passage Barrier Mouth Known - Yes Rush Creek Safety Mouth Known - Yes Bean Creek Passage Barrier Mouth Unknown Big Creek Passage Barrier Mouth Unknown Chickoon Creek Passage Barrier Mouth Unknown Clear Creek Passage Barrier Thermal Threshold Unknown Clearwater Creek Passage Barrier Thermal Threshold Unknown Cussed Hollow Passage Barrier Mouth Unknown Drift Creek Above Passage Barrier Mouth Unknown Muddy River MSHNVM Thermal Threshold Unknown Smith Creek MSHNVM Mouth Unknown Spencer Creek Passage Barrier Mouth Unknown Note: MSHNVM, Mount Saint Helens National Volcanic Monument 7
13 In-stream Habitat Surveys Spatially continuous habitat surveys were conducted during base flow conditions from July 28 to September 3, 2014 (known spawning areas) and from July 20 to September 15, 2015 (outside of known spawning areas) by a two-person field crew. The surveys were designed to quantify the habitat available to spawning bull trout and included metrics likely to influence salmonid spawning habitat use and likely to be altered by habitat restoration efforts. Attributes of in-stream habitat that have been shown to influence spawning habitat use and were quantified in the surveys included stream channel type (Wissmar and Craig 2004), large woody debris (LWD; Senter and Pasternack 2011; Shellberg et al. 2010), instream hiding cover (Bjornn and Reiser 1991; Wissmar and Craig 2004; Braun and Reynolds 2011; Nika et al. 2011), and potential spawning patches (PSP; Lamperth 2012). PSPs are defined below. Additionally, data were collected to characterize channel morphology (i.e., wetted width, depth, maximum depth) and surface substrate type. Habitat surveys were conducted in a downstream direction and covered the entire spatial extent identified during the reach selection process. Typically the surveys started at a passage barrier and ended at the mouth of the stream or at the thermal threshold. Select habitat metrics were collected within each habitat unit, in other words, habitat data were organized by habitat unit. Habitat units were visually classified as a pool, riffle, or glide (Bisson et al. 1982). Pools were classified as a habitat unit if the length was greater than the wetted width of the channel. The upper extent of the habitat unit was georeferenced with a handheld global positioning system (GPS; Garmin etrex, Garmin, Olathe, KS) and the accuracy of the waypoint was recorded. The length of each habitat unit was measured with a hand-held range finder. Habitat units longer than 100 m (i.e., riffles) were subdivided into shorter distances with the maximum length set at 100 m due to the spatial resolution of the analysis approach (i.e., the habitat variables were summarized at 100 m reaches; see Data Analysis section). Habitat units were classified as being part of one of three stream channel types: main channel, side channel, or braided channel. Main channels were defined as the channel with the majority of the flow; side channels were channels separated from the main channel by an island with well-established vegetation and carrying at least 10% of the stream flow; and braided 8
14 channels were channels separated by islands of river bed material (i.e., substrate) without wellestablished vegetation and carrying at least 10% of the stream flow. Wetted width was measured perpendicular to the flow at five evenly-spaced transects (including one at the upstream and one at the downstream extent of the unit) to the nearest 0.1 m. Depth was measured to the nearest 0.01 m at one-quarter, one-half, and three-quarter distance along each width transect and at the deepest location within the entire habitat unit (maximum depth). In cases where the channel could not be safely crossed, depth measurements were estimated. Pieces of channel-forming LWD (both > 5.0 m length and > 30 cm diameter) within the active stream channel were counted. Isolated pools that were not large enough to be classified as a habitat unit were counted. The percentage of dominant and subdominant surface substrate types were visually estimated to the nearest 10% within each habitat unit. The substrate type had to make up at least 20% of the habitat unit to be included. Substrate types were categorized by intermediate axis length and included fines (< 2 mm), gravel (2 64 mm), cobble ( mm), boulder (> 256 mm), and bedrock (Cummins 1962). Hiding cover was defined as a slow water velocity area that had some type of shelter associated with it. Aquatic and riparian habitat features that were considered hiding cover included wood (both > 1.0 m length and > 10 cm diameter), overhanging vegetation touching the stream surface, and undercut banks with horizontal depths > 50 cm. Turbulence was also considered cover if the samplers could not clearly delineate substrate particles through the water surface. In addition to these criteria, the habitat features needed to include a surface water area of at least 0.5 m 2 with no point shallower than 45 cm. Depths greater than 80 cm with a minimum area of 0.5 m 2 were considered cover even if no cover features were associated with them. Hiding cover was quantified as the surface water area associated with each cover feature. Three important microhabitat components of suitable spawning habitat gravel, water depth, and water velocity (Bjornn and Reiser 1991; Kondolf and Wolman 1993; Crisp 2000; Armstrong et al. 2003; Barlaup et al. 2008) were quantified as a composite variable, PSP (sensu Isaak et al. 2007). PSPs were identified as areas at least 0.5 m 2 with gravel as the dominant substrate (intermediate axis length 2 64 mm), water depth cm, and water velocities at least 10 cm/s (visually estimated). These criteria are based on research describing 9
15 microhabitat characteristics of bull trout redds (Kitano et al. 1994; Hagen and Taylor 2001; Wissmar and Craig 2004; for a review see McPhail and Baxter 1996). Dominant surface substrate size for PSP was determined visually by comparing the surface substrate to a 64 mm reference stone. Similar to hiding cover, PSP was quantified as the area of the water surface where these criteria were met. Redd Locations and Microhabitat Characteristics Spatially continuous bull trout redd surveys were conducted in all of the known spawning tributaries from September 10 to October 30, 2014, after the habitat surveys were completed. The redd surveys covered, at minimum, the spatial extent of the habitat surveys. Surveys were conducted on a total of 33 days and each stream was generally surveyed on a weekly basis. The surveys were designed to document accumulation of redds, redd location, the type of channel used (i.e., main, side, or braided channel), and to quantify select microhabitat characteristics. Surveyors were trained on redd identification prior to the conducting the redd surveys. Redds were identified as disturbed areas of the streambed with clean substrate and a well-defined substrate excavation site (i.e., pit or pot) and substrate deposition site (i.e., pillow and tailspill). Surveyors took care to exclude redd-like features that were created hydraulic forces. Redds were classified as either definite or possible based on how well defined the stream feature was. If the surveyor was uncertain whether the feature was created by a spawning bull trout, the redd was classified as possible. Definite and possible redds were georeferenced and the accuracy of the waypoint was recorded. Redds were also visually marked by securing surveyor s flagging to stream side structures (e.g., vegetation or LWD). The date of the observation, the number of bull trout observed in the vicinity of the redd, and the type of stream channel used were recorded. Microhabitat data were collected to characterize the location of the redd across the stream channel and the water depth of various features of the redd. At each definite redd, surveyors measured the wetted width of the channel (to the nearest 0.1 m), the distance from the center of the redd to the nearest stream margin (to the nearest 0.1 m), and the relative location of the redd (i.e., river right or river left). Depth measurements (to the nearest 0.01 m) were taken at the pit, the pillow, the tailspill, and from one undisturbed location on each side of the redd. 10
16 Data Analysis There were four analysis objectives: 1) model bull trout redd occurrence as a function of in-stream habitat data, 2) use an electivity index to further understand spawning habitat selection, 3) describe the microhabitat of redds, and 4) identify areas lacking suitable spawning habitat based on the redd occurrence model. Developing the redd occurrence model was a complex process so it is briefly summarized here. Logistic regression was used to model redd occurrence, or the present-absence of redds, in 100 m reaches. The model did not take into account the absolute number of redds in a reach, simply whether the number of redds was 0 or greater than 0. Several steps were taken to develop the model and included summarizing and organizing the field habitat data into 100 m reaches, linking redd and reach locations using GIS, selecting variables that contained information about redd occurrence but were not correlated with other variables (variable selection), and selecting the best model among several candidate models. The following sections provide more detail about this analysis process. Logistic Regression Logistic regression was used as a resource selection function to model the probability of bull trout redd occurrence as a function of select habitat variables. In general, logistic regression is a linear model that predicts the probability of an event occurring (e.g., redd occurrence) with a binary response variable (e.g., redd presence/absence) (Hosmer and Lemeshow 1989). Logistic regression is a popular analysis approach in habitat selection studies (Johnson et al. 2006) and is often used to predict the occurrence of stream fishes as a function of various biotic and abiotic factors (e.g., Dunham et al. 2003; Rich et al. 2003; Al-Chokhachy and Budy 2007; Isaak et al. 2007; Muhlfeld et al. 2009). The following is the logistic regression equation used to model the probability of redd occurrence: eg(x) θ = 1 + e g(x) 11
17 Where θ is the probability of redd presence, e is the base of natural logarithms, and g(x) is a linear model of the explanatory variables (i.e., β0 + β1x1 + β2x2 + + βixi). Summarizing Field Data In-stream habitat survey data were first summarized at the habitat unit scale. Mean and coefficient of variation (CV; a measure of habitat diversity) values were calculated for depth, width, and width-to-depth ratio (W/D). Mean depth was calculated by summing all measurements, including 0.00 m depths at each stream margin, and dividing by the total number of measurements. Mean width was calculated by summing all transect measurements and dividing by the total number of transects. Mean W/D was calculated by summing the W/D values for each transect (the transect width measurement divided by the mean depth of the transect) and dividing by the number of transects. Coefficient of variation for each of these variables was calculated by dividing the standard deviation by the mean and multiplying by 100, thus it is represented as a percentage. Maximum depth was collected as a single measurement in the field and that value was used as the summary value. Cover, PSP, LWD, and the number of pools were summed. Habitat area was calculated by multiplying mean width by unit length. Dominant and subdominant substrate data were converted to areas (m 2 ) of each substrate type (fines, gravel, cobble, boulder, and bedrock). This was done by multiplying the proportion of each substrate type by the habitat area. After summarizing the habitat data at the habitat unit scale, the data were summarized at 100 m reaches using an R script developed for binning longitudinal stream survey data (Welty et al. 2015). To achieve this, the script aggregated the habitat data based on location using the lengths of the habitat units as weighting factors. For each 100 m reach, the script calculated mean values for depth, width, W/D and the CVs for these variables; calculated summed values for cover, PSP, LWD, the number of pools, the area of each substrate type, the area of each habitat unit type (pools and riffles); and identified maximum depth. By using this approach, the more detailed information collected at the habitat unit scale was preserved while creating equally-sized analysis units. Expanding the spatial extent of the analysis unit also helped reduce inaccurate links (due to GPS inaccuracies) between redd and habitat locations. 12
18 A geographical information system was used to include an additional habitat variable, complex channel, for each 100 m reach and to link reaches with redd locations. Complex channels were populated into the data matrix as a binary dummy variable (i.e., 1 or 0) where the reach was given a value of 1 if more than one channel with flowing water existed in the reach or a value of 0 if only one channel was present. This was achieved by identifying reaches where side or braided channels were present. A reach was classified as occupied, if at least one redd was present within the reach, or unoccupied, if 0 redds were present in the reach. Habitat Variable Selection A multistep process was used to select the habitat variables that would be included in the model. In the first step, individual variables were tested to determine whether they could predict redd occurrence better than a model with no variables. In other words, the variables were tested to determine whether they contained information about redd occurrence. This was done by comparing single variable models to the intercept-only model using Akaike s information criterion corrected for small sample sizes (AICc; Burnham and Anderson 2002). Smaller AICc scores indicate models that contain more information. Variables that contained less information (had a larger AICc score) than a model with no variables were removed from the variable list. For the continuous variables (all variables except complex channel), this step was performed for both raw and log-transformed (loge (x+1)) variables (two structural forms). In the second step of variable selection, the two structure forms of each variable were compared using AICc. General guidelines for using AICc state that models within 2 points of each other contain similar amounts of information. Therefore, if the AICc score for one form of the variable was 2 points greater than the other form of the variable it was removed from the variable list. In cases where the difference in AICc score between two variable forms was less than or equal to 2, the raw form was retained. In the final step of variable selection, correlations among variables were tested using Spearman s rank correlation coefficient (r) because habitat variables often covary and highly correlated variables in a model can lead to unreliable results (Hosmer and Lemeshow 1989). Variable pairs with r > 0.65 were considered highly correlated and the variable of the offending pair that had a higher AICc score was removed. 13
19 The variables that remained after this selection process were retained for the model selection process. Model Selection The first step in the model selection process was to test model assumptions. The assumptions were tested with the global model, or the model that related redd occurrence to all variables retained through the variable selection process. Model goodness-of fit was tested with the Hosmer-Lemeshow test (Hosmer and Lemeshow 1989). This test evaluated whether the logistic model was a good model to use with the given data. Spatial autocorrelation, or a systematic pattern in the spatial distribution of a variable, was evaluated with Mantel s test. Spatial autocorrelation violates the assumption of independent observations for parametric analyses (Legendre 1993). If the global model met these assumptions (P > 0.05), then all possible subsets of the global model were evaluated to identify the best models predicting redd occurrence. Information theory was used to identify the best approximating models among all possible model subsets (i.e., 2 p models where p is the number of variables in the model). All possible model subsets were generated with the R package glmulti (Calcagno 2013) and ranked using AICc. The difference between the AICc of a candidate model and the one with the lowest AICc (Δ AICc) was used to identify models that had strong support for being the best approximating model (Δ AICc 2) (Burnham and Anderson 2002). Once the best models were identified, measures appropriate for logistic regression models were used to evaluate model accuracy and predictive power. Model accuracy was evaluated using the area under the curve (AUC) of the receiver-operator characteristic plots. In general, AUC values of indicate low accuracy, values of indicate medium accuracy, and values of > 0.9 indicate high accuracy (Manel et al. 2001). Predictive power was evaluated using max-rescaled R 2 values, a measure that ranges between 0 and 1 with larger values indicating stronger predictive power (Chen et al. 2008). Odds ratios were used to determine the influence of each variable on redd occurrence. The odds ratio is the change in the odds of redd occurrence with a one unit increase in the variable and was calculated by raising e to the parameter estimate of the variable (i.e., e β ). The 14
20 95% confidence interval of the odds ratio was calculated as e β±se(β)*1.96. In cases where one unit increase did not make sense ecologically, scaling factors were included in the odds ratio calculation to provide more meaningful results. If the scaling factor is defined as c, then the scaled odds ratio is e c*β and the scaled 95% confidence interval is e c* β± c*se(β)*1.96. Electivity Index An electivity index (Baltz 1990) was used to evaluate habitat selection or avoidance by female bull trout. The analysis was limited to selection or avoidance of side and braided channel habitats combined. The following equation was used to calculate the electivity index (D): D = (r p) / (r +p) - 2rp where r is the proportion of redds that occurred in side or braided channels and p is the proportion of side and braided channel habitat available to female bull trout. Values of D range from to 1.00 where values from to indicate strong avoidance, values from to indicate moderate avoidance, values from to 0.25 indicate neutral selection, values from 0.26 to 0.49 indicate moderate selection, and values from 0.50 to 1.00 indicate strong selection (Matthews 1996). Redd Microhabitat Characteristics Redd microhabitat characteristics were summarized by measures of central tendency and variability (e.g., mean and standard deviation). Relative redd location across the stream channel was converted to an index, termed Cross-Channel Location Index, before summarizing the data. Cross-Channel Location Index was calculated by dividing the distance from the center of the redd to the stream margin by the wetted width. Cross-Channel Location Index values range from 0.00 to 0.50 with 0.00 being the stream margin and 0.50 being the center of the channel. 15
21 RESULTS Model Results Habitat and redd survey data collected in Pine Creek and P8 were used to generate the redd occupancy model. Rush Creek data were excluded from the occupancy model because only one possible redd was observed when it is likely several redds were present. Data from Pine Creek and P8 were summarized into a total of 163, 100-m reaches; 123 reaches in Pine Creek and 40 reaches in P8 (Appendix B-1 and B-2). Reaches that had more than one channel with flowing water (complex channels) made up 33.3% and 32.5% of the reaches in Pine Creek and P8, respectively. The redd surveys documented a patchy distribution of 66 redds, 20 in Pine Creek and 46 in P8 (Figure 3). Of the total observed, 59 were classified as definite and 7 were classified as possible. Both definite and possible redds were used to identify occupied reaches. Although the data are not presented here, redd life information (the length of time a redd remained visible) was collected during the redd surveys and all possible redds became nonvisible at some point during the survey timeframe. This information suggests that the features identified as possible redds were not persistent features created by stream hydraulic forces. Furthermore, only 2 of the 7 possible redds were in reaches without definite redds. Therefore, the inclusion of these redds likely did not affect model results. Of the 163 reaches, 17.8% or 29 reaches (14 reaches in Pine Creek and 15 reaches in P8) were occupied by at least one redd. A single redd survey was conducted above the P8 passage barrier, outside the spatial extent of the occupancy model, on October 13, 2014 to determine whether bull trout negotiated the passage barrier and spawned. No bull trout or redds were observed. A total of 9 habitat variables were retained through the variable selection process. The retained variables included the only categorical variable (i.e., Complex Channel) and 8 of the possible 18 continuous variables. Table 3 (Complex Channel) and Table 4 (continuous variables) compare the variables between reaches with and without redds. Three of the continuous variables that were retained were of the log-transformed structural form (Pool (m 2 ), Fines (m 2 ), and 16
 and the residuals of the model lacked spatial autocorrelation (Mantel s test, P = 0.996). Figure 3.")
22 Bedrock (m 2 )). The global model relating redd occurrence to these 9 variables adequately fit the data (Hosmer-Lemeshow, P = 0.50) and the residuals of the model lacked spatial autocorrelation (Mantel s test, P = 0.996). Figure 3. Locations of bull trout redds observed in the Pine Creek basin, WA in 2014 and the location of 100 m reaches by level of bull trout redd occurrence. Table 3. Counts of redd occupancy in 100 m reaches with complex and simple channels. Numbers in parentheses are expected counts for each cell. Redd Present Redd Absent Total Complex Channel 17 (9.6) 37 (44.4) 54 Simple Channel 12 (19.4) 97 (89.6)
23 Total Table 4. Descriptive statistics of 100 m reaches by level of bull trout redd occurrence in Pine Creek and P8 combined. Variables that were retained through the variable selection process to model bull trout redd occurrence are in bold type. Statistics for each variable are derived from non-transformed values. Redd Present ( n = 29) Redd Absent ( n = 134) Variable Mean SD Median Min Max Mean SD Median Min Max Depth (m) Width (m) W/D CV depth (%) CV width (%) CV W/D (%) Max Depth (m) Cover (m 2 ) PSP (m 2 ) LWD (no./100m) Pools (no./100m) Pool (m 2 ) Riffle (m 2 ) Fines (m 2 ) Gravel (m 2 ) Cobble (m 2 ) Boulder (m 2 ) Bedrock (m 2 ) Note: PSP is potential spawning patches; LWD is large woody debris; CV is coefficient of variation; W/D is widthto-depth ratio; SD is standard deviation; min is minimum; and max is maximum. A total of 512 models were generated that included unique combinations of the 9 retained habitat variables. Of all the possible model subsets, 11 had strong support for being the best approximating model (ΔAICc 2; Table 5). The variables Complex Channel and Depth were present in all top models. Various combinations of CV Width (%), Fines (m 2 ), Boulder (m 2 ), LWD (no./100 m), Width (m), and PSP (m 2 ) appeared with Complex Channel and Depth in 10 of the models. Pool (m 2 ) was not included in any of the top models. This information suggests Complex Channel and Depth contained the most information about redd occupancy with minor contributions from the other variables. Indeed, Complex Channel and Depth were the only 18
24 significant variables (P < 0.05) in all of the top models and the global model (Appendix C). Model accuracy and predictive performance were similar among all the top models. AUC values ranged from 0.76 to 0.78 indicating the models had medium accuracy, and max-rescaled R 2 values ranged from 0.23 to 0.25 indicating moderate predictive performance. Table 5. The best supported models out of all possible model subsets predicting bull trout redd occurrence as a function of select habitat variables in the upper Lewis River basin, WA. Log-transformed (log e(x+1)) values of Pool (m 2 ), Fines (m 2 ), and Boulder (m 2 ) were used in the models. Model Variables K AIC c ΔAIC c AUC maxrescaled R 2 Complex Channel, Depth Complex Channel, Depth, CV Width Complex Channel, Depth, Fines Complex Channel, Depth, Boulder Complex Channel, Depth, Boulder, CV Width Complex Channel, Depth, LWD Complex Channel, Depth, LWD, CV Width Complex Channel, Depth, Width, CV Width Complex Channel, Depth, Width Complex Channel, Depth, Fines, CV Width Complex Channel, Depth, PSP Complex Channel, Depth, Width, Boulder, Fines, PSP, LWD, CV Width, Pool a NONE b Note: K, the number of estimated parameters including the intercept; AIC c, Akaike s information criterion corrected for small sample sizes; ΔAIC c, AIC c difference between model i and the model with the lowest AIC c score; AUC, area under the curve of the receiver-operator characteristic plot; CV, coefficient of variation; LWD, large woody debris; PSP, potential spawning patches. a Global model, shown for comparison. b Null model, shown for comparison. Parameter estimates and odds ratios for the two most important variables, Complex Channel and Depth, were very similar among all the best supported models (ΔAICc 2) and the global model (see Appendix C for global model results), therefore inferences about the relationship between these variables and redd occurrence are the same no matter which model is used. For simplicity, the parameter estimates and odds ratios for the model with the lowest AICc 19
25 score are used to understand the relationship between these variables and redd occurrence (Table 6). Table 6. Parameter estimates and odds ratios for the bull trout redd occupancy model with the lowest AICc score. Variable Parameter Estimate Standard Error Scaling factor Scaled odds ratio 95% CI for scaled odds ratio P-value Intercept Complex Channel Depth (m) < The model suggests bull trout redd occurrence was positively associated with the presence of complex channels and negatively associated with stream depth (Table 6). The odds of a bull trout redd occurring in a reach were four times greater if more than one channel (e.g., one main and one side channel) was present in the reach (odds ratio = 3.96). At minimum, indicated by the lower bound of the 95% confidence interval, there was a 63% increase in the predicted odds of redd occurrence in the presence of complex channels (1.63/1). Figure 4 shows the locations of redd occurrence in relation to channel complexity across the study area. For stream depth, a scaling factor of 0.05 was used to compute the odds ratio. This converts the interpretation of the odds ratio from a 1 m unit to a 5 cm unit, a more meaningful unit of measure based of the difference in depth between reaches with and without redds (see Table 3). With a 5 cm increase in stream depth, the odds of a redd occurring in a reach decreased by more than two times (2.3 = 1/0.43). At minimum, indicated by the upper bound of the 95% confidence interval, the predicted odds of redd presence decreased by 1.6 times with a 5 cm increase in stream depth (1/0.69). This result is displayed graphically in Figure 5 by plotting a habitat preference index at various depth bins. The habitat preference index is the ratio of the proportion of habitat used to the proportion of habitat not used. For instance, 51.7% of reaches with redds (habitat used) had a mean depth between 15.1 cm and 20.0 cm while only 14.9% of reaches without redds (habitat not used) had a mean depth between 15.1 cm and 20.0 cm. At this depth range, the proportion of habitat used to the proportion of habitat not used was

26 (0.517/0.149). This ratio, and therefore habitat preference, decreased with increasing stream depth at the 100 m reach scale. Figure 4. A map showing 100 m reaches by levels of bull trout redd occurrence and channel complexity in the Pine Creek basin, WA. 21
27 Proportion of habitat used / proportion of habitat not used Depth (cm) Figure 5. Stream depth preference by spawning bull trout in the Pine Creek basin, WA. Depth is the mean depth of 100 m reaches. The preference index values (proportion of habitat used/proportion of habitat not used) are indicated for each stream depth bin. Electivity Index The combination of side and braided channel habitat is referred to as side channel habitat in the following statements. Bull trout disproportionately used side channel habitat compared to mainstem habitat to construct redds. While only 9.2% of the available habitat was side channel habitat (14,064 m 2 of 152,960 m 2 ), 24.2% of the redds (16 of 66 redds) were constructed in side channel habitat (Table 7). This information resulted in an electivity index of 0.405, indicating moderate selection for side channel habitat. Table 7. Habitat selection of side channel habitats by spawning bull trout as indicated by an electivity index (D) where r is the proportion of redds constructed in side channel habitat and p is the proportion of side channel habitat available to spawning bull trout. Stream D r p Pine Creek P Pooled Data
28 Redd Microhabitat Characteristics Table 8. Descriptive statistics of select microhabitat variables associated with bull trout redds. Microhabitat data were collected from 53 of the 66 observed redds. The data suggest bull trout tend to spawn closer to the margin than towards the center of the channel (Mean Cross- Channel Location Index = 0.20; Table 8). In addition to depth measurements collected at various redd features, measurements were taken from undisturbed areas adjacent to redds. These measurements can be used as estimates of stream depths used by spawning bull trout. Mean ± SD depth adjacent to the redd and away from the stream margin was 0.21 ± 0.08 m while the stream depth toward the margin was 0.16 ± 0.09 m. Cross- Channel Location Index Redd Pit Redd Pillow Depth (m) Redd Tailspill Channel Away From Margin Channel Toward Margin n Mean Standard Deviation Median Minimum Maximum Habitat Outside of Known Spawning Locations Habitat surveys outside of known spawning tributaries covered a total of 22.2 stream kilometers. The descriptive statistics of each stream are in Appendix B. In this section of the report the habitat is characterized in terms of the channel complexity and stream depth, the most important factors based on the model results. The figures below show the proportion of 100 m reaches with complex channels (Figure 6), suitable stream depths (Figure 7), and both complex channels and suitable stream depths (Figure 8). Rush Creek, P8, and Pine Creek are included in the graphs for comparison purposes as bull trout are known to spawn in these streams. Suitable stream depths are categorized into 5 cm bins to reflect the preference index bins displayed in Figure 5. 23
29 Proportion of 100 m reaches The streams with the highest proportion of reaches with both important variables (about 33% of the reaches per stream) are the streams where bull trout are known to spawn (Figure 8). Outside of known spawning streams, the streams with the highest proportion of reaches with both important variables are Muddy River (27%), Smith Creek (22%), Clearwater Creek (21%), Clear Creek (17%), and Cussed Hollow (17%). Based on the data collected in this study, bull trout have the highest preference for reach stream depths of cm. Excluding the known spawning tributaries, the streams with the highest proportion of reaches with complex channels and the most preferred stream depth (15 20 cm) are Drift Creek and Smith Creek, both with 13% of the reaches. Reaches with both complex channels and suitable stream depths are not present in Big, Chickoon, and Spencer creeks. The spatial distribution of reaches with both important variables is displayed in Figure 9. The map shows a patchy network of potentially suitable spawning habitat throughout the study area. For example, although Clearwater Creek has one of the highest proportions of reaches with both complex channels and suitable depths, it has long stretches of habitat lacking these attributes Figure 6. Proportion of 100 m reaches with a complex channel by stream in the upper Lewis River basin, WA. Bull trout are known to spawn in Rush Creek, P8, and Pine Creek. 24
30 Proportion of 100 m reaches Proportion of 100 m reaches Reach Mean Depth cm cm cm cm 0.00 Figure 7. Proportion of 100 m reaches with suitable stream reach depth for spawning bull trout by stream in the upper Lewis River basin, WA. The most preferred depth is cm. Habitat preference decreases with increasing depth. Bull trout are known to spawn in Rush Creek, P8, and Pine Creek Reach Mean Depth cm cm cm cm 0.00 Figure 8. Proportion of 100 m reaches with both a complex channel and a suitable stream reach depth for spawning bull trout by stream in the upper Lewis River basin, WA. The most preferred depth is cm. Habitat preference decreases with increasing depth. Bull trout are known to spawn in Rush Creek, P8, and Pine Creek. 25

31 Figure 9. Location of 100 m reaches with both a complex channel and a suitable stream depth for spawning bull trout in the upper Lewis River basin, WA. The most preferred depth is cm. Habitat preference decreases with increasing depth 26
32 DISCUSSION AND RECOMMENDATIONS Stream temperature is the most important component of suitable spawning and rearing habitat for bull trout (Dunham et al. 2003; Isaak et al. 2010) as this species is one of the most cold water-adapted salmonid species in North America (Selong et al. 2001). Indeed, the current distribution of spawning in the Lewis River basin above Swift Reservoir is restricted to the coldest available habitat (see Figure 2 and Appendix A). The data used to model bull trout redd occurrence was collected within these cold-water habitats, so the results tell us what habitat characteristics are important in addition to cold water, or what habitat characteristics are important within cold-water habitats. We incorporated temperature when considering potential restoration sites (habitat outside of known spawning tributaries) by limiting potential restoration reaches to those that had 25% probability of juvenile bull trout occurrence based on maximum daily temperature (maximum daily temperature 17.5 C). Again, we assume the presence of juvenile bull trout is indicative of suitable spawning and early rearing habitat. This liberal thermal suitability threshold resulted in ~ 22 km of habitat available for potential restoration actions. However, if we use a more conservative threshold and limit the study area to habitat that has 50% probability of occurrence (maximum daily temperature 15.0 C), the length of stream available for restoration actions is reduced to ~ 3 km. This habitat is in the Clearwater Creek basin and includes Bean Creek and the upper 2 km of Clearwater Creek below the passage barrier. This information suggests thermal suitability may be limited in the basin and the thermal environment must be considered when selecting potential restoration sites. Within cold-water habitats of the upper Lewis Basin, bull trout redds were associated with complex channels and stream depths between 15 and 35 cm, and redds were generally constructed closer to the stream margin than the middle of the channel. Multiple lines of evidence suggest stream channel complexity is an important factor influencing the presence of bull trout redds in cold-water habitats of the upper Lewis River basin. Both the model results and electivity index indicate bull trout are more likely to build redds in reaches with multiple channels. This result is consistent with a habitat selection study on the east side of the Washington Cascades where spawning bull trout were also shown to select side channel habitats (Wissmar and Craig 2004). This result is also consistent with the general understanding that 27
33 habitat complexity is considered an important attribute of quality bull trout habitat (Al- Chokhachy et al. 2010). As for depth, mean depth at the reach scale of the reaches with redds was similar to microhabitat depths of individual redds. The observed redd depths in this study are within the range of redd depths observed for other populations of bull trout (see Baxter and McPhail 1996 for a review; Lamperth 2012). Redds were observed closer to the stream margin than the center of the channel, similar to other Washington populations (Shellberg et al. 2010) Proximity to existing populations is an additional factor that should be considered when selecting potential restoration sites. Any restored habitat in unoccupied areas of the basin will be used by colonizing bull trout or when a stochastic event occurs in current spawning tributaries (i.e., Pine or Rush basin) forcing adults to spawn elsewhere. In either event, the closer the restoration site is to existing spawning tributaries the more likely the restored habitat will be used. Based on the results of this study, habitat restoration actions should be designed to increase habitat complexity and create stream depths between 15 and 35 cm during the spawning time frame in the coldest accessible stream reaches within the basin. If possible, actions also should consider reducing stream temperature adjacent to the coldest accessible habitat in order to increase the connectivity and spatial extent of cold water areas. Although the measures of gravel in this study (area of gravel and PSPs) did not come out as important variables, it is widely known and accepted that gravel-sized particles are an important component of suitable spawning habitat (Bjornn and Reiser 1991; Kondolf and Wolman 1993). Hence, it is also recommended that habitat actions be designed to promote gravel deposition and accumulation near stream margins of the project areas. HABITAT RESTORATION CONCEPTUAL SCOPING DESIGNS The primary objective of this project is to develop a list of habitat restoration recommendations that will increase the stability and viability of the Lewis River bull trout population. The ultimate goal of this project is to develop concept scoping designs for habitat restoration projects in areas outside of existing spawning and rearing locations to expand the range of available bull trout spawning and rearing habitat. Conceptual scoping designs identify 28
34 habitat conditions to be targeted, but do not identify specific actions to address these habitat conditions. Subsequent project proposals will describe how the projects will benefit the habitat conditions in that specific location. The key findings and recommendations of the project study were used to develop a habitat suitability matrix (Table 9) which in turn was used to guide the selection of potential restoration streams and to develop conceptual scoping designs of habitat restoration projects, the ultimate goal of this project. The habitat suitability matrix was developed by MSHI, WDFW, CIT, and USFS personnel and incorporates stream temperature, stream depth, channel complexity (as defined in the project study), and distance to a known population. Table 9. Habitat attributes of streams considered for habitat restoration scoping designs. Stream Temperature ( C) 1 Proximity to Pine (km) Proximity to Rush (km) Channel Complexity (proportions of 100 reaches) Depth at (cm) (proportions of 100 reaches) Depth at cm (proportion of 100 reaches) Proportions of reaches with both important values (Complex channels and depth cm) Clearwater % 10% 35% 15% Clear % 50% 42% 17% Rush Side Channels % 33% 0% 0% Drift % 43% 30% 13% Muddy % 0% 38% 15% Little ND ND ND ND 1 Range of maximum daily temperature within the survey reach. A single value indicates that either there is not enough information to determine the temperature range (Muddy) or there is minimal temperature variation within the survey reach (Little Creek). Each stream was examined for temperature, proximity to thermally suitable temperatures and the potential to enhance existing habitat or improve reaches without complex channels and suitable depths. Project partners conducted site reconnaissance to verify conditions and develop scoping designs for the selected streams. Potential stream restoration activities are prioritized below. Little Creek Little Creek was not identified in the original study because of active restoration activities; however, it was considered for habitat restoration actions because 1) stream 29
35 temperature in Little Creek is colder than all reaches outside of existing spawning reaches evaluated for this project and is very similar to Rush and Pine basins and 2) Little Creek is in close proximity (within 1.0 km) to the Rush Creek population increasing the likelihood of a bull trout using this habitat. The work that the Forest Service completed in Little Creek appears to have improved habitat conditions throughout the lower gradient reaches of the stream. The short, high gradient reach above an old temporary road crossing may provide spotty bull trout spawning habitat, but additional work seems unlikely to provide benefits commensurate with the cost involved. For the time being, Little Creek habitat appears functional. One option discussed is to install a PIT tag array at the mouth of Little Creek to determine bull trout usage (PacifiCorps PIT-tags adult bull trout for population monitoring purposes). If bull trout use Little Creek, the project partners propose to re-evaluate existing habitat characteristics to identify restoration proposals to enhance or create suitable habitat. Rush Creek Side Channels Rush Creek Side Channels were selected as a potential restoration site as they 1) are in close proximity to Rush Creek proper where spawning and early rearing currently occurs and 2) share a similar thermal regime as Rush creek and thus are thermally suitable ( 12 C). Additionally, the habitat consists of complex channels, suitable spawning substrate, and 33% of reaches have an ideal depth (15-20 cm). Rush Creek Side Channels are easily accessible thereby reducing restoration implementation costs. However, the 2015 flood event changed lower Rush Creek below the USFS 90 Road bridge and has reactivated numerous braided channels. The channels appear to be processing large volumes of coarse sediment and wood, and seem likely to adjust vertically and horizontally during modest flood events. Restoration actions are not recommended at this time due to the active and disruptive stream processes currently occurring; however, once the area stabilizes, habitat actions would likely benefit the bull trout population by providing additional spawning and early rearing habitat within the basin. Project partners agree that Rush Creek Side Channels should be monitored and restoration potential re-evaluated on a regular basis. 30
36 Drift Creek Drift Creek was considered for habitat actions because it is 1) in relatively close proximity to Pine Creek (9.3 km), 2) has a temperature range of C, and 3) has a high proportion of suitable stream depths (Figure 7). Restoration activities could include projects that improve channel complexity as this is a liming factor in the basin (Figure 6). Such actions include placement of large woody debris, increasing channel complexity, increasing spawning gravel and retaining wood transporting through the system before it s flushed into Swift Reservoir. An instream project focused on creating full length log jams would create deep pools with overhanging cover, narrower channels would likely benefit bull trout and other species. Full length log jams will increase stream bed load and help activate old side channels. Clear Creek Upper Clear Creek is thermally suitable ( C), has reaches with complex channels (17%) and appropriate depths (50% at cm) as indicated in Table 9. Clear Creek is in reasonable proximity to Pine Creek (14.8 km). Additionally, there are anecdotal and PIT tag data identifying occupancy by bull trout during the spawning time frame (September and October). Restoration efforts to improve habitat in the upper Clear would focus on decreasing depth and increasing complexity; however, projects in the upper Clear could require helicopter activities and could be costly. Therefore, project partners agree that Lower Clear Creek seems to have the best potential for improving foraging, migratory and overwintering habitat. Although foraging, migratory and overwintering habitat were not the focus of this study, project partners suggest improving connectivity to spawning and rearing habitat. An instream project focused on creating deep pools with overhanging cover, narrower channels, and more complex channel forms would likely benefit bull trout and other species. Clearwater Creek Clearwater Creek has some of the colder stream temperatures in the survey area but also is the furthest from existing populations (~ 20 km to Pine Creek). Restoration efforts could 31
37 include increasing the amount of habitat with ideal stream depths (15-20 cm) and increasing channel complexity. However, Clearwater Creek has challenging access issues which would make restoration activities reliant on helicopter and would significantly increase project costs. Additionally, there is little evidence of bull trout currently using Clearwater Creek thereby decreasing the potential benefit of restoration. More cost-effective projects could be designed in the lower end of the basin, specifically aimed to decrease stream temperature which would provide thermal connectivity to the suitable habitat in the upper basin (below the confluence with Bean Creek). Muddy River Muddy River has high but thermally suitable temperatures ( 17.5 C) and these thermally suitable temperatures are 15.3 km from Pine and 21.5 km from Rush Creek. Muddy River has 27% reaches with complex channels and no reaches with ideal spawning depth (15-20 cm). Restoration activities would focus on improving stream depths (to cm). However, Muddy River is an evolving river with an unstable floodplain and high sediment load. Therefore, restoration investments may be compromised by channel stabilization events since the 1980 eruption of the Mount St. Helens. 32
38 REFERENCES Al-Chokhachy, R. and P. Budy Summer microhabitat use of fluvial bull trout in Eastern Oregon streams. North American Journal of Fisheries Management 27: Al-Chokhachy, R., B. B. Roper, T. Bowerman, and P. Budy A review of bull trout habitat associations and exploratory analyses of patterns across the interior Columbia River basin. North American Journal of Fisheries Management 20: Armstrong J. D., P. S. Kemp, G. J. A. Kennedy, M. Ladle, and N. J. Milner Habitat requirements of Atlantic salmon and brown trout in rivers and streams. Fisheries Research 62: Baltz, D. M Autecology. In: C. B Shreck and P. B. Moyle (editors) Methods for Fish Biology. Bethesda, MD: American Fisheries Society, pp Barlaup, B. T., S. E. Gabrielsen, H. Skoglund, and T. Wiers Addition of spawning gravel - a means to restore spawning habitat of Atlantic salmon (Salmo salar L.), and anadromous and resident brown trout (Salmo trutta L.) in regulated rivers. River Research and Applications 24: Baxter, J. S., and J. D. McPhail Bull trout spawning and rearing habitat requirements: summary of the literature. Fisheries Technical Circular Number 98. Province of British Columbia Ministry of Environment, Lands and Parks, Fisheries Branch, Vancouver, British Columbia, Canada. Bisson, P. A., J. L. Nielsen, R. A. Palmason, and L. E. Grove A system of naming habitat types in small streams, with examples of habitat utilization by salmonids during low streamflow. Acquisition and utilization of aquatic habitat inventory information. Proceedings of a symposium held October, 1981, Portland, Oregon. (ed N. B. Armantrout), pp Western Division, American Fisheries Society, Bethesda, Maryland. Bjornn, T. and D. Reiser Habitat requirements of salmonids in streams. American Fisheries Society Special Publication 19:
39 Braun, D. C. and J. D. Reynolds Relationships between habitat characteristics and breeding population densities in sockeye salmon (Oncorhynchus nerka). Canadian Journal of Fisheries and Aquatic Sciences 68: Burnham, K. P. and D. R. Anderson Model selection and multimodel inference. Springer, New York, NY. Calcagno, V glmulti: Model selection and multimodel inference made easy. R package version Chen, C. Y., Yang, H. C., Chen, C. W., and Chen, T. H Diagnosing and revising logistic regression models: effect of internal solitary wave propagation. Engineering Computation 25: Cummins, K. W An evaluation of some techniques for the collection and analysis of benthic samples with special emphasis on lotic waters. American Midland Naturalist 67: Crisp, D. T Trout and salmon: ecology, conservation and rehabilitation. Oxford: Fishing. News Books, Blackwell Science. Dunham, J. B. and G. L. Chandler Models to predict suitable habitat for juvenile bull trout in Washington State. Final Report. U.S. Forest Service, Rocky Mountain Research Station, Boise, Idaho. 75 pp. Dunham, J. B., R. E. Rieman, and G. Chandler Influences of temperature and environmental variables on the distribution of bull trout within streams at the southern margin of its range. North American Journal of Fisheries Management 23: Hagen, J. and E. B. Taylor Resource partitioning as a factor limiting gene flow in hybridizing populations of Dolly Varden char (Salvelinus malma) and bull trout (Salvelinus confluentus). Canadian Journal of Fisheries and Aquatic Sciences 58: Hosmer, D. W. and S. Lemeshow Applied logistic regression. Wiley, New York. 34
40 Isaak, D. J. and W. A. Hubert A hypothesis about factors that affect maximum summer stream temperatures across montane landscapes. Journal of the American Water Resources Association 37: Isaak, D. J., R. F. Thurow, B. E. Rieman, and J. B. Dunham Chinook salmon use of spawning patches: relative roles of habitat quality, size, and connectivity. Ecological Applications 17: Isaak, D. J., C. H. Luce, B. E. Rieman, D. E. Nagel, E. E. Peterson, D. L. Horan, S. Parkes, and G. L. Chandler Effects of climate change and wildfire on stream temperatures and salmonid thermal habitat in a mountain river network. Ecological Applications 20: Johnson, C. J., S. E. Nielsen, E. H. Merrill, T. L McDonald, and M. S. Boyce Resource selection functions based on use-availability data: theoretical motivation and evaluation methods. Journal of Wildlife Management 70: Kitano, S., K. Maekawa, S. Nakano, and K. D. Fausch Spawning behavior of bull trout in the upper Flathead drainage, Montana, with special reference to hybridization with brook trout. Transactions of the American Fisheries Society 123: Kondolf, G. M., and M. G. Wolman The sizes of salmonid spawning gravels. Water Resources Research 29: Lamperth, J. S Using a spatially explicit approach to evaluate bull trout spawning habitat selection. Master s thesis. Central Washington University, Ellensburg. Legendre, P Spatial autocorrelation: trouble or new paradigm? Ecology, 74, McPhail, J. D., and J. S. Baxter Bull trout spawning and rearing habitat requirements: summary of the literature. University of British Columbia. Vancouver, BC. Fisheries Technical Circular No. 98, 27 pp. Manel, S., H. C. Williams, and S. J. Ormerod Evaluating presence-absence models in ecology: the need to account for prevalence. Journal of Applied Ecology 38:
41 Matthews, K. R Habitat selection and movement patterns of California golden trout in degraded and recovering stream section in Golden Trout Wilderness, California. North American Journal of Fisheries Management 16: Meridian Environmental, Inc Lake Merwin and Swift Reservoir tributary streams: bull trout limiting factors analysis. Final Report to PacifiCorp Energy. May 30, pp. + appendices. Muhlfeld, C. C., T. E. McMahon, M. C. Boyer, and R. E. Gresswell Local habitat, watershed, and biotic factors influencing the spread of hybridization between native westslope cutthroat trout and introduced rainbow trout. Transactions of the American Fisheries Society 138: Nika, N., T. Virbickas, and A. Kontautas Spawning site selection and redd gravel characteristics of sea trout Salmo trutta in the lowland streams of Lithuania. Oceanological and Hydrobiological Studies 40: Rich, C. F., T. E. McMahon, B. E. Rieman, and W. L Thompson Local-habitat, watershed, and biotic features associated with bull trout occurrence in Montana streams. Transactions of the American Fisheries Society 132: Selong, J. H., T. E. McMahon, A. V. Zale, and F. T. Barrows Effect of temperature on growth and survival of bull trout, with application of an improved method for determining thermal tolerance in fishes. Transactions of the American Fisheries Society 130: Senter, A. and G. B. Pasternack Large wood aids spawning Chinook salmon (Oncorhynchus tshawytscha) in marginal habitat on a regulated river in California. River Research and Applications 27: Shellberg, J. G., S. M. Bolton, and D. R. Montgomery Hydrogeomorphic effects on bedload scour in bull char (Salvelinus confluentus) spawning habitat, western Washington, USA. Canadian Journal of Fisheries and Aquatic Sciences 67:
42 Welty, E. Z., C. E. Torgersen, S. J. Brenkman, J. J. Duda, and J. B. Armstrong Multiscale analysis of river networks using the R Package linbin. North American Journal of Fisheries Management 35: , DOI: / Wissmar, R. C. and S. D. Craig Factors affecting habitat selection by a small spawning charr population, bull trout, Salvelinus confluentus: implications for recovery of an endangered species. Fisheries Management and Ecology 11:
43 38
44 APPENDIX A. Maximum daily temperature in the upper Lewis River basin, 2013 and
45 Appendix A. Maximum daily temperatures in the upper Lewis River basin, 2013 and Max Temp ( o C) Max Temp Date Year Stream Site Name Elevation (ft) Latitude Longitude Deployed Removed Near confluence with 2013 Clear Creek Muddy a /27/ /29/ /5/ Clear Creek Upper c /30/ /28/ /6/ Clearwater Creek Just above Muddy b /2/2013 8/1/ /2/ Clearwater Creek Lower c /8/ /31/ /20/ Clearwater Creek 8 miles above Muddy River a /3/ /31/ /24/ Clearwater Creek Above Barrier b /2/ /2/ /6/ Crab Creek Upper c /25/ /28/ /2/ Drift Creek Lower c /26/ /30/ /2/ Drift Creek Upper c /11/ /28/ /11/ Elk Creek Lower c /30/ /28/ /6/ Lewis River Above Curly Creek a /2/ /3/ /24/ Lewis River Below Cussed Hollow a /28/ /4/ /24/ Lewis River Above Chickoon b /2/ /19/ /24/ Little Creek Upper c /25/ /27/ see NOTE 2013 Muddy River Above Clear Creek a /3/ /3/ /2/ P-8 Lower c /24/ /29/ /2/ Pine Creek 0.5 mile above Lewis River a /27/ /3/ /2/ Pine Creek BLW P-8 Confluence c /11/ /29/ /24/ Pine Creek Upper c /24/ /2/ /2/ Rush Creek Side Channel c /12/ /27/ /24/ Rush Creek Nursery c /12/ /28/ /23/ Rush Creek Below 90 Rd Bridge c /27/ /29/ /1/2013
46 Year Stream Site Name Elevation (ft) Latitude Longitude Deployed Removed 41 Max Temp ( o C) Max Temp Date 2013 Rush Creek Upper c /3/ /27/ /28/ Spencer Creek Lower c /3/ /28/ /14/ Swift Creek Upper c /10/ /28/ /28/ Bean Creek Lower c /23/ /20/ /4/2014 Near confluence with 2014 Clear Creek Muddy a /25/ /27/ /4/ Clear Creek Upper c /16/ /3/ /16/ Clearwater Creek 8 miles above Muddy River a /23/ /20/ /16/ Clearwater Creek Above Barrier b /2/ /2/ /16/ Crab Creek Lower c /27/ /2/ /4/ Lewis River Above Curly Creek a /25/ /28/ /16/ Lewis River Below Cussed Hollow a /10/2014 9/25/ /16/ Lewis River Above Chickoon b /2/ /19/ /4/ Little Creek Lower c /1/ /3/ /15/ Little Creek Upper c /27/ /29/ see NOTE 2014 P-8 Lower c /12/ /2/ /16/ Pine Creek 0.5 mile above Lewis River a /25/ /27/ /16/ Pine Creek BLW P-8 Confluence c /12/ /2/ /16/ Pine Creek Upper c /10/ /30/ /22/ Rush Creek Side Channel c /1/ /3/ /16/ Rush Creek Below 90 Rd Bridge c /25/ /27/ /16/ Rush Creek Upper c /27/ /2/ /1/ Spencer Creek Lower c /27/ /29/ /4/ Swift Creek Upper c /10/ /30/ /27/2014 Note: Only two temperatures were recorded at the Little Creek Upper site, 4.9 o C and 5.0 o C.
47 a Annual monitoring site for the Mount Saint Helens Water Quality Monitoring Program b Annual monitoring site for the USFS Aquatic and Riparian Effectiveness Monitoring Program (AREMP) c Monitoring site specifically for this project 42
48 APPENDIX B. Descriptive Statistics of 100 m reaches by Stream 43
49 APPENDIX B-1. Descriptive statistics of 100 m reaches in Pine Creek. Variable n Mean SD Median Min Max Depth (m) Width (m) W/D CV depth (%) CV width (%) CV W/D (%) Max Depth Cover (m 2 ) PSP (m 2 ) LWD (no./100m) Pools (no./100m) Pool (m 2 ) Riffle (m 2 ) Fines (m 2 ) Gravel (m 2 ) Cobble (m 2 ) Boulder (m 2 ) Bedrock (m 2 )
50 APPENDIX B-2. Descriptive statistics of 100 m reaches in P8. Variable n Mean SD Median Min Max Depth (m) Width (m) W/D CV depth (%) CV width (%) CV W/D (%) Max Depth Cover (m 2 ) PSP (m 2 ) LWD (no./100m) Pools (no./100m) Pool (m 2 ) Riffle (m 2 ) Fines (m 2 ) Gravel (m 2 ) Cobble (m 2 ) Boulder (m 2 ) Bedrock (m 2 )
51 APPENDIX B-3. Descriptive statistics of 100 m reaches in Bean Creek. Variable n Mean SD Median Min Max Depth (m) Width (m) W/D CV depth (%) CV width (%) CV W/D (%) Max Depth Cover (m 2 ) PSP (m 2 ) LWD (no./100m) Pools (no./100m) Pool (m 2 ) Riffle (m 2 ) Fines (m 2 ) Gravel (m 2 ) Cobble (m 2 ) Boulder (m 2 ) Bedrock (m 2 )
52 APPENDIX B-4. Descriptive statistics of 100 m reaches in Big Creek. Variable n Mean SD Median Min Max Depth (m) Width (m) W/D CV depth (%) CV width (%) CV W/D (%) Max Depth Cover (m 2 ) PSP (m 2 ) LWD (no./100m) Pools (no./100m) Pool (m 2 ) Riffle (m 2 ) Fines (m 2 ) Gravel (m 2 ) Cobble (m 2 ) Boulder (m 2 ) Bedrock (m 2 )
53 APPENDIX B-5. Descriptive statistics of 100 m reaches in Chickoon Creek. Variable n Mean SD Median Min Max Depth (m) Width (m) W/D CV depth (%) CV width (%) CV W/D (%) Max Depth Cover (m 2 ) PSP (m 2 ) LWD (no./100m) Pools (no./100m) Pool (m 2 ) Riffle (m 2 ) Fines (m 2 ) Gravel (m 2 ) Cobble (m 2 ) Boulder (m 2 ) Bedrock (m 2 )
54 APPENDIX B-6. Descriptive statistics of 100 m reaches in Clear Creek. Variable n Mean SD Median Min Max Depth (m) Width (m) W/D CV depth (%) CV width (%) CV W/D (%) Max Depth Cover (m 2 ) PSP (m 2 ) LWD (no./100m) Pools (no./100m) Pool (m 2 ) Riffle (m 2 ) Fines (m 2 ) Gravel (m 2 ) Cobble (m 2 ) Boulder (m 2 ) Bedrock (m 2 )
55 APPENDIX B-7. Descriptive statistics of 100 m reaches in Clearwater Creek. Variable n Mean SD Median Min Max Depth (m) Width (m) W/D CV depth (%) CV width (%) CV W/D (%) Max Depth Cover (m 2 ) PSP (m 2 ) LWD (no./100m) Pools (no./100m) Pool (m 2 ) Riffle (m 2 ) Fines (m 2 ) Gravel (m 2 ) Cobble (m 2 ) Boulder (m 2 ) Bedrock (m 2 )
56 APPENDIX B-8. Descriptive statistics of 100 m reaches in Cussed Hollow. Variable n Mean SD Median Min Max Depth (m) Width (m) W/D CV depth (%) CV width (%) CV W/D (%) Max Depth Cover (m 2 ) PSP (m 2 ) LWD (no./100m) Pools (no./100m) Pool (m 2 ) Riffle (m 2 ) Fines (m 2 ) Gravel (m 2 ) Cobble (m 2 ) Boulder (m 2 ) Bedrock (m 2 )
57 APPENDIX B-9. Descriptive statistics of 100 m reaches in Drift Creek. Variable n Mean SD Median Min Max Depth (m) Width (m) W/D CV depth (%) CV width (%) CV W/D (%) Max Depth Cover (m 2 ) PSP (m 2 ) LWD (no./100m) Pools (no./100m) Pool (m 2 ) Riffle (m 2 ) Fines (m 2 ) Gravel (m 2 ) Cobble (m 2 ) Boulder (m 2 ) Bedrock (m 2 )
58 APPENDIX B-10. Descriptive statistics of 100 m reaches in Muddy River. Variable n Mean SD Median Min Max Depth (m) Width (m) W/D CV depth (%) CV width (%) CV W/D (%) Max Depth Cover (m 2 ) PSP (m 2 ) LWD (no./100m) Pools (no./100m) Pool (m 2 ) Riffle (m 2 ) Fines (m 2 ) Gravel (m 2 ) Cobble (m 2 ) Boulder (m 2 ) Bedrock (m 2 )
59 APPENDIX B-11. Descriptive statistics of 100 m reaches in Rush Creek. Variable n Mean SD Median Min Max Depth (m) Width (m) W/D CV depth (%) CV width (%) CV W/D (%) Max Depth Cover (m 2 ) PSP (m 2 ) LWD (no./100m) Pools (no./100m) Pool (m 2 ) Riffle (m 2 ) Fines (m 2 ) Gravel (m 2 ) Cobble (m 2 ) Boulder (m 2 ) Bedrock (m 2 )
60 APPENDIX B-12. Descriptive statistics of habitat units in the Rush Creek side channels. Data were not summarized at 100 m reaches for these waterways. Variable n Mean SD Median Min Max Length Depth (m) Width (m) W/D CV depth (%) CV width (%) CV W/D (%) Max Depth Cover (m 2 ) PSP (m 2 ) LWD (no./100m) Pools (no./100m) Pool (m 2 ) Riffle (m 2 ) Fines (m 2 ) Gravel (m 2 ) Cobble (m 2 ) Boulder (m 2 ) Bedrock (m 2 )
61 APPENDIX B-13. Descriptive statistics of 100 m reaches in Smith Creek. Variable n Mean SD Median Min Max Depth (m) Width (m) W/D CV depth (%) CV width (%) CV W/D (%) Max Depth Cover (m 2 ) PSP (m 2 ) LWD (no./100m) Pools (no./100m) Pool (m 2 ) Riffle (m 2 ) Fines (m 2 ) Gravel (m 2 ) Cobble (m 2 ) Boulder (m 2 ) Bedrock (m 2 )
62 APPENDIX B-14. Descriptive statistics of 100 m reaches in Spencer Creek. Variable n Mean SD Median Min Max Depth (m) Width (m) W/D CV depth (%) CV width (%) CV W/D (%) Max Depth Cover (m 2 ) PSP (m 2 ) LWD (no./100m) Pools (no./100m) Pool (m 2 ) Riffle (m 2 ) Fines (m 2 ) Gravel (m 2 ) Cobble (m 2 ) Boulder (m 2 ) Bedrock (m 2 )
63 APPENDIX C. Parameter estimates and scaled odds ratios for the global model relating bull trout redd occurrence to physical habitat variables 58
64 APPENDIX C. Parameter estimates and scaled odds ratios for the global model relating bull trout redd occurrence to physical habitat variables in the upper Lewis River basin, WA. Logtransformed (loge(x+1)) values of Boulder (m 2 ), Fines (m 2 ), and Pool (m 2 ) were used in the model. See text for details. Variable Parameter Estimate Standard Error Scaling factor Scaled odds ratio 95% CI for scaled odds ratio P-value Intercept Complex Channel Depth (m) CV Width (%) Width (m) Boulder (m 2 ) LWD (no./100m) PSP (m 2 ) Fines (m 2 ) Pool (m 2 )
65 APPENDIX D. Project Proposal for the Bull Trout Habitat Restoration Project Identification Assessment 60
66 PROPOSAL FORM - Lewis River Aquatic Fund Due to unforeseen impacts associated with the federal budget during the fall of 2013 the USFS and MSHI were unable to conduct field tasks expected to be accomplished during that timeframe. These complications impacted the entire timeline of the project; therefore, the project was granted a 1-year extension by the ACC. Project timelines have been adjusted and changes to task completion dates are included in this document (highlighted in yellow). 1. Project Title Bull Trout Habitat Restoration Project Identification Assessment 2. Project Manager Adam Haspiel USFS Abi Groskopf Mount S. Helens Institute (MSHI) 3. Identification of problem or opportunity to be addressed Bull trout adult abundance in the upper North Fork Lewis River Basin has been estimated annually since Based on annual abundance estimates of migratory adults the population has exhibited 3 distinct patterns of abundance; with lower abundance levels during and 2007-present being separated by a period when abundance increased to and decreased from a peak of 1,300 migratory adults. The US Fish and Wildlife Service identified a minimum population target of 900 individuals to maintain population viability and this target has been exceeded only four times since 1994 (19 years). Recent population estimates ( ) range from migratory adults, which is 20%-40% of the peak abundance observed in 2004 and 25%-56% of the minimum population target (see figure below). While numerous factors are likely affecting the overall abundance estimates, many interested parties (e.g., WDFW, USFS, LCFRB, CIT, and MSHI) believe that spawning and/or rearing habitat could be limiting thus inhibiting the recovery and long-term stability of the bull trout population. 61
67 As part of the Lewis River Hydroelectric Projects Settlement Agreement (Settlement Agreement), PacifiCorp provides a dedicated source of funding for bull trout habitat restoration projects. This funding is stewarded by the Aquatics Coordinating Committee (ACC), members of which have been reluctant to recommend projects for funding in recent years because project scoping and prioritization has been impossible with existing bull trout habitat knowledge. Despite past and ongoing studies regarding bull trout spawning and rearing in the upper Lewis Basin, habitat characteristics that will direct successful restoration projects for the local subpopulations remains largely unknown. This partner-driven project team proposes to fill the project scoping and prioritization void by initially using results of past or ongoing data collection efforts to characterize bull trout spawning and rearing habitat in Pine, P8, Rush, and Cougar Creeks. Subsequent portions of this project would conduct additional spawning and habitat surveys to collect habitat parameter data that would be used to site and scope specific restoration projects for future bull trout funding rounds (See Map Below for initial potential survey locations). The ultimate goal of this project is to develop concept scoping design of habitat restoration projects in areas outside of existing spawning and rearing locations to expand the range of available bull trout spawning and rearing habitat. The expected outcome of this project is improved long term stability of the bull trout population in the upper Lewis Basin. 62
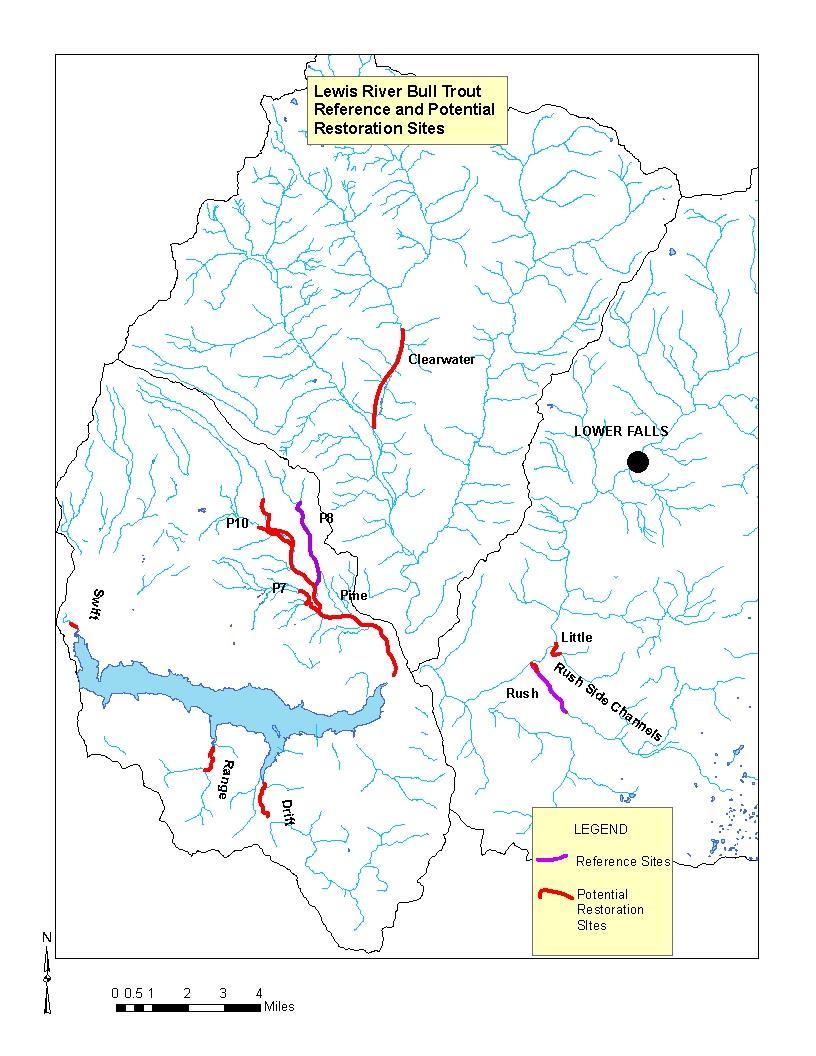
68 63
Lewis River Bull Trout Habitat Restoration Project Identification Assessment
 Lewis River Bull Trout Habitat Restoration Project Identification Assessment Jamie Lamperth 1, Bryce Michaelis 2, and Abi Groskopf 3 1 Washington Department of Fish and Wildlife, Fish Ecology and Life
Final Bull Trout Redd Monitoring Report for the Wallowa Falls Hydroelectric Project
 Final for the Wallowa Falls Hydroelectric Project East Fork Wallowa River barrier to upstream fish migration, photo courtesy of Kendrick Moholt (FERC No. P-308) December 18, 2017 Prepared by: Jeremiah
1. Project Title Bull Trout Habitat Restoration Project Identification Assessment. 3. Identification of problem or opportunity to be addressed
 PROPOSAL FORM - Lewis River Aquatic Fund 1. Project Title Bull Trout Habitat Restoration Project Identification Assessment 2. Project Manager Adam Haspiel USFS Abi Groskopf Mount S. Helens Institute (MSHI)
Confederated Tribes of the Warm Springs Reservation
 Confederated Tribes of the Warm Springs Reservation PACIFIC LAMPREY STUDIES Cyndi Baker Jen Graham Joel Santos Matt Fox Lamprey Program History 1997: Member of lamprey working group 2002: First lamprey
Chinook Salmon Spawning Study Russian River Fall 2005
 Chinook Salmon Spawning Study Russian River Fall 2005 Sonoma County Water Agency 2150 West College Avenue Santa Rosa, California 95401 Prepared by David Cook - Senior Environmental Specialist March 27,
Final Bull Trout Genetics Monitoring Plan for the Wallowa Falls Hydroelectric Project. (FERC No. P-308) June 2017
 June 2017") Final for the Wallowa Falls Hydroelectric Project (FERC No. P-308) June 2017 Prepared by: Jeremiah Doyle PacifiCorp 825 NE Multnomah Street Portland, OR 97232 June, 2017 Page 1 of 8 Table of Contents 1.0
Final for the Wallowa Falls Hydroelectric Project (FERC No. P-308) June 2017 Prepared by: Jeremiah Doyle PacifiCorp 825 NE Multnomah Street Portland, OR 97232 June, 2017 Page 1 of 8 Table of Contents 1.0
Klamath Lake Bull Trout
 Klamath Lake Bull Trout Existing Populations The Klamath Lake Bull Trout SMU is comprised of seven existing populations and four populations classified as extinct or functionally extinct (Table 189). Populations
Discussion on the Selection of the Recommended Fish Passage Design Discharge
 Discussion on the Selection of the Recommended Fish Passage Design Discharge Introduction The provision of fish passage is a requirement for most proposed culvert and bridge installations in Alberta, depending
Study No. 18. Mystic Lake, Montana. PPL Montana 45 Basin Creek Road Butte, Montana 59701
 Study No. 18 Evaluation of the Current Fish Population and Habitat in West Rosebud Creek Downstream from Emerald Lake Mystic Lake Hydroelectric Project FERC No. 2301 Mystic Lake, Montana PPL Montana 45
Lake Merwin and Swift Creek Reservoir Tributaries. Bull Trout Limiting Factors Analysis
 Lake Merwin and Swift Creek Reservoir Tributaries Bull Trout Limiting Factors Analysis Study Objectives Answer Key? s Do other tributaries to Swift Creek Reservoir and Lake Merwin not known to support
Study Update Tailrace Slough Use by Anadromous Salmonids
 Study Update Tailrace Slough Use by Anadromous Salmonids Goals and Objectives Identify what anadromous salmonids use the tailrace slough by: Life Stage (Juvenile, migrating and spawning adults) Timing
PRE- PROPOSAL FORM - 1. Applicant organization. USDA Forest Service Gifford Pinchot National Forest & WDFW Region 5
 PRE- PROPOSAL FORM - 1. Applicant organization. USDA Forest Service Gifford Pinchot National Forest & WDFW Region 5 2. Organization purpose USFS-Resource management agency WDFW-Fish and Wildlife management
STEELHEAD SURVEYS IN OMAK CREEK
 STEELHEAD SURVEYS IN OMAK CREEK 2002 Annual Report Prepared by Chris Fisher John Arterburn Colville Confederated Tribes Fish and Wildlife Department P.O. Box 150 Nespelem, WA 99155 Prepared for Project
1.What is a bull trout? 2.What is a metapopulation? 3.How do they go together?
 1.What is a bull trout? 2.What is a metapopulation? 3.How do they go together? Bull Trout ESA Background October 1992 - Petitioned June 1998 Klam/Col = Threatened November 1999 Rangewide Listing October
3. The qualification raised by the ISRP is addressed in #2 above and in the work area submittal and review by the ISRP as addressed in #1.
 Please find attached a response from The Confederated Tribes of the Warm Springs Reservation of Oregon (CTWSRO) for Project # 2008-301-00, Habitat Restoration Planning, Design and Implementation within
Catlow Valley Redband Trout
 Catlow Valley Redband Trout Existing Populations The Catlow Valley Redband Trout SMU is comprised of five populations (Table 1). Three exist in Home, Threemile, and Skull creeks, located on the east side
Data Report : Russian River Basin Steelhead and Coho Salmon Monitoring Program Pilot Study
 Data Report 1999-1: Russian River Basin Steelhead and Coho Salmon Monitoring Program Pilot Study Sonoma County Water Agency 215 West College Avenue Santa Rosa, California 951 Prepared by David Cook Senior
Warner Lakes Redband Trout
 Warner Lakes Redband Trout Existing Populations Warner Valley is an endorheic basin that contains a complex series of interconnected lakes, marshes, sloughs, and potholes, all of which are remnants of
ASSESSMENT OF THE STATUS OF NESTUCCA RIVER WINTER STEELHEAD
 ASSESSMENT OF THE STATUS OF NESTUCCA RIVER WINTER STEELHEAD Gary Susac and Steve Jacobs Coastal Salmonid Inventory Project Oregon Department of Fish and Wildlife August 21, 2001 INTRODUCTION This report
STUDY PERFORMANCE REPORT
 STUDY PERFORMANCE REPORT State: Michigan Project No.: F-80-R-4 Study No.: 702 Title: Effects of sediment traps on Michigan river channels Period Covered: October 1, 2002 to September 30, 2003 Study Objectives:
SUMMARY OF MOVEMENT AND HABITAT USED BY TAGGED BROOK TROUT IN THE MAIN BRANCH AND NORTH BRANCH AU SABLE RIVER DURING SUMMER Data Submitted to:
 SUMMARY OF MOVEMENT AND HABITAT USED BY TAGGED BROOK TROUT IN THE MAIN BRANCH AND NORTH BRANCH AU SABLE RIVER DURING SUMMER 2014 Data Submitted to: Anglers of the Au Sable Submitted by: Dr. Mark R. Luttenton
PRE- PROPOSAL FORM - Lewis River Aquatic Fund
 PRE- PROPOSAL FORM - Lewis River Aquatic Fund 1. Applicant organization. USDA Forest Service Gifford Pinchot National Forest 2. Organization purpose Resource management agency 3. Project manager (name,
Packwood Lake Intake Screen Velocity Test Report for Energy Northwest's Packwood Lake Hydroelectric Project FERC No Lewis County, Washington
 for Energy Northwest's Packwood Lake Hydroelectric Project FERC No. 2244 Lewis County, Washington Submitted to P.O. Box 968 Richland, Washington 99352-0968 Submitted by EES Consulting 1155 North State
Winter Steelhead Redd to Fish conversions, Spawning Ground Survey Data
 Winter Steelhead Redd to Fish conversions, Spawning Ground Survey Data Oregon Department of Fish and Wildlife (ODFW); Corvallis Research Office Oregon Adult Salmonid Inventory and Sampling Project (June
Abundance of Steelhead and Coho Salmon in the Lagunitas Creek Drainage, Marin County, California
 scanned for KRIS Abundance of Steelhead and Coho Salmon in the Lagunitas Creek Drainage, Marin County, California Prepared for: Marin Municipal Water District 220 Nellen Drive Corte Madera, California
THE CONFEDERATED TRIBES OF THE WARM SPRINGS RESERVATION OF OREGON
 THE CONFEDERATED TRIBES OF THE WARM SPRINGS RESERVATION OF OREGON To: Branch of Natural Resources P.0. Box C, Warm Springs, Oregon 97761 Phone (541) 553-2002/2003 Fax (541) 553-1994 The Independent Science
TABLE 1. Riverscape surveys completed in the upper Chehalis River, Newaukum, and Satsop rivers.
 RIVERSCAPE SURVEYS OF IN-STREAM FISH ASSEMBLAGES AND HABITAT IN THE CHEHALIS RIVER Mara Zimmerman and John Winkowski Washington Department of Fish and Wildlife, Fish Program EXECUTIVE SUMMARY Introduction
Fish Habitat Restoration and Monitoring in Southeast Washington. Andy Hill Eco Logical Research, Inc.
 Fish Habitat Restoration and Monitoring in Southeast Washington Andy Hill Eco Logical Research, Inc. Fish Habitat Restoration and Monitoring in Southeast Washington Talk overview: Restoration projects
Big Spring Creek Habitat Enhancement and Fishery Management Plans
 Big Spring Creek Habitat Enhancement and Fishery Management Plans November 5, 2012 Big Spring Events and Activities Center Newville, PA Charlie McGarrell Regional Habitat Biologist Pennsylvania Fish and
Legendre et al Appendices and Supplements, p. 1
 Legendre et al. 2010 Appendices and Supplements, p. 1 Appendices and Supplement to: Legendre, P., M. De Cáceres, and D. Borcard. 2010. Community surveys through space and time: testing the space-time interaction
THE OREGON PLAN for. Salmon and Watersheds. Smith River Steelhead and Coho Monitoring Verification Study, Report Number: OPSW-ODFW
 THE OREGON PLAN for Salmon and Watersheds Smith River Steelhead and Coho Monitoring Verification Study, 2007 Report Number: OPSW-ODFW-2009-11 The Oregon Department of Fish and Wildlife prohibits discrimination
APPENDIX B. Final reports on chinook salmon spawning surveys - Sultan River, Washington Report
 APPENDX B Final reports on chinook salmon spawning surveys - Sultan River, Washington B-1. B-2. 1987 Report. 1988 Report APPENDX B-l Final report on 1987 chinook spawning survey - Sultan River, Snohomish
ELECTRO-FISHING REPORT 2016 UPPER TWEED
 ELECTRO-FISHING REPORT 2016 UPPER TWEED The electro-fishing programme carried out each summer by The Tweed Foundation is part of our management plan, which details the information that is required to manage
Sub-watershed Summaries
 Project Description The Salmon Drift Creek Watershed Council (SDCWC) has focused their efforts in the Salmon River estuary for the past few years. The multifaceted partnership effort is nearing completion
Deschutes Bull Trout
 Deschutes Bull Trout Existing Populations The Deschutes Bull Trout SMU is comprised of eight populations, three of which are classified as extinct (Table 1). Populations are identified according to those
Minnesota Department of Natural Resources Division of Fish and Wildlife Section of Fisheries. Stream Survey Report. Luxemburg Creek.
 Minnesota F-29-R(P)-24 Area 315 Study 3 March 2016 Minnesota Department of Natural Resources Division of Fish and Wildlife Section of Fisheries Stream Survey Report Luxemburg Creek 2015 Mark Pelham Sauk
Packwood Hydroelectric Project Barrier Analysis December 12, 2006
 Packwood Hydroelectric Project Barrier Analysis December 12, 2006 Study Area Natural barriers to upstream fish passage on Lake Creek at RM 1.03 and RM 1.95 Snyder Creek culvert under the Project tailrace
Journal of Freshwater Ecology. Volume 5
 Redd Site Selection by Brown Trout in Douglas Creek, Wyoming Richard T. Grost - Thomas A. Wesche Journal Article Wayne A. Hubert 99 WWRC-9-22 In Journal of Freshwater Ecology Volume 5 Richard T. Grost
Stream temperature records
 Stream temperature records 1 2 Appendix A. Temporal sequence of stream temperature records from the Boise River basin used to parameterize temperature models (n = 78). 2 16 12 8 4 3 4 1993 1994 1995 1996
Tributary Assessment for Potential Chinook Salmon Rearing Habitat and Recommendations for Prioritizing Habitat Protection and Restoration
 Tributary Assessment for Potential Chinook Salmon Rearing Habitat and Recommendations for Prioritizing Habitat Protection and Restoration Ed Connor and Erin Lowery, Seattle City Light Devin Smith and Kate
MCCAW REACH RESTORATION
 Final Report MCCAW REACH FISH RESTORATION PHASE B Jack McCaw Inland Empire Action Coalition http://www.wwccd.net/ Phone: 509-956-3777 Hours: 8:00-4:30 Walla Walla County Conservation District Snake River
STREAM SURVEY File form No..
 scanned for KRIS THE RESOURCES AGENCY OF CALIFORNIA California Department of Fish and Game STREAM SURVEY File form No.. Date: September 4, 1969. NAME: North Fork Schooner Gulch Creek COUNTY: Mendocino.
Youngs Creek Hydroelectric Project (FERC No. P 10359)
") Youngs Creek Hydroelectric Project (FERC No. P 10359) Resident Trout Monitoring Plan Annual Report 2010 Survey and Results of Pre Project Monitoring Prepared by: September 2010 Overview The Public Utility
Youngs Creek Hydroelectric Project (FERC No. P 10359) Resident Trout Monitoring Plan Annual Report 2010 Survey and Results of Pre Project Monitoring Prepared by: September 2010 Overview The Public Utility
Trout Unlimited Comments on the Scope of Environmental Impact Statement for the Constitution Pipeline Project, Docket No. PF12-9
 October 9, 2012 Kimberly D. Bose, Secretary Federal Energy Regulatory Commission 888 First Street, NE, Room 1A Washington, DC 20426 RE: Trout Unlimited Comments on the Scope of Environmental Impact Statement
Fish Passage Culvert Assessment for Cahilty Creek Watershed FIA Project #
 Fish Passage Culvert Assessment for Cahilty Creek Watershed FIA Project # 4602004 Prepared for Weyerhaeuser Company Ltd. Jason Ladyman R.P.F. 1550 Mission Flats Road PO Box 40 Kamloops BC V2C 5K3 Prepared
Amendment to a Biological Assessment/Evaluation completed for the Coon Creek Land Disposal completed December Grand Valley Ranger District
 Amendment to a Biological Assessment/Evaluation completed for the Coon Creek Land Disposal completed December 2007 Grand Valley Ranger District Grand Mesa, Uncompahgre, Gunnison National Forests Prepared
August 11 Snorkel SCC side channel network (SBA, SCC3) feet 707
 feet 707") Date Survey Type Habitat July 29 Snorkel (reconnaissance) Table 1. Fish use survey schedule 2004 Water temperature 1 (ºC) Estimated Mean visibility 2 discharge 3 (cfs) Mainstem (units #1 42) ND ND 814
Date Survey Type Habitat July 29 Snorkel (reconnaissance) Table 1. Fish use survey schedule 2004 Water temperature 1 (ºC) Estimated Mean visibility 2 discharge 3 (cfs) Mainstem (units #1 42) ND ND 814
METHODS PAPER: Downstream Bathymetry and BioBase Analyses of Substrate and Macrophytes
 Mactaquac Aquatic Ecosystem Study Report Series 2015-006 METHODS PAPER: Downstream Bathymetry and BioBase Analyses of Substrate and Macrophytes Ben Wallace, Jae Ogilvie and Wendy Monk 17 February 2015
Yale Reservoir Kokanee (Oncorhynchus nerka) Escapement Report 2016
 Escapement Report 2016") Yale Reservoir Kokanee (Oncorhynchus nerka) Escapement Report 2016 North Fork Lewis River Hydroelectric Project Yale FERC No. 2071 Prepared by: Jeremiah Doyle, PacifiCorp April 4, 2017 1.0 INTRODUCTION
Yale Reservoir Kokanee (Oncorhynchus nerka) Escapement Report 2016 North Fork Lewis River Hydroelectric Project Yale FERC No. 2071 Prepared by: Jeremiah Doyle, PacifiCorp April 4, 2017 1.0 INTRODUCTION
Interim Guidance Fish Presence Absence
 Interim Guidance Fish Presence Absence Source: Forest Practices Act Guidance for Division 635 of the forest practices act dealing with stream classification when no fish surveys have been done (referenced
FISHERIES BLUE MOUNTAINS ADAPTATION PARTNERSHIP
 FISHERIES A warming climate, by itself, substantially affects the hydrology of watersheds in the Blue Mountains. Among the key hydrologic changes projected under all scenarios for the 2040s and beyond
Newaukum Watershed Culvert Assessment
 Newaukum Watershed Culvert Assessment Water Resource Inventory Area 23 Lewis County Conservation District Final Report By: Kelly Verd and Nikki Wilson July 2002 Funded by: Chehalis Fisheries Restoration
Chapter 12 Practice Test
 Chapter 12 Practice Test 1. Which of the following is not one of the conditions that must be satisfied in order to perform inference about the slope of a least-squares regression line? (a) For each value
Probabilistic models for decision support under climate change:
 Probabilistic models for decision support under climate change: An example using bull trout in the Boise River basin Douglas Peterson 1 US Fish and Wildlife Service Abernathy Fish Technology Center Longview,
South Fork Chehalis Watershed Culvert Assessment
 South Fork Chehalis Watershed Culvert Assessment Water Resource Inventory Area 23 Lewis County Conservation District Final Report By: Kelly Verd and Nikki Wilson March 2003 Funded by: The Washington State
San Lorenzo Valley Water District, Watershed Management Plan, Final Version Part I: Existing Conditions Report
 LIST OF FIGURES Figure 1-1. Map of the San Lorenzo River watershed Figure 2-1. The Santa Cruz Mountains Bioregion Figure 2-2. Protected areas within the San Lorenzo River watershed Figure 2-3. Primary
Santa Paula Creek Watershed Planning Project: Steelhead Habitat and Population Assessment
 Steelhead Habitat and Population Assessment TECHNICAL MEMORANDUM Prepared for Santa Paula Creek Fish Ladder Joint Powers Authority California Department of Fish and Game Prepared by Stillwater Sciences
Annex E Bridge Pier Protection Plan
 Annex E Bridge Pier Protection Plan Table E1 Bridge Types and Locations Table E2 Flow Conditions For River Sections Figure E1 Bridge Abutment Protection Figure E2 Bridge Pier Protection Figure E3 Central
Stream Assessment Cut-block: For: Island Timberlands Limited Partnership, Cameron Operation
 Stream Assessment Cut-block: 171214 For: Island Timberlands Limited Partnership, Cameron Operation Tony Norris Area Engineer Island Timberlands Cameron Operation Port Alberni D.G. Rigets E.I.A. CTech.
Juvenile Steelhead and Stream Habitat Conditions Steelhead and Coho Salmon Life History Prepared by: DW ALLEY & Associates, Fishery Consultant
 Juvenile Steelhead and Stream Habitat Conditions Steelhead and Coho Salmon Life History Prepared by: DW ALLEY & Associates, Fishery Consultant I-1. Steelhead and Coho Salmon Ecology Migration. Adult steelhead
Steelhead Society of BC. Thompson River Watershed Restoration and Enhancement Project #4 Nicola River Bank Stabilization and Enhancement Project
 Steelhead Society of BC Presents: Thompson River Watershed Restoration and Enhancement Project #4 Nicola River Bank Stabilization and Enhancement Project Application for Funding December 2013 1.0 BACKGROUND
Aquatic Organism Passage at Road-Stream Crossings CHUCK KEEPORTS FOREST HYDROLOGIST ALLEGHENY NATIONAL FOREST WARREN, PENNSYLVANIA
 Aquatic Organism Passage at Road-Stream Crossings CHUCK KEEPORTS FOREST HYDROLOGIST ALLEGHENY NATIONAL FOREST WARREN, PENNSYLVANIA TOPICS COVERED Aquatic Organism Passage (AOP) Benefits of AOP Crossings
Proposed Habitat Suitability Criteria (HSC) Curves For Application in Habitat Flow Modeling For the Sultan River Instream Flow Study RSP 3
 Curves For Application in Habitat Flow Modeling For the Sultan River Instream Flow Study RSP 3") - - Proposed Habitat Suitability Criteria (HSC) Curves For Application in Habitat Flow Modeling For the Sultan River Instream Flow Study RSP 3 Prepared for: Public Utility District No. 1 of Snohomish County
- - Proposed Habitat Suitability Criteria (HSC) Curves For Application in Habitat Flow Modeling For the Sultan River Instream Flow Study RSP 3 Prepared for: Public Utility District No. 1 of Snohomish County
ESA, Proposed Threatened ESA, Threatened New Mexico-WCA, Endangered
 Scientific Name: Percina macrolepida Common Name: Bigscale Logperch BISON No.: 010270 Legal Status: Arizona, Species of Special Concern ESA, Endangered ESA, Proposed Endangered ESA, Proposed Threatened
LONGITUDINAL FIELD METHODOLOGY FOR THE ASSESSMENT OF TMDL SEDIMENT AND HABITAT IMPAIRMENTS
 LONGITUDINAL FIELD METHODOLOGY FOR THE ASSESSMENT OF TMDL SEDIMENT AND HABITAT IMPAIRMENTS Montana Department of Environmental Quality 1520 East Sixth Avenue Helena, Montana 59620 June 2007 TABLE OF CONTENTS
Minnesota Department of Natural Resources Fisheries Division, Lake Superior Area
 Minnesota F-9-R(P)- Study 4 Job 616 Minnesota Department of Natural Resources Fisheries Division, Lake Superior Area Coaster Brook Trout Status in Minnesota-Lake Superior Tributaries Following Regulation
Minnesota Department of Natural Resources Division of Fish and Wildlife Section of Fisheries. Fairhaven Creek 2000
 Minnesota F-29-R(P)-17 Area 340 Study 3 April 2001 Minnesota Department of Natural Resources Division of Fish and Wildlife Section of Fisheries Stream Survey Report Fairhaven Creek 2000 By Eric R. Altena
4.4 ASSESSMENT OF POTENTIAL ANADROMOUS FISH HABITAT UPSTREAM OF MERWIN DAM (AQU 4)
") 4.4 ASSESSMENT OF POTENTIAL ANADROMOUS FISH HABITAT UPSTREAM OF MERWIN DAM (AQU 4) 4.4.1 Study Objectives The objectives of this study are to: (1) delineate the stream segments in the upper North Fork
4.4 ASSESSMENT OF POTENTIAL ANADROMOUS FISH HABITAT UPSTREAM OF MERWIN DAM (AQU 4) 4.4.1 Study Objectives The objectives of this study are to: (1) delineate the stream segments in the upper North Fork
STREAM CLASSIFICATION AND MAPPING. Prepared For. MacMillan Bloedel Ltd. Menzies Bay Division BOX 6000, Campbell River V9W 5E1.
 STREAM CLASSIFICATION AND MAPPING OF STREAMS IN MENZIES AND OYSTER BAY Prepared For MacMillan Bloedel Ltd. Menzies Bay Division BOX 6000, Campbell River V9W 5E1 September 1998 a a North Island Biological
OKANAGAN RIVER RESTORATION INITIATIVE - FAQ
 OKANAGAN RIVER RESTORATION INITIATIVE - FAQ Initiative background: The health of the q awsitk w (Okanagan River) has been severely impacted by the channelization works that occurred in the mid-1950 s.
Job 1. Title: Estimate abundance of juvenile trout and salmon.
 STUDY PERFORMANCE REPORT State: Michigan Project No.: F-53-R-13 Study No.: 461 Title: Population dynamics of juvenile rainbow trout and coho salmon in Lake Superior tributaries Period Covered: April 1,
Hydraulic Modeling of Stream Enhancement Methods
 Hydraulic Modeling of Stream Enhancement Methods Matthew J. Curry John J. Levitsky Abstract Development within watersheds increases the amounts of runoff causing stream erosion and degradation of stream
CHISANA CARIBOU HERD
 POPULATION ESTIMATE CHISANA CARIBOU HERD 2013 Prepared by: Troy Hegel, Torsten Bentzen*, Ryan Drummond, Judy Putera**, Shawn Taylor, and Jeff Wells* August 2016 POPULATION ESTIMATE CHISANA CARIBOU HERD
Study Update Fish Distribution and Species Composition
 Study Update Fish Distribution and Species Composition Goals and Study Area Gain a better understanding of fish species composition and abundance in waters associated with the Packwood Lake Hydroelectric
Fish Migration Barrier Severity and Steelhead Habitat Quality in the Malibu Creek Watershed
 Fish Migration Barrier Severity and Steelhead Habitat Quality in the Malibu Creek Watershed Produced for California State Coastal Conservancy and California Department of Parks and Recreation By: Heal
Rehabilitation of Grimes Creek, a Stream Impacted in the Past by Bucket-lined Dredge Gold Mining, Boise River Drainage, July 2008 to August 2011.
 Rehabilitation of Grimes Creek, a Stream Impacted in the Past by Bucket-lined Dredge Gold Mining, Boise River Drainage, July 2008 to August 2011. Pam Harrington TU,1020 W. Main Street Suite 440, Boise,
Aquatic Habitats and Instream Flows at the Carmen-Smith Hydroelectric Project, Upper McKenzie River Basin, Oregon
 Aquatic Habitats and Instream Flows at the Carmen-Smith Hydroelectric Project, Upper McKenzie River Basin, Oregon FINAL REPORT Prepared for Eugene Water & Electric Board Eugene, Oregon Prepared by Stillwater
Estimating Summer Steelhead Escapement using Redd Surveys: What have we learned and where do we go? Jim Ruzycki Oregon Department of Fish & Wildlife
 Estimating Summer Steelhead Escapement using Redd Surveys: What have we learned and where do we go? Jim Ruzycki Oregon Department of Fish & Wildlife Spawner Abundance for the John Day Summer Steelhead
Appendix A Recommended EPA Temperature Thresholds for use in Establishing Thermal Potential and Species Life Stage Numeric Criteria
 Appendix A Recommended EPA Temperature Thresholds for use in Establishing Thermal Potential and Species Life Stage Numeric Criteria 1. Temperature Limits Recommended to Protect Salmonid Guilds In this
Creek Trash Assessment (CTA) Methodology (Demonstration: Mill Run Creek, Cheltenham, Pa.)
 Methodology (Demonstration: Mill Run Creek, Cheltenham, Pa.)") Creek Trash Assessment (CTA) Methodology (Demonstration: Mill Run Creek, Cheltenham, Pa.) Mill Run Creek emerges from a storm sewer in Philadelphia to an open creek in Cheltenham. The Creek downstream
Creek Trash Assessment (CTA) Methodology (Demonstration: Mill Run Creek, Cheltenham, Pa.) Mill Run Creek emerges from a storm sewer in Philadelphia to an open creek in Cheltenham. The Creek downstream
Redd Dewatering and Juvenile Salmonid Stranding in the Lower Feather River,
 Redd Dewatering and Juvenile Salmonid Stranding in the Lower Feather River, 2005-2006 Interim Report for NOAA Fisheries Prepared by: California Department of Water Resources Division of Environmental Services
Importance of un-named tributary streams to Brook Trout populations. Dr. Jonathan M. Niles Dr. Dan Ressler
 Importance of un-named tributary streams to Brook Trout populations. Dr. Jonathan M. Niles Dr. Dan Ressler Pennsylvania Streams All streams of PA have a designated use - Huge resource - 8,011 named tributaries:
Surveys for Bull Trout Presence in the Waptus River Basin, 2003
 Surveys for Bull Trout Presence in the Waptus River Basin, 2003 U.S. Fish and Wildlife Service Mid-Columbia River Fishery Resource Office 7501 Icicle Road Leavenworth, WA 98826 August 2004 Abstract The
Running head: DATA ANALYSIS AND INTERPRETATION 1
 Running head: DATA ANALYSIS AND INTERPRETATION 1 Data Analysis and Interpretation Final Project Vernon Tilly Jr. University of Central Oklahoma DATA ANALYSIS AND INTERPRETATION 2 Owners of the various
Ecology of stream-rearing salmon and trout Part II
 Ecology of stream-rearing salmon and trout Part II Individual Feeding territory Habitat use Growth Movement Survival Population Population Abundance Density Variation Movement Individual Relationship between
Rogue Winter Steelhead
 Rogue Winter Steelhead Existing Populations The Rogue Winter Steelhead SMU includes eight populations within the Klamath Mountains Province (KMP) in southwest Oregon (Table 93). None of the populations
Habitat Conditions, Design Strategies,
 Habitat Conditions, Design Strategies, Coho on Cedar Ck. five years after analog-based stream restoration work. and Stream Classification In river work, computer modeling is an insidious procedure in which
Identifying Areas with Potential to Contain High Value Fish Habitat (HVFH) June 2007
 June 2007") Identifying Areas with Potential to Contain High Value Fish Habitat (HVFH) June 2007 1 High Value Fish Habitat INTENT: To apply added precautionary protection to those special areas deemed of high value
Identifying Areas with Potential to Contain High Value Fish Habitat (HVFH) June 2007 1 High Value Fish Habitat INTENT: To apply added precautionary protection to those special areas deemed of high value
Climate Change Adaptation and Stream Restoration. Jack Williams;
 Climate Change Adaptation and Stream Restoration Jack Williams; jwilliams@tu.org 1 Goals for this presentation Develop strategies for adapting streams to climate impacts by Thinking like a watershed Understanding
Pine River Instream Fish Habitat Assessment
 Pine River A report on the Pine River s instream fisheries habitat 1 Pine River Instream Fish Habitat Assessment Michigan Trout Unlimited February 2015 Kristin Thomas Dr. Bryan Burroughs 2 Table of Contents
Five Counties Salmonid Conservation Program - Fish Passage Design Workshop. February 2013
 Program - Aquatic Organisms and Stream Crossings Ecological Connectivity A watershed is a network of channels that drain a common boundary. Channel characteristics formed by interaction of precipitation,
Lewis River Hydroelectric Projects Settlement Agreement Aquatic Coordination Committee (ACC) Meeting Agenda
 Meeting Agenda") Lewis River Hydroelectric Projects Settlement Agreement Aquatic Coordination Committee (ACC) Meeting Agenda Date & Time: Thursday, December 14, 2017 9:00 a.m. 11:15 a.m. Place: Merwin Hydro Control Center
Lewis River Hydroelectric Projects Settlement Agreement Aquatic Coordination Committee (ACC) Meeting Agenda Date & Time: Thursday, December 14, 2017 9:00 a.m. 11:15 a.m. Place: Merwin Hydro Control Center
Burns Paiute Tribe Fisheries Department. Evaluate The Life History Of Native Salmonids Within The Malheur Subbasin Project #
 Burns Paiute Tribe Fisheries Department Evaluate The Life History Of Native Salmonids Within The Malheur Subbasin Project # 199701900 Prior to 1990 Technical and/or scientific background Malheur population,
Section I: Multiple Choice Select the best answer for each problem.
 Inference for Linear Regression Review Section I: Multiple Choice Select the best answer for each problem. 1. Which of the following is NOT one of the conditions that must be satisfied in order to perform
2012 SOUTH RIVER FISH COMMUNITIES AND PHYSICAL HABITAT ASSESSMENT, FRANKLIN COUNTY, MASSACHUSETTS
 2012 SOUTH RIVER FISH COMMUNITIES AND PHYSICAL HABITAT ASSESSMENT, FRANKLIN COUNTY, MASSACHUSETTS Prepared by Michael B. Cole, Ph.D. ABR, Inc. Environmental Research & Services Greenfield, MA For Deerfield
United States Commercial Vertical Line Vessel Standardized Catch Rates of Red Grouper in the US South Atlantic,
 SEDAR19-DW-14 United States Commercial Vertical Line Vessel Standardized Catch Rates of Red Grouper in the US South Atlantic, 1993-2008 Kevin McCarthy and Neil Baertlein National Marine Fisheries Service,
TROUT CREEK WATERSHED (Second Year of Snowline Data)
") Extent of Snow Cover During the 2002 Spring Freshet For the TROUT CREEK WATERSHED (Second Year of Snowline Data) (Penticton Forest District) 1.0 INTRODUCTION The extent of snow cover over a watershed basin
Extent of Snow Cover During the 2002 Spring Freshet For the TROUT CREEK WATERSHED (Second Year of Snowline Data) (Penticton Forest District) 1.0 INTRODUCTION The extent of snow cover over a watershed basin
Development of Bull Trout Sampling Efficiency Models. Final Report
 Development of Bull Trout Sampling Efficiency Models Final Report Prepared by: R.F. Thurow 1, J.T. Peterson 2, C. A. Larsen 1, and J.W. Guzevich 1 1 U.S. Department of Agriculture- Forest Service Rocky
Black River Instream Fish Habitat Assessment
 1 Black River Instream Fish Habitat Assessment Michigan Trout Unlimited October 15 Kristin Thomas Dr. Bryan Burroughs 2 Table of Contents INTRODUCTION... 4 Table 1. Michigan stream and river temperature
Evaluation of Regression Approaches for Predicting Yellow Perch (Perca flavescens) Recreational Harvest in Ohio Waters of Lake Erie
 Recreational Harvest in Ohio Waters of Lake Erie") Evaluation of Regression Approaches for Predicting Yellow Perch (Perca flavescens) Recreational Harvest in Ohio Waters of Lake Erie QFC Technical Report T2010-01 Prepared for: Ohio Department of Natural
Evaluation of Regression Approaches for Predicting Yellow Perch (Perca flavescens) Recreational Harvest in Ohio Waters of Lake Erie QFC Technical Report T2010-01 Prepared for: Ohio Department of Natural