Fishery Statistics. Value of fish production million in December 2002
|
|
|
- Shauna Warner
- 5 years ago
- Views:
Transcription
1 23 December 2002 Fish production Value 2001 Fishery Statistics 2001 nland Sea Inland Total landings Aquaculture catches production a l e m 95.4m 3.4m 287.6m m 107.1m 3.0m 316.3m % change 9.2% 12.3% -10.9% 10.0% Sea landings 6 Value of fish production million in 2001 The value of fish production increased by 10.0 % to 316.3m in The value of sea landings in 2001 was 206.2m, aquaculture was 107.1m and inland catches were estimated at 3.0m. See graph and Tables 1, 8 and 9. The live weight of sea landings increased by 7.8% to 293,868 tonnes, mainly due to increases of 8,216 tonnes in blue whiting and 8,201 tonnes in horse mackerel. See Table 1. The weight and value of aquaculture production both increased with salmon at 70.9m representing over 66% of the total value. See Table 8. There were 314,043 tonnes of fish and fish products exported in 2001 at a value of 444.7m. The comparative import figures were 110,399 tonnes and 161.6m. See Table 12. Published by the Central Statistics Office, Ireland. Ardee Road Dublin 6 Ireland LoCall: Skehard Road Cork Ireland Tel: Tel: Fax: Fax: Both offices may be contacted through any of these telephone numbers. CSO on the Web: An analysis of the statistics shows that: The number of rod licences issued was 32,725. See Table 10. There was an increase in the number of fishing vessels to 1,421. See Table 11. The Consumer Price Index for tinned fish rose by 10.8% to See Table 16. For more information contact James Mahon or Sheila Somers Director General: Donal Garvey Enquiries: Statistics Agriculture Section, ext 5315 agri@cso.ie Sales Information Section, ext 5032 information@cso.ie Central Statistics Office The contents of this release may be quoted provided the source is given clearly and accurately. Reproduction for own or internal use is permitted. Ref 268/2002 ISSN
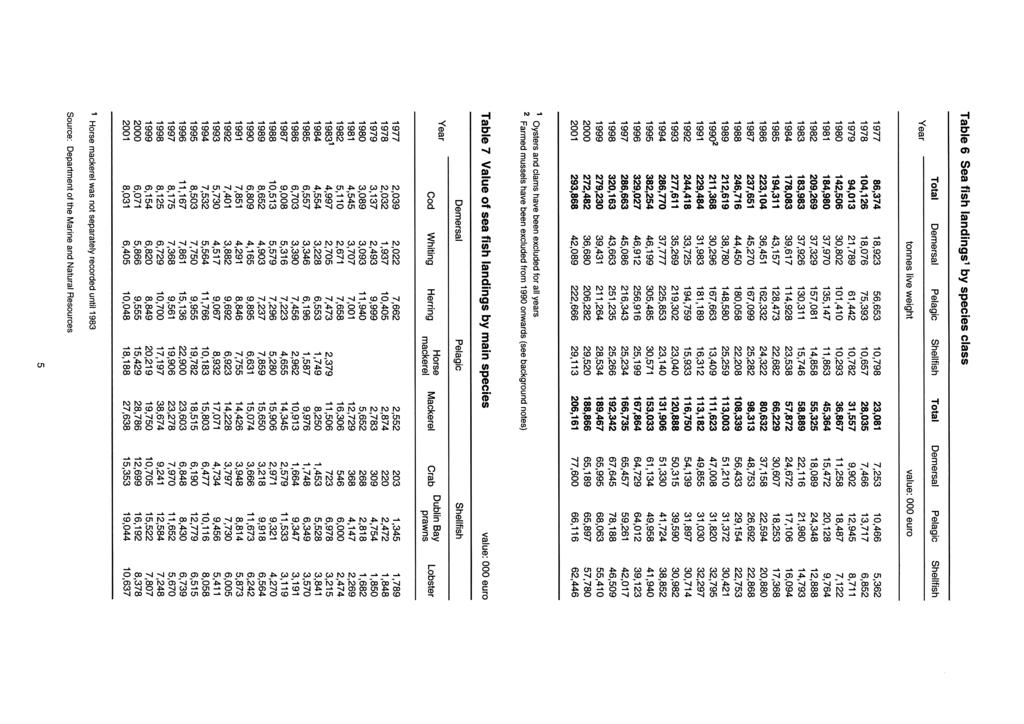
2 Table 1 Sea fish landings 1 by species Species tonnes live weight value: 000 euro Total 279, , , , , ,161 Demersal 39,431 36,680 42,089 65,995 65,189 77,600 Brill Cod 3,860 2,928 2,831 6,154 6,071 8,031 Dogfish 1,645 1,361 1, ,763 Dover sole ,858 3,321 3,678 Haddock 4,898 5,812 5,945 5,289 6,774 6,945 Hake 2,090 2,037 1,112 7,005 6,548 3,858 John Dory Lemon sole ,070 Ling 1,138 1,089 1,318 1,045 1,069 1,464 Megrim 3,162 3,364 3,705 7,939 8,437 8,783 Monk/Angler 4,298 3,838 3,183 11,324 11,534 9,891 Plaice 1,424 1, ,945 2,301 2,074 Ray/Skate 2,283 2,077 2,173 2,439 2,546 3,338 Saithe 1,704 1,741 2,080 1,574 1,379 1,829 Turbot ,124 2,226 1,724 White pollock 1,049 1,131 1,447 1,318 1,314 2,170 Whiting 7,643 6,505 6,877 6,820 5,866 6,405 Witch ,469 Other demersal 1,967 1,842 6,539 2,117 1,956 11,686 Pelagic 211, , ,666 68,063 65,897 66,116 Blue whiting 33,687 21,693 29,909 2,365 1,243 2,240 Herring 45,334 42,114 41,238 8,849 9,555 10,048 Horse mackerel 58,201 55,438 63,639 20,219 15,429 18,188 Mackerel 59,609 70,183 69,627 19,750 28,786 27,638 Sprat 5,826 6, ,791 1, Tuna 4,909 3,486 2,411 13,638 7,407 4,429 Other pelagic 3,699 7,337 15,387 1,450 1,580 3,488 Shellfish 28,534 29,520 29,113 55,410 57,780 62,446 Blue mussel , Crab 8,550 10,295 11,138 10,705 12,699 15,353 Crawfish ,483 Dublin Bay prawns 4,603 4,077 4,277 15,522 16,192 19,044 Escallop 1,497 1,577 1,131 4,232 4,006 3,086 Lobster ,807 8,378 10,637 Periwinkle 3,014 2,634 1,766 2,863 3,482 1,723 Prawn tails 3,889 3,632 2,102 5,183 4,647 2,955 Shrimp ,570 3,055 2,025 Squid Whelk 4,561 4,474 6,363 2,573 2,794 4,040 Other shellfish , Oysters, clams and farmed mussels have been included in aquaculture Source: Department of the Marine and Natural Resources 2
3 Table 2 Sea fish landings 1 by port Port tonnes live weight value: 000 euro Total 279, , , , , ,161 Irish ports Achill 2 1, Aran Islands Arklow , Ballycotton ,755 1,651 1,801 Baltimore 2 2,220 1,324 2,303 3,532 2,573 2,260 Bantry Burtonport 1,050 1, ,892 2,202 1,609 Carna Carrigaholt ,104 Castlegregory Castletownbere 2 9,675 10,670 8,422 17,248 15,052 10,678 Clogherhead 1,304 1, ,328 2,537 2,018 Cobh 10,111 8,274 10,889 3,198 3,021 4,224 Courtown Crosshaven 818 1, ,213 1,431 1,976 Dingle 6,674 6,295 7,509 13,654 8,247 7,980 Downings 2 1, ,271 2,043 1,813 4,404 Dun Laoghaire Duncannon/St. Helens ,035 1,185 Dunmore east 12,666 16,345 13,605 9,007 12,839 16,090 Fenit 336 1,851 2, ,018 3,575 Greencastle 2 3,011 2,686 4,654 4,677 4,132 5,962 Helvick ,532 1,259 Howth 5,548 5,034 5,308 10,702 11,229 13,462 Killybegs 100,151 85, ,355 28,229 26,207 31,679 Kilmore quay 1,651 1,978 1,841 3,436 4,324 3,967 Kinsale 2 1,315 1,774 1,696 2,092 2,487 3,005 Malin head 815 1, ,248 1,320 1,363 Moville Portmagee ,283 1, Rathmullan 13,276 15,360 11,534 5,312 4,017 3,654 Rossaveal 6,412 10,268 10,004 9,194 9,949 11,338 Schull 2 1,531 1,236 1,216 2,594 2,138 2,326 Skerries 1,657 1, ,815 2,217 1,281 Union Hall 4,367 2,578 2,871 6,238 4,954 4,385 Valentia ,924 1,312 1,717 Wexford Wicklow 2 2,390 2,211 4,455 1,366 1,541 3,064 Other ports 2 10,029 9,244 8,591 16,289 17,444 18,452 Foreign ports 3 72,550 75,488 79,996 28,326 33,939 35,457 1 Oysters, clams and farmed mussels have been included in aquaculture 2 Farmed mussels excluded 3 Distributed across all consumption categories in Table 3 Table 3 Sea fish landings by consumption category Category tonnes live weight value: 000 euro Total 279, , , , , ,161 Human consumption 169, , , , , ,684 Foreign ports 72,361 75,265 79,890 28,090 33,397 35,030 Fish meal 1 37,854 24,734 35,315 3,501 1,826 3,448 1 Includes withdrawals Source: Department of the Marine and Natural Resources 3
4 Table 4 Sea fish landings by month Month tonnes live weight value: 000 euro Total 279, , , , , ,161 January 27,280 39,341 43,218 10,593 19,492 21,579 February 28,793 26,123 42,054 15,474 13,114 21,088 March 40,936 44,287 36,508 16,256 20,299 17,486 April 33,286 15,681 29,348 12,053 13,166 14,964 May 12,962 14,350 11,584 14,800 15,241 14,279 June 10,516 10,929 10,164 14,752 15,561 14,921 July 8,496 10,597 7,561 17,665 15,644 15,942 August 10,964 11,841 9,557 16,856 16,525 16,601 September 18,218 13,977 13,787 20,047 14,817 15,159 October 25,792 26,610 21,126 17,473 13,878 14,636 November 40,914 38,336 36,698 21,731 20,530 21,467 December 21,074 20,409 32,262 11,767 10,599 18,039 Table 5 Average price per tonne live weight of main fish species euro per tonne Species Demersal Brill 3,923 4,037 4,568 5,065 6,082 7,446 Cod 1,396 1,433 1,535 1,594 2,073 2,837 Dogfish Dover sole 7,792 7,815 8,362 7,848 8,832 10,326 Haddock 1, ,063 1,080 1,166 1,168 Hake 3,180 3,365 3,401 3,351 3,214 3,469 John Dory 3,265 3,005 2,991 3,695 3,453 4,103 Lemon sole 1,720 1,677 1,685 1,816 1,706 2,418 Ling , ,111 Megrim 2,175 2,253 2,238 2,510 2,508 2,370 Monk/Angler 2,271 2,306 2,346 2,635 3,005 3,108 Plaice 1,659 1,768 1,731 2,068 2,237 2,516 Ray/Skate ,068 1,225 1,536 Saithe Turbot 7,804 8,202 8,723 8,126 9,429 9,294 White pollock 1,130 1,093 1,189 1,257 1,162 1,500 Whiting Witch 1,525 1,494 1,405 1,400 1,597 1,697 Pelagic Blue whiting Herring Horse mackerel Mackerel Sprat Tuna 1,772 1,857 1,944 2,778 2,125 1,837 Shellfish Blue mussel Crab 1, ,159 1,252 1,234 1,378 Crawfish 19,878 17,448 20,855 22,594 17,908 21,523 Dublin Bay prawns 3,045 3,373 3,148 3,372 3,972 4,453 Escallop 2,659 2,611 2,786 2,827 2,540 2,729 Lobster 11,737 11,037 11,856 13,069 13,837 15,522 Periwinkle 1, , , Prawn tails 1,226 1,541 1,316 1,333 1,280 1,406 Shrimp 6,480 5,916 6,199 6,481 6,800 7,997 Squid 2,321 2,506 2,276 2,524 1,616 1,928 Whelk Farmed mussels have been included in aquaculture Source: Department of the Marine and Natural Resources 4
5
6 Table 8 Aquaculture production Species tonnes value: 000 euro Aquaculture 43,856 51,247 60,935 85,983 95, ,109 Shellfish 23,516 31,110 35,853 21,639 21,512 27,944 Finfish 20,340 20,137 25,082 64,344 73,840 79,166 Salmon 18,076 17,648 23,312 54,797 61,445 70,869 Source: Bord Iascaigh Mhara Table 9 Inland fish catches Species tonnes value: 000 euro Inland ,885 3,359 2,992 Salmon ,863 2,239 2,455 Other ,022 1, Source: Marine Institute, Central Fisheries Board and CSO Table 10 Sales of commercial and rod angling licences number Type Commercial and rod 30,358 31,964 31,962 32,973 34,105 34,685 Commercial 2,097 2,083 2,114 2,015 1,942 1,960 Drift Draft Other Rod 28,261 29,881 29,848 30,958 32,163 32,725 Source: Central Fisheries Board Table 11 Fishing fleet 1 structure Category Number of boats 1,249 1,185 1,156 1,177 1,274 1,421 Tonnage 2 54,577 55,028 55,093 56,686 61,262 65,339 Kilowatts 190, , , , , ,479 1 Includes aquaculture vessels 2 The European Union requires that fleet capacity is now expressed in gross tonnage. This is normally a higher figure than the corresponding gross registered tonnage figure used from 1995 to 1999 Source: Department of the Marine and Natural Resources 6
7 Table 12 External trade of fish and fish products classified by country of origin or destination Country of origin or destination tonnes value: 000 euro Exports 208, , , , , ,700 European Union 124, , , , , ,379 Austria Belgium and Luxembourg 952 1, ,356 3,096 3,159 Denmark 1, ,541 2,540 1,971 6,866 Finland France 32,745 28,444 42,473 80,806 73,832 93,756 Germany 32,002 28,511 25,848 26,646 30,436 37,865 Greece , ,333 Great Britain 25,220 39,437 81,207 40,388 54,118 80,086 Italy 6,680 5,528 6,068 32,179 28,884 31,303 Portugal ,019 1,605 1,965 Netherlands 4,122 5,672 10,659 4,604 7,375 12,922 Northern Ireland 4,431 2,240 8,711 4,552 4,319 10,415 Spain 14,859 13,617 21,508 47,811 47,991 62,424 Sweden 1,290 1,187 3,231 3,309 3,521 5,335 Non-European Union 83,610 88, ,740 59,239 72,181 95,320 Bulgaria 878 3,031 2, ,509 2,172 Czech Republic 1,770 1,247 2,442 1,028 1,004 2,467 Egypt 17,230 36,849 26,163 7,027 18,540 17,491 Japan 24,463 15,451 20,105 19,876 18,351 21,375 Poland 9,855 8,796 6,150 7,992 7,685 7,542 Romania 4,807 2,214 7,613 2,749 2,147 5,835 Russia 51 3,039 3, ,413 3,096 South Korea 1,828 1,954 4,911 4,707 5,091 8,733 USA ,535 1,559 1,469 4,403 Other countries 22,343 15,201 29,476 13,898 12,971 22,205 Imports 57,221 65, , , , ,590 European Union 39,233 42,457 98, , , ,949 Belgium and Luxembourg Denmark 4,070 5,972 5,135 10,585 11,448 12,701 Finland France , ,652 Germany ,732 Greece Great Britain 23,777 29,311 42,730 72,738 81,651 98,105 Italy Portugal Netherlands 1,271 1,305 1,265 5,464 3,889 3,322 Northern Ireland 9,682 5,244 9,442 11,131 11,355 14,434 Spain Sweden Non-European Union 17,988 23,268 12,230 12,714 12,714 14,641 Faroe Islands 4,519 6, Iceland 1,779 3, ,621 2,188 1,577 Norway 8,687 10,209 6,720 4,322 4, Thailand ,073 USA ,572 1, Other countries 1,824 2,084 4,655 3,931 4,015 10,725 1 Revised Source: CSO External Trade, see background notes 7
8 Table 13 External trade of fish and fish products classified by main species 1 Species tonnes value: 000 euro Exports 208, , , , , ,700 Cod 469 1,435 1, ,545 4,066 Crab 5,332 5,722 6,698 16,834 17,802 19,371 Flatfish 1, ,229 2,636 2,880 3,616 Haddock 1, ,690 1,271 1,270 Hake ,188 1, Herring 29,186 22,697 30,190 20,698 21,967 31,028 Livers and roes ,602 3,413 2,825 Lobster ,032 4,570 5,282 Mackerel and horse mackerel 101, , ,196 57,699 68, ,043 Megrim 1,956 2,014 1,960 6,723 6,930 6,951 Monk/Angler 2,406 2,461 2,880 10,983 12,073 14,090 Mussels 10,550 13,626 20,208 19,010 24,086 32,300 Oysters 1,056 1,042 1,067 2,770 3,786 4,364 Pollock Salmon 11,520 10,796 16,986 47,356 50,964 61,721 Sardines 2,011 4,819 25,993 1,610 5,333 12,057 Scallops ,543 4,308 4,497 Shrimps and prawns 8,239 6,710 7,063 50,237 41,458 46,358 Sole ,077 Squid Surimi 814 1,367 1, ,424 2,380 Trout 1,135 1,639 2,165 3,740 6,177 4,979 Tuna 3,285 3,038 4,340 7,673 7,983 8,854 Whiting 1,360 1,625 3,032 3,420 3,331 4,118 Meal, oils, fats, waste 7,262 13,605 38,459 6,421 6,125 21,211 Other species and products 15,662 15,686 16,651 30,422 31,292 44,293 Imports 57,221 65, , , , ,590 Cod 1,331 1,828 1,446 4,989 6,910 6,038 Crab 944 2,108 1,639 1,530 2,846 2,376 Haddock ,756 1,963 2,289 Herring 1, ,899 1, ,059 Lamprey 1,463 1,753 1,739 5,793 7,258 7,708 Mackerel and horse mackerel 490 1,944 19, ,355 10,112 Mussels Plaice ,392 1,938 1,860 Salmon 2,974 2,912 3,936 11,876 12,080 14,139 Shrimps and prawns 4,706 3,882 4,114 26,058 24,506 25,873 Surimi ,762 2,353 2,743 Tuna 3,624 3,510 4,789 10,485 11,637 13,817 Whiting 3,281 2,701 3,198 7,203 9,031 11,536 Meal, oils, fats, waste 32,042 39,804 32,838 23,204 26,305 25,568 Other species and products 3,422 3,059 29,875 13,394 12,344 30,897 1 Species figures include processed products 2 Revised Source: CSO External Trade, see background notes 8
9 Table 14 External trade of fish and fish products classified by product and degree of processing Category Whole fish 1 Fillets Shellfish Whole fish 1 Fillets Shellfish tonnes value: 000 euro 1999 Exports 153,864 26,483 28, ,017 27, ,176 Live, fresh, chilled 36,762 6,032 12,409 83,580 4,560 39,248 Frozen 96,954 18,669 9,427 56,897 18,092 45,821 Dried, salted, in brine, smoked 7, , ,363 Prepared, preserved 5, ,759 10,175 4,308 17,743 Meal, oil, fats, waste 7, , Imports 47,840 3,299 6,082 72,067 11,920 29,936 Live, fresh, chilled 5, ,111 15, ,069 Frozen 850 1,810 2,518 1,990 6,796 17,152 Dried, salted, in brine, smoked 1, , Prepared, preserved 7, ,850 3,873 2,618 Meal, oil, fats, waste 32, , Exports 161,425 25,189 29, ,974 30, ,014 Live, fresh, chilled 39,633 3,500 14,581 90,605 2,848 38,888 Frozen 98,653 20,255 8,104 77,151 21,910 39,661 Dried, salted, in brine, smoked 4, , ,378 Prepared, preserved 4,940 1,106 6,162 10,363 4,726 21,087 Meal, oil, fats, waste 13, , Imports 56,456 2,829 6,440 80,730 12,269 29,785 Live, fresh, chilled 6, ,537 18, ,522 Frozen 1,462 1,612 2,289 3,850 7,024 16,914 Dried, salted, in brine, smoked , Prepared, preserved 8, ,777 3,746 4,323 Meal, oil, fats, waste 39, , Exports 242,685 33,368 37, ,667 50, ,103 Live, fresh, chilled 64,013 3,872 20, ,402 5,675 51,860 Frozen 130,428 27,618 9, ,961 36,027 43,668 Dried, salted, in brine, smoked 3, ,347 1,322 1,569 Prepared, preserved 6,692 1,455 6,805 14,746 7,906 21,006 Meal, oil, fats, waste 38, , Imports 99,376 4,803 6, ,148 15,912 30,530 Live, fresh, chilled 12, ,762 25,295 2,042 7,108 Frozen 43,204 2,881 2,651 24,693 7,989 18,375 Dried, salted, in brine, smoked 1, , Prepared, preserved 10,217 1, ,036 5,110 5,028 Meal, oil, fats, waste 32, , Includes fish in pieces etc. 2 Revised Source: CSO External Trade, see background notes 9
10 Table 15 Processing and preserving of fish and fish products million euro Category Gross output Industrial inputs Net output Wages and Salaries Number of persons engaged 1 2,758 2,756 2,754 2,645 2,568 1 Excludes outside piece workers Source: CSO Census of Industrial Production Table 16 Consumer price indices of selected fish products mid-november 1996=100 Product Food products Fresh fish Frozen fish Smoked fish Tinned fish Source: CSO Consumer Price Index Table 17 National average prices of selected fish products euro per kg Product mid-november Whiting fillets Cod cutlets Plaice fillets Smoked kippers Source: CSO Consumer Prices 10
11 Central Statistics Office Fishery Statistics Background Notes General This release has been compiled from existing administrative and statistical sources. It brings together into one release the various fishery statistics that are already available. Comparisons between sea landings and external trade statistics should allow for the differences between both systems mentioned below. Allowance should also be made for aquaculture and inland fish production as well as for any stock changes of frozen fish etc. and for trade outside the scope of the External Trade statistics thresholds. Sea landings Fishery statistics are collected by the Sea Fishery Officers of the Department of the Marine and Natural Resources. They are processed by the Sea Fisheries Control Division of the Department. The Sea Fisheries Division are responsible for the transmission of the figures to the EU statistical office, Eurostat, under the terms of Council Regulation No 2104/93. Landings of clams, oysters and salmon have been excluded by the CSO from the figures supplied by the Department. Landings of blue mussels into ports where blue mussel aquaculture farming is located have also been excluded from 1990 onwards. In 1990 the amount of excluded farmed mussels was 13,600 tonnes valued at 3.3 million. Landings by foreign boats into Irish ports are not included in the figures. Demersal fish are found on or near the bottom of the sea. They are often referred to as white fish. Pelagic fish live in the surface waters or middle depths of the sea. Shellfish are of two kinds, crustaceans - prawns, lobsters, crabs etc. and molluscs - mussels, oysters etc. Aquaculture production Bord Iascaigh Mhara conducts an annual survey of finfish and shellfish farms. production and employment are collected. Figures on Inland catches The salmon quantity figures are compiled by the Marine Institute. The methodology was amended in 1994 to supplement reports from registered dealers with indications from inspectors of what was caught but not sold through the dealers. The quantity and value of eels are estimated by the Central Fisheries Board. External trade statistics The estimates for exports and imports are taken from the CSO external trade statistics. The basic external trade data are collected by the Office of the Revenue Commissioners and passed to the External Trade Statistics Division of the CSO for checking and publication. Since the completion of the EU Single Market at the end of 1992, trade statistics with EU member states and trade statistics with non-eu countries are compiled from two separate sources. The EU-wide system, Intrastat, involves a direct survey of the larger traders and an analysis of the regular VAT returns made by all traders. Traders not registered for VAT have no obligations under the Intrastat system and their trade is therefore not included in the statistics. The Intrastat figures include estimates for traders who did not make Intrastat returns and for traders below the thresholds who did not provide aggregate inter-eu trade figures on their VAT returns. Statistics of trade with non-eu countries are compiled from documents returned to the Customs Authorities. Some amendments have been made, mainly to quantity figures, arising from an analysis of unit values at tariff level. Landings of fish by European Union registered vessels are not included in import statistics. If these fish are sold and subsequently exported, they are included in export statistics. 11
12 Central Statistics Office Licences Fishing fleet Census of Industrial Production Consumer Price Index Fishery Statistics The Central Fisheries Board collate the sales figures from returns made to them by the Regional Fishery Boards. The Department of the Marine and Natural Resources compile these figures and are also responsible for maintaining the fishing vessel register. The figures include vessels used for aquaculture. The figures are taken from the CSO Census of Industrial Local Units. The results cover all industrial local units with three or more persons engaged and relate to the NACE code Processing and preserving of fish and fish products. The Consumer Price Index is compiled by the CSO. It is designed to measure the average change in the level of the prices paid for consumer goods and services by all private households in the country. In addition to the price indices, national average prices are also published for selected items. EU 2000 EU aquaculture production 000 Country Total aquaculture Finfish Shellfish European Union 2,842,466 1,949, ,119 Austria 12,973 12, Belgium 5,912 5,912 - Denmark 159, , Finland 62,800 62,800 - France 470, , ,529 Germany 127, ,448 18,150 Greece 311, ,789 3,531 Ireland 95,354 73,840 21,512 Italy 494, , ,427 Luxembourg Netherlands 116,330 40,294 76,036 Portugal 54,786 31,892 22,895 Spain 414, , ,457 Sweden 16,165 15, United Kingdom 500, ,050 25,124 Source: New Cronos database, Eurostat 12
Fishery Statistics and m 125.2m 5.5m 340.6m m 101.8m 4.5m 286.7m m 100.5m 5.0m 286.4m
 30 March 2007 Fish production Value 2004 Fishery Statistics 2003 and 2004 Inland 2% Sea Inland Total landings Aquaculture catches production Aquaculture 35% 2002 209.9m 125.2m 5.5m 340.6m 2003 180.3m 101.8m
THE BUSINESS OF SEAFOOD A Snapshot of Ireland s Seafood Sector
 THE BUSINESS OF SEAFOOD 2017 A Snapshot of Ireland s Seafood Sector The Business of Seafood 2017 1.15 billi The Irish Seafood Economy 2017 29% 15% GDP 1.15 billion * 19% 37% DOMESTIC CONSUMPTION 429M +4%
IRELAND IN THE WORLD AND IN THE EU (2015, source: FAO and Eurostat)
") IRELAND IN THE WORLD AND IN THE EU (2015, source: FAO and Eurostat) Ireland is the 7 th EU producer of fisheries and aquaculture products. (1.000 tonnes) World EU-28 Ireland % world % EU-28 Catches 104.635
IRELAND IN THE WORLD AND IN THE EU (2015, source: FAO and Eurostat) Ireland is the 7 th EU producer of fisheries and aquaculture products. (1.000 tonnes) World EU-28 Ireland % world % EU-28 Catches 104.635
Overseas Market Introduction Service on the Irish Seafood Market
 Overseas Market Introduction Service on the Irish Seafood Market Sea Fish Industry Authority Order Reference: 4525/15 Produced by Emma Shiel Dublin Date of Report: 29 th September 2015 Contents 1. Executive
GERMANY IN THE WORLD AND IN THE EU (2015, source: FAO and Eurostat) FISHING FLEET (2015, source: JRC and Annual Economic Report)
 FISHING FLEET (2015, source: JRC and Annual Economic Report)") GERMANY IN THE WORLD AND IN THE EU (2015, source: FAO and Eurostat) Germany is the EU s 6th largest producer of fisheries and 10th largest of aquaculture products. (1000 tonnes) World EU-28 Germany % World
GERMANY IN THE WORLD AND IN THE EU (2015, source: FAO and Eurostat) Germany is the EU s 6th largest producer of fisheries and 10th largest of aquaculture products. (1000 tonnes) World EU-28 Germany % World
NETHERLANDS IN THE WORLD AND IN THE EU (2015, source: FAO and Eurostat)
") Netherlands NETHERLANDS IN THE WORLD AND IN THE EU (2015, source: FAO and Eurostat) The Netherlands rank 5 th production. in the EU in terms of fisheries and 6 for farmed (1.000 tonnes) World EU-28 Netherlands
Netherlands NETHERLANDS IN THE WORLD AND IN THE EU (2015, source: FAO and Eurostat) The Netherlands rank 5 th production. in the EU in terms of fisheries and 6 for farmed (1.000 tonnes) World EU-28 Netherlands
Facts and figures on the CFP. Basic data on the Common Fisheries Policy
 Facts and figures on the CFP Basic data on the Common Fisheries Policy Edition 2004 Statistics were provided by Eurostat. A great deal of additional information on the European Union is available on the
SWEDEN IN THE WORLD AND IN THE EU (2015, source: FAO and Eurostat)
") SWEDEN IN THE WORLD AND IN THE EU (2015, source: FAO and Eurostat) Sweden is the EU s 8 th largest producers of fisheries and 15 th largest of aquaculture products. (1.000 tonnes) World EU-28 Sweden %
SWEDEN IN THE WORLD AND IN THE EU (2015, source: FAO and Eurostat) Sweden is the EU s 8 th largest producers of fisheries and 15 th largest of aquaculture products. (1.000 tonnes) World EU-28 Sweden %
PORTUGAL IN THE WORLD AND IN THE EU (2015, source: FAO and Eurostat)
") Portugal updated on 16-04-18 PORTUGAL IN THE WORLD AND IN THE EU (2015, source: FAO and Eurostat) Portugal ranks 11 th in the EU for fisheries production and has a lower ranking for aquaculture production.
Portugal updated on 16-04-18 PORTUGAL IN THE WORLD AND IN THE EU (2015, source: FAO and Eurostat) Portugal ranks 11 th in the EU for fisheries production and has a lower ranking for aquaculture production.
POLAND IN THE WORLD AND IN THE EU (2015, source: FAO and Eurostat)
") POLAND IN THE WORLD AND IN THE EU (2015, source: FAO and Eurostat) Poland is the EU s 10th largest producer of fisheries and 9th largest of aquaculture products. (1.000 tonnes) World EU-28 Poland % World
POLAND IN THE WORLD AND IN THE EU (2015, source: FAO and Eurostat) Poland is the EU s 10th largest producer of fisheries and 9th largest of aquaculture products. (1.000 tonnes) World EU-28 Poland % World
Fishery Products EU Fishery Marketing Report 2008
 GAIN Report Global Agriculture Information Network Template Version 2.09 Required Report - public distribution NL8009 Netherlands Date: 5/6/2008 GAIN Report Number: NL8009 Fishery Products EU Fishery Marketing
UK IN THE WORLD AND IN THE EU (2015, source: FAO and Eurostat)
") UK IN THE WORLD AND IN THE EU (2015, source: FAO and Eurostat) The UK is the EU s 3rd largest producer for fisheries and 2nd largest for aquaculture products. (1.000 tonnes) World EU-28 United Kingdom
UK IN THE WORLD AND IN THE EU (2015, source: FAO and Eurostat) The UK is the EU s 3rd largest producer for fisheries and 2nd largest for aquaculture products. (1.000 tonnes) World EU-28 United Kingdom
FRANCE IN THE WORLD AND IN THE EU (2015, source: FAO and Eurostat) FISHING FLEET (2015, source: JRC and Annual Economic Report)
 FISHING FLEET (2015, source: JRC and Annual Economic Report)") FRANCE IN THE WORLD AND IN THE EU (2015, source: FAO and Eurostat) France is the EU s 4th largest producer for fisheries and 3rd largest for aquaculture products. (1000 tonnes) World EU-28 France % World
FRANCE IN THE WORLD AND IN THE EU (2015, source: FAO and Eurostat) France is the EU s 4th largest producer for fisheries and 3rd largest for aquaculture products. (1000 tonnes) World EU-28 France % World
SEAFOOD INDUSTRY FACTSHEET
 SEAFOOD INDUSTRY FACTSHEET FEBRUARY 2018 SEAFOOD INDUSTRY FACTSHEET Segments 1. 2. 3. 4. 5. 6. 7. 8. 9. 10. 11. Seafood Industry Overview... 2 UK Sea Fish Processing Sector... 3 UK Seafood Industry...3
OECD employment rate increases to 68.4% in the third quarter of 2018
 Paris, 17th January 2019 News Release: 3rd Quarter 2018 OECD employment rate increases to 68.4% in the third quarter of 2018 The OECD area employment rate the share of the working-age population with jobs
Statistical News Release
 PRE-RELEASE ACCESS - RESTRICTED UNTIL 9.30 AM on MAY 25, 2017 Statistical News Release A National Statistics Publication for Scotland May 25, 2017 PROVISIONAL SCOTTISH SEA FISHERIES STATISTICS 2016 Provisional
Facts and figures on the CFP BASIC DATA ON THE COMMON FISHERIES POLICY
 Facts and figures on the CFP BASIC DATA ON THE COMMON FISHERIES POLICY EDITION 2008 Statistics provided by Eurostat. Data on fleet, jobs and Community aid provided by the Directorate-General for Maritime
Brexit and fisheries. fishing resources and markets at stake
 Brexit and fisheries fishing resources and markets at stake SÉBASTIEN METZ SAKANA CONSULTANTS January 2018 BREXIT AND FISHERIES: FISHING RESOURCES AND MARKETS AT STAKE. 2 Brexit and fisheries: two major
Fish Landings from the UK Exclusive Economic Zone and UK Landings from the EU EEZ. Ian R. Napier
 Fish Landings from the Exclusive Economic Zone and Landings from the EEZ Ian R. Napier 31 st January 2017 Fish Landings from the Exclusive Economic Zone and Landings from the EEZ Ian R. Napier ( ian.napier@uhi.ac.uk
Facts and figures on the CFP. Basic data on the Common Fisheries Policy
 E D I T I O N 2 0 0 6 Facts and figures on the CFP Basic data on the Common Fisheries Policy Statistics were provided by Eurostat. A great deal of additional information on the European Union is available
UK Seafood Value Chain 2017 Provisional
 UK Seafood Value Chain 2017 Provisional Sources: Nielsen ScanTrack GB Total Coverage including Discounters and Northern Ireland including Musgraves 30.12.17, Nielsen HomeScan GB 30.12.17, The NPD Group/CREST
Consumers perception of aquaculture products OECD Paris 16 April 2010
 Consumers perception of aquaculture products OECD Paris 16 April 2010 Aquaculture products: consumers perception SEAFOODplus EU-FP6 integrated project 2004-2008 CONSENSUS EU-FP6 coordination action 2006-2008
CZECH REPUBLIC IN THE WORLD AND IN THE EU (2015, source: FAO and Eurostat)
") CZECH REPUBLIC IN THE WORLD AND IN THE EU (2015, source: FAO and Eurostat) The Czech Republic is a landlocked country with no marine fisheries, while it is the 11 th largest producer of aquaculture products.
CZECH REPUBLIC IN THE WORLD AND IN THE EU (2015, source: FAO and Eurostat) The Czech Republic is a landlocked country with no marine fisheries, while it is the 11 th largest producer of aquaculture products.
MALTA IN THE WORLD AND IN THE EU (2015, source: FAO and Eurostat) FISHING FLEET (2015, source: JRC and Annual Economic Report)
 FISHING FLEET (2015, source: JRC and Annual Economic Report)") MALTA IN THE WORLD AND IN THE EU (015, source: FAO and Eurostat) ranked low in the EU both for fisheries and for aquaculture production. (1000 tonnes) World EU- % World % EU- Catches 104.635 5.144 0,0%
MALTA IN THE WORLD AND IN THE EU (015, source: FAO and Eurostat) ranked low in the EU both for fisheries and for aquaculture production. (1000 tonnes) World EU- % World % EU- Catches 104.635 5.144 0,0%
The Fisheries and Aquaculture Sector in LITHUANIA
 The Fisheries and Aquaculture Sector in LITHUANIA Introduction Source: Baltlanta Lithuania has a relatively short coastline of 90 km, and its territorial waters and exclusive economic zone in the Baltic
Fish Landings in Shetland and by the Shetland Fleet in 2013
 Port Arthur, Scalloway, Shetland ZE1 0UN, Scotland. Tel: 01595 772000 Email: nainfo@uhi.ac.uk WWW: www.nafc.ac.uk Fish Landings in Shetland and by the Shetland Fleet in 2013 Ian R. Napier ( ian.napier@uhi.ac.uk
Annex - tables. No.7/2016 MONTHLY HIGHLIGHTS
 Annex - tables No.7/2016 MONTHLY HIGHLIGHTS First sales 1.1. MONTHLY FIRST SALES IN 11 EU REPORTING MEMBER STATES AND NORWAY (volume in tonnes and value in million euro) BELGIUM 407 0,74 329 0,90 268 0,79
PROTOCOL 1 a. Article 1. As regards the products listed in the Annex to this Protocol and originating in the Faroes:
 PROTOCOL 1 a concerning the tariff treatment and arrangements applicable to certain fish and fishery products released for free circulation in the Community or imported into the Faeroes Article 1 As regards
Annual Sampling Report 2003 Workpackage 8: Biodata
 AQUACULTURE AND COASTAL ECONOMIC AND SOCIAL SUSTAINABILITY Annual Sampling Report 23 Workpackage 8: Biodata Coastal & Marine Resources Centre, Environmental Research Institute, University College Cork,
Inside the United Kingdom Seafood Trade
 International Markets Bureau MARKET INDICATOR REPORT JULY 2012 Inside the United Kingdom Seafood Trade Inside the United Kingdom Seafood Trade TRADE SUMMARY The United Kingdom (U.K.) is the eighth-largest
CYPRUS IN THE WORLD AND IN THE EU (2015, source: FAO and Eurostat)
") Cyprus updated on 03-05-18 CYPRUS IN THE WORLD AND IN THE EU (2015, source: FAO and Eurostat) Cyprus ranks low among EU Member States producing fisheries and aquaculture products. (1.000 tonnes) World
Cyprus updated on 03-05-18 CYPRUS IN THE WORLD AND IN THE EU (2015, source: FAO and Eurostat) Cyprus ranks low among EU Member States producing fisheries and aquaculture products. (1.000 tonnes) World
Fish Landings in Shetland and by the Shetland Fleet in 2012
 Port Arthur, Scalloway, Shetland ZE1 UN, Scotland. Tel: 1595 772 Email: info@nafc.ac.uk WWW: www.nafc.ac.uk Fish Landings in Shetland and by the Shetland Fleet in 212 Ian R. Napier ( ian.napier@nafc.uhi.ac.uk
COMMISSION OF THE EUROPEAN COMMUNITIES
 COMMISSION OF THE EUROPEAN COMMUNITIES Brussels, 29.03.1995 COM(95) 103 final Proposal for a COUNCIL REGULATION (EQ allocating, for 1995, certain catch quotas between Member States for vessels fishing
Lithuanian export: is it time to prepare for changes? Aleksandr Izgorodin Expert
 Lithuanian export: is it time to prepare for changes? Aleksandr Izgorodin Expert Export is the main locomotive behind growth in LT economy Lithuania: change in real GDP and its components, % 78,2 71,8
ESTONIA IN THE WORLD AND IN THE EU (2015, source: FAO and Eurostat)
") ESTONIA IN THE WORLD AND IN THE EU (2015, source: FAO and Eurostat) Estonia is the EU s 16th largest producer of fisheries and 26th largest of aquaculture products. (1.000 tonnes) World EU-28 Estonia %
ESTONIA IN THE WORLD AND IN THE EU (2015, source: FAO and Eurostat) Estonia is the EU s 16th largest producer of fisheries and 26th largest of aquaculture products. (1.000 tonnes) World EU-28 Estonia %
The Socio-Economic Marine Research Unit (SEMRU) Research Note. Assessment of the effects of Brexit on Irish and EU fisheries in the NE Atlantic
 Research Note. Assessment of the effects of Brexit on Irish and EU fisheries in the NE Atlantic") The Socio-Economic Marine Research Unit (SEMRU) National University of Ireland, Galway Research Note Assessment of the effects of Brexit on and EU fisheries in the NE Atlantic Daniel Norton and Stephen
The Socio-Economic Marine Research Unit (SEMRU) National University of Ireland, Galway Research Note Assessment of the effects of Brexit on and EU fisheries in the NE Atlantic Daniel Norton and Stephen
Summary of the final report of the study "Employment in the fisheries sector: current situation (FISH/2004/4)"
") Summary of the final report of the study "Employment in the fisheries sector: current situation (FISH/2004/4)" The report presents data on employment in the fisheries sector and its three sub-sectors (fishing,
Summary of the final report of the study "Employment in the fisheries sector: current situation (FISH/2004/4)" The report presents data on employment in the fisheries sector and its three sub-sectors (fishing,
Monthly Highlights No. 2 / 2019
 Monthly Highlights No. 2 / 2019 In this issue In ember 2018, first sales value and volume grew in Italy, Lithuania, Portugal, Sweden, and the UK over ember 2017. In the same period, they dropped in Belgium,
BIM Annual. Aquaculture Survey
 2012 BIM Annual Aquaculture Survey 83% of all employment in Irish aquaculture is along the western seaboard Bord Iascaigh Mhara (BIM) the Irish seafood development agency carries out an annual survey of
Fisheries and Aquaculture in Croatia
 Fisheries and Aquaculture in Croatia The World Trade Organization (WTO) and fisheries St. Petersburg, 29 31 October 2013 CROATIA Ministry of Agriculture Directorate of Fisheries Božena Vidović, bozena.vidovic@mps.hr
Environmental signals Fisheries. policy issue indicator assessment. fishing fleet. for cod stock in the North Sea
 54 Environmental signals 22 7. Fisheries policy issue indicator assessment reducing overcapacity of the European fishing fleet reducing overfishing implementing the recovery plan for cod stock in the North
Monthly Highlights No. 11 / 2018
 Monthly Highlights No. 11 / 2018 In this issue In ober 2018, first sales value and volume grew in Denmark, Estonia, Latvia, the Netherlands, Norway, Portugal, and the UK over ober 2017. In the same period,
UK Seafood Industry Sources : Nielsen ScanTrack & HomeScan MAT , NPD Crest MAT Dec 2014, Marine Management Organisation, Cefas Weymouth
 UK Seafood Industry 2014 Sources : Nielsen ScanTrack & HomeScan MAT 03.01.15, NPD Crest MAT Dec 2014, Marine Management Organisation, Cefas Weymouth UK consumer purchased 6.33bn of seafood in 2014 +3.3%
Salmon Market Analysis 2007
 Salmon Market Analysis 2007 April 2008 Systemizing the World of Aquaculture and Fisheries Industriveien 18, NO-6517 Kristiansund N Norway Tel.: +47 71 68 33 00 Fax: +47 71 68 33 01 E-mail: mail@kontali.no
OCEAN2012 Fish Dependence Day - UK
 OCEAN2012 Fish Dependence Day - UK Europeans are now so dependent on fish products originating from external waters that half the fish they consume are sourced outside the EU Fish dependence: The EU s
2 Bivalves: Global production and trade trends
 2 Bivalves: Global production and trade trends S. Pawiro The international trade in bivalves (shellfish) is very much regionalized. Few countries are able to penetrate distant markets outside their regions,
FINLAND IN THE WORLD AND IN THE EU (2015, source: FAO and Eurostat) FISHING FLEET (2015, source: JRC and Annual Economic Report)
 FISHING FLEET (2015, source: JRC and Annual Economic Report)") FINLAND IN THE WORLD AND IN THE EU (05, source: FAO and Eurostat) Finland is the EU s th largest producer of fisheries and 4th largest of aquaculture products. (000 tonnes) World EU-8 Finland % World %
FINLAND IN THE WORLD AND IN THE EU (05, source: FAO and Eurostat) Finland is the EU s th largest producer of fisheries and 4th largest of aquaculture products. (000 tonnes) World EU-8 Finland % World %
Fishery. Fishing vessels (Dept. of Finance)
") Fishery Fishing vessels (Dept. of Finance) The Newfoundland and Labrador fishery recorded a difficult year in 29 due to low market prices, continued pressure from low-cost producers, and an appreciating
Fishery Fishing vessels (Dept. of Finance) The Newfoundland and Labrador fishery recorded a difficult year in 29 due to low market prices, continued pressure from low-cost producers, and an appreciating
AREA TOTALS OECD Composite Leading Indicators. OECD Total. OECD + Major 6 Non Member Countries. Major Five Asia. Major Seven.
 Reference series Composite leading indicators OECD Composite Leading Indicators AREA TOTALS 7-03- 19 OECD Total 19 OECD + Major 6 Non Member Countries 19 Major Seven 19 Major Five Asia 19 Euro area 19
Sector Trend Analysis Fish and Seafood Trends In China
 MARKET ACCESS SECRETARIAT Global Analysis Report Sector Trend Analysis Fish and Seafood Trends In China March 2017 REPORT CONTENT SUMMARY This report looks to highlight the fish and seafood imports into
Inside Germany Seafood Trade
 International Markets Bureau MARKET INDICATOR REPORT AUGUST 2012 Inside Germany Seafood Trade Inside Germany Seafood Trade TRADE SUMMARY Fish and seafood in Germany is an expanding market that relies heavily
BIM Guidance Note for Seafood Retailers. Labelling Requirements for Sale of Seafood
 BIM Guidance Note for Seafood Retailers Labelling Requirements for Sale of Seafood 1. Non-prepacked fishery and aquaculture products The following requirements apply to fishery and aquaculture products
Posting of workers in the European Union and EFTA countries : Report on A1 portable documents issued in 2010 and 2011
 EUROPEAN COMMISSION Employment, Social Affairs and Inclusion DG Analysis, Evaluation, External Relations Employment Analysis Posting of workers in the European Union and EFTA countries : Report on A1 portable
Sector Trend Analysis Crustaceans Trends In Spain
 MARKET ACCESS SECRETARIAT Global Analysis Report Sector Trend Analysis Crustaceans Trends In Spain June 2017 Executive summary According to the Market Assessment of Opportunities and Challenges in the
Contents. Norwegian seafood production consumption and export 2. Fisheries and catches 8. Aquaculture 22. Research and innovation 30
 7 8 9 10 11 12 13 14 1 15 16 17 18 19 20 21 22 23 24 25 26 27 28 29 30 31 32 33 34 35 36 Facts about Fisheries and Aquaculture 2008 www.government.no Contents Norwegian seafood production consumption and
Groundfish was purchased during this reporting period (Indicate amounts in table below) Groundfish was not purchased during this reporting period
 Groundfish was not purchased during this reporting period") NOVA SCOTIA FISH BUYERS MONTHLY PURCHASING REPORT IMPORTANT THIS REPORT IS DUE ON THE SECOND FRIDAY FOLLOWING EACH REPORTING MONTH Company/Individual s Name: Licence Number Month Reported Instructions
NOVA SCOTIA FISH BUYERS MONTHLY PURCHASING REPORT IMPORTANT THIS REPORT IS DUE ON THE SECOND FRIDAY FOLLOWING EACH REPORTING MONTH Company/Individual s Name: Licence Number Month Reported Instructions
Information Submitted by Parties on Fishing Effort b) Sweden
 Sweden") 15 th ASCOBANS Advisory Committee Meeting Document AC15/Doc.16 (P) UN Campus, Bonn, Germany, 31 March-3 April 2008 Dist. 31 March 2008 Agenda Item 14.3 Implementation of the ASCOBANS Triennial Work Plan
15 th ASCOBANS Advisory Committee Meeting Document AC15/Doc.16 (P) UN Campus, Bonn, Germany, 31 March-3 April 2008 Dist. 31 March 2008 Agenda Item 14.3 Implementation of the ASCOBANS Triennial Work Plan
Beer statistics edition. The Brewers of Europe
 Beer statistics 2017 edition The Brewers of Europe Beer statistics 2017 edition The Brewers of Europe December 2017 ISBN 978-2-9601382-9-0 EAN 9782960138290 1 TABLE OF CONTENTS Foreword by President
Seafood Consumer Buying Behaviour and Future Trends. Food Conference and Showcase, 29 th March 2017 Dr Lynn Gilmore, Seafish
 Seafood Consumer Buying Behaviour and Future Trends Food Conference and Showcase, 29 th March 2017 Dr Lynn Gilmore, Seafish Who am I and what does Seafish do? Marine Biologist working with the seafood
BIM Annual. Aquaculture Survey
 2014 BIM Annual Aquaculture Survey OVERVIEW Bord Iascaigh Mhara (BIM) the Irish seafood development agency carries out an annual survey of all licensed aquaculture producers within the Republic of Ireland.
Beer statistics edition. The Brewers of Europe
 Beer statistics 2016 edition The Brewers of Europe Beer statistics 2016 edition The Brewers of Europe November 2016 ISBN 978-2-9601382-7-6 EAN 9782960138276 1 TABLE OF CONTENTS Foreword by President
I. World trade in Overview
 I. Table I.1 Growth in the volume of world merchandise exports and production by major product group, 1995-3 ( change) 1995-21 22 23 World merchandise exports 7. -.5 3. 4.5 Agricultural products 3.5 2.5
Workpackage 9: Bioanalysis Ireland
 AQCESS (Q5RS-2-35): Workpackage 9: Bioanalysis Workpackage 9: Bioanalysis Ireland Coastal & Marine Resources Centre, Environmental Research Institute, University College Cork, Ireland. Trish Clayton September
More Food, More Jobs and More Money in the UK. Oceana s Recipe for Fish Recovery
 More Food, More Jobs and More Money in the UK Oceana s Recipe for Fish Recovery Overview The United Kingdom (UK) is a global fishing nation and a major player in fisheries in Europe. However, fisheries
L 57/10 Official Journal of the European Union
 L 57/10 Official Journal of the European Union 2.3.2011 COMMISSION REGULATION (EU) No 202/2011 of 1 March 2011 amending Annex I to Council Regulation (EC) No 1005/2008 as regards the definition of fishery
Guidance Note: The Labelling of Fish and Aquaculture Products according. to the European Communities (Labelling of Fishery and Aquaculture Products)
") 7 G U I DA N C E N OT E The Labelling of Fish and Aquaculture Products according to the European Communities (Labelling of Fishery and Aquaculture Products) Regulations, 2003 (S.I. No. 320 of 2003) Revision
7 G U I DA N C E N OT E The Labelling of Fish and Aquaculture Products according to the European Communities (Labelling of Fishery and Aquaculture Products) Regulations, 2003 (S.I. No. 320 of 2003) Revision
The Socio Economic Impact of Recreational Angling within South East Ireland
 The Socio Economic Impact of Recreational Angling within South East Ireland The Business of Recreational Angling in Ireland Total direct spending on Irish recreational angling amounts to 555 million. Out
The Seafood Guide. A comprehensive guide to fish and shellfish available in the UK. The Seafood Guide
 The Seafood Guide A comprehensive guide to fish and shellfish available in the UK The Seafood Guide 1 With thanks to CJ Jackson, Billingsgate Seafood Training School Jose Souto, Westminster Kingsway College
(Non-legislative acts) REGULATIONS
 REGULATIONS") 10.8.2010 Official Journal of the European Union L 209/1 II (Non-legislative acts) REGULATIONS COUNCIL REGULATION (EU) No 712/2010 of 26 July 2010 amending Regulation (EU) No 53/2010 as regards certain
10.8.2010 Official Journal of the European Union L 209/1 II (Non-legislative acts) REGULATIONS COUNCIL REGULATION (EU) No 712/2010 of 26 July 2010 amending Regulation (EU) No 53/2010 as regards certain
Monthly Highlights No. 1 / 2018
 Monthly Highlights No. 1 / 2018 In this issue Between uary ember 2017 and uary ember 2016, Belgium, Italy, and Latvia saw growth in first-sales value and volume. The increase in volume was particularly
Københavns Universitet. Calculations of Danish prices of unprocessed seafood Nielsen, Max. Publication date: 2000
 university of copenhagen Københavns Universitet Calculations of Danish prices of unprocessed seafood Nielsen, Max Publication date: 2000 Document Version Publisher's PDF, also known as Version of record
THE WORLD COMPETITIVENESS SCOREBOARD 2011
 THE WORLD COMPETITIVENESS SCOREBOARD 2011 98.557 94.063 92.588 92.011 90.782 90.219 89.259 87.824 86.475 86.418 86.313 85.707 84.380 84.120 81.629 81.619 81.100 80.278 79.799 78.499 77.599 77.101 76.827
NEW COMMERCIAL VEHICLE REGISTRATIONS EUROPEAN UNION 1. July and August 2017
 PRESS EMBARGO: NEW COMMERCIAL VEHICLE REGISTRATIONS EUROPEAN UNION 1 July and August 2017 Next press release: Tuesday 24 October 2017 1 Data for Malta unavailable Page 1 of 12 Commercial vehicle registrations:
LATVIA IN THE WORLD AND IN THE EU (2015, source: FAO and Eurostat) FISHING FLEET (2015, source: JRC and Annual Economic Report)
 FISHING FLEET (2015, source: JRC and Annual Economic Report)") LATVIA IN THE WORLD AND IN THE EU (2015, source: FAO and Eurostat) Latvia is the EU s 13th largest producer of fisheries and 21st largest of aquaculture products. (1.000 tonnes) World EU-28 Latvia % World
LATVIA IN THE WORLD AND IN THE EU (2015, source: FAO and Eurostat) Latvia is the EU s 13th largest producer of fisheries and 21st largest of aquaculture products. (1.000 tonnes) World EU-28 Latvia % World
SPAIN IN THE WORLD AND IN THE EU (2015, source: FAO and Eurostat)
") SPAIN IN THE WORLD AND IN THE EU (2015, source: FAO and Eurostat) Spain is the EU s largest producer for fisheries and for aquaculture products. (1.000 tonnes) World EU-28 Spain % world % EU-28 Catches
SPAIN IN THE WORLD AND IN THE EU (2015, source: FAO and Eurostat) Spain is the EU s largest producer for fisheries and for aquaculture products. (1.000 tonnes) World EU-28 Spain % world % EU-28 Catches
UK SEA FISHERIES STATISTICS 2011
 UK Sea Fisheries Statistics 211 UK SEA FISHERIES STATISTICS 211 Editors Matthew Elliott, Jodie Hargreaves and Sarah Pilgrim Statistics and Analysis Team Guy Ellis Stefan Reade Lorraine Williams Kevin
Trends in Scottish Fish Stocks 2018
 Port Arthur, Scalloway, Shetland, ZE1 UN, Scotland, UK Tel: +44 ()1595 772 Fax: +44 ()1595 7721 Email: info@nafc.uhi.ac.uk Web: www.nafc.ac.uk Trends in Scottish Fish Stocks 218 Ian R. Napier 14 th September
DG AGRI DASHBOARD: CITRUS FRUIT Last update:
 14 000 12 000 10 000 8 000 6 000 4 000 2 000 0 1996 1997 1998 1999 2000 2001 2002 2003 2004 2005 2006 2007 2008 2009 2010 2011 2012 2013 2014 2015 2016 Small citrus (group mandarines): clementines, satsumas
Architecture - the Market
 2 Architecture - the Market Architect: Ibelings van Tilburg architecten Project: De Karel Doorman Winner of the BNA Building of the Year 2013 Public Prize Photographer: Ossip van Duivenbode Place: Rotterdam
Monthly Highlights No. 2 / 2018
 Monthly Highlights No. 2 / 2018 In this issue Between January ember 2017 and January ember 2016, Belgium, Latvia and Norway grew in first-sales volume. The increase in volume was the highest for Norway
Seafood Industry Factsheet
 Seafood Industry Factsheet Cod Market overview: Cod The three species, tuna salmon and cod dominate the UK retail seafood market by volume. This report summarises both the UK imports and exports of cod
Contents. Norwegian seafood production consumption and export 2. Fisheries and catches 8. Aquaculture 22. Research and innovation 30
 Facts about Fisheries and Aquaculture 2009 www.government.no Contents Norwegian seafood production consumption and export 2 Fisheries and catches 8 Aquaculture 22 Research and innovation 30 Norwegian seafood
ANNEX II. REFERRED TO IN PARAGRAPH (c) OF ARTICLE 4 FISH AND OTHER MARINE PRODUCTS
 OF ARTICLE 4 FISH AND OTHER MARINE PRODUCTS") ANNEX II REFERRED TO IN PARAGRAPH (c) OF ARTICLE 4 FISH AND OTHER MARINE PRODUCTS ANNEX II REFERRED TO IN PARAGRAPH (c) OF ARTICLE 4 FISH AND OTHER MARINE PRODUCTS Article 1 Fish and other marine products
ANNEX II REFERRED TO IN PARAGRAPH (c) OF ARTICLE 4 FISH AND OTHER MARINE PRODUCTS ANNEX II REFERRED TO IN PARAGRAPH (c) OF ARTICLE 4 FISH AND OTHER MARINE PRODUCTS Article 1 Fish and other marine products
Trends in Scottish Fish Stocks 2017
 Port Arthur, Scalloway, Shetland, ZE1 0UN, Scotland, UK Tel: +44 (0)1595 772000 Fax: +44 (0)1595 772001 Email: info@nafc.uhi.ac.uk Web: www.nafc.ac.uk Trends in Scottish Fish Stocks 2017 Ian R. Napier
DEVELOPMENT AID AT A GLANCE
 DEVELOPMENT AID AT A GLANCE STATISTICS BY REGION 5. EUROPE 2018 edition All the data in this report are available at: http://www.oecd.org/dac/financing-sustainable-development/ 5.1. ODA TO EUROPE - SUMMARY
EUROPEAN RIDERS, HORSES AND SHOWS AT THE FEI 2012
 EUROPEAN RIDERS, HORSES AND SHOWS AT THE FEI 2012 Presentation to the EEF Sports Forum Essen, 21 st March 2013 1 Introduction In 2010 the Small Nations Working Group started this study, to know exactly
COMMISSION OF THE EUROPEAN COMMUNITIES
 COMMISSION OF THE EUROPEAN COMMUNITIES Brussels, 3.3.1997 COM(97) 82 final 97/64 (ACC) Proposal for a COUNCIL REGULATION (EC) opening and providing for the administration of Community tariff quotas and
BRITISH COLUMBIA SEAFOOD INDUSTRY YEAR IN REVIEW
 BRITISH COLUMBIA SEAFOOD INDUSTRY YEAR IN REVIEW ii British Columbia Seafood Industry 2012 YEAR IN REVIEW TABLE of CONTENTS A MESSAGE from The B.C. MINISTER of AGRICULTURE....1 British Columbia SEAFOOD
The economic value of the EU shipping industry. Andrew P Goodwin
 The economic value of the EU shipping industry Andrew P Goodwin 2 nd April 2014 Introduction Shipping is a vital facilitator of world trade 135 % Increase in world GDP in the last two decades 180 % Increase
MONTHLY HIGHLIGHTS CONTENTS
 p ISSN 2314-9671 No.4/2014 MONTHLY HIGHLIGHTS CONTENTS First sales in Europe: Coldwater shrimp and herring in Denmark Norway lobster and haddock in Sweden EU Imports Exports in 2013 Global Supply Case
Beer statistics edition. The Brewers of Europe
 Beer statistics 2015 edition The Brewers of Europe Beer statistics 2015 edition The Brewers of Europe Editor: Marlies Van de Walle October 2015 ISBN 978-2-9601382-5-2 EAN 9782960138252 1 TABLE OF CONTENTS
Western Health Care Systems: Under Pressure from Demography
 Western Health Care Systems: Under Pressure from Demography Nicholas Eberstadt Henry Wendt Chair in Political Economy American Enterprise Institute eberstadt@aei.org Presentation at Panel on Health Care
The Baltic economies: Current situation and future trends, possibilities and pitfalls
 The Baltic economies: Current situation and future trends, possibilities and pitfalls Riga, 15 October 2015 Morten Hansen Head of Economics Department, Stockholm School of Economics in Riga Member of the
The fisheries and aquaculture sector in France
 >>> Fisheries and aquaculture Key figures FranceAgriMer > April 2018 The fisheries and aquaculture sector in France Production Firms Trade Consumption SUMMARY Production page 3 France in EU-28 & in the
FLEET ECONOMIC PERFORMANCE DATASET
 FLEET ECONOMIC PERFORMANCE DATASET 28-16 Steve Lawrence Arina Motova Jennifer Russell Date: September 217 Seafish Report No: SR79 ISBN No: 978-1-91173-15-4 Copyright Seafish 217 Seafish Economics Seafish
Indicator Fact Sheet (FISH11) Catches by major species and areas
 Catches by major species and areas") Indicator Fact Sheet (FISH11) Catches by major species and areas Author: Nikos Streftaris (HCMR) and Nautilus Consultants EEA project manager: Niels Thyssen Indicator code / ID FISH11 Analysis made on
Indicator Fact Sheet (FISH11) Catches by major species and areas Author: Nikos Streftaris (HCMR) and Nautilus Consultants EEA project manager: Niels Thyssen Indicator code / ID FISH11 Analysis made on
Official Journal of the European Union REGULATIONS
 L 199/2 29.7.2017 REGULATIONS COUNCIL REGULATION (EU) 2017/1398 of 25 July 2017 amending Regulation (EU) 2017/127 as regards certain fishing opportunities THE COUNCIL OF THE EUROPEAN UNION, Having regard
Figure 1. Structure of Estonian commercial fishing and fish farming in 2011 (% of the total volume)
") Estonia FISHERIES Estonia is a sea and coastal country on the Eastern shore of the Baltic Sea. The territory of Estonia is small 45 227 km 2 ; the length of our coastline, however, is 3794 km. Good location
Estonia FISHERIES Estonia is a sea and coastal country on the Eastern shore of the Baltic Sea. The territory of Estonia is small 45 227 km 2 ; the length of our coastline, however, is 3794 km. Good location
2017 EU TOTAL ALLOWABLE CATCHES IN THE ATLANTIC AND NORTH SEA. Final TAC 2016
 Final Sandeel Norwegian waters of IV 0 pm pm Sandeel Union waters of IIa, IIIa and IV(1) 79219 pm pm Greater silver smelt Union and international waters of I and II 90 90 0,0% 90 0% Greater silver smelt
Fishery. Harvesting. Snow Crab Professional Fish Harvesters Certification Board
 Fishery T he Newfoundland and Labrador fishery faced several challenges in 8, including continued competition from low-cost producers, as well as high fuel costs and unfavourable exchange rates for most