496 EIFAC/ICES WGEEL Report 2008
|
|
|
- Preston Peters
- 5 years ago
- Views:
Transcription
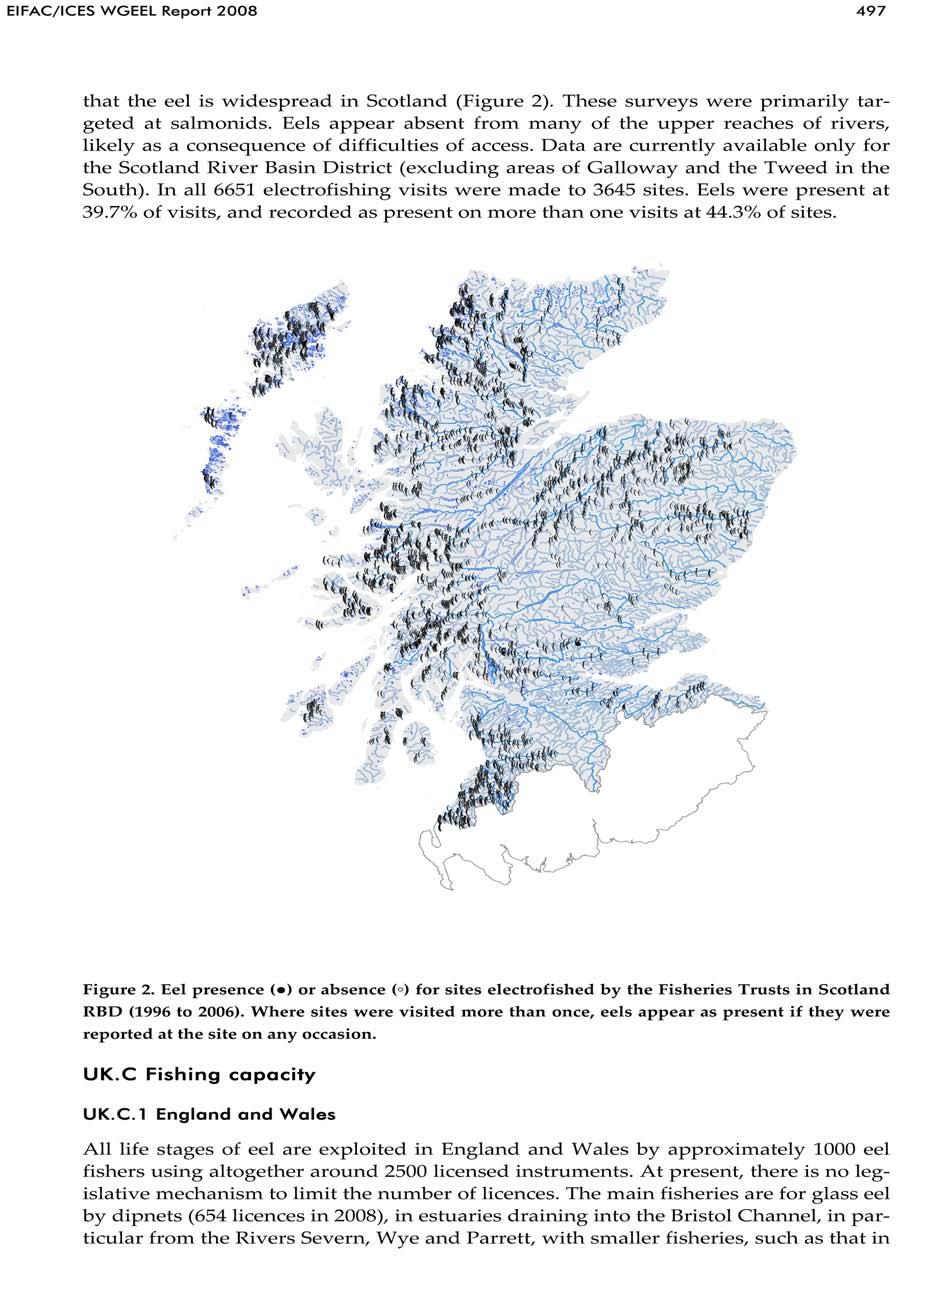
1 496 EIFAC/ICES WGEEL Report 2008 creates a barrier to upstream juvenile eel migration, for onward stocking into L. Neagh. Elvers are also trapped at the same location and stocked into the Lough. The yellow eel fishery (May September, 5 days a week) supports boats each with a crew of two men using draft nets and baited longlines. Eels are collected and marketed centrally by the Co operative. Around 300 families derive and depend on income from the fishery. Through the Co operative, yellow eel fishers are paid the market price for their catch. Silver eels are caught in weirs in the Lower River Bann. Profit from the less labour intensive silver eel fishery sustains the management of the whole co operative venture, providing working capital for policing, marketing and stocking activity and an out of season bonus payment for yellow eel fishers at Christmas. Natural recruitment has been supplemented since 1984 by the purchase of glass eel. Approximately 77 million additional glass eel have been stocked by the LNFCS. Reviews on the fishery, its history and operation can be found in Kennedy, 1999 and Rosell et al., The cross border Erne system is comparable in size to L. Neagh and produces a fishery yield in the region of t of eels per year. Within N. Ireland, Upper and Lower Lough Erne sustain small scale and declining yellow and silver eel fisheries. Elvers are trapped at the mouth of the River Erne using ladders placed at the base of the hydroelectric facility that spans the Erne, and trucked into the Erne lake system for stocking. A comprehensive study into the structure, composition and biology of the eel fisheries on the Erne was conducted by Matthews et al., Overall policy responsibility for the supervision and protection of eel fisheries in Northern Ireland, and for the establishment and development of those fisheries rests with the Department of Culture, Arts and Leisure (DCAL). Summary of management measures for eel fisheries in Northern Ireland: Ban on glass eel fishing (other than for stocking); Trapping and transport of juveniles on the Erne system; Restricted access to the fisheries through a system of licence, permits and seasonal closures; Minimum landing sizes (30 cm, though fisheries impose voluntary 40 cm); Technical measures associated with fishing gears; Closure of the Department owned silver eel fishery on the Erne as a conservation measure; Free gaps (10%) in silver eel fishing weirs. In addition to the above, the LNFCS has in place: Trapping and transport of juveniles on the Bann; A quota system on yellow eel catch; Restocking with purchase of supplemental glass eel; Ban on the use of fykenets; Suspension of two silver eel fisheries on the Lower River Bann. UK.B.3 Distribution of eel within Scotland ( ) Electrofishing surveys by the Fisheries Trusts in Scotland (from ) indicate
2
.")


3 498 EIFAC/ICES WGEEL Report 2008 Morecambe Bay, Cumbria (Figure 3). The main fisheries for eel >300 mm are based in southern and eastern lowland England, with fykenets being the preferred instrument used for capturing yellow and silver eel (Figure 3). Eel Fishery Location Eel Fishery Location Eel Fishery Location Eel Fishery Location WFD River Basin Districts WFD River Basin Districts Main Rivers Main Rivers 80 Instruments 80 Instruments Elver Dip Nets Elver Dip Nets Fixed Elver Traps Fixed Elver Small TrapsWingless Fykes Small Wingless Winged Fykes Traps/Fykes Winged Traps/Fykes Gloucester Winged Nets Gloucester Winged Eel Trawls Nets Eel Trawls Other Fixed Traps Other Fixed Traps Figure 3. Eel and Elver Fisheries in England and Wales. Proportional size pie charts representing number of each instrument type in each WFD River Basin District. UK.C.2 Northern Ireland L. Erne Fishing capacity is measured in the number of licensed instruments (by type of gear) and is an individual activity with no regulating company. Currently there are 14 commercial fishers operating on this catchment, with 14 eel permits (11 longline and three fykenets) issued. Boat size on the Erne is restricted to 6.1 m long by 2.2 m at the widest point. Licence applications are approved by the fishery owner (DCAL) and are issued on the condition that a catch declaration is returned at the end of each year. All of these catch data are held within DCAL Inland Fisheries Division. The elver run to the River Erne is monitored by capture at a box at the tidal head and transported to upper and lower Lough Erne. Silver eel fisheries let by the State on Lower Lough Erne have been suspended since L. Neagh Lough Neagh/River Bann comprises a 400 km 2 lake based system, which produces around 95% of the total Northern Ireland eel catch. Eel fishing on L. Neagh is controlled by a Registered Company, the LNFCS who licence the fishery to 180 fishers. Around 1990, there were 200 boats fishing the Lough, but this number has steadily declined to the present day number of 80 to 90 boats as a result of an aging fisher
4 EIFAC/ICES WGEEL Report population, availability of alternative employment and falling market prices for eel. Boat size on L. Neagh is restricted to 8.6 m long and 2.7 m wide. Information on licence applications, number of boats, fishing activity, recruitment to the fishery and the catch of yellow and silver eels from L. Neagh is collected and maintained by the LNFCS with several aspects of these data spanning 40 years. This information is made available to DCAL and the Agri food and Biosciences Institute (AFBI) for scientific analysis. UK.C.3 Scotland Historically there has been no regulation of commercial eel fisheries in Scotland, no licenses were issued and there was therefore no means of collecting catch return data. There is no export of any eel product and therefore no proxy values for recruitment or home or international market trends. However, early in 2007, provision was made by the Scottish Parliament to allow for the regulation of eel fisheries if Scottish Ministers considered it necessary or expedient for eel conservation (see: introd.pdf). UK.D Fishing effort UK.D.1 England and Wales Fishing effort is not directly quantified, but annual licence sale data from the EA and predecessor agencies provide an index from which we can examine changes in apparent effort over time. Glass eels and elvers Around 1100 glass eel/elver licences (dipnets) were sold each year from 1980 to 1994, which increased rapidly to peak at nearly 2500 in 1998, declined to about 800 in 2001, and have since remained around this level (Figure 4). The rapid increase in sales of licenses in was likely as a consequence of substantial increases in the market value of glass eel from about 100/kg to over 250/kg, as a consequence of extra demands from eel farms in the Far East. Fishing activities were depressed during the 2001 Foot and Mouth Disease outbreak because of restrictions imposed on access to fishing sites and licence sales have not recovered.
5 500 EIFAC/ICES WGEEL Report 2008 Number of licenses Year Figure 4. Number of licenses sold per year across England and Wales for dipnet fishing for glass eel, 1980 to 2008 (Agency data). Yellow and silver eels Environment Agency sales of yellow and silver eel licences (combined) have varied from around 1100 to 2900 over the period , with highest sales in the mid 1980s, mid 1990s and again in 2005 to 2007 (mean 2622) (Figure 5). Licence sales Year Figure 5. Number of licenses sold per year across England and Wales for yellow and silver eel fishing, 1983 to 2007 (Agency data). UK.D.2 Northern Ireland The capture of glass eel and elvers is prohibited in N. Ireland, except under licence from DCAL to help with upstream migration past in river obstacles on the River Bann. In N. Ireland, fykenets, longlines and draft nets are authorized fishing instruments for yellow eels. Silver eels are trapped at fixed weirs using large coghill nets (the 2007
6 EIFAC/ICES WGEEL Report UK Report: Appendix 1 provides a description of net and trap methods). L. Erne Fifteen longline licences were issued in 2007 and each fisher is allowed to fish a longline not exceeding 1200 hooks of a standard hook size 23 mm long, 7.75 m gape. Four fykenet licences were issued in 2007 and a fisher is not eligible to fish fykenets and longlines simultaneously. Each fykenet licence permits the holder to use 60 fykenets (not exceeding 7.3 m in length, a trap at each end on which no hoop shall exceed 50 cm in diameter and no mesh size of less than 12 mm knot to knot). There is no obligation for a fisher to use a logbook to record his catch, but it is a condition of the licence to report the total catch at the end of each year. Catches are sold to travelling eel dealers who are also required to make annual returns. The small silver eel fishery in the Erne River has been suspended since L. Neagh Glass eel fishing on the River Bann for stocking into L. Neagh is carried out using a drag net with an area of 0.94 m 2. A record of total catch per night is recorded, but not of catch per individual net. Thirty per cent of the L. Neagh yellow eel catch is derived from draft nets, the other 70% from longline fishing using a maximum of 1200 standard sized hooks baited with either earthworms, fish fry or the larvae of the flour beetle (meal worm). The fishery is run on a quota based system (normally 60 kg per boat per day) and a log is kept of each individual boat s daily (Monday Friday) catch. However, as most fishers catch their quota every day, the catch is not limited by the size of the eel population, and it is not appropriate to calculate cpue. New technologies such as hydraulic draft net haulers have been introduced over the last 10 years, thereby reducing the labour needed in the fishery. Daily catch statistics and division by method are recorded by the LNFCS. Silver eel catch is taken by three weirs at two locations using coghill nets. The number of coghill nets fished depends on weather and flow conditions in the river at the time of fishing and normally ranges from 2 4 nets per fishing night. The record of nightly catch is only obtained if the catch is processed and sold the following day, otherwise catches are retained in tanks, processed and sold as and when market conditions are more favourable, and therefore a single catch record may be a total for several nights fishing. UK.D.3 Scotland Glass eel fisheries and recruitment In survey in the early 1970s no elver fisheries were recorded in the Scottish Highlands and Islands (Williamson, 1976). During the mid late 1990s there was a short period of exploitation, in response to the rise in demand and thus prices. Catches were estimated at 1 2 t per annum, mainly from the North West and Outer Hebrides. Present levels of exploitation are unknown. There have been no studies of glass eel recruitment in Scotland, although there is some interest in establishing traps on some systems as a means of monitoring recruitment. Yellow eel and silver eel fisheries Commercial fisheries for yellow eels are largely based in low lying productive lochs, the eels being sold mainly to local smoke houses. There is no tradition of eel consumption in Scotland. During the 1960s 1970s, eel catches in Scotland were esti
7 502 EIFAC/ICES WGEEL Report 2008 mated at around t per annum. In 1989, 17 eel fisheries were operating, with catches ranging from 0.25 to t (total: 23 t) (I. McLaren, FRS, unpublished data). Correspondence with proprietors of eel fisheries in 2003 indicated a catch of less than 2 3 t per annum, chiefly yellow eels, with silver eels contributing less than 100 kg, mostly from traps in mill races. Although there are few comprehensive records, data for one silver eel fishery demonstrate a 90% decline in catches between the early 1990s and 2002, although a yellow eel fishery was established in the upstream loch during the same period. The last known commercial yellow and silver eel fishery in Scotland ceased operation in late 2006, and today, catches of silver eels are largely destined for research purposes. It is concluded that eel exploitation in Scotland is at its lowest level in the recent past, with fishing for silver eels and glass eels/elvers in particular being less than a few hundred kg per annum. Fisheries for yellow eels probably amount to little more than 2 t per annum. UK.E Catches and landings UK.E.1 England and Wales Glass eels and elvers The glass eel/elver catch reported to the Environment Agency for 2008 (0.23 t) is the lowest on record since 1972, and continues the very low trend since 2001 (Figure 6, Table 1). In comparison, reported catches in the 1970s and 1980s ranged between 10 and 70 t (Figure 6, Table 1). However, comparison of these reported catch data with net exports from HM Revenue and Customs (HMRC) data for England and Wales suggests a significant level of underreporting to the Agency, by between 5 and 15 times, which varied between years. HMRC data are collected for trade in live, chilled, smoked and frozen eel separately, but the records do not distinguish between life stages. For the purposes of the analyses reported here, therefore, trade records are assigned as glass or yellow/silver eel based on their unit value: values greater than 200 per kg are classed as glass eel, those less than 10 per kg are classed as yellow and/or silver eel, and intermediate values are classed as mixed batches. Glass eel are imported into England from France and Spain throughout the winter season (typically November to March) and subsequently re exported (HMRC data). By subtracting imports from exports and adding the quantities of glass eels sold for stocking Lough Neagh in Northern Ireland, the UK catch of glass eel is estimated from the net export. Neither of these datasets is particularly robust, but they do yield useful information and provide proxy estimates of recruitment and of home and international market trends (Knights et al., 2001; Knights, 2002). Based on these HMRC data, it is estimated that the glass eel catch in England and Wales averaged 10.4 t in (Figure 6). The trade data for 2007 include a large proportion of trades with intermediate values and, therefore, it is not possible to include a robust trade figure for 2007 in the dataset. Peter Wood (UK Glass Eel) estimated that about 8 10 t of glass eel were landed across England and Wales (B. Knights, pers. comm.).
8 EIFAC/ICES WGEEL Report Catch (t) Year Figure 6. Trends in UK glass eel/elver catches reported to the Environment Agency in t (open circles), and derived from HMRC net export data (closed circles) from Both datasets demonstrate a general decreasing trend in both glass eel catches. Considerable between year variations in these data preclude meaningful analyses based on period means. A more simplistic comparison is between maximum catch levels in the late 1970s and early 1980s and minimum levels in the 2000s. This suggests that the catch reported to the Agency has declined by at least 98% and the HMRC net exports by 75% (but see Section UK.F).
9 504 EIFAC/ICES WGEEL Report 2008 Table 1. Glass eel/elver catch and cpue estimates for England and Wales, based on catch reports to the Environment Agency, and HMRC net export data, na = data not available. Note, HMRC data not available for 2007 or 2008 as a consequence of data: the 2007 HMRC data presented in the 2007 UK report were provisional, but could not be verified. Catch estimates based on Licence sales CPUE Defra/EA HMRC Nett Exports HMRC/EA Year t t No. dip-nets kg/net /net na 1303 na na na 1530 na na na na na na na 705 na na na 654 na na
10 EIFAC/ICES WGEEL Report Yellow and silver eels EA returns for yellow and silver eel fisheries (combined) for 2007 (18.9 t) continue at the low level since 2001 (Table 2, Figure 7). As with the glass eel/elver reported catches, however, these reported data are likely underestimates (by ~ 6 times) of the true catch when compared with net exports from HMRC data for England and Wales. The annual HMRC net export of yellow and silver eels has averaged t over the period Catch (t) Year Figure 7. Trends in yellow and silver eel catches (t) reported to the Environment Agency (open circles), and derived from HMRC net export data (closed circles) from 1979 to 2007.
11 506 EIFAC/ICES WGEEL Report 2008 Table 2. Yellow and silver eel catch and effort data for England and Wales, The 2007 Environment Agency data have been revised, but the provisional HMRC data for 2007 could not be verified and therefore have been removed. No catch data available for 2008 at the time of publication. Note column headings have been revised to clarify data sources. Catch estimates based on Export trade value Licence sales CPUE HMRC Nett Exports EA catch returns Total value Unit No. of licensed gears HMRC/EA Year (t) (t) 000 /kg kg/gear /gear na na na na na na na na 2818 na na UK.E.2 Northern Ireland Glass eels and elvers Glass eel recruitment to Lough Neagh from 1936 to 1946 was provided by the Toome eel fishery (Figure 8). The LNFCS has provided data since the 1960s. Glass eel and elver supply to Lough Neagh, as recorded by the capture in traps and nets in the Bann Estuary, for transport
12 EIFAC/ICES WGEEL Report to Lough Neagh, is given in Table 3 and Figure 8. In 2006 and 2007, these were 444 kg and 456 kg, respectively, a 50% reduction on 2005 (930 kg) and around 65% of the previous 5 year average (691 kg). As in most years since 1984, glass eels were bought from the Severn Estuary to stock L. Neagh (Figure 8). Recruitment in 2008 has reached a new historical minimum with only 24 kg (approx eels) caught. To supplement this 428 kg of elvers (1.3 million individuals) were purchased from the River Severn. Glass eel / Elver supply to Lough Neagh Supplemental bought in Natural supply captured R Bann Input in Kg Figure 8. Elver supply to Lough Neagh, 1936 to 2008.
13 508 EIFAC/ICES WGEEL Report 2008 Table 3. Lough Neagh eel fishery data, The natural elver run from 1960 to 1964 was , , , and kg, respectively. Year Natural elver run (kg) Additional elvers bought from UK (kg) Emigrating silver eel catch (kg) Yellow eel catch (kg) Total yield (kg) na na na
14 EIFAC/ICES WGEEL Report The elver run to the Erne in 2007 was 189 kg and 32.8 kg in 2008, monitored by capture at a box at the tidal head and transported to upper and lower Lough Erne. Yellow and silver eels Annual commercial production figures (LNFCS) are divided into outputs of yellow eels (line or draft net catch) and silver eels (caught in traps in the River Bann when migrating downstream from L. Neagh) (Table 3, Figure 9). Catch in Kg Lough Neagh eel catches (Lough Neagh Fishermens Co-op Society Ltd) Yellow eel catch Silver eel catch year Figure 9. Yellow and silver eel catches Lough Neagh, 1965 to Yellow and silver eel catches in L. Neagh in 2007 amounted to 351 and 76 t, respectively, continuing the general downward trend since the late 1990s (Figure 9) associated with reducing effort in the yellow eel fishery as a function of falling boat numbers. Licences have fallen from 200 active boats in 1990 to around boats in 2007, a significant cause of the long term decline in catches and a response to alternative work/low prices available for yellow eels rather than declining stocks. Catches per boat per day in the longline and draft net fisheries continue to meet or exceed daily quotas imposed by the Co operative, implying that sufficient stocks for the number fishing in the Lough are being maintained. In 2007, a mild autumn meant that yellow eel fishing continued through until the end of October. This was responsible for the increase in yellow eel catch in 2007 compared to Sex ratio in the silver eels in 2004 to 2005 was numerically close to 1:1 male:female, but changed in 2006 to 0.37:0.63 and 2007 to 0.38:0.62 (Table 4). Taking account of differing sizes and weights of males and females, 80% of the recorded silver eel biomass is now female.
15 510 EIFAC/ICES WGEEL Report 2008 Table 4. Biological characteristics of silver eels emigrating from Lough Neagh. Note mean ages of males and females for 2005 and 2006 have been revised in light of additional data. Males Females year % mean L mean Wt mean Age % mean L mean Wt mean Age (cm) (g) (cm) (g) na na 2008 na na An annual mark recapture programme was initiated in October 2003, with the objective of estimating escapement of silver eels past the fishery (weir traps), which is subject to a trap free gap in the river channel, a three month fishing season (some silver eel movement occurs outside this season), and inefficient fishing when river flows are very high. Recaptures occur both during the year of upstream release and at least one or even two years thereafter. Maximum estimates of escapement, based on the proportion of recaptured Floy TM tagged silver eels, range from 62% to 84% during 2003 to 2006 (Table 5): no tagging was undertaken in 2007 as a consequence of the sporadic nature of the silver eel run as a consequence of a dry autumn. Table 5. Results of mark recapture estimation of silver eel escapement from the Lough Neagh fishery. No silver eels were tagged in 2007 as a consequence of the sporadic nature of autumn run. Males Females year % mean L mean Wt mean Age % mean L mean Wt mean Age (cm) (g) (cm) (g) na na 2008 na na UK.E.3 Scotland No commercial fisheries.
16 EIFAC/ICES WGEEL Report UK.F Catch per unit of effort UK.F.1 England and Wales Glass eels and elvers Trends in glass eel recruitment are likely to be better indicated by catch per unit of fishing effort (cpue) than by reported catch alone. Glass eel/elver fishing effort is not directly quantified in the UK, but annual licence sales data from the Environment Agency and predecessor agencies provide an index from which changes in effort over time can be inferred, because each licensee is likely to fish the same number of suitable tides over the short season each year. However, the variable, apparent underreporting of glass eel/elver catches to the Agency precludes a meaningful analysis of cpue from Agency data alone. Therefore, trends in cpue are examined based on net export over Agency licence sales (kg/licensed net). The HMRC data are also limited in value, because the trade statistics do not differentiate between life stages, and trade in glass eel is inferred from unit value calculations. Trends in cpue (kg/net licence sales) derived from reported catch or net exports are similar (Figure 10), at least to 1998 (correlation coefficient: 0.62). Both indices demonstrate declining trends throughout the 1980s and 1990s, similar in magnitude to those of reported catch and HMRC net exports: 98% for reported catch and 85% for net exports. In contrast, both indices demonstrate increases from 2002, by about 3 times to CPUE (kg/licence) Figure 10. Trends in UK glass eel/elver fishery catch per unit of effort, derived from HMRC net export weight (kg) against Environment Agency net licence sales (open circles), and from catch reported to the EA against net licence sales (closed circles) from 1980 to Yellow and silver eels As with glass eel/elver data, estimating cpue for English and Welsh yellow and silver eel fisheries is problematic, given concerns regarding underreporting, but indices derived from HMRC net exports or reported catches per licence sold both suggest relatively consistent cpues in the late 1980s and mid 1990s, with a decline of about 80% from then onwards (Figure 11).
17 512 EIFAC/ICES WGEEL Report CPUE (kg/licence) Year Figure 11. Trends in England and Wales yellow/silver eel fishery catch per unit of effort, derived from HMRC net export weight (kg) against Environment Agency net licence sales (open circles), and from catch reported to the EA against net licence sales (closed circles) from 1983 to Note that licenses are required for each fixed trap and for each net end, and therefore the number sold is considerably greater than the number of licensed fishers. UK.F.2 Northern Ireland Glass eels and elvers No standardized cpue data are available for glass eel fishing (for stocking) on the River Bann. Yellow and silver eels A quota based catch management system on L. Neagh means it is not possible to calculate cpue. Daily catch statistics and division by method are recorded by the LNFCS. UK.F.3 Scotland No commercial fisheries. UK.G Scientific surveys of the stock UK.G.1 England and Wales Environment Agency eel-specific and multispecies surveys The EA conducts annual multispecies surveys of fish populations in rivers, lakes and estuaries throughout England and Wales. Prior to 2001, eels were not a target species for these surveys, but some records of presence/absence or more quantitative data are available. From 2001 to 2006, at least the presence/absence of eels was recorded on all surveys (see Figure 1). From 2007 onwards, all Environment Agency surveys will collect length, and possibly weight, measurements for all eel caught. More intensive, eel specific electrofishing surveys, and silver eel or elver trapping exercises have been conducted in a number of basins (Figure 12), yielding more accu

18 EIFAC/ICES WGEEL Report rate estimates of survey site population biomass, density and length frequency distributions over a number of years. In addition, fykenet surveys have been conducted in still waters and estuaries, yielding length and weight data for eels along with catch per unit of effort indices. Figure 12. Regional distribution of eel specific monitoring by the Environment Agency in England and Wales. UK.G.2 Northern Ireland The North South Shared Aquatic Resource (NSSHARE) Project covers three river basin districts; North Western International River Basin District, Neagh Bann International River Basin District and North Eastern River Basin District. One of the main outcomes of the project is to develop ecological classification tools for assessing water quality under the Water Framework Directive using three biological quality elements; aquatic flora, benthic invertebrate fauna and fish fauna. The fish fauna biological quality element must include species composition, abundance and age structure. Eels are recorded as part of the species composition element (see Table 6). The NSSHARE Fish in Lakes team was set up to develop an ecological classification tool using fish fauna, suitable for monitoring and classification of lakes under the requirements of the Water Framework Directive. This involved developing a standard
19 514 EIFAC/ICES WGEEL Report 2008 methodology for sampling fish populations in lakes, with which in all 83 lakes have been surveyed to date. The ecological classification tool is currently under development. Table 6. Eel population data for Northern Ireland lakes from surveys conducted during the development of ecological classification tools for the WFD, No eels were caught in loughs Big Dog, Carrick, Carrickavoy, Corry, Drumacrittin, Formal, Lea (Knox Lake), Legane, Nadarra, Natroey, Portmore, Rossole, Roughan and Skale. Length (cm) Weight (g) Age (y) Range Lake Catch CPUE Mean Range Mean Range Mean (no.) Ballydoolagh (1) Beg (1) Brantry Castlehume Castlewellan (11) Clea Lakes A (14) Corranny (1) Creeve (4) Erne Upper (5) Glencreawan Lough Knockballymore Lough A (1) Lisleitrim Macnean Lower (8) (4) Macnean Upper Meenameen Nalughoge Sand (2) Tullybrick L. Erne There are no surveys of the L. Erne eel population at present. L. Neagh Eels are sampled regularly as part of an ongoing long term research programme, which investigates all life stages throughout the year. Glass eel/elvers are sampled twice a month from their arrival in February/March through to August. A sample of 50 juveniles is removed for morphometric analysis, calculation of number per kg and length frequency analysis. Yellow eel catches are sampled weekly over 20 weeks (from May to September). A sample of 20 eels is chosen to reflect all size ranges caught, and analysed for age and length. In addition, the entire, ungraded landing of two fishing crew on one day each month is sampled, usually comprising eels captured by longline and a similar number by draft net, to allow comparison between methods. Every eel is meas
20 EIFAC/ICES WGEEL Report ured for length and the total number of fish captured recorded. Preliminary analysis indicates that a larger proportion of small eels (<40 cm) are captured by draft nets (34%, compared to 21.4% on longlines), and that more of the larger eels (>60 cm) are taken on longlines (Figure 13). The results also indicated there was significant variation in the numbers of small eels captured by long lining dependent upon bait type (earthworm caught more) and hook size (larger hook caught fewer small eels). Undersized eels are returned to the Lough. Silver eel catches are sampled over a 12 week period (from October to December). At weekly intervals, the previous night s haul averaging at least 400 fish is measured for length, and 10 eels are chosen to reflect all size ranges caught, and analysed for age. Draft nets Long lines Figure 13. Length frequency distributions for L. Neagh yellow eels caught via longlines and draft nets. UK.G.3 Scotland The FRS Freshwater Laboratory has two long term, but intermittent, datasets on yellow eels, both from small, upland tributaries. FRS has operated a fish trap on the Girnock Burn, a tributary of the River Dee in Northeast Scotland, since the mid 1960s. The Girnock Burn rises at an altitude of 500 m and flows northwards, joining the River Dee some 70 km above the tidal limit. The stream channel has a largely open aspect, and is typically <5 m wide, depths ranging from a few cm to 0.5 m. Annual trap catch and electrofishing data were collected between 1967 and 1982 and again in
21 516 EIFAC/ICES WGEEL Report and Since 2004, eels >200 mm have been PIT tagged in order to determine movements and growth. Analysis of these data (Chadwick et al., 2007) demonstrates that, in the late 1960s, the Girnock Burn eel population was composed of relatively high densities of small ( mm) males and with few females ( mm). Growth rates are currently estimated to be between 8.7 and 17.4 mm y 1, with growth occurring chiefly in summer. Small eels leave the system in late spring/early summer, larger eels in late summer/early autumn. Due to construction of a major barrier to immigration (plus the effects of recruitment declines since the 1980s), the estimated standing stock and escapement declined from 1968 to 2005 by about 80%. The mean population density declined between 1968 and 2005 from 16 to 3 eels 100 m 2, and biomass from 256 g to 71 g m 2. Thus, current densities are about 19% of the 1968 level, biomass about 28%. Biomass has probably fallen more slowly than density because the average body length has increased 11% over the 37 year time series, possibly as a consequence of lower in river densities reducing competition and density dependent mortality. The other site monitored by FRS is the Allt Coire nan Con Burn, which is situated in the Strontian region of western Scotland and drains into the River Polloch, an inflow to Loch Shiel. The catchment covers 790 ha and its altitude falls from 756 m to 10 m at the sampling point, where the river is 5 6 m wide and features riffle interspersed with glides which can be deep. Riparian vegetation at the sampling sites is predominantly mature deciduous woodland. In Table 7, data from the annual electrofishing survey demonstrate no clear evidence of declines in yellow eel densities since 1992 (source: P. Collen, unpublished data). Table 7. Relative population density of eels in electrofishing surveys in a small stream in north Argyll, Year Population density (no.s/100m 2 ) Fisheries Trust Data The establishment of Fisheries Trusts and the Scottish Fisheries Coordination Centre has allowed the coordination of a number of electrofishing surveys, which now represent the principal source of information. The earliest of these data are from 1996,
22 EIFAC/ICES WGEEL Report but spatial coverage is adequate only from 1997 onwards. It should be noted that there is considerable variation among the reports from individual Trusts in the level of detail that are recorded. Some of the data were collected with funding from Scottish Natural Heritage (SNH) and are their property. Otherwise all data are the property of the relevant Fisheries Trusts which have kindly allowed their use here. There are substantial areas of Scotland RBD for which data are not available, including the catchments of the Rivers Clyde, Don, Ythan, Nairn, Ugie, as well as the entire islands of Skye, Orkney and Shetland, (these latter two island groups are omitted from subsequent maps for reasons of space and clarity). There are a number of problems with the interpretation of these data: 1. The surveys were not specifically targeted at eels; instead the eel data were a bycatch of a sampling programme aimed at assessing salmonid densities. 2. Even directly targeted at the species, electrofishing for eels is an inexact science, and density estimates should be regarded with caution. Observed densities are likely to be size and habitat (in particular substrate) dependent, and no attempt has been made to account for this. 3. The dataset is composed of different types of electrofishing: multi pass (22.9%), single pass (69.5%), and timed fishing without delineated areas (7.6%). 4. In most cases the numbers of eels caught were not recorded directly, but allotted to abundance classes (Absent, 1 10, , ). For some Trust areas the exact number of eels was routinely reported. In others the exact number was only occasionally reported, with potential for bias (of unknown size or direction). 5. In most cases the size of eels was not reported. For some Trust areas length of eels was routinely reported, in others the lengths of eels were only occasionally reported, with potential for bias (of unknown size or direction). 6. Where eel lengths were recorded individual eels were sometimes described as silver, but it is not known how often (if ever) the lengths of eels was recorded and their maturity status overlooked. In an attempt to standardize these disparate fishing methods, the following assumptions were made: Based on the average decline in capture rates of eels in three run fishing (where they were recorded), the likely result of a single pass fishing was calculated for the remaining three pass and two pass fishings; Based on a negative binomial distribution of the observed data, the mean value expected for each class of eel number (1 10, , ) was calculated. This number, or the exact number if recorded, was used to calculate density by dividing it by the reported area of the site fished. For timed fishings (<4% of the total fishings), the area was estimated from the time fished (based on the relationship between time and area fished from a subsample of sites in which both parameters were recorded). A few timed fishings (n = 445 or 0.67% of fishings) had neither time nor area associated with them, and these were assumed to have the same area as the mean of the other timed fishings. In this way all the fishings were con
23 518 EIFAC/ICES WGEEL Report 2008 verted to the same units (number of eels per 100m 2 in a single pass fishing). There are a number of assumptions inherent in the treatment of the data described above: That the sample for which capture rates of eels on all three runs were reported were representative of all fishings (i.e. that the decline in capture rates is constant across fishers and habitats); That the sites for which exact numbers were recorded were representative of sites for which the number of eels was estimated only to a class size category; That timed fishings for which no time was recorded were of a similar duration to average duration of timed fishings where the time was recorded; That effort was constant over the survey period. All these assumptions are likely to be violated to some extent, compromising the confidence that can be placed in the density estimates and strong confidence can only be placed in the presence/absence data. The data demonstrate no consistent trend in reported eel abundance class over the period (Figure 14). In contrast, an analysis of the percentage of sites where eels were absent on the adjacent Solway Tweed RBD suggests this increased from 12% in , to 24% in , to 44% and to 46% (B. Knights, unpublished data), but it is possible that this represents a change in methodology in the early 1990s rather than a genuine decline in distribution. % eel abundance class 100% 80% 60% 40% 20% 0% % Abundant % Frequent % Occasional % Absent Figure 14. Eel presence/absence and abundance classes in Scotland RBD, All site visits (n=6651) are included, number of site visits and contribution of different areas to the Scotland RBD total varies; in 1996 only 19 sites were fished, all on one river (the Spey). Abundance classes as follows: Absent 0 eels, Occasional =1 10 eels, Frequent = eels, Abundant = >100 eels. There was considerable spatial variation in the distribution of eels, with eels being much less likely to be absent from sites in the northwestern parts of Scotland RBD. In the Western Isles, West Sutherland and Wester Ross, eels were absent at approximately 20% of sites, compared with 55% in Scotland RBD as a whole (Figure 15). This probably reflects the proximity of the northwest of Scotland RBD to the continental shelf (Knights et al., 2001).
24 EIFAC/ICES WGEEL Report Eel abundance class frequency (%) 100% 80% 60% 40% 20% 0% Abundant Frequent Occasional Absent Ayrshire Lomond Argyll Lochaber Wester Ross West Sutherland Western Isles Naver Thurso Berriedale Kyle of Sutherland Conon Beauly Ness Findhorn Spey Deveron Dee South Esk Tay Forth Figure 15. Percentage frequency of eel abundance class at electrofishing sites in various rivers or districts of Scotland RBD. Areas are arranged clockwise around the coast, from Ayrshire in the southwest, to Naver and Thurso on the north coast then down the east coast to the Forth region. Where more than one visit to a site was made, the highest recorded abundance was used. In general, eels were more widely distributed and more common in the northwest and north. There is weak evidence that eel densities in Scotland may have declined since 2002 (Figure 16). It is possible that this is a spatial rather than a temporal effect, however, because the distribution of sites differed between years, both locally and regionally. A similar pattern of decline in recent years was evident for several individual regions of Scotland RDB for which data were available, but was not universal; in particular West Sutherland in the North West revealed a trend for an increase in population density (Figure 17).
25 520 EIFAC/ICES WGEEL Report Eel density (n 100m -2 ) Date Figure 16. Eel density (log scale) from all electrofishing sites between 1997 and Smoothing spline fitted with 3 degrees of freedom suggests a slight decline in density post 2002, however, different regions of Scotland RBD are not equally represented in each year. Wester Ross Western Isles Eel density (n 100m -2 ) Lochaber Spey West Sutherland Conon Findhorn Forth Argyll Ayrshire Beauly Day since 1 Jan 1997 Figure 17. Temporal variation in eel population density at regional level within Scotland RBD, Sites where eels are absent do not appear in the graphs, but the lines (smoothing splines with 3 degrees of freedom) are fitted with them.
26 EIFAC/ICES WGEEL Report UK.H Catch composition by age and length UK.H.1 England and Wales Catch are only reported by stage (glass/elver, yellow, eel), so there are no data on catch composition by age and length. UK.H.2 Northern Ireland See above. UK.H.3 Scotland No commercial fisheries. UK.I. Other biological sampling UK.I.1 Reported by catchment or River Basin? UK.I.2 Length and weight and growth (DCR) England and Wales As of 2007, measurements of length are now collected from all eel captured by the Environment Agency during eel specific and multispecies surveys. In all 637 lengths were collected in The 2008 sampling programme is ongoing at the time this report was produced. The Defra funded study, The Development and Implementation of Biological Reference Points for the Management of the European Eel (SFO236), included the sampling of eels from surveys of none basins across England and Wales during 2002 to 2006 (Bark et al., 2007; in press). Length and weight were recorded, with a subsample of 1400 eels sexed and aged. Northern Ireland In addition to the glass eel sampling at the River Bann, other sampling is undertaken at several other coastal sites in N. Ireland: the Foyle Estuary, the River Lagan (Belfast), River Quoile (Strangford Lough) and Carlingford Lough Estuary. L. Erne There are no surveys on going on L. Erne. L. Neagh The monitoring programmes listed above also measure many other biological parameters within the fishery stock and samples removed from it. The glass eel/elvers are monitored for the presence of Anguillicola crassus. The weekly samples of yellow eels are also examined for weight, sex, age, stomach contents, the prevalence and intensity of A. crassus, and gastrointestinal endohelminths. The undersized yellow eels (<40 cm long) captured via longline are returned to the Lough at the point of capture with hooks in place. Every month 100 undersized eels are sampled at the fishery, their hook location recorded and in conjunction with catch composition analysis; attempts are made to quantify possible losses to the fishery through hook mortality.
27 522 EIFAC/ICES WGEEL Report 2008 The weekly silver eel samples are also analysed for weight, sex, age, stomach contents, the prevalence and intensity of A. crassus, and gastrointestinal endohelminths. Sex ratio of the silver eel population is also estimated by counting the numbers of individuals contained in the graded 15 kg boxes which the fishery then sell. Eels are graded as small (males) and large (females), based on a length sex key derived from previous sampling. Scotland An un coordinated effort to determine the presence/absence of Anguillicola crassus is currently being undertaken in Scotland. Some Fisheries Trusts collect data on the length of eels captured during routine electrofishing surveys targeted at salmonids (1136 eels have been measured since 1996). UK.I.3 Parasites England and Wales Anguillicola crassus is now considered ubiquitous throughout the UK (Nigel Hewlett, Environment Agency National Fisheries Laboratory, pers. comm.). Foster and Block, 2006 reported infestation levels in eels (~300 mm total length) sampled across the Sussex area in ranging from 60% to 88% (regional mean 72%). Similar levels of infestation were reported for eels in Kent rivers in (Cave, 2000). Northern Ireland L. Erne Anguillicola crassus was first recorded in the swimbladders of eels in Ireland during an extensive fykenet survey of the Erne system in July Of 328 yellow eels examined in 1998, 24 (7.3%) were infected, with a mean intensity of 4.3 worms per eel. Infected eels were only recorded in southern Lower Lough Erne and northern Upper Lough Erne. Examination of 432 yellow eels in 1999, revealed an increase in both mean intensity (6.7 worms per eel) and prevalence (9.9%) of A. crassus. The range of the parasite had also increased, with infected eels recorded from the lower reaches of the Erne, 30 km downstream of the original area of infection. Monthly samples of silver eels taken by commercial nets near the outlet of the Erne during October December 1998 and 1999 confirmed active migrants contained the parasite. Prevalence and mean intensity among silver eels rose from 4.5% and 2.5 worms per silver eel in 1998 to 15% and 8.6 worms per eel in 1999 (Evans et al., 2001). L. Neagh A. crassus was found in Lough Neagh yellow and silver eels for the first time in 2003, and its spread has been monitored via the analysis of a total of 1100 yellow and 400 silver eels from 2003 to Samples were stored in 70% alcohol and in the lab; swimbladders were examined macroscopically for the presence of pre adult and adult A. crassus, but not for larval A. crassus. Recorded prevalence and mean intensity in yellow eels rose from 24.4% and 2.2 in 2003 to 69% and 3.6, and to 100% and 7.7 in 2004 and 2005, respectively. However, the same infection parameters recorded for silver eel were significantly different, with almost 60% infected in 2003 rising to almost 90% in By 2005, 100% of yellow and silver eels were infected with A. crassus (Evans and Rosell, 2006). In 2007 the prevalence of A. crassus in both yellow and silver eels had fallen to 70% and 76%, respectively.
River Severn and Estuary
 Case Study Description River Severn and Estuary Alan Walker, Mike Pawson Centre for Environment, Fisheries and Aquaculture Science (Cefas) Lowestoft Laboratory Pakefield Road, Lowestoft, Suffolk NR33 0HT.
Advice June 2014
 5.3.23 Advice June 2014 ECOREGION STOCK Celtic Sea and West of Scotland Plaice in Division VIIa (Irish Sea) Advice for 2015 Based on ICES approach to data-limited stocks, ICES advises that catches should
Dauphin Lake Fishery. Status of Walleye Stocks and Conservation Measures
 Dauphin Lake Fishery Status of Walleye Stocks and Conservation Measures Date: December, 21 Dauphin Lake Fishery Status of Walleye Stocks and Conservation Measures Background: Walleye stocks in Dauphin
Know Your River Conwy Salmon & Sea Trout Catchment Summary
 Know Your River Conwy Salmon & Sea Trout Catchment Summary Introduction This report describes the status of the salmon and sea trout populations in the Conwy catchment. Bringing together data from rod
Report on a Salmon Survey in the Waterford Estuary in 2010
 Report on a Salmon Survey in the Waterford Estuary in 2010 Dr. P. Gargan Inland Fisheries Ireland June 2011 1 Contents 1. Introduction 3 2. Proposal for a Survey in Waterford estuary in 2010 3 3. Survey
West Coast Rock Lobster. Description of sector. History of the fishery: Catch history
 West Coast Rock Lobster Description of sector History of the fishery: The commercial harvesting of West Coast rock lobster commenced in the late 1800s, and peaked in the early 1950s, yielding an annual
Advice October 2013
 5.4.21.3 Advice October 213 ECOREGION Celtic Sea and West of Scotland STOCK Nephrops on Porcupine Bank (FU 16) Advice for 214 ICES advises on the basis of the MSY approach that catches from FU 16 in 214
Fish Survey Report and Stocking Advice for Loch Milton. (Loch a Mhuilinn), May 2011
, May 2011") Fish Survey Report and Stocking Advice for Loch Milton (Loch a Mhuilinn), May 2011 Jonah Tosney Freshwater Fisheries Biologist Wester Ross Fisheries Trust 1 Loch Milton (Loch a Mhuilinn) Fish Survey Report
Fish Survey Report and Stocking Advice for Loch Milton (Loch a Mhuilinn), May 2011 Jonah Tosney Freshwater Fisheries Biologist Wester Ross Fisheries Trust 1 Loch Milton (Loch a Mhuilinn) Fish Survey Report
The Success of Lough Neagh Eels;
 The Success of Lough Neagh Eels; A Priest, a Plan and a PGI Dr. Derek Evans Senior Fisheries Scientist FAEB SEG meeting Venice 29-30 th May 2012 an apology... SEG had originally invited a member of the
Eel management in Sweden Håkan Westerberg. Fiskeriverket
 Eel management in Sweden Håkan Westerberg Fiskeriverket The Swedish eel fishery Yellow eel on the west-coast Silver eel in the Baltic and inland lakes Predominantly coastal fishery (85 % of landings) Commercial
Know Your River - River Ogmore Salmon and Sea Trout Catchment Summary
 Know Your River - River Ogmore Salmon and Sea Trout Catchment Summary Introduction This report describes the status of the salmon and sea trout populations in the Ogmore catchments. Bringing together data
Know Your River - Clwyd Salmon & Sea Trout Catchment Summary
 Know Your River - Clwyd Salmon & Sea Trout Catchment Summary Introduction This report describes the status of the salmon and sea trout populations in the Clwyd catchment. Bringing together data from rod
Spurdog (Squalus acanthias) in the Northeast Atlantic
 in the Northeast Atlantic") ICES Advice on fishing opportunities, catch, and effort Northeast Atlantic Published 11 October 2016 9.3.17 Spurdog (Squalus acanthias) in the Northeast Atlantic ICES stock advice ICES advises that when
ICES Advice on fishing opportunities, catch, and effort Northeast Atlantic Published 11 October 2016 9.3.17 Spurdog (Squalus acanthias) in the Northeast Atlantic ICES stock advice ICES advises that when
Know Your River Conwy Salmon & Sea Trout Catchment Summary
 Know Your River Conwy Salmon & Sea Trout Catchment Summary Introduction This report describes the status of the salmon and sea trout populations in the Conwy catchment. Bringing together data from rod
Conservation Limits and Management Targets
 Conservation Limits and Management Targets Setting conservation limits The use of conservation limits (CLs) in England and Wales (E&W) has developed in line with the requirement of ICES and NASCO to set
Plaice (Pleuronectes platessa) in Division 7.e (western English Channel)
 in Division 7.e (western English Channel)") Celtic Seas and Greater North Sea ecoregions Published 30 June 2016 Version 2: 15 May 2017 5.3.51 Plaice (Pleuronectes platessa) in Division 7.e (western English Channel) ICES stock advice ICES advises
Celtic Seas and Greater North Sea ecoregions Published 30 June 2016 Version 2: 15 May 2017 5.3.51 Plaice (Pleuronectes platessa) in Division 7.e (western English Channel) ICES stock advice ICES advises
North-East Atlantic Commission NEA(18)05. Mixed-Stock Fisheries. (Tabled by the European Union)
05. Mixed-Stock Fisheries. (Tabled by the European Union)") North-East Atlantic Commission NEA(18)05 Mixed-Stock Fisheries (Tabled by the European Union) NEA(18)05 Mixed-Stock Fisheries (Tabled by the European Union) 1) Brief description of existing MSFs EU-Finland
North-East Atlantic Commission NEA(18)05 Mixed-Stock Fisheries (Tabled by the European Union) NEA(18)05 Mixed-Stock Fisheries (Tabled by the European Union) 1) Brief description of existing MSFs EU-Finland
Why has the cod stock recovered in the North Sea?
 Why has the cod stock recovered in the North Sea? Summary The expansion of European fisheries during the 1970s and 1980s resulted in high fishing pressure on stocks of cod, haddock, whiting and saithe
ATLANTIC SALMON NEWFOUNDLAND AND LABRADOR, SALMON FISHING AREAS 1-14B. The Fisheries. Newfoundland Region Stock Status Report D2-01
 Fisheries Pêches and Oceans et Océans DFO Science Newfoundland Region Stock Status Report D2-01 ATLANTIC SALMON NEWFOUNDLAND AND LABRADOR, SALMON FISHING AREAS 1-14B Background There are 15 Atlantic salmon
5. purse seines 3 000
 Sea Bass Q and A Latest News What have the 28 Member States decided on 2 July? The EU has today taken another step to protect sea bass. The 28 EU member states agreed to the Commission's proposal to increase
COMMISSION OF THE EUROPEAN COMMUNITIES. Proposal for a COUNCIL REGULATION. establishing measures for the recovery of the stock of European Eel.
 COMMISSION OF THE EUROPEAN COMMUNITIES Brussels, 6.10.2005 COM(2005) 472 final 2005/0201 (CNS) Proposal for a COUNCIL REGULATION establishing measures for the recovery of the stock of European Eel. (presented
Know Your River Dee Salmon & Sea Trout Catchment Summary
 Know Your River Dee Salmon & Sea Trout Catchment Summary Introduction This report describes the status of the salmon and sea trout populations in the Dee catchment. Bringing together data from rod catches,
10.4 Advice May 2014
 10.4 Advice May 2014 ECOREGION STOCK North Atlantic Atlantic salmon at West Greenland Advice for 2014 The previous advice provided by ICES (2012) indicated that there were no mixed-stock fishery catch
Salmon population monitoring in England and Wales (E&W): Informing stock assessment and management
: Informing stock assessment and management") Salmon population monitoring in England and Wales (E&W): Informing stock assessment and management Salmon population monitoring in England and Wales (E&W): Informing stock assessment and management Fisheries
Salmon population monitoring in England and Wales (E&W): Informing stock assessment and management Salmon population monitoring in England and Wales (E&W): Informing stock assessment and management Fisheries
Stillwater Status Report: Lough Muck, County Donegal
 LOUGHS AGENCY OF THE FOYLE CARLINGFORD AND IRISH LIGHTS COMMISSION Stillwater Status Report: Lough Muck, County Donegal Stillwater Fish Stock Survey Loughs Agency of the Foyle Carlingford and Irish Lights
Advice October 2014
 5.3.21.3 Advice October 2014 ECOREGION Celtic Sea and West of Scotland STOCK Nephrops on Porcupine Bank (FU 16) Advice for 2015 ICES advises on the basis of the MSY approach that catches from FU 16 in
ICES Advice on fishing opportunities, catch, and effort Celtic Seas and Greater North Sea ecoregions Published 30 June 2016
 ICES Advice on fishing opportunities, catch, and effort Celtic Seas and Greater North Sea ecoregions Published 30 June 2016 5.3.57 Sea bass (Dicentrarchus labrax) in divisions 4.b c, 7.a, and 7.d h (central
Overview 10/8/2015. October Pelagic Advice Pelagic AC 7 October 2015
 October Pelagic Advice Pelagic AC 7 October 2015 John Simmonds ICES ACOM Vice Chair Overview WG 1 Blue whiting NSS herring North Sea horse makerel WG 2 Stocks Northeast Atlantic mackerel Western horse
Norway lobster (Nephrops norvegicus) in Division 4.a, Functional Unit 7 (northern North Sea, Fladen Ground)
 in Division 4.a, Functional Unit 7 (northern North Sea, Fladen Ground)") ICES Advice on fishing opportunities, catch, and effort Greater North Sea Ecoregion Published 11 November 2016 6.3.27 (update) Norway lobster (Nephrops norvegicus) in Division 4.a, Functional Unit 7 (northern
ICES Advice on fishing opportunities, catch, and effort Greater North Sea Ecoregion Published 11 November 2016 6.3.27 (update) Norway lobster (Nephrops norvegicus) in Division 4.a, Functional Unit 7 (northern
STOCK STATUS OF SOUTHERN BLUEFIN TUNA
 7 th Expert Consultation on Indian Ocean Tunas, Victoria, Seychelles, 9-14 November, 1998 STOCK STATUS OF SOUTHERN BLUEFIN TUNA Tsuji, S. 1 Introduction The Commission for the Conservation of Southern
Stillwater Status Report: Lough Muck, County Tyrone
 LOUGHS AGENCY OF THE FOYLE CARLINGFORD AND IRISH LIGHTS COMMISSION Stillwater Status Report: Lough Muck, County Tyrone Stillwater Fish Stock Survey Loughs Agency of the Foyle Carlingford and Irish Lights
ICES Advice on fishing opportunities, catch, and effort Celtic Seas and Greater North Sea Ecoregions Published 24 October 2017
 ICES Advice on fishing opportunities, catch, and effort Celtic Seas and Greater North Sea Ecoregions Published 24 October 2017 DOI: 10.17895/ices.pub.3334 Seabass (Dicentrarchus labrax) in divisions 4.b
Norway lobster (Nephrops norvegicus) in Division 4.b, Functional Unit 6 (central North Sea, Farn Deeps)
 in Division 4.b, Functional Unit 6 (central North Sea, Farn Deeps)") ICES Advice on fishing opportunities, catch, and effort Greater North Sea Ecoregion Published 14 November 2017 DOI: 10.17895/ices.pub.3524 Norway lobster (Nephrops norvegicus) in Division 4.b, Functional
ICES Advice on fishing opportunities, catch, and effort Greater North Sea Ecoregion Published 14 November 2017 DOI: 10.17895/ices.pub.3524 Norway lobster (Nephrops norvegicus) in Division 4.b, Functional
Fisheries Statistics Salmonid and freshwater fisheries statistics for England and Wales
 Fisheries Statistics 2000 Salmonid and freshwater fisheries statistics for England and Wales Salmonid and Freshwater Fisheries Statistics for England and Wales 1. Fisheries Statistics 1989 (out of print)
REPORT OF ICES ADVISORY COMMITTEE NORTH ATLANTIC SALMON STOCKS. NORTH ATLANTIC SALMON CONSERVATION ORGANIZATION NEAC Area
 REPORT OF ICES ADVISORY COMMITTEE ON NORTH ATLANTIC SALMON STOCKS TO NORTH ATLANTIC SALMON CONSERVATION ORGANIZATION NEAC Area CNL(14)8 Advice generated by ICES in response to terms of reference from NASCO
Monitoring of sea trout post-smolts, 2012
 Monitoring of sea trout post-smolts, 2012 A report to the West Sutherland Fisheries Trust, Report No. WSFT2/13 January 2013 Shona Marshall Fisheries Biologist West Sutherland Fisheries Trust Gardeners
2.3.1 Advice May Capelin in Subareas V and XIV and Division IIa west of 5 W (Iceland East Greenland Jan Mayen area).
.") 2.3.1 Advice May 2014 ECOREGION Iceland and East Greenland STOCK Capelin in Subareas V and XIV and Division IIa west of 5 W (Iceland East Greenland Jan Mayen area) Advice for 2014/2015 ICES advises on
2.3.1 Advice May 2014 ECOREGION Iceland and East Greenland STOCK Capelin in Subareas V and XIV and Division IIa west of 5 W (Iceland East Greenland Jan Mayen area) Advice for 2014/2015 ICES advises on
Gulf of St. Lawrence (4RST) Greenland Halibut
 Greenland Halibut") Fisheries and Oceans Science Pêches et Océans Sciences DFO Science Stock Status Report A4-3 () 52 5 48 46 Québec Nouveau-Brunswick Québec 4T 4S 4R 3Pn 4Vn Terre-Neuve 3Ps 3K 3L Gulf of St. Lawrence (4RST)
Fisheries and Oceans Science Pêches et Océans Sciences DFO Science Stock Status Report A4-3 () 52 5 48 46 Québec Nouveau-Brunswick Québec 4T 4S 4R 3Pn 4Vn Terre-Neuve 3Ps 3K 3L Gulf of St. Lawrence (4RST)
Year Avg. TAC Can Others Totals
 SKATE IN DIVISIONS 3L, 3N, 3O AND SUBDIVISION 3Ps Background There are 8 to 1 species of skate in the waters around Newfoundland. Of these, thorny skate (Raja radiata) is by far the most common, comprising
Know Your River River Afan Salmon and Sea Trout Catchment Summary
 Know Your River River Afan Salmon and Sea Trout Catchment Summary Introduction This report describes the status of the salmon and sea trout populations in the Afan catchments. Bringing together data from
ICCAT Secretariat. (10 October 2017)
") ICCAT Secretariat (10 October 2017) Bluefin tuna: Background information Managed by International Commission for the Conservation of Atlantic Tunas (ICCAT): Two stocks (mixing occurring, but extent not
ICCAT Secretariat (10 October 2017) Bluefin tuna: Background information Managed by International Commission for the Conservation of Atlantic Tunas (ICCAT): Two stocks (mixing occurring, but extent not
Advice June 2013 Version 2,
 5..37 Advice June 3 Version, 5--3 ECOREGION STOCK Celtic Sea and West of Scotland Sole in Divisions VIIf,g (Celtic Sea) Advice for ICES advises on the basis of the MSY approach that catches in should be
ICES advises that when the MSY approach is applied, catches in 2019 should be no more than tonnes.
 Advice on fishing opportunities, catch, and effort Celtic Seas, Greater North Sea, and Oceanic Northeast Atlantic ecoregions Published 29 June 2018 Version 2: 4 September 2018 https://doi.org/10.17895/ices.pub.4487
Fifth otter survey of England
 Fifth otter survey of England 2009-2010 Summary report We are The Environment Agency. It's our job to look after your environment and make it a better place for you, and for future generations. Your environment
Advice October 2014 Version 2, December-2014
 5.3.29.11 Advice October 2014 Version 2, December-2014 ECOREGION STOCK Celtic Sea and west of Scotland Undulate ray (Raja undulata) in Divisions VIId, e (English Channel) Advice for 2015 and 2016 ICES
SOUTH PACIFIC COMMISSION. TWENTY-SECOND REGIONAL TECHNICAL MEETING ON FISHERIES (Noumea, New Caledonia, 6-10 August 1990)
") Page 1 ORIGINAL : ENGLISH SOUTH PACIFIC COMMISSION TWENTY-SECOND REGIONAL TECHNICAL MEETING ON FISHERIES (Noumea, New Caledonia, 6-10 August 1990) STOCK STATUS OF SKIPJACK TUNA IN THE WESTERN TROPICAL
Page 1 ORIGINAL : ENGLISH SOUTH PACIFIC COMMISSION TWENTY-SECOND REGIONAL TECHNICAL MEETING ON FISHERIES (Noumea, New Caledonia, 6-10 August 1990) STOCK STATUS OF SKIPJACK TUNA IN THE WESTERN TROPICAL
SMOOTH HAMMERHEAD SHARK (HHS)
") SMOOTH HAMMERHEAD SHARK (HHS) (Sphyrna zygaena) HHS1 1. FISHERY SUMMARY Smooth hammerhead sharks (Sphyrna zygaena) are not currently managed under the QMS. No assigned fishing allowances exist. However,
SMOOTH HAMMERHEAD SHARK (HHS) (Sphyrna zygaena) HHS1 1. FISHERY SUMMARY Smooth hammerhead sharks (Sphyrna zygaena) are not currently managed under the QMS. No assigned fishing allowances exist. However,
ELECTRO-FISHING REPORT 2016 UPPER TWEED
 ELECTRO-FISHING REPORT 2016 UPPER TWEED The electro-fishing programme carried out each summer by The Tweed Foundation is part of our management plan, which details the information that is required to manage
North Carolina Aquaculture Plan for American Eel Management Board August 2 nd, 2017
 North Carolina Aquaculture Plan for 2018 American Eel Management Board August 2 nd, 2017 Background Outline NC Aquaculture Plan: 2017 season results NC Proposed Aquaculture Plan for 2018 and beyond Highlight
STUDY PERFORMANCE REPORT
 STUDY PERFORMANCE REPORT State: Michigan Project No.: F-53-R-14 Study No.: 486 Title: Assessment of lake trout populations in Michigan s waters of Lake Michigan. Period Covered: April 1, 1997 to March
ATLANTIC STATES MARINE FISHERIES COMMISSION. Winter Flounder Abundance and Biomass Indices from State Fishery-Independent Surveys
 ATLANTIC STATES MARINE FISHERIES COMMISSION Winter Flounder Abundance and Biomass Indices from State Fishery-Independent Surveys Technical Committee Report to the Winter Flounder Management Board February
Council CNL(15)26. Annual Progress Report on Actions Taken Under Implementation Plans for the Calendar Year EU Spain (Navarra)
26. Annual Progress Report on Actions Taken Under Implementation Plans for the Calendar Year EU Spain (Navarra)") Agenda Item 5.1 For Information Council CNL(15)26 Annual Progress Report on s Taken Under Implementation Plans for the Calendar Year 2014 EU Spain (Navarra) CNL(15)26 Annual Progress Report on s taken
Agenda Item 5.1 For Information Council CNL(15)26 Annual Progress Report on s Taken Under Implementation Plans for the Calendar Year 2014 EU Spain (Navarra) CNL(15)26 Annual Progress Report on s taken
Management advisory for the Bay of Bengal hilsa fishery June 2012
 Page1 Management advisory for the Bay of Bengal hilsa fishery June 2012 What is the BOBLME RFMAC The BOBLME Project is supporting countries to implement an ecosystem approach to fisheries management of
Council CNL(16)30. Annual Progress Report on Actions Taken Under the Implementation Plan for the Calendar Year EU - Spain (Navarra)
30. Annual Progress Report on Actions Taken Under the Implementation Plan for the Calendar Year EU - Spain (Navarra)") Agenda item 6.1 For information Council CNL(16)30 Annual Progress Report on Actions Taken Under the Implementation Plan for the Calendar Year 2015 EU - Spain (Navarra) CNL(16)30 Annual Progress Report
Agenda item 6.1 For information Council CNL(16)30 Annual Progress Report on Actions Taken Under the Implementation Plan for the Calendar Year 2015 EU - Spain (Navarra) CNL(16)30 Annual Progress Report
10.3 Advice May 2014
 1.3 Advice May 214 ECOREGION STOCK North Atlantic Atlantic salmon from North America Advice for 214 Because the NASCO Framework of Indicators of North American stocks for 213 (run in January 214) did not
Cedar Lake Comprehensive Survey Report Steve Hogler and Steve Surendonk WDNR-Mishicot
 Cedar Lake- 2006 Comprehensive Survey Report Steve Hogler and Steve Surendonk WDNR-Mishicot ABSTRACT Cedar Lake is a 142 acre lake located in the southwest corner of Manitowoc County. It is a seepage lake
The Orkney Creel Fishery
 The Orkney Creel Fishery Fishery Improvement Project Work Plan Michael Bell, Kate Walker 2/21/2013 Introduction This work plan has been developed as part of the Fishery Improvement Project (FIP) of the
The Fishery. Newfoundland Region Stock Status Report D2-05
 Fisheries Pêches and Oceans et Océans DFO Science Newfoundland Region Stock Status Report D2-05 ATLANTIC SALMON INSULAR NEWFOUNDLAND, SOUTHWEST COAST, SALMON FISHING AREAS 12-13 Background Salmon Fishing
Know Your River River Loughor Salmon and Sea Trout Catchment Summary
 Know Your River River Loughor Salmon and Sea Trout Catchment Summary Introduction This report describes the status of the salmon and sea trout populations in the Loughor catchments. Bringing together data
Paper prepared by the Secretariat
 COMMISSION FOURTEENTH REGULAR SESSION Manila, Philippines 3 7 December 2017 REFERENCE DOCUMENT FOR REVIEW OF CMM 2005-03 AND FOR THE DEVELOPMENT OF HARVEST STRATEGIES UNDER CMM 2014-06 North Pacific Albacore
Lecture 2: Sampling gear. Ichthyology 3
 Lecture 2: Sampling gear Ichthyology 3 Total samples Total samples Draining Gives a total sample but this is often not practical. Kariega estuary study on salt marshes. Explosives Extremely effective sampling
Know Your River - Ogwen Salmon & Sea Trout Catchment Summary
 Know Your River - Ogwen Salmon & Sea Trout Catchment Summary Introduction This report describes the status of the salmon and sea trout populations in the Ogwen catchment. Bringing together data from rod
Fishery Report 2017: Dissostichus spp. (Subarea 48.2)
") Fishery Report 2017: Dissostichus spp. (Subarea 48.2) FISHERY REPORT The map above shows the management areas within the CAMLR Convention Area, the specific region related to this report is shaded. Throughout
Fishery Report 2017: Dissostichus spp. (Subarea 48.2) FISHERY REPORT The map above shows the management areas within the CAMLR Convention Area, the specific region related to this report is shaded. Throughout
Saithe (Pollachius virens) in subareas 4 and 6, and in Division 3.a (North Sea, Rockall and West of Scotland, Skagerrak and Kattegat)
 in subareas 4 and 6, and in Division 3.a (North Sea, Rockall and West of Scotland, Skagerrak and Kattegat)") ICES Advice on fishing opportunities, catch, and effort Celtic Seas, Faroes, and Greater North Sea Ecoregions Published 30 June 2017 DOI: 10.17895/ices.pub.3206 Saithe (Pollachius virens) in subareas 4
ICES Advice on fishing opportunities, catch, and effort Celtic Seas, Faroes, and Greater North Sea Ecoregions Published 30 June 2017 DOI: 10.17895/ices.pub.3206 Saithe (Pollachius virens) in subareas 4
ASMFC Stock Assessment Overview: Red Drum
 Purpose The purpose of this document is to improve the understanding and transparency of the Commission s stock assessment process and results. It is the first of several that will be developed throughout
Holman Char Fishing Plan
 Holman Char Fishing Plan 2001-2004 Fisheries and Oceans Canada Northwest Territories Fishery Regulations that apply to subsistence fisheries for Holman area char: 1) Nets must be checked every 30 hours
3.4.3 Advice June Barents Sea and Norwegian Sea Cod in Subareas I and II (Norwegian coastal waters cod)
") 3.4.3 Advice June 2013 ECOREGION STOCK Barents Sea and Norwegian Sea Cod in Subareas I and II (Norwegian coastal waters cod) Advice for 2014 ICES advises on the basis of the Norwegian rebuilding plan,
3.4.3 Advice June 2013 ECOREGION STOCK Barents Sea and Norwegian Sea Cod in Subareas I and II (Norwegian coastal waters cod) Advice for 2014 ICES advises on the basis of the Norwegian rebuilding plan,
ICES advice on fishing opportunities. ICES advises that when the MSY approach is applied, total removals in 2018 should be no more than 880 tonnes.
 ICES Advice on fishing opportunities, catch, and effort Celtic Seas and Greater North Sea ecoregions bss.27.4bc7ad-h Published 29 June 2018 Version 2: 2 July 2018 https://doi.org/10.17895/ices.pub.4472
ASMFC Stock Assessment Overview: Red Drum
 Introduction This document presents a summary of the 217 stock assessments for red drum. These assessments were initially conducted through the Southeast Data, Assessment and Review (SEDAR) process using
Agenda Item Summary BACKGROUND. Public Involvement ISSUE ANALYSIS. Attachment 1
 Agenda Item Summary Attachment BACKGROUND Between 996 and 03 white sturgeon fisheries in the Columbia River downstream from Bonneville Dam were managed under a series of management accords between the
Council CNL(11)35. Annual Report on Actions Taken Under Implementation Plans. EU - France
35. Annual Report on Actions Taken Under Implementation Plans. EU - France") Agenda Item 6.1 For Information Council CNL(11)35 Annual Report on Actions Taken Under Implementation Plans EU - France Annual Report on actions taken under Implementation Plans for the Calendar Year
Agenda Item 6.1 For Information Council CNL(11)35 Annual Report on Actions Taken Under Implementation Plans EU - France Annual Report on actions taken under Implementation Plans for the Calendar Year
Official Journal of the European Union L 248/17
 22.9.2007 Official Journal of the European Union L 248/17 COUNCIL REGULATION (EC) No 1100/2007 of 18 September 2007 establishing measures for the recovery of the stock of European eel THE COUNCIL OF THE
9.4.5 Advice September Widely distributed and migratory stocks Herring in the Northeast Atlantic (Norwegian spring-spawning herring)
") 9.4.5 Advice September 212 ECOREGION STOCK Widely distributed and migratory stocks Herring in the Northeast Atlantic (Norwegian spring-spawning herring) Advice for 213 ICES advises on the basis of the
9.4.5 Advice September 212 ECOREGION STOCK Widely distributed and migratory stocks Herring in the Northeast Atlantic (Norwegian spring-spawning herring) Advice for 213 ICES advises on the basis of the
Salmon Five Point Approach restoring salmon in England
 Salmon Five Point Approach restoring salmon in England Our Mission To restore the abundance, diversity and resilience of salmon stocks throughout England We will do this by:- a) Maximising the production
Map Showing NAFO Management Units
 Map Showing NAFO Management Units Biology Are 6 species of seals in Atlantic Canadian waters, all of which occur in Newfoundland Two Arctic Species (Ringed, Bearded) Two temperate (Grey, Harbour) Two migratory
ASSESSMENT OF THE WEST COAST OF NEWFOUNDLAND (DIVISION 4R) HERRING STOCKS IN 2011
 HERRING STOCKS IN 2011") Canadian Science Advisory Secretariat Science Advisory Report 212/24 ASSESSMENT OF THE WEST COAST OF NEWFOUNDLAND (DIVISION 4R) HERRING STOCKS IN 211 Context Figure 1. Map of unit areas of NAFO Division
Canadian Science Advisory Secretariat Science Advisory Report 212/24 ASSESSMENT OF THE WEST COAST OF NEWFOUNDLAND (DIVISION 4R) HERRING STOCKS IN 211 Context Figure 1. Map of unit areas of NAFO Division
Water Framework Directive Fish Stock Survey of Lough Meelagh, August 2014
 1 Water Framework Directive Fish Stock Survey of Lough Meelagh, August 2014 Fiona L. Kelly, Lynda Connor, Emma Morrissey, John Coyne, Rory Feeney, Ronan Matson and Kieran Rocks Inland Fisheries Ireland,
Loughs Agency Gníomhaireacht na Lochanna Factrie fur Loughs
 CONSULTATION DOCUMENT PROPOSED AMENDMENTS OF THE FOYLE AREA (CONTROL OF FISHING) REGULATIONS 1999 Foyle Area (Control of Fishing) (Amendment) Regulations 2008 INTRODUCTION This Consultation Document sets
Ad Hoc Review Group IP(06)12 FINAL. Implementation Plan. European Union (Denmark)
12 FINAL. Implementation Plan. European Union (Denmark)") Ad Hoc Review Group IP(06)12 FINAL Implementation Plan European Union (Denmark) 1. Introduction 1.1 The National management Plan for Salmon in Denmark In 2004 the Danish Forest and Nature Agency in co-operation
Ad Hoc Review Group IP(06)12 FINAL Implementation Plan European Union (Denmark) 1. Introduction 1.1 The National management Plan for Salmon in Denmark In 2004 the Danish Forest and Nature Agency in co-operation
Northeast Atlantic Mackerel, Handlines
 Northeast Atlantic Mackerel, Handlines Northeast Atlantic Mackerel, Handlines Content last updated 3rd Apr 2017 Stock: Mackerel (Scomber scombrus) in subareas 1 7 and 14, and in divisions 8.a e and 9.a
Assessment Summary Report Gulf of Mexico Red Snapper SEDAR 7
 Assessment Summary Report Gulf of Mexico Red Snapper SEDAR 7 Stock Distribution: Red snapper are found throughout the Gulf of Mexico, the Caribbean Sea, and from the U.S. Atlantic Coast to northern South
Blue cod 5 (BCO5) pot mesh size review
 pot mesh size review") Blue cod 5 (BCO5) pot mesh size review Discussion Document MPI Discussion Paper No: 2017/01 Prepared for public consultation by the Ministry for Primary Industries ISBN No: 978-1-77665-454-3 (o) ISSN No:
Blue cod 5 (BCO5) pot mesh size review Discussion Document MPI Discussion Paper No: 2017/01 Prepared for public consultation by the Ministry for Primary Industries ISBN No: 978-1-77665-454-3 (o) ISSN No:
Know Your River River Neath Salmon and Sea Trout Catchment Summary
 Know Your River River Neath Salmon and Sea Trout Catchment Summary Introduction This report describes the status of the salmon and sea trout populations in the Neath catchments. Bringing together data
Jason Blackburn, Paul Hvenegaard, Dave Jackson, Tyler Johns, Chad Judd, Scott Seward and Juanna Thompson
 Alberta Conservation Association (ACA) Date: 2014-2015 Project Name: Owl River Walleye and Aquatic Habitat Assessment Fisheries Program Manager: Peter Aku Project Leader: Tyler Johns Primary ACA staff
River Ribble Net Limitation Order and Byelaw review Brian Shields, Senior Fisheries Technical Specialist
 River Ribble Net Limitation Order and Byelaw review 217 Brian Shields, Senior Fisheries Technical Specialist Darren Bedworth, Fisheries Technical Specialist, Cumbria and Lancashire i River Ribble Net Limitation
Abundance of Steelhead and Coho Salmon in the Lagunitas Creek Drainage, Marin County, California
 scanned for KRIS Abundance of Steelhead and Coho Salmon in the Lagunitas Creek Drainage, Marin County, California Prepared for: Marin Municipal Water District 220 Nellen Drive Corte Madera, California
Note for the Usk Local Fisheries Group Meeting November Rod and net catches of Usk salmon and stock status in 2018
 Summary: Note for the Usk Local Fisheries Group Meeting November 2018 Rod and net catches of Usk salmon and stock status in 2018 Guy Mawle (guy.mawle@gmail.com) River conditions in the fishing season were
Trawl fishery management of Eastern Arabian Sea
 Trawl fishery management of Eastern Arabian Sea Dr. A.P.Dineshbabu, Central Marine Fisheries Research Institute, India Existing management practices Seasonal closure of fishery: The regulations for closed
Loughs Agency Freshwater Fisheries Monitoring Programme
 Loughs Agency Freshwater Fisheries Monitoring Programme Fisheries Coordination Centre/RAFTS Annual Biologists Meeting 29 th 30 th January 2014 Marine Scotland Freshwater Laboratory, Pitlochry Art Niven,
Explanatory Memorandum to The Conservation of Habitats and Species Regulations 2017
 Explanatory Memorandum to The Conservation of Habitats and Species Regulations 2017 This Explanatory Memorandum has been prepared by the Economy, Skills and Natural Resources Department and is laid before
ASMFC Stock Assessment Overview: Atlantic Menhaden
 Introduction This document presents a summary of the 217 Stock Assessment Update for Atlantic menhaden. The assessment is an update to the 215 Benchmark Stock Assessment that was peer reviewed by an independent
Trout stocking the science
 Trout stocking the science Godfrey Williams Environment & Business Manager (Fisheries) September 2014 Background! 2003 National Trout & Grayling strategy! Native trout waters & Wild fishery protection
During the mid-to-late 1980s
 The 2001 Yellow Perch Report by Rick Kubb During the mid-to-late 1980s the yellow perch popula tions in Lake Erie were among the highest on record. Limit catches by fishermen were extremely common during
SEAFISH ECONOMIC ANALYSIS
 SEAFISH ECONOMIC ANALYSIS UK 15m & over Scallop Fleet Area VII Economic analysis of the UK 15m and over scallop fishing fleet in ICES Area VII March 2016 AUTHORS: Arina Motova (Seafish) Hazel Curtis (Seafish)
Norway lobster (Nephrops norvegicus) in Division 4.b, Functional Unit 6 (central North Sea, Farn Deeps)
 in Division 4.b, Functional Unit 6 (central North Sea, Farn Deeps)") ICES Advice on fishing opportunities, catch, and effort Greater North Sea Ecoregion Published 14 November 2018 https://doi.org/10.17895/ices.pub.4619 Norway lobster (Nephrops norvegicus) in Division 4.b,
ICES Advice on fishing opportunities, catch, and effort Greater North Sea Ecoregion Published 14 November 2018 https://doi.org/10.17895/ices.pub.4619 Norway lobster (Nephrops norvegicus) in Division 4.b,
Inshore wrasse pot fishery What are the issues?
 Our Position - Summary Devon Wildlife Trust is calling for the immediate ban on live capture of all wrasse species in the South West from within Marine Protected Areas. Wrasse are being captured live from
Eastern and South Shore Nova Scotia Lobster LFAs The Fishery. DFO Atlantic Fisheries Stock Status Report 96/117E.
 Maritimes Region DFO Atlantic Fisheries Stock Status Report 96/117E Eastern and South Shore Nova Scotia Lobster LFAs 31-33 Background Lobsters first entering the fishery in LFAs 31, 32, and 33 are probably
Know Your River - Clwyd Salmon & Sea Trout Catchment Summary
 Know Your River - Clwyd Salmon & Sea Trout Catchment Summary Introduction This report describes the status of the salmon and sea trout populations in the Clwyd catchment. Bringing together data from rod
We would also like to thank Dr. Martin O Grady (CFB) and No. 3 Operational Wing, Irish Air Corps (Aer Chór na héireann) for the aerial photographs.
 and No. 3 Operational Wing, Irish Air Corps (Aer Chór na héireann) for the aerial photographs.") ACKNOWLEDGEMENTS The authors wish to gratefully acknowledge the help and co-operation of the acting CEO Dr. Milton Matthews and staff of the Northern Regional Fisheries Board. The authors would also like
ACKNOWLEDGEMENTS The authors wish to gratefully acknowledge the help and co-operation of the acting CEO Dr. Milton Matthews and staff of the Northern Regional Fisheries Board. The authors would also like
SUMMARY OF ICES 2009 ADVICE FOR PELAGIC SPECIES incl Blue whiting, capelin, herring, Norway pout, sandeel and sprat
 SUMMARY OF ICES ADVICE FOR PELAGIC SPECIES incl Blue whiting, capelin, herring, Norway pout, BLUE WHITING Blue whiting combined stock Sub-areas I-IX, XII and XIV Status of stock in October 543,043 Due