Aquatic Monitoring Report
|
|
|
- Calvin Blair
- 5 years ago
- Views:
Transcription


1 2011 Aquatic Monitoring Report What we do on the land is mirrored in the water Working In Partnership: Report No.: MR
2 ACKNOWLEDGEMENTS Contributors to the 2011 Aquatic Monitoring Report include: Dan Moore Ian Kelsey Heather Brooks Ashley Ayre Jade Laycock Dylan Pfaff Philip McLaren Central Lake Ontario Conservation Authority Central Lake Ontario Conservation Authority Central Lake Ontario Conservation Authority Aquatic Monitoring Assistant, CLOCA Aquatic Monitoring Assistant, CLOCA Aquatic Monitoring Assistant, CLOCA Aquatic Monitoring Assistant, CLOCA Special thanks W. Laycock Aquatic Monitoring Volunteer Matt Langmuir Aquatic Monitoring Volunteer Sara Rice Aquatic Monitoring Volunteer Brian McPhail Aquatic Monitoring Volunteer Emily Noel Aquatic Monitoring Volunteer Paul Finigan Ontario Power Generation Margo Sloan Ontario Power Generation Rachel Pettifer Sir Sanford Fleming College work placement volunteer Meghan R. Sir Sanford Fleming College work placement volunteer Chris Mahone Ontario Ministry of the Environment Steve Petro Ontario Ministry of the Environment Correct citation of this publication: (CLOCA, MR) Central Lake Ontario Conservation Authority. Aquatic Monitoring Report, 2012.
3 TABLE OF CONTENTS 1.0 Introduction Spawning Survey Introduction Results (Spring) Bowmanville Creek Bennett Creek Corbett Creek Darlington Creek Gold Point Creek Harmony Creek Lynde Creek Oshawa Creek Pringle Creek Robinson Creek Tooley Creek Soper Creek Results (Fall) Bowmanville Creek Oshawa Creek Pringle Creek Soper Creek Biological Water Quality Introduction Results OBBN Sampling Water Temperature Introduction Results Bowmanville Creek Bennett Creek Corbett Creek Darlington Creek Farewell and Harmony Creeks Gold Point Creek Lynde Creek Oshawa Creek Osbourne Creek Pringle Creek Robinson Creek Soper Creek...23 Central Lake Ontario Conservation Authority Aquatic Monitoring Report 2011 i
4 Tooley Creek Temperature monitoring methodology Fisheries Sampling (Streams) Introduction OSAP Monitoring Results Bowmanville Creek watershed Farewell Creek watershed Gold Point Creek watershed Lynde Creek watershed Osbourne Creek watershed Oshawa Creek watershed Robinson Creek watershed Soper Creek watershed Tooley Creek watershed Annual Long-term Monitoring Sites overview Black Creek BL Bowmanville Creek BWDJ Farewell Creek FA Lynde Creek LA Oshawa Creek OA Soper Creek SB OSAP Training Course Fisheries Sampling (Coastal Wetlands) Introduction Durham Results Lynde Creek Marsh Whitby Harbour Wetland Complex Corbett Creek Marsh Pumphouse Marsh Oshawa Creek Coastal Wetland Complex Oshawa Second Marsh McLaughlin Bay Marsh Westside Marsh Bowmanville Marsh Wilmot Creek Marsh Port Newcastle Marsh Frenchman s Bay Marsh Rouge River Marsh Carruthers Creek Marsh Duffins Creek Marsh Hydro Marsh Bay of Quinte RAP Introduction...54 ii Aquatic Monitoring Report 2011 Central Lake Ontario Conservation Authority
5 6.3.2 Results Fisheries Related Research Partnerships Non-native Aquatic Species Guide to Eating Ontario Sport Fish ( Edition) About the guide Contaminants in Ontario sport fish Fishing Regulations and Enforcement Overview Report a Violation Recommendations References Appendix I Spawning Surveys Appendix II Biological Water Quality Appendix III Stream Temperature Appendix IV Fisheries Sampling (Stream) Appendix V Fisheries Sampling (Coastal Wetland) Appendix VI Climate Trends (Environment Canada, 2011) American Eel Central Lake Ontario Conservation Authority Aquatic Monitoring Report 2011 iii
6 LIST OF TABLES Table 1: Spawning periods for selected southern Ontario fishes... 3 Table 2: Summary of %EPT scores from new sites sampled in 2011 by CLOCA for benthic invertebrates using the OBBN protocol. Scores are calculated by averaging the %EPT for Riffle 1, Riffle 2, and Pool 1 for each site...13 Table 3: Durham Region coastal wetlands Table 4: Six metrics used in DRCWMP IBI Table 5: Summary of 2011 Spring Spawning Survey observations Table 6: Percent EPT and Family Richness for OBBN sites sampled in 2011 including their historical results if applicable Table 7: Summary of temperature logger data collected from CLOCA jurisdiction during 2011 with comparison to data when available Table 8: Number of fish species and individuals caught at OSAP sites during 2011 sampling compared to historical sampling results (when available) Table 9: Number of fish species and individuals caught at OSAP sites during 2011 sampling compared to historical sampling results (where available) con t Table 10: Number of fish species and individuals caught at OSAP sites during 2011 sampling compared to historical sampling results (where available) con t.: Table 11: Number of fish species and individuals caught a long-term annual monitoring OSAP sites during 2011 sampling compared to historical sampling results (where available) Table 12: Number of fish and individuals caught at BWDJ in 2011 compared to historical results Table 13: Number of species caught at OSAP Training Course sites within Oshawa Creek watershed in 2011 compared to historical results (where applicable) Table 14: Number of fish and species caught at CLOCA coastal wetlands from Table 15: Number of fish and species caught at CLOCA coastal wetlands from con'd Table 16: Number of fish and species caught at GRCA coastal wetlands from Table 17: Number of fish and species caught at TRCA coastal wetlands from Table 18: Number of fish and species caught at TRCA coastal wetlands from Table 19: Number of fish and species caught at Quinte coastal wetlands during 2011 sampling compared to historical sampling results (where available) Table 20: IBI results of DRCWMP Fish Sampling from Table 21: Average IBI score for all wetlands sampled within in each jurisdictional area (Ganaraska Region CA, Central Lake Ontario CA, Toronto Region CA, Quinte) per year. Years may vary in the number of wetlands sampled due to water levels or other uncontrollable conditions iv Aquatic Monitoring Report 2011 Central Lake Ontario Conservation Authority
7 LIST OF FIGURES Figure 1: Location of CLOCA Jurisdiction (highlighted in green) Figure 2: CLOCA Jurisdiction... 2 Figure 3: Location of 2011 spring migratory Rainbow Trout and White sucker observations Figure 4: Summary of %EPT averaged per site (Riffle 1, Pool 1, Riffle 2) per year to determine trend data. Site is BOWOB03 located in Long Sault Conservation Area Figure 5: Percent EPT from OBBN site locations sampled during Figure 6: Attributes of one of the temperature logger models used by CLOCA Figure 7: Location and thermal classification of stream temperature loggers during Figure 8: Location and thermal classification of stream temperature loggers within the Bowmanville/Soper Watershed during Figure 9: Trend data from Soper Creek Temperature loggers (TLSOP09 (blue/triangle), TLSOP10 (red/square)) from 2005 to Temperature is measured in degrees Celsius. Loggers are located near Gibb Road and Concession Road Figure 10: Comparing Temperature Logger and Point-in-time (using farmzone.ca) temperature measurements from the 2011 season in select Bowmanville and Soper Creek Sites Figure 11: Comparing four different results of the Stoneman and Jones (1996) thermal classification methodology by using four different methods for collected maximum air temperature. The recommended method, nearest weather station, was used by looking up maximum temperature on Environment Canada (EC) and farmzone.ca (Weather Network as well as using maximum temperature recorded at each site and average maximum temperature recorded at each site after being broken up into georegions Figure 12: 2011 stream fisheries site locations Figure 13: Locations where Salmonid and Sculpin species were caught during 2011 fisheries sampling Figure 14: Brook Trout locations found through 2011 fisheries sampling Figure 15: Location of Durham Region coastal wetlands. Wetland information is listed in Table Figure 16: Trends looking at Wetland IBI averages sampled with a boat electrofisher. Wetlands are divided into four jurisdictions, Ganaraska Region CA, Central Lake Ontario CA, Toronto Region CA, Quinte. Number of Wetlands sampled per jurisdiction vary as well as number of wetlands sampled per jurisdiction each year Figure 17: Round Goby distribution in Ontario as of February 2010 (OFAH 2010) Figure 18: Map of the upper Bay of Quinte showing wetlands and depth contours (Bay of Quinte Remedial Action Plan, 2007) Central Lake Ontario Conservation Authority Aquatic Monitoring Report 2011 v
8

9 1.0 INTRODUCTION In order to make sound, science-based management decisions about local watersheds, the Central Lake Ontario Conservation Authority (CLOCA) conducts long-term watershed health monitoring. This information helps CLOCA understand current conditions, identify ecological trends, provides a strong basis to measure the effectiveness of stewardship activities and also provides guidance in making informed land-use decisions. Typical components of the watershed are monitored and include: aquatic habitat (e.g., habitat assessments and temperature monitoring); fish and benthic macroinvertebrates (benthos); terrestrial habitat (e.g., riparian and tableland vegetation, wildlife); and, water quality and quantity of both surface water and groundwater. This report focuses on the Aquatic Monitoring Program, specifically Spawning Surveys, Stream Temperature, Biological Water Quality and Fisheries Sampling. To ensure that monitoring is done using standardized protocols, whenever possible, CLOCA participates in national, provincial or municipal networks. Our partners include Environment Canada (EC), Fisheries and Oceans Canada (DFO), Ministry of Environment (MOE), Ministry of Natural Resources (MNR) and other Conservation Authorities. Located east of Toronto within the Region of Durham (Figure 1), the Authority's jurisdiction encompasses 638 square kilometers and is defined by the area drained by fifteen watersheds (Figure 2). Local municipalities located within the jurisdiction, in whole or in part, include the cities of Oshawa and Pickering, the towns of Ajax and Whitby, the Municipality of Clarington, and the townships of Scugog and Uxbridge. While every effort has been made to accurately present the findings reported in this document, factors such as significant digits and rounding, and processes such as computer digitizing and data interpretation may influence results. For instance, in data tables no relationship between significant digits and level of accuracy is implied, and as a result values may not always sum to the expected total. Figure 1: Location of CLOCA Jurisdiction (highlighted in green). A watershed is defined as an area drained by a river or creek and its tributaries. Central Lake Ontario Conservation Authority Aquatic Monitoring Report

10 Figure 2: CLOCA Jurisdiction 2 Aquatic Monitoring Report 2011 Central Lake Ontario Conservation Authority
11 2.0 SPAWNING SURVEY 2.1 Introduction Sampling methods for capturing fish are sometimes not suitable for obtaining all data needed about a fishery. Many limiting factors may prevent a species of fish from reproducing successfully (producing young). These include poor water quality, migration barriers, temperature, water levels, illegal works etc. Spawning surveys provide useful information for identifying critical spawning habitat. This information is complimentary to standard fish community surveys and is a beneficial component when describing the health of a watershed. A spawning survey involves observing indicators of spawning, in a specific watershed. These indicators include: the presence of adult fish in a likely spawning area (e.g., Rainbow Trout), the occurrence of active spawning (e.g., fish present on redds) and signs that spawning has taken place (i.e., spawning depressions or redds). Not all fish species bury their eggs in substrate: some lay eggs on material, others broadcast their eggs into the water column. Salmonids, both true Salmon and Trout (Salmo redd -the gravel nest of salmonid fishes. and Oncorhynchus) as well as char (i.e. Brook Trout, Salvelinus fontinalis) build depressions in the bottom of streams and then lay their eggs into these depressions or redds. (Imhof, 1997). Spawning locations are not evenly distributed within a watershed. Therefore, collecting information consistently over 3-5 years will identify where important reproduction areas exist and are consistently used by Salmonid populations (Imhof, 1997). Spawning surveys within the CLOCA jurisdiction typically are conducted in both the spring and fall. The spawning periods for the fishes most commonly targeted by CLOCA are listed in Table 1. These spawning periods are when we would typically expect to see these fishes migrating during a normal year. Seeing as temperature and rainfall can alter migration routes, seasonal variation can alter these dates. Table 1: Spawning periods for selected southern Ontario fishes. Brown Trout mid-october to late November Brook Trout late-october to mid-december Rainbow Trout Chinook Salmon White Sucker mid-april to late-june late-september to early-october May to early-june 1 - Imhof, J. Salmonid Spawning Survey - Methodology. 2 - Scott, W. B., and E. J. Crossman Freshwater fishes of Canada. Fish. Res. Bd. Canada Bull. 184: Central Lake Ontario Conservation Authority Aquatic Monitoring Report
12 2.2 Results (Spring) Spawning surveys targeting migratory adult Rainbow Trout and White Sucker were conducted on the following watersheds: Bowmanville Creek Bennett Creek Corbett Creek Darlington Creek Gold Point Creek Harmony Creek Lynde Creek Oshawa Creek Pringle Creek Robinson Creek Tooley Creek Soper Creek Survey locations and fish observations are shown in Figure 3. Specific locations and significance are outlined below and within Table 5: Bowmanville Creek There were eleven spawning survey locations within Bowmanville Creek during Rainbow Trout were observed at four of the sites and White Suckers were not observed at any. Through alternative sampling methods, Ontario Stream Assessment Protocol (OSAP), Rainbow Trout young-of-year were consistently found throughout the watershed. This would suggest that sites where adult migratory fish were not observed is likely related to the timing of site specific observations and limited effort. It should be noted that spawning surveys can become more difficult to complete as creek size increases. Since Bowmanville Creek is large, this could have contributed to lack of observed fishes. Large creeks can make spawning surveys more difficult for the following reasons: presence of many deep pools with limited visibility, turbulent waters and wide wetted width Bennett Creek During the 2011 spawning survey sampling, no adult migratory fish were observed in Bennett Creek. Since there was low effort, i.e. too few sampling sites, in Bennett Creek during 2011, it is unknown if this accurately represents the number of fish that utilize this creek for spawning Corbett Creek No adult migratory fish were observed in Corbett Creek during the 2011 spawning survey. Since there was low effort, i.e. too few sampling sites, in Corbett Creek during 2011, it is unknown if this accurately represents the number of fish that utilize this creek. During 2010 sampling, White Suckers were found on both the east and west branches of Corbett Creek. 4 Aquatic Monitoring Report 2011 Central Lake Ontario Conservation Authority


13 2.2.4 Darlington Creek During 2011 spawning survey sampling, no adult migratory fish were observed in Darlington Creek. Since there was low effort, i.e. too few sampling sites, in Darlington Creek during 2011, it is unknown if this accurately represents the number of fish that utilize this creek. No fish were observed in Darlington Creek during 2010 but through supplemental sampling young-of-year Rainbow Trout were caught. This emphasizes the importance of multiple sampling methods. Resources to conduct other sampling methods were not available during 2011 so it is unknown if young-of-year Rainbow Trout were in Darlington Creek. White Sucker Rainbow Trout Gold Point Creek During 2011 spawning survey sampling, no adult migratory fish were observed in Gold Point Creek. Since there was low effort, i.e. too few sampling sites, in Gold Point Creek during 2011, it is unknown if this accurately represents the number of fish that utilize this creek. Since this was only the second time that spawning surveys have been completed in Gold Point creek, continued monitoring will help establish fish usage trends. This is an example of where long-term monitoring is important to fully understand how fish use this creek Harmony Creek During 2011 spawning survey sampling, no adult migratory fish were observed in Harmony Creek. During the summer of 2011 Rainbow Trout young-of-year were caught while doing fish removal for a channel stabilization project. This would suggest that adult Rainbow Trout successfully migrated to at least north of Rossland Road during the spring of It is encouraging to see Rainbow Trout reproduction in a watershed that is highly urbanized. It is likely that with higher levels of effort these adult migratory fish would have been picked up on spawning surveys Lynde Creek In 2011, an incidental site was chosen to conduct the spawning survey. The site selected was identified as a spawning site in 2010 where just upstream a beaver dam prevents fish passage. In 2011, no adult migratory fish were observed at this site. It is noted that the beaver dam was no longer present, hence allowing fish to migrate further upstream. The site was located north of Rossland Road. Central Lake Ontario Conservation Authority Aquatic Monitoring Report


14 2.2.8 Oshawa Creek During 2011 eight spawning survey sites were sampled in Oshawa Creek. Of these sites, four had Rainbow Trout, four had White Sucker and one had a redd with active spawning taking place. Trout were observed in high numbers on the north side of Conlin Road which is as far north as the spawning surveys took place Pringle Creek There were four spawning survey sampling sites in Pringle Creek during Of these sites, two had Rainbow Trout and one had White Sucker. Rainbow Trout were found north of Rossland Road but not north of the beaver dam between Rossland Road and Taunton Road Robinson Creek White Suckers were documented in Robinson Creek during 2011 within Darlington Provincial Park. No Rainbow Trout were documented during 2011 which is consistent with previous years spawning surveys. Low effort i.e. too few sampling sites could be the cause of this since reproduction has been documented in the past through stream electrofishing Tooley Creek During 2011 sampling, Rainbow Trout adults were documented in Tooley Creek south of Highway 401. At this site, active spawning was documented as well as numerous White Suckers. Low effort i.e. too few sampling sites could have contributed to the limited observations north of Highway 401. Rainbow Trout Bowmanville Creek Rainbow Trout Bowmanville Creek Soper Creek During 2011 sampling, Rainbow Trout adults were documented at three sites with two sites having acting spawning taking place. Rainbow Trout were observed north of Taunton Road. Limited effort, i.e. too few sampling sites, could of contributed to the limited results at other sites. This combined with the increased difficulty of spawning surveys in larger creeks could explain the absence of Trout in more northern locations. Rainbow Trout young-of-year were found extensively throughout the watershed during stream electrofishing later in the summer. 6 Aquatic Monitoring Report 2011 Central Lake Ontario Conservation Authority

15 2.3 Results (Fall) Spawning survey effort was limited during the fall of The following watersheds had Chinook Salmon documented. Bowmanville Creek Oshawa Creek Pringle Creek Soper Creek Specific locations and significance are outlined below: Bowmanville Creek During the 2011 fall season, Chinook Salmon were observed at two locations in high numbers. The Salmon were observed at the Goodyear Dam and at the old Jackman Road bridge (near Longworth Avenue). These sites are a good place to look at sizes and origins (stocked or natural) as they often build up in large numbers as they attempt to pass these structures Oshawa Creek Chinook Salmon were documented in Oshawa Creek during the fall of The Salmon were observed near the Ritson Road Recycle/Transfer Station Pringle Creek Chinook Salmon were again documented in Pringle Creek during the fall of During 2010 large numbers of Chinook Salmon were observed because of the combination of low water levels and a barrier near the intersection of Dundas Street (Highway 2) and Garden Street. This barrier caused high mortality during 2010 so an effort was put forth to increase passage (see photos below). The project, completed by the Town of Whitby, generally included the retrofit of a box culvert to improve fish passage through the use of wood baffles as part of a fisheries compensation project. A total of 20 Hemlock timbers were permanently anchored to the floor of the west cell of the culvert. Although it is hard to determine how effective the new structure was, at a minimum it reduced mortality by not allowing the fish to get trapped in Pringle adjacent Creek cells barrier of the culvert mitigation that were dry. The success of the structure will be continued to be monitored. Pringle Creek barrier mitigation Central Lake Ontario Conservation Authority Aquatic Monitoring Report

16 2.3.4 Soper Creek During the 2011 fall season, Chinook Salmon were observed at one location in high numbers in Soper Creek. They were found on two separate occasions near the old Training School Dam north of Concession Street. This was the only site that was targeted for spawning surveys on Soper Creek in 2011 by CLOCA. Pringle Creek barrier mitigation 8 Aquatic Monitoring Report 2011 Central Lake Ontario Conservation Authority

17 Figure 3: Location of 2011 spring migratory Rainbow Trout and White sucker observations. Central Lake Ontario Conservation Authority Aquatic Monitoring Report
, whereas biological sampling measures ecological effects.")

18 3.0 BIOLOGICAL WATER QUALITY 3.1 Introduction CLOCA monitors surface water quality through both chemical and biological sampling. In general, sampling for chemical and physical parameters measures stressors (e.g., environmental contamination), whereas biological sampling measures ecological effects. Biological surveys involve sampling creatures, such as benthic macroinvertebrates ( aquatic bugs ; see photos below) and fish, found living within the aquatic environment. Benthic macroinvertebrates or benthos, make good health indicators of aquatic ecosystems for a number of reasons: they generally have limited mobility that makes them vulnerable to many creek stresses that may occur; they have short life cycles; they are easily collected and identified; they are relatively inexpensive to sample; and they exist almost everywhere (Ontario Benthos Biomonitoring Network, 2005). Similar to other biological communities, certain species of invertebrates have specific tolerances to various stresses and are referred to as indicator species. Therefore, the presence or absence of these indicator species can be related to the quality of the water. In the past, CLOCA sampled benthos following two separate protocols. The primary protocol for assessing water quality was through BioMAP (Griffiths, 1998). The second protocol is part of the OSAP and is a coarse measure of water quality, which uses the Hilsenhoff Index. In order to harmonize longterm monitoring efforts, CLOCA is now a partner in the Ontario Benthos Biomonitoring Network (OBBN) coordinated by the MOE and EC. This provincial network allows practitioners to follow a standardized methodology, share resources and receive technical support. 10 Aquatic Monitoring Report 2011 Central Lake Ontario Conservation Authority
.")
19 One method to test whether an aquatic system has been impaired by human activity uses a reference condition approach to compare benthos at test sites (where biological condition is in question) to benthos from multiple, minimally impacted reference sites. A portion of sampling effort each season should focus on collecting reference sites (OBBN, 2005). The online database warehoused by MOE has been undergoing upgrades and analysis tools are not yet functional. Currently, site information (i.e., identified species) has been entered into the provincial database and the results, i.e. whether a site is impaired or not, will be available once this upgrade is complete. Another method to quantify whether an aquatic system has been impaired by human activity is to compare the percentage of three Orders of sensitive benthos; Ephemeroptera (Mayflies), Plecoptera (Stoneflies) and Trichoptera (Caddisflies) or otherwise referred to as EPT. These orders are typically only present and abundant in undisturbed areas, often inhabited by sensitive coldwater fishes like Trout and Sculpins 3.2 Results During May 2011, CLOCA staff sampled 22 OBBN sites throughout 8 watersheds (Figure 5). One of the sites sampled was a long-term monitoring reference site and the remaining 21 sites were test sites. Of these 21 test sites, three are previously sampled CLOCA sites and 18 are new sites. This was the seventh season that CLOCA has sampled benthos using the OBBN protocol. Please refer to Table 6 in Section 12.0 Appendix II Biological Water Quality for full summary. Central Lake Ontario Conservation Authority Aquatic Monitoring Report
20 OBBN Sampling Sampling during 2011 was not concentrated on a single watershed, but rather took place throughout CLOCA jurisdiction. In contrast to past years, while more watersheds were sampled, fewer samples in each watershed were taken. This was done to support a large scale Ministry of Environment (MOE) project titled The South-Central Ontario Biocriteria project. The sites for this project were predetermined by MOE. Poor quality sites were generally located in the urban areas and the good water quality sites were located in the headwaters of the large watersheds (Bowmanville/Soper, Oshawa, Lynde). This is a multi-year project contributing to a standardized method for analyzing and determining impairment at each OBBN site. The one reference site sampled was located in Bowmanville Creek (BOWOB03). This was the sixth year that it has been sampled. Results from 2011 showed a very large decrease in % EPT. The average % EPT between 2005 and 2010 was approximately 36 whereas 2011 sampling resulted in an EPT percentage of 8.9 (See Figure 4). Further testing to see if this is natural variation, human error (i.e. site selection), influences by an unknown short-term anthropogenic effect (i.e. contaminant spill, excessive water taking, etc.) or long-term changes to the creek by development or climate is recommended. Average % EPT per year Year Sampled Figure 4: Summary of %EPT averaged per site (Riffle 1, Pool 1, Riffle 2) per year to determine trend data. Site is BOWOB03 located in Long Sault Conservation Area. The three historical test sites were located in Bowmanville, Oshawa and Soper Creeks. The Bowmanville Creek site, BOWOB01, had similar %EPT in 2011 (17.2%) than it did in 2005 (18.9%) and 2006 (19.4%). The Oshawa Creek site (OAOB03) as well as the Soper Creek site (SOPOB01) both had large drops in EPT when compared to previous sampling results (Please refer to Table 6 for more information). 12 Aquatic Monitoring Report 2011 Central Lake Ontario Conservation Authority
21 A summary of the new sites sampled in 2011 are listed in Table 2 below. Soper, Black and Bowmanville Creek had the highest scores for %EPT and Corbett and Harmony Creeks had the lowest scores. Based on the land cover in these watersheds, these results are expected. Table 2: Summary of %EPT scores from new sites sampled in 2011 by CLOCA for benthic invertebrates using the OBBN protocol. Scores are calculated by averaging the %EPT for Riffle 1, Riffle 2, and Pool 1 for each site. Watershed Number of Sites Minimum %EPT Maximum %EPT site average site average Oshawa Soper Bowmanville Black Corbett Harmony Lynde Pringle Average score within watershed Although site locations were limited and lack of long-term trends at most sites reduced the ability to consider how natural variation affects a site, our sampling supports previous studies correlating a loss of important sensitive benthic invertebrates (EPT) with land alteration to urban or agricultural uses (Sponseller et al., 2001; Moore et al., 2005; Utz et al., 2009). Riparian buffers are an important part of urban design in preserving stream water quality. Stream bank vegetation filters out pollutants from water run-off, hence mitigating some of the impacts caused by urban and agricultural uses. If the riparian buffers have not been preserved in an area of the watershed, the creek is then subject to increased flows, fluctuating temperatures, and contamination (Leblanc et al., 1997; Jones et al., 1999; Allen 2004). Riparian buffers alone, however, cannot ensure good water quality. Impervious surfaces, such as roads and parking lots, reduce the amount of water that can soak into the soil and vegetation. This water instead is directed towards creeks and brings with it many contaminants, increased temperatures and increased flow (Wang et al., 2001). The riparian buffers ability to mitigate can be limited, either through stormwater drains by-passing them or impervious surfaces increasing flow to levels which they are unable to effectively infiltrate water, due to velocities, and remove many of the contaminants. The combination of limited riparian areas and increasing impervious cover in these small watersheds contributes to low benthic invertebrate scores as evidence by the sensitive taxa (EPT) disappearing with the addition of anthropogenic stressors (Utz et al., 2009). Ground water is also an important source of clean water and contributes to the maintenance of good water quality within a stream. Reverse particle tracking determined that the majority of ground water contributing to the small watersheds originates in the Iroquois Beach. This source is not of the same quantity as the sources supplying the larger watersheds from the Oak Ridges Moraine (Earthfx Inc, 2009). That being said, protection of these sources are critical to ensure a good source of clean, thermally suitable water for the maintenance of a healthy and robust aquatic ecosystem. Stewardship Central Lake Ontario Conservation Authority Aquatic Monitoring Report
 are important for understanding water quality but also play a critical role in the food web. Benthic invertebrates are a fundamental food source for many fish.")
22 opportunities exist that would benefit the health of the aquatic ecosystems, such as, planting riparian buffers along the creek and/or cattle fencing. Benthic invertebrates (benthics) are important for understanding water quality but also play a critical role in the food web. Benthic invertebrates are a fundamental food source for many fish. Fish species, such as Rainbow Trout and Brown Trout, require benthics as an energy source. A young salmonids diet can be comprised almost entirely by benthics and are therefore necessary for successful reproduction to occur (Oscoz et al., 2005). Bowmanville Creek fishbio.com 14 Aquatic Monitoring Report 2011 Central Lake Ontario Conservation Authority

23 Figure 5: Percent EPT from OBBN site locations sampled during Central Lake Ontario Conservation Authority Aquatic Monitoring Report

24 4.0 WATER TEMPERATURE 4.1 Introduction Temperature is considered a controlling factor with respect to habitat suitability for fish. For species such as Slimy Sculpin or Brook Trout, summer stream temperature is considered the single most important factor influencing distributions (Jenkins and Burkhead, 1993; MacCrimmon and Campbell, 1969). Temperature monitoring provides a good indicator of habitat suitability and allows one to assess the impacts of landscape changes on stream health. CLOCA relies on quality stream temperature data for use in plan review, watershed management plans, aquatic resource management plans, fisheries management plans, etc. Temperature monitoring was conducted between May 2011 and February This sampling period allows CLOCA to capture stream temperature during the critical summer months when sensitive fish species are vulnerable to warm weather. In addition, by leaving the temperature loggers in the streams through the winter months, CLOCA staff are able to detect the relative contribution of groundwater in the stream. Groundwater temperature is moderated by the sub-surface ground temperature. Depending on the amount of groundwater entering a stream it has the ability to moderate the stream temperature. If enough groundwater enters a stream it will have more of an influence than the air temperature and prevent the stream from freezing. In total, 78 portable temperature loggers (Figure 6) were installed throughout the CLOCA jurisdiction during 2011 (Figure 7). The primarily focus for temperature monitoring was in the Bowmanville/Soper watersheds. In addition, long-term monitoring sites and areas of interest in various other watersheds were measured. All of the loggers were programmed to collect water temperature every half-hour. Figure 6: Attributes of one of the temperature logger models used by CLOCA. 16 Aquatic Monitoring Report 2011 Central Lake Ontario Conservation Authority
25 Classification of stream temperature was divided into three categories: coldwater, coolwater and warmwater (Coker et al., 2001). The thermal classification for each site was determined by analyzing data summarized through ThermoSTAT V2 (MNR, 2010). This program was designed to help interpret the very large data set acquired by the temperature logger. This new software replaces the previous analysis tool, Stream Temperature Analysis Tool and Exchange (STATE) (Table 7; Jones and Chu, 2007). ThermoSTAT V2 has a finer temporal resolution that provides a more realistic summary of the duration within specific thermal ranges. Conversion of historical data collected using the STATE program was necessary to compare past results with future data. Even though the programs analyze the results slightly differently, it is not expected to significantly impact or change the thermal classification of CLOCA s streams. It should be noted that stream temperature classification can be confusing. Historically in Ontario only two thermal classification categories were used, coldwater and warmwater. Coldwater fishes such as Trout and Salmon can be found in both coldwater and coolwater temperature zones and so these zones represent coldwater streams in the traditional sense (Bowlby, 2008). It is important to note some of the limitations of this data. Although the data provides an excellent idea of what the water temperature is at an individual section of creek throughout the critical periods, it should be understood that the logger is representing a fixed point. The logger takes the temperature measurement at that location and is not representative of the entire habitat in that section of creek. Temperature is the single most important abiotic factor to a fish because of it being poikilothermic or cold-blooded. For this reason there are values derived for most fish that represent what the maximum temperature they can tolerate before their biological functions cease. For example, Rainbow Trout, has a maximum tolerable temperature of 26 Celsius (Coker et al., 2001). If a temperature logger exceeds that threshold it is often assumed that no Rainbow Trout can survive in that section of creek. Although this may be true if the water temperature remains above this threshold for an extended period of time, it is not certain especially if the duration of exceedence is short. Fish are experts at seeking out thermal refugia to avoid their lethal maximum temperatures. Deep pools, undercut banks, riparian vegetation, groundwater discharge areas and high flow areas can all provide thermal refuges in which the temperature is lower than the rest of the creek. For this reason Rainbow Trout have been found in creeks with readings over 26 Celsius (Ebersole et al., 2001; Fowler et al., 2009). The same has been found for other coldwater species, such as Chinook Salmon (Torgersen et al., 1999). Their ability to use behavioural thermoregulation, whereby the fish seeks out thermal refugia, allows them to survive periods where the majority of the creek has a temperature that exceeds its maximum thermal limits. Central Lake Ontario Conservation Authority Aquatic Monitoring Report

26 Figure 7: Location and thermal classification of stream temperature loggers during Aquatic Monitoring Report 2011 Central Lake Ontario Conservation Authority

27 Figure 8: Location and thermal classification of stream temperature loggers within the Bowmanville/Soper Watershed during Central Lake Ontario Conservation Authority Aquatic Monitoring Report
28 4.2 Results Please refer to Table 7 in Appendix III Stream Temperature and Figure 7 and Figure 8 regarding temperature logger data discussion below Bowmanville Creek During the 2011 season, 30 temperature loggers were installed within Bowmanville Creek. The Bowmanville Creek, along with Soper Creek, has a thermal regime most similar to pre-development conditions within the CLOCA jurisdiction, which is believed to be a full coldwater system. In the northern sections of the watershed the thermal regime is predominately coldwater with a few coolwater sites scattered throughout where land use changes have impacted them. Throughout the middle of the watershed there is a mix of both cold and coolwater sites. The southern part of the watershed, in and around the Town of Bowmanville, is dominated by coolwater sites. These thermal regimes are confirmed with biological evidence as healthy Brook Trout, as well as other Salmonids, populations are found in the northern areas while the southern areas still support healthy populations of both Brown and Rainbow Trout as well as seasonal migrants. Continued monitoring to identify if the warming trend in the southern portion of the watershed continues is recommended. With continued development in that area, increased pressured could make it difficult to maintain a thermal regime suitable for the fish that currently occupy the creek. Of the 30 loggers installed in Bowmanville Creek during 2011, seventeen were found to be coldwater and thirteen were found to be coolwater. There were no coldwater sites located below Taunton Road. Loggers were placed upstream and downstream of most of the large barriers having a considerable sized pond upstream. Ponds and barriers can impact downstream temperatures so the placement of loggers above and below a barrier can determine if any significant increases of temperature occur. Results from 2011 show that although there are some increases in the rate of temperature change per day, there does not appear to be any significant thermal impacts. However, without historical temperature data (prior to installation of the barrier), it is difficult to quantify exactly how much the barrier and pond is impacting stream temperature. As a result of this information, it would appear as though the protection of upstream Brook Trout populations is a stronger positive than the possible negative thermal impacts that it is creating Bennett Creek During the 2011 season, one temperature logger was installed in Bennett Creek. This is the second year data has been retrieved from this site. Both years it has been found to be coolwater, which is consistent with the fish species caught in this area. 20 Aquatic Monitoring Report 2011 Central Lake Ontario Conservation Authority
29 4.2.3 Corbett Creek During the 2011 season, two temperature loggers were installed in Corbett Creek. Both of these temperature loggers are installed at long-term monitoring sites south of Wentworth Drive, one on the east branch and one on the west branch. Results from the east branch (TLCE01) show the coolest temperatures to date whereas the results from the west branch (TLCW01) show the highest temperature to date. A definitive explanation is not currently known, however, there is more riparian cover directly upstream of the east branch. There is also a piped section of the creek upstream on the east branch that discharges cold water as found in 2010 because the water is not being heated up by the sun (but also not providing any habitat to aquatic species). Although both branches are highly impacted, the west branch has limited riparian and is low gradient upstream of the temperature logger. These low gradient areas are visible as wetlands. The limited flow in these areas allow for increased water temperature. These reasons could be contributing to the difference in temperature between the two branches Darlington Creek During the 2011 season, two temperature loggers were installed in Darlington Creek. Each of these temperature loggers are installed at long-term monitoring sites north of the 401 and south of Baseline Road. One site, TLDN01, is on the west branch and the other site, TLDN02, is on the east branch. Results from TLDN01 show an increased maximum temperature nearing the warmest maximum temperature recorded in Although the stream did come near the warmwater mark, it still fell within the coolwater window. Results from TLDN02 are consistent with the four previous sampling years at this site. All years have been found to be coolwater Farewell and Harmony Creeks During the 2011 season, a total of three temperature loggers were installed around the area of the Harmony and Farewell confluence. Two loggers were located upstream of the confluence, one on each Harmony (TLHA01) and Farewell creeks (TLFA02), and the other below the confluence (TLFA01). The logger on Harmony Creek (TLHA01) was monitored for the fourth year. It once again was determined to be coolwater. The 2011 season did have the warmest summer temperatures to date with a maximum temperature reaching up to 27.8 C. The two loggers on Farewell Creek (TLFA01, TLFA02) were found to be coolwater for the fourth straight year. The 2011 season did have the warmest summer temperatures to date at these sites. TLFA01, which is downstream of the confluence, consistently has higher temperatures than TLFA02. This could be partially attributed to the slightly higher temperatures coming from Harmony Creek Gold Point Creek During the 2011 season, one temperature logger was installed in Gold Point Creek. It was located near the mouth to Lake Ontario and was found to be coolwater. It is not clear how much of an impact water processes from Lake Ontario would have affected this logger. Central Lake Ontario Conservation Authority Aquatic Monitoring Report
30 4.2.7 Lynde Creek One annual monitoring temperature logger was installed within Lynde Creek during This was the third year that temperature had been measured at this location. The site was found to be coolwater for the second straight year. Even though it is coolwater, when compared to the previous sampling year (2009) results temperatures are much higher. Continued monitoring to be able to identify long-term trends apart from seasonal variability is required Oshawa Creek One annual monitoring temperature logger was installed within Oshawa Creek during This was the third year that temperature had been measured at this location. The data indicated that this section of creek is coolwater. All three years that this site has been monitored has resulted in a coolwater designation. Further monitoring will help to determine if the thermal regime stays as coolwater or if the high density urban land use upstream of the site increases the temperature over the long-term Osbourne Creek In Osbourne Creek, one temperature logger was installed in The logger was placed just upstream from Lake Ontario. This was the third year that this logger had been put in this location. This season, including the previous two years, resulted in a thermal designation of coldwater. This was supported by finding YOY Rainbow Trout at this location during 2010 fisheries sampling Pringle Creek During the 2011 season, three temperature loggers were installed in Pringle Creek. All of the loggers where found to be coolwater. This is consistent with previous years sampling results. The one logger located near Garden Street and Consumers Drive (TLPR01) has been rising in temperature since It is not known if this is related to land use or if it is coincidence with natural variation in summer weather. Continued monitoring should help determine this Robinson Creek During the 2011 season, two temperature loggers were installed in Robinson Creek. TLROB01 was selected as a site for the fourth time. This site was recorded as warmwater again, remaining consistent with the previous three seasons. This is not surprising because it is a small tributary with an outlet from a stormwater pond upstream, limited groundwater discharge in the area, and the area around the logger is historical pasture for livestock. CLOCA did a stewardship project at this location to remove livestock from the area. It will be interesting to continue monitoring temperature at this site to see if the improving riparian habitat can help to provide enough shading to impact the thermal regime. The other temperature logger, TLROB02, was located in the northern part of Darlington Provincial Park. Data indicated that this section of creek is coolwater, which is consistent with the three previous sampling events at this site. 22 Aquatic Monitoring Report 2011 Central Lake Ontario Conservation Authority

31 Soper Creek During the 2011 season, 30 temperature loggers were installed in Soper Creek. The Soper Creek, along with Bowmanville Creek, has a thermal regime most similar to pre-development conditions, which is believed to be a full coldwater system. It is similar to the Bowmanville Creek in that the northern section is dominated by coldwater sites with only a couple coolwater sites. On the north side of Taunton Road there is a total of ten coldwater sites and two coolwater sites. South of Taunton, there are more coolwater sites than coldwater. There are five sites south of Taunton Road that are classified as coldwater and thirteen classified as coolwater. There is an obvious trend showing an increase in temperature as you move farther south in the watershed (aside from site specific extremes). This coincides with an increase in urban development and an increase in the amount of agriculture upstream of the site. Biological data from the summer fisheries sampling confirms that Soper Creek is a coldwater system as there is a healthy Salmonid population as well as non-game fish that are tolerant of only coldwater systems (e.g. Slimy Sculpin). Continued monitoring to determine long-term trends, especially in the east branch and near Bowmanville on the main branch, is recommended. In 2005 two loggers (TLSOP09 and TLSOP10) were purchased by Irv Harrell for his stewardship property (Hawkridge Farm) located within Soper Creek watershed (Gibb Road/Concession Road 7). A section of Soper Creek flows through Hawkridge Farm and data from 2005 to 2011 indicates that it is coldwater. No cool or warmwater days have been recorded during this time. During 2011, the highest maximum temperature for either logger was 17.9 Celsius. This is a slight increase from 2010 but below the high set back in The average maximum temperature since 2005 is 16.9 Celsius at TLSOP09 and 17.2 Celsius at TLSOP10. Figure 9 shows evidence of a possible warming trend (over the past seven years of temperature recording) of approximately ¾ of a degree based on the line of best fit for TLSOP10 and over one degree Celsius based on the line of best fit for TLSOP09. Continued monitoring to see if this trend is correct or is being influenced by natural variation in weather patterns is recommended. Temperature Logger Removal Central Lake Ontario Conservation Authority Aquatic Monitoring Report
32 Maximum summer temperature (Celsius) Year Figure 9: Trend data from Soper Creek Temperature loggers (TLSOP09 (blue/triangle), TLSOP10 (red/square)) from 2005 to Temperature is measured in degrees Celsius. Loggers are located near Gibb Road and Concession Road Tooley Creek During the 2011 season, one temperature logger was installed in Tooley Creek. This is the fifth year that temperature has been monitored at this site. This was the second year out of the five that the site has been classified as warmwater. The three previous sampling events recorded coolwater. This is a site that fluctuates around the threshold between cool and warmwater and can go either way depending on how cool or hot the summer is relative to other years. 4.3 Temperature monitoring methodology Previous to temperature loggers becoming more affordable, different methodologies were required to classify water temperature. Without having a thermometer in the creek for an extended period of time it becomes difficult to determine maximum temperature without putting an unrealistic amount of effort into each site. A widely used methodology that allows you to determine maximum temperature with a single temperature measurement was developed by Stoneman and Jones (1996). This methodology was used by CLOCA previous to large scale use of temperature loggers because it was locally developed, simple to use and required only one measurement after a heat wave (as defined by Stoneman and Jones, 1996). After temperature loggers became available in large quantities CLOCA no longer used the Stoneman and Jones (1996) methodology because as they stated in their paper, when resources are available, continuous temperature data collected over a period of weeks or months will invariably provide a more accurate description of the stream s thermal regime. During the 2011 summer, CLOCA used both temperature logger data analyzed by ThermoStat V2 and Point-in-time measurements using the Stoneman and Jones (1996) methodology. The sites were 24 Aquatic Monitoring Report 2011 Central Lake Ontario Conservation Authority

33 classified as cold, cool or warmwater. Since ThermoStat V2 does not actually provide you with a thermal classification, CLOCA used the data analysis provided by ThermoStat V2 and our previous in-house classification methodology to determine thermal classification. The classifications were then compared to determine the similarity between the two methodologies. Results showed considerable difference between temperature logger results and point-in-time measurements (Figure 10). When compared with temperature logger data, it was found that depending on which maximum air temperature was used there could be anywhere from five to 20 sites (of a total of 35) that had different thermal classifications. In all cases, when thermal classification differed, the Stoneman and Jones (1996) methodology was the higher temperature designation. For example, if there was a difference, Stoneman and Jones (1996) would be Coolwater and the temperature logger would be Coldwater or Stoneman and Jones (1996) would be Warmwater and the temperature logger would be Coolwater. The main problem that was found when dealing with the Stoneman and Jones (1996) methodology was the variability in the outcome based on the maximum air temperature that is used in determining the thermal classification. Figure 11 demonstrates the variability depending on the air temperature that is used. In the CLOCA jurisdiction, one maximum air temperature is often not suited to the entire area. The area closer to Lake Ontario tends to have less temperature fluctuations compared to the north end of the jurisdiction and a slight cooling effect caused by Lake Ontario (in the summer months). Using the same temperature for all sites will likely decrease the accuracy of both the south and north ends of the watersheds depending on the location of the air temperature source. This makes picking the source of the maximum air temperature critical. The two closest sources of maximum air temperature were posted by Environment Canada and Farmzone.ca (The Weather Network). Their posted maximums were different resulting in different classifications at some sites. It was found, in the CLOCA jurisdiction, that unless more air temperature monitoring stations were set up at different locations throughout the watershed, the resulting thermal water temperature will invariably have error associated with it. In conclusion, Stoneman and Jones (1996) is a good tool for supplementary temperature data but when available continuous in-stream temperature data is the most accurate and should be used as the basis for thermal management decisions. Bowmanville Creek temperature logger installation. Central Lake Ontario Conservation Authority Aquatic Monitoring Report
 temperature measurements from the 2011 season in select Bowmanville and Soper Creek Sites.")
34 Figure 10: Comparing Temperature Logger and Point-in-time (using farmzone.ca) temperature measurements from the 2011 season in select Bowmanville and Soper Creek Sites. 26 Aquatic Monitoring Report 2011 Central Lake Ontario Conservation Authority
 and farmzone.")
35 Figure 11: Comparing four different results of the Stoneman and Jones (1996) thermal classification methodology by using four different methods for collected maximum air temperature. The recommended method, nearest weather station, was used by looking up maximum temperature on Environment Canada (EC) and farmzone.ca (Weather Network as well as using maximum temperature recorded at each site and average maximum temperature recorded at each site after being broken up into georegions. Central Lake Ontario Conservation Authority Aquatic Monitoring Report
.")
36 5.0 FISHERIES SAMPLING (STREAMS) 5.1 Introduction Fish are one of our most valued natural resources from ecological, economic, social and cultural perspectives. Healthy fish and environments result from protecting and/or restoring aquatic ecosystems (Draft Terms of Reference, 2005). In order to help determine aquatic ecosystem health and monitor it over time CLOCA conducts fisheries assessments in various watersheds each season. Ongoing annual aquatic monitoring is recommended in the Central Lake Ontario Fisheries Management Plan (CLOFMP; CLOCA/MNR 2007). Information collected during these programs supports the goals and objectives of the CLOFMP and allows for an adaptive management approach. Historically, watersheds within the Central Lake Ontario Conservation Authority supported healthy coldwater fish communities and a strong Brook Trout and Atlantic Salmon fishery. With increasing urbanization and changing land-use patterns, many of the coldwater streams have become cool or warmwater systems. The Atlantic Salmon fishery has since collapsed and has been supplemented by stocking of Pacific Salmon and Trout species. In CLOCA s jurisdiction, the distribution of Brook Trout has typically been reduced to the undeveloped headwater reaches in the natural settings of the Oak Ridges Moraine (CLOCA/MNR, 2007). While there have been many changes to the fish communities and fish habitat within CLOCA s jurisdiction, the watersheds are still home to a diverse array of fishes including cold-, cool- and warmwater species. The Bowmanville/Soper watershed has the highest diversity of Salmonids in CLOCA jurisdiction. Angling opportunities include Rainbow Trout and White Sucker during the spring and Chinook and Coho Salmon and Brown Trout during the fall; all during the regular season (refer to Error! Reference source not found. for more information). Brook, Brown and Rainbow Trout resident populations also exist in most of the watershed. Anglers also take advantage of fishing popular warm-water species such as, Bass, Sunfish, Pike, and Carp in the coastal areas (CLOCA/MNR, 2007). Generally, CLOCA conducts fisheries sampling in streams using a common sampling method called electrofishing (see photo on right). On occasion, when electrofishing is not a suitable technique, other sampling methods, such as seine nets, fyke nets, dip nets and minnow traps, are utilized. Backpack electrofishing, is conducted, for the most part, according to the Ontario Stream Assessment Protocol (OSAP) published by the MNR (Stanfield, 2005). Electrofishing is a sampling method that temporarily immobilizes fish in water using electricity. Once immobilized, they can be captured with nets and fisheries staff can collect biological information (e.g., species, length, weight) before releasing 28 Aquatic them. Monitoring Report 2011 Central Lake Ontario Conservation Authority
. Fish species that were captured are listed in Table 8, Table 9, Table 11, Table 12 and Table 13.")


37 5.2 OSAP Monitoring Results During 2011, 58 OSAP sites were sampled by CLOCA as part of the annual aquatic monitoring program and another four were sampled through the OSAP Training Course in the Oshawa Creek watershed (Figure 12). Fish species that were captured are listed in Table 8, Table 9, Table 11, Table 12 and Table 13. The main focus for sampling during 2011 was in the Bowmanville and Soper watersheds. Other sites were selected to monitor long-term trends in other watersheds or provide fisheries data needed for plan review. The draft Central Lake Ontario Fisheries Management Plan (MNR/CLOCA 2007) outlines watershed and subwatershed-based goals and objectives for the fisheries resource and habitat within Bowmanville and Soper Creeks, and identifies target species and fish communities for management. CLOCA s annual aquatic monitoring helps to assess these goals and objectives and is consistent with the management recommendations made within the Plan. Further, it allows for an adaptive management approach. The results of the 2011 CLOCA Aquatic Monitoring are consistent with the goals and objectives of the FMP. The main branches of Bowmanville and Soper Creeks are still dominated by migratory salmonids and should remain managed as such. Upstream of impassable barriers to fish migration, streams remain dominated by resident coldwater fish communities including Brook Trout, Brown Trout and Sculpin species (Figure 13). These headwaters should continue to be managed for these sustainable and diverse fish communities. Balancing development and environmental integrity can be a difficult process but is necessary to meet the economic goals of the municipalities while still maintaining an ecologically sustainable landscape. Since many of the species that inhabit Bowmanville and Soper watersheds are sensitive to land use it will be important to mitigate the negative impacts that urban and agricultural lands can have on the surrounding area. With best management practices in place and well thought out planning, Bowmanville and Soper Creeks should have a healthy population of Trout, Salmon and Sculpin for years to come Bowmanville Creek watershed During the 2011 season, 21 sites were sampled in Bowmanville Creek. The Brook Trout populations that were sampled in 2011 showed mixed results (Locations in Figure 14). Three sites (BA04, BC06, BD04) show some signs of decrease in their population whereas the other four sites with Brook Trout (BB08, BB09, BB17, LMP3) all showed consistent trends or an increase in numbers. It is interesting to note that three of the sites with increasing numbers of Brook Trout were located on the Hampton Branch Central Lake Ontario Conservation Authority Aquatic Monitoring Report


38 (formally known as B branch) which is where considerable land acquisition by CLOCA has taken place. The Enniskillen Conservation Lands provide important protection for the headwaters of this branch which is likely benefiting the aquatic communities downstream. Since the land acquisition has been fairly recent it is unknown if the positive effects are being transferred downstream already or if other factors are at play. The Brown Trout population does not appear to have any trends that stand out. Their population continues to be strong throughout most of the watershed. Migratory Salmonids were found throughout the entire watershed except where movement is impeded by barriers. Rainbow Trout are the most numerous as many of the young-of-year spend much of the summer in the creeks before swimming downstream to Lake Ontario. Most of the Coho and Chinook Salmon have left the creeks for the Lake Ontario by the time sampling begins in July, but pockets of them were found in various locations in the watershed. Coho Salmon numbers increased from previous years. The Darter species in the Bowmanville Creek, Rainbow and Johnny Darters, were found in one location during 2011 sampling. Johnny Darter numbers at this site (BA01) appear to be decreasing whereas the Rainbow Darters numbers have fluctuated in large amounts with 2011 numbers being similar to 1998 sampling results. Darters have specific habitat needs which may explain why they are only found at this one site in Bowmanville Creek and why numbers might be decreasing. Since they are benthic species, a changing substate can decrease their population size as they have a hard time adapting. Another group of small, sensitive species are the Sculpins (Mottled and Slimy). The Mottled Sculpin are spread throughout much of the watershed while the Slimy Sculpin are restricted to the headwater areas. Mottled Sculpin numbers appear to be decreasing slightly at the sites that are located closer to the Town of Bowmanville but have no obvious trend higher up in the watershed. Sites containing Slimy Sculpin are limited but the sites that do have them show that the population is holding steady in these areas. Rainbow Trout young-of-year Brown Trout Overall the Bowmanville Creek watershed is in good health. The best areas are found higher in the watershed where there is less impact from urban and agricultural land uses and where ground water 30 Aquatic Monitoring Report 2011 Central Lake Ontario Conservation Authority
39 contributions provide excellent water quality and thermal preferences of the fishes that live in that area. The lower sections of Bowmanville Creek are still in good condition but the effects of urbanization and the cumulative land use changes upstream are becoming apparent. That being said, some Trout, Salmon, Sculpin and Darter species are still able to survive in these sections which is evidence of good water quality (Figure 13) Farewell Creek watershed During the 2011 season, one site in Farewell Creek was sampled. This site, FA12, was sampled later in the fall when the opportunity came up for CLOCA to fill a data gap in conjunction with a stewardship project taking place. The site was found to have Rainbow Trout young-of-year, Creek Chub and Blacknose Dace. This was an interesting observation because this section of creek is often intermittent and dries up during the summer. It is unknown if the creek was dry this summer, but if it was, the fish were able to quickly inhabit the area again after flow resumed. This could be demonstrating the importance of all fish habitat regardless of its seasonal flow pattern Gold Point Creek watershed During the 2011 season, one site was sampled in Gold Point Creek. This site (GM02) was sampled for the second time by CLOCA. It is considered to be located in the Coastal Wetland (drowned river mouth) section of Gold Point Creek sampling results showed very consistent results to the previous sampling. Species total and total fish caught were almost identical Lynde Creek watershed In the Lynde Creek watershed, two sites were sampled in Both sites were located on a small tributary within the Lynde Main subwatershed. The sites were located near Rossland Road and Coronation Road. At site LA24 Brook Stickleback was caught and site LA25 resulted in a no-catch Osbourne Creek watershed One site was sampled in Osbourne Creek in This was the third time that this site was sampled, the first being in 2004 and the second being in Sampling resulted in a no catch during Continued monitoring to see how fish from the lake utilize these small coastal watersheds is recommended Oshawa Creek watershed In 2011, three sites were sampled in Oshawa Creek. All of these sites were located near Simcoe Street and Conlin Road intersection. This was the first time that any of the sites had been sampled by CLOCA. The primary purpose was to collect fish presence/absence data for plan review purposes. Sampling results show that all three are direct fish habitat and based on the fish species caught were representative of a cool/coldwater fishery Robinson Creek watershed During the 2011 season, one site in Robinson Creek was sampled. This site was located within the Robinson Creek Coastal Wetland in Darlington Provincial Park. This was the second time this site has been sampled by CLOCA. The total number of fish caught was higher in 2011 than 2010, but species richness dropped. Threespine Stickleback was caught for the first time and White Sucker numbers Central Lake Ontario Conservation Authority Aquatic Monitoring Report


40 increased from 14 to 85. Bluntnose Minnow, Green Sunfish, Johnny Darter and Largemouth Bass were the species caught in 2010 but not in Continued monitoring to see how fish use this coastal wetland is recommended Soper Creek watershed During the 2011 season, 21 sites in Soper Creek were sampled. Twelve sites were sampled using the OSAP protocol and nine sites were sampled to determine presence/absence of fish for plan review purposes. The Salmon and Trout in Soper Creek appear to have strong, stable populations. Brown Trout (see photo below/right) has the strongest resident Trout populations as this species was found in high numbers throughout much of the watershed. Brown Trout provide excellent angling opportunities. Overall, Brook Trout are found in lower numbers as they are restricted to the higher areas in the watershed. It is thought that competition from other Salmonids (Brown Trout, Rainbow Trout, Chinook Salmon and Coho Salmon), decreases in water quality and increases in temperature through loss of riparian habitat are the main reasons why the range of Brook Trout is currently a fraction of historical distribution in the area (Stanfield et al., 2006). Mottled Sculpin Brown Trout Other intolerant species, such as Mottled and Slimy Sculpin and Rainbow and Johnny Darter are also found in Soper Creek. Both of these Darter species were found at two of the sites sampled in It is hard to determine from the limited data at these sites, but currently it appears as through their population sizes might be decreasing. Since they are benthic dwelling species, changes to the substrate (which are common in areas with increased agriculture and/or impervious surfaces) make adaptation difficult. Mottled Sculpin are found throughout the Soper Watershed. The results do appear to show a decreasing number or individuals at sites near urban areas, but more sampling will be needed in order to confirm trends. Overall the Soper Watershed is in good health. The headwaters support a healthy community of intolerant species, such as Trout, Salmon, Darters and Sculpin. Some areas of the watershed are 32 Aquatic Monitoring Report 2011 Central Lake Ontario Conservation Authority

41 impacted by agriculture and urban land use, but the main branch of Soper Creek down to Baseline Road still supports sensitive species Tooley Creek watershed During the 2011 season, one site in Tooley Creek was sampled. The site was located in the Tooley Creek Coastal Wetland at the end of Courtice Road. This was the second year that CLOCA has sampled this location. Results from 2011 were similar to 2010 with the exception of Brown Bullhead. During 2011 sampling a school of young-of-year Brown Bullhead were caught increasing their numbers considerably. There were 425 young-of-year Brown Bullhead captured in 2011 and none in Long-term monitoring will help even out these trends. These results are impressive given the stresses that are on this coastal wetland. The majority of the wetland is pasture for grazing cattle. The cattle are free to use the creek, which results in: increased sedimentation through disturbance and destabilized banks, no substantial vegetative buffer to limit nutrient loads and limit sunlight penetration, increased turbidity, and an unproductive benthic zone because disturbance prevents healthy vegetative communities. This demonstrates the resilience of this wetland making it a great candidate for stewardship initiatives. Tooley Creek Coastal Wetland Annual Long-term Monitoring Sites overview Ideally, every watershed would be sampled each year to avoid missing any significant events and to develop trend data faster. Due to current resources this is not possible. Therefore, six sites were chosen within CLOCA jurisdiction to be monitored annually long-term. This trend data can be used to determine fish assemblages shifts and monitor the creeks for establishment of invasive species populations. For this reason, sites in the lower reaches were chosen as they generally exhibit the highest diversity, the most potential anthropogenic impacts and historical records of Round Goby. The annual long-term monitoring sites are located on the larger watersheds. For site locations please refer to Figure 12 and for full fish data please refer to Table 11 and Table 12. Summary of the six long-term monitoring sites are listed below. Central Lake Ontario Conservation Authority Aquatic Monitoring Report

42 Black Creek BL01 This is the fourth year that BL01 has been sampled. The following is a summary of notable observations at this site. Number of fish caught and species total remained relatively consistent with the previous three sampling seasons. Green Sunfish (please refer to Section 8.1 for more information) population at this site rebounded from zero the previous year to record the highest number yet (7). This trend will be interesting to monitor over long-term to see if they can establish a consistent population. Brown Trout were caught for the first time in 2010 but none were found during Rainbow Trout on the other hand were found in their highest numbers since Mottled Sculpin recorded their lowest catch at this site out of the four years it has been sampled. BL Site marking Bowmanville Creek BWDJ BWDJ has been sampled from and in Sampling in 2011 was the 13 th year that this site has been sampled providing excellent long-term trend data. The following are a summary of notable observations at this site. The total number of fish caught and the number of species caught were the third lowest and second lowest respectively in the 13 years BWDJ has been sampled. The reason for this is unclear at this point. Rainbow Trout population remained abundant at this site during With close to 150 Rainbow Trout caught at this site, it is clear this is an important area for the life cycle of the Rainbow Trout. Another Salmonid, Chinook Salmon were also caught indicating the importance of this creek for their life cycle. Since it is thought that approximately 60-80% of Salmons smolt in the spring, the amount caught is likely only a small fraction of the number of salmon that would have occupied these waters during the fall and winter. 34 Aquatic Monitoring Report 2011 Central Lake Ontario Conservation Authority


43 BWDJ 2011 Site marking FA Site marking Farewell Creek FA04 This was the fourth year that FA04 has been sampled. The following are a summary of notable observations at this site. The total number of individual fish and the total number of species caught remained relatively consistent with previous years sampling is the first year that a confirmed American Brook Lamprey has been caught at this site. It is encouraging to see species that are sensitive to land use changes doing well at this site. Rainbow Trout and Mottled Sculpin populations remain consistent with previous years and show no signs of decline since CLOCA has been monitoring this location Lynde Creek LA01 This was the fourth year that LA01 has been sampled. The following are a summary of notable observations at this site. Total number of individual fish caught was the lowest of the four years sampled. Total number of species caught remained relatively consistent with previous years. During 2011 sampling, the first American Brook Lamprey was caught. This is an unusual catch in this area as they are considered a sensitive species. It is still being confirmed at the Royal Ontario Museum that it is in fact an American Brook Lamprey and not a young Sea Lamprey. These two species look almost identical at a young age. Darter numbers appear to be decreasing for both Johnny Darter and Rainbow Darters. Continued monitoring of this trend is recommended Oshawa Creek OA05 This was the fourth year that OA05 has been sampled. The following are a summary of notable observations at this site. Total number of individual and total number of species caught remained relatively consistent with previous years sampling. Johnny Darter numbers appear to be declining with another slight decline in numbers from 2010 to On a positive note, Mottled Sculpin appear to be maintaining high numbers from previous years sampling. This was the first year that White Sucker were not caught at this site by CLOCA Soper Creek SB01 This was the fourth year that SB01 has been sampled. The following are a summary of notable observations at this site. During 2011 sampling, total individual fish caught was the lowest out of the four years sampled. One Chinook Salmon was caught at this site for the first time by CLOCA. Rainbow Trout were also caught but in low numbers (3). It is interesting to note how different the Rainbow Trout Central Lake Ontario Conservation Authority Aquatic Monitoring Report


44 populations are between Bowmanville and Soper just north of Baseline. It would be interesting to determine if this is watershed related or simply site specific variation. Round Goby were caught for the second consecutive year. Monitoring the Round Goby to see if it permanently establishes a population is recommended. LA Site marking OA Site marking SB Site marking 5.3 OSAP Training Course The 2011 OSAP Training Course was held from June 6-10 at Durham College/UOIT. This was the fifth year that as part of the training program a selection of 4 CLOCA ARMP sites within Oshawa Creek watershed was sampled. Due to the fact that this is a training exercise with participants taking turns in order to gain practical sampling experience, abundance data is not reported (Table 13). During testing and safety checks, prior to sampling a site for the OSAP training course, a juvenile American Eel was captured. American Eels are classified as endangered in Ontario. The once abundant species have seen their numbers drop dramatically because of overfishing and barriers. Their unique life history make them both an interesting species and a challenging one to manage. Efforts are being made to restore connectivity within the St. Lawrence and allow this species to recover. For more information on the importance of American Eel, their life cycle, threats and what is being done to help them, please refer to the MNR document in Section 17.0 on American Eel. Brown Trout Brown Trout 36 Aquatic Monitoring Report 2011 Central Lake Ontario Conservation Authority

45 Figure 12: 2011 stream fisheries site locations. Central Lake Ontario Conservation Authority Aquatic Monitoring Report
46 Figure 13: Locations where Salmonid and Sculpin species were caught during 2011 fisheries sampling. 38 Aquatic Monitoring Report 2011 Central Lake Ontario Conservation Authority
47 Figure 14: Brook Trout locations found through 2011 fisheries sampling. Central Lake Ontario Conservation Authority Aquatic Monitoring Report

48 6.0 FISHERIES SAMPLING (COASTAL WETLANDS) 6.1 Introduction Great Lakes coastal wetlands are a unique wetland type that have formed at the mouths of streams and rivers where they empty into the lakes, or in open or protected bays along the shoreline. Lake Ontario s water level has been regulated since 1960 to accommodate increased demand for shipping and hydroelectric power. Natural water level variability has been diminished, reducing the biological diversity of coastal wetlands that depend on water level fluctuations to maintain diverse vegetation communities (Environment Canada and Central Lake Ontario Conservation Authority, 2004a). The Durham Region Coastal Wetland Monitoring Project (DRCWMP) is designed to be a long-term monitoring program that enables reporting on the condition of coastal wetlands in the Region (Figure 15). The project was initiated in 1999 and monitoring began in Partners involved include Environment Canada, Central Lake Ontario Conservation Authority, Toronto Region Conservation Authority (TRCA) and Ganaraska Region Conservation Authority (GRCA) (Environment Canada and Central Lake Ontario Conservation Authority, 2004b). Figure 15: Location of Durham Region coastal wetlands. Wetland information is listed in Table Aquatic Monitoring Report 2011 Central Lake Ontario Conservation Authority
49 Table 3: Durham Region coastal wetlands. Wetland Name Keymap Number Wetland Type* Conservation Authority Rouge River Marsh 1 DR TRCA Frenchman s Bay Marsh 2 BB TRCA Hydro Marsh 3 BB TRCA Duffins Creek Marsh 4 DR TRCA Carruthers Creek Marsh 5 DR TRCA Cranberry Marsh 6 BB CLOCA Lynde Creek Marsh 7 DR CLOCA Whitby Harbour Marsh 8 DR CLOCA Corbett Creek Marsh 9 DR CLOCA Gold Point Marsh 10 DR CLOCA Oshawa Creek Marsh 11 DR CLOCA Pumphouse Marsh 12 BB CLOCA Oshawa Second Marsh 13 BB CLOCA McLaughlin Bay Marsh 14 BB CLOCA Westside Marsh 15 BB CLOCA Bowmanville Marsh 16 DR CLOCA Wilmot Creek Marsh 17 DR GRCA Port Newcastle Marsh 18 DR GRCA * DR = drowned river mouth; BB = barrier beach lagoon As part of the DRCWMP, fish communities in wetlands are assessed using a sampling method called boat electrofishing (see photo on right; see page 26 for a definition of electrofishing). In order to have consistent sampling effort, fish are sampled within the DRCWMP wetlands using the same electrofishing boat, owned and operated by CLOCA. Boat electrofishing is conducted according to DRCWMP fish sampling protocol (Environment Canada and Central Lake Ontario Conservation Authority, 2003). The relative condition of the fish community at each wetland and over multiple years is compared using an Index of Biotic Integrity (IBI). IBIs, which are multi-metric indices, were first developed for use with stream fish communities by James Karr in central Illinois and Indiana (Karr, 1981). Metrics, or attributes, appropriate to Lake Ontario coastal wetland fish communities were selected and tested for suitability in the IBI based on a significant (p<0.05) or moderate (p<0.20) response to disturbances of the wetland. Six metrics were found to correlate either negatively or positively with disturbance and were, thus, retained for use in this IBI (Table 4). Each wetland receives an IBI score between 0 and 100 each year/time that it is sampled (Table 20) (Environment Canada and Central Lake Ontario Conservation Authority, 2004b). Central Lake Ontario Conservation Authority Aquatic Monitoring Report
50 Table 4: Six metrics used in DRCWMP IBI. 1 Number of native species (SNAT), 2 Number of centrarchid species (SCEN), 3 Percent piscivore biomass (PPIS), 4 Number of native individuals* (NNAT), 5 Percent non-indigenous biomass* (PBNI), 6 Biomass (g) of Yellow Perch (BYPE). *Metric was corrected for site-specific interaction. 6.2 Durham Results Water levels were high enough during the 2011 season allowing sampling to occur in all of the wetlands, although not all areas of each wetland were accessible. Sampling continued where possible and certain biases were noted. Overall wetland health increased in all jurisdictions (Ganaraska CA, Central Lake Ontario CA, Toronto Region CA, Quinte) as indicated by the IBI averages (See Figure 16 and Table 21). It is interesting to note the consistent highs and lows recorded by all jurisdictions. This would suggest a strong climatic or other significant large scale factor plays a significant role in determining year to year fish communities and therefore marsh health. More in-depth results for each wetland are included below. Average IBI Score Year of Boat Electrofishing Sampling GRCA CLOCA TRCA Quinte Figure 16: Trends looking at Wetland IBI averages sampled with a boat electrofisher. Wetlands are divided into four jurisdictions, Ganaraska Region CA, Central Lake Ontario CA, Toronto Region CA, Quinte. Number of Wetlands sampled per jurisdiction vary as well as number of wetlands sampled per jurisdiction each year. 42 Aquatic Monitoring Report 2011 Central Lake Ontario Conservation Authority

. The large numbers of Fathead Minnow and Gizzard Shad are largely responsible for high total individual fish caught as well as increasing the IBI score.")

51 6.2.1 Lynde Creek Marsh This is the ninth season that Lynde Creek Marsh has been sampled through the DRCWMP using CLOCA s boat electrofisher. Sampling resulted in an IBI score of 60, which is an increase from 2010 sampling as well as being above the average IBI score for this marsh and tying the highest score recorded at Lynde Creek Marsh. Interesting results include the first time that a Rock Bass had been caught in Lynde Creek by CLOCA, high numbers of Fathead Minnow and Gizzard Shad and a juvenile Northern Pike (see Northern Pike photo right). The large numbers of Fathead Minnow and Gizzard Shad are largely responsible for high total individual fish caught as well as increasing the IBI score. It will be interesting to see if this trend continues into the future. Round Goby were not caught during 2011 sampling but another non-native species, the Common Carp, was (see photo below/left). Sampling completed by the Ministry of Natural Resources during 2011 targeting Freshwater mussels found that Eastern Pondmussels are present in Lynde Creek Marsh. This is an interesting find because the Eastern Pondmussel is classified as a species at risk (SAR). For more information on Eastern Pondmussel, please refer to Section 7.0 Fisheries Related Research. During 2010 sampling, CLOCA partnered with MOE to determine contaminant levels in sport fish. Results from the sampling have just been updated for Lynde Creek on the MOE site ( Please refer to Section 8.2 for more information on the partnership and the guide. The fish sampled for contaminants included Brown Bullhead, Yellow Perch and Common Carp. Both Brown Bullhead and Yellow Perch show relatively safe levels of contaminants whereas the Common Carp had high levels of PCBs as shown in the guide by recommending only one serving of carp per month be consumed at a maximum of 65cm in length for the general public. It is recommended that sensitive people (e.g. women of child bearing age, children under 15) do not eat any Common Carp from Lynde Creek Marsh. It is not clear at this point whether the carp are picking up the contaminants from Lynde Creek Marsh or if they have acquired them in another location. Common Carp are known to spawn in wetlands and then either stay in the marsh or disperse back into Lake Ontario (Jude and Pappas, 1992). Further sampling is scheduled to try and determine the source of the contamination. Central Lake Ontario Conservation Authority Aquatic Monitoring Report

 and Fathead Minnow, were once again caught in 2011. The 2011 IBI score was 32 making it the highest to date.")

52 6.2.2 Whitby Harbour Wetland Complex Fish Sampling was conducted for the fifth year as part of the DRCWMP within the Whitby Harbour Wetland Complex. Results showed a large increase in species richness from 3 species in 2010 to 13 species in Three new species were first detected in the marsh through DRCWMP during 2011: Largemouth Bass, Rock Bass (See below/left) and Round Goby (please refer to Section 8.1 for more information). Common species caught in this wetland, such as Common Carp, White Sucker (see below/right) and Fathead Minnow, were once again caught in The 2011 IBI score was 32 making it the highest to date. This is a large increase from the previous year s score of 13. Rock Bass White Sucker Whitby Harbour Wetland Complex has the lowest IBI average of any of the wetlands sampled through DRCWMP even with a stronger score in Although this is discouraging to see consistently low results previous to 2011, it is promising to see native species important to Great Lakes coastal wetlands were found in higher numbers this year (e.g. Pumpkinseed, Yellow Perch, Largemouth Bass) compared to previous sampling events. It is important to monitor this trend to see if this is a one-time event or gradual improvement in the Whitby Harbour Wetland Complex. 44 Aquatic Monitoring Report 2011 Central Lake Ontario Conservation Authority


 were caught once again making it five")

53 6.2.3 Corbett Creek Marsh This is the eighth season that Corbett Creek Marsh has been sampled through the DRCWMP using CLOCA s boat electrofisher. Results from 2011 show an IBI score of 22 down from 41 in This is likely attributed to the lack of diversity found in the marsh. During 2011 sampling, total number of species caught remained high as well as total fish, although, Brown Bullhead made up the majority of the marsh population. Of the 91 fish caught in 2011, 82 were Brown Bullhead. The reason for dominance of Brown Bullhead is unknown at this time. Continued monitoring of the barrier beach in relation to the fish community is recommended. Pumpkinseed were caught for the eighth straight year and Common Carp (see photo top/right and bottom/left) were caught once again making it five out of the eight years sampled they have been captured. Neither Largemouth Bass nor Northern Pike, which were caught in 2010, were caught during 2011 sampling. Continued monitoring of Corbett Creek Marsh to determine if the top predator population can recover in this area is recommended. Common Carp Central Lake Ontario Conservation Authority Aquatic Monitoring Report


54 6.2.4 Pumphouse Marsh For the sixth time as part of the DRCWMP, fish sampling was conducted within the Pumphouse Marsh. During 2011 sampling six species, the highest number found to date in this wetland, were found to inhabit the Pumphouse Marsh. One new species was found during 2011 sampling, Bluegill, but because of their similarities to Pumpkinseed while they are a young-of-year it is not known for certain if this is actually the first time they have been found in this wetland through DRCWMP. Brown Bullhead, Fathead Minnow, Common Carp and Pumpkinseed were found consistently throughout the marsh. Goldfish made up the largest proportion of the community (74 of the 159 total). These are the highest numbers found to date. During sampling Goldfish were often in such high numbers it was not possible to net all of them. It is important to monitor this trend to see if the Goldfish population stabilizes or they continue to be a dominant species in this wetland. For more information of the effects of Goldfish please refer to Section 8.2. The IBI score from 2011 sampling was 36. This is a slight decline from 2010 but still above the marsh average. Considering so many Goldfish were caught during 2011, this is a good score and is reflective of the increased number of species present Oshawa Creek Coastal Wetland Complex For the fourth time as part of the DRCWMP, fish sampling was conducted within the Oshawa Creek Coastal Wetland Complex. Sampling resulted in an IBI score of 41 which is slightly lower than the wetland average. The number of species caught decreased from 13 in 2010 to eight in That and total number of fish caught were the lowest in the four years this site has been sampled. Difficult conditions (high winds/rain) could have influence the results. Interesting results include catching a natural 32 pound Chinook Salmon (see photo below/left), large numbers of Brown Bullhead, catching Northern Pike for the fourth consecutive year, and the absence of Round Goby. Staging Chinook Salmon were observed during shocking in the creek channel as well as in the harbor. During 2011 sampling the Ministry of Environment (MOE) participated and took specimens for contaminant analysis. The results from the contaminant analysis have yet to be received. For more information on the MOE Guide to Eating Sport Fish please refer to Section Aquatic Monitoring Report 2011 Central Lake Ontario Conservation Authority


55 6.2.6 Oshawa Second Marsh This is the seventh season that Oshawa Second Marsh has been sampled through the DRCWMP using CLOCA s boat electrofisher. Sampling resulted in an IBI score of 30, slightly lower than the marsh average of 34 but up considerably from the previous score of eight. Total number of fish caught during 2011 was the highest ever recorded at Oshawa Second Marsh through DRCWMP. This is largely due to the high number of Goldfish captured increasing further from last year to 186 of the total 387 fish caught. Since sampling began, Goldfish (see photo below/left) have been consistently captured in high numbers. Pease refer to section 8.2 for more information. Common carp was found for the third consecutive year since the control structure was compromised through vandalism. Interestingly, Pumpkinseed, a native warmwater species which historically was an important part of the fish community at Oshawa Second Marsh until it disappeared from sampling in 2010, made a slight recovery in Continued monitoring is recommended to see how the Pumpkinseed competes with more tolerant native and non-native species. All fishes that enter or leave the marsh must pass through a water-level control structure that connects Oshawa Second Marsh to Farewell Creek. An adjustable grate is used to manage fish passage allowing for control of undesirable fish species such as Common Carp (see photo below/right) which is part of the Goldfish family. Unfortunately, this grate can also exclude desirable fishes such as adult Northern Pike if not positioned correctly. Managers are able to make informed decisions regarding the grate setting by using data collected through the DRCWMP fish sampling each year. This method of decision making is often referred to as adaptive management. Central Lake Ontario Conservation Authority Aquatic Monitoring Report

 and Northern Pike (see photo below/right) caught for the first time through DRCWMP sampling.")

56 6.2.7 McLaughlin Bay Marsh This was the eighth year that McLaughlin Bay Marsh was sampled through the DRCWMP. It s IBI score was 47 in 2011, improving from 2010 by 19 points and well above the marsh average of 35. Interesting results include: White Perch caught for the fifth year in a row making it only two out of eight years they have not been caught, Largemouth Bass caught for the third consecutive year, four Black Crappie caught (see photo below/left) and Northern Pike (see photo below/right) caught for the first time through DRCWMP sampling. The diversity found in the McLaughlin Bay Marsh contributed to the higher than average score. During 2011, 11 different species were caught which is just one short of the highest diversity recorded at McLaughlin Bay. Even with non-native species, such as, Common carp (see photo above/right) and White Perch, the presence of many native species including a couple piscivores (Largemouth Bass and Northern Pike) increased this year s IBI score. During 2011 sampling the Ministry of Environment (MOE) participated and took specimens for contaminant analysis. The results from the contaminant analysis have yet to be received. For more information on the MOE Guide to Eating Sport Fish please refer Section Aquatic Monitoring Report 2011 Central Lake Ontario Conservation Authority


 and Brown Bullhead (see photo below/middle).")


57 6.2.8 Westside Marsh This is the seventh season that Westside Marsh has been sampled through the DRCWMP for fish. Sampling resulted in an IBI score of 31 dropping slightly from last year and the marsh average of 36. Water levels in the marsh were high due to the closed barrier beach. Although in 2010 this was thought to be a potential reason for low numbers of prey species because of high predation pressure, it did not appear to be the case during 2011 sampling as prey species were high even with the barrier beach being closed. An exact date on when the barrier beach was open or closed is not known. Interesting catches include: Black Crappie caught at this marsh in six of the seven years sampled, Largemouth Bass (see photo below/right) caught again in high numbers, Common Carp (see photo below/left) and Brown Bullhead (see photo below/middle). It should be noted that the consistent catching of Largemouth Bass could be attributed or affected by the stocking event during the 2005 season (Dillon Consulting, 2009). Goldfish were caught in Westside Marsh for the first time during DRCWMP sampling Bowmanville Marsh This is the ninth season that Bowmanville Marsh has been sampled through the DRCWMP using CLOCA s boat electrofisher. Sampling resulted in an IBI score of 29, well below last year s score and the marsh average, with eight different fish species caught. This is the second lowest IBI score recorded at Bowmanville Marsh. Results from 2011 showed three new species being caught through the DRCWMP sampling: Bluegill, Goldfish and Largemouth Bass (see photo below/left and right). The poor score could be the result of the dominance by Brown Bullhead (49 of 66 fish) and the addition of a non-native species, Goldfish. Please refer to Section 8.1 for more information on this species. Central Lake Ontario Conservation Authority Aquatic Monitoring Report


, Round Goby was caught for the third consecutive year, and a juvenile Bowfin (see photo")
58 Wilmot Creek Marsh This is the eighth season that Wilmot Creek Marsh has been sampled through the DRCWMP using CLOCA s boat electrofisher. Sampling resulted in an IBI score of 37, a large decrease from last year s score and well below the marsh average of sampling recorded ten different species, which is only half of the 20 caught during 2010, but consistent with the marsh average. The total number of fish caught also decreased from 162 in 2010 to 36 in 2011, the second lowest total out of the eight years this marsh has been sampled. Interesting results include: catching Brown Trout, high numbers of migratory Chinook Salmon (see photo below/right), high numbers of Northern Pike (see photo below/bottom/left), Round Goby was caught for the third consecutive year, and a juvenile Bowfin (see photo above/left). Wilmot Creek Marsh has been found to be a relatively healthy wetland for the area but does have considerable seasonal variation in how fish use the area. 50 Aquatic Monitoring Report 2011 Central Lake Ontario Conservation Authority

59 Port Newcastle Marsh 2011 sampling catch results were relatively consistent with the three previous year s results. Species total (13-14) and total fish caught (88-115) all remained similar. Results from 2011 sampling showed a large increase in IBI scoring at 67. This is the highest ever at Port Newcastle Marsh and 20 points above the marsh average. Gizzard Shad and Pumpkinseed were the most abundant species caught with 23 and 22 individuals respectively. Other species caught include: Largemouth Bass, Yellow Perch, Bowfin (see photo right) for the first time in this marsh through DRCWMP, and Brown Bullhead. Interestingly, Round Goby and Common Carp were not caught in 2010 or in 2011 and are likely contributing to the higher IBI scores. This was only the second time Common Carp was not caught at Port Newcastle. Continued monitoring of the trends is recommended Frenchman s Bay Marsh In Frenchman s Bay Marsh total fish caught decreased from 2010 as well as species richness but IBI increased to 56. Interesting results include Round Goby being caught again making it six years in a row that they have been found at this site. It appears as though Round Goby have established a population in Frenchman s Bay Marsh. Largemouth Bass has been caught all eight times this marsh has been sampled recording its highest numbers by far in Common Carp were again caught in high numbers Rouge River Marsh This is the eighth year that Rouge River Marsh was sampled through the DRCWMP. During 2011 it recorded its highest total number of fish caught (142) as well as the highest number of species caught (14). Interesting catches include: the first time Rock Bass and White Perch (please refer to section 8.1 for more information) have been caught in this marsh through DRCWMP, an absence of Common Carp, the highest numbers of Largemouth Bass caught in the marsh through DRCWMP, and Northern Pike. The IBI score for 2011 was 68, considerably higher than the marsh average of Carruthers Creek Marsh Carruthers Creek Marsh was sampled for the sixth time through DRCWMP sampling. Species richness was the second highest recorded at this marsh through DRCWMP but total fish caught was below the marsh average. Interesting results include: high numbers of Largemouth Bass, Northern Pike and the first time White Sucker has been caught in this marsh through DRCWMP. The IBI score of 57 reflected the increased numbers of piscivores making it well above the marsh average of Duffins Creek Marsh This is the tenth year that Duffins Creek Marsh has been sampled through the DRCWMP. During 2011 it recorded slightly less than average number of fish caught but recorded its highest, and tied DRCWMP Central Lake Ontario Conservation Authority Aquatic Monitoring Report


60 highest (Wilmot Creek), total species caught at 20. The IBI score in 2011 was 56, which is above the marsh average of 37. Interesting catches include catching a Chinook Salmon, Rainbow Trout, Northern Pike, Largemouth Bass for the first time since 2002, Johnny Darter (see photo below/left), Logperch (see photo below/middle) and Yellow Perch (see photo below/right). This was also the first year that Round Goby has been found through DRCWMP sampling. Continued monitoring of the Round Goby population is recommended. It should also be noted that three Northern Pike were caught just outside the Northern Pike habitat project being completed by Toronto Region Conservation Authority (TRCA) and Ontario Power Generation (OPG). Continued monitoring at this location to determine the success of the project is recommended Hydro Marsh This is the eighth year that Hydro Marsh has been sampled through the DRCWMP. During 2011 it recorded an IBI score of 71, well above the marsh average of 45. Due to low water levels not all transects normally sampled were accessible. Even with these low water levels, total fish numbers and species richness were the highest ever recorded in this marsh through DRCWMP. Interesting results include Largemouth Bass being caught for the sixth consecutive year and in much higher numbers than any other year and Common Carp being found in large numbers. The very high score could be partially reflective of our restriction to the area of the marsh that has restoration completed. Although it is encouraging to see a healthy fish community in this area, it might not be reflective of the entire marshes health. 52 Aquatic Monitoring Report 2011 Central Lake Ontario Conservation Authority

61 Figure 17: Round Goby distribution in Ontario as of February 2010 (OFAH 2010). Central Lake Ontario Conservation Authority Aquatic Monitoring Report
62 6.3 Bay of Quinte RAP Introduction Fish sampling through the DRCWMP in the Bay of Quinte and surrounding area first took place in 2003 with the sampling of two wetlands followed by an additional five in Data from these wetlands helped to strengthen the Durham project and other EC initiatives. In 2008 CLOCA partnered with the Bay of Quinte Remedial Action Plan (BQRAP) to sample approximately 15 wetlands over a 3-year period. See below for details regarding the BQRAP. Great Lakes Water Quality Agreement (GLWQA): An international treaty made between Canada and the United States in The purposes of this agreement were: 1) To provide measurable goals to restore, protect and maintain the environment quality of the Great Lakes Ecosystem. 2) To identify Areas of Concern where the environmental quality does not meet international standards. Area of Concern (AOC): An area where the environmental quality does not meet international standards set out by the GLWQA. Each AOC is required by the GLWQA to have a Remedial Action Plan. Currently there are 17 AOC's in Ontario. Remedial Action Plan (RAP): Under the GLWQA, each AOC is required to have a Remedial Action Plan to enforce an "ecosystem approach" to improving water quality so that international standards can eventually be met. Bay of Quinte RAP The Big Cleanup, ( Results This past summer, fisheries sampling as part of the BQRAP began on August 11 th and finished August 31 st with five Quinte wetlands being sampled (for marsh locations refer to Figure 17): 1. Carnachan Bay Marsh 2. Carrying Place Marsh 3. Hay Bay South 4. Lower Napanee Marsh 5. Sawguin North Marsh Of the five marshes, Lower Napanee Marsh had the lowest IBI score of 81 and Sawguin Creek North Marsh receiving the highest score of 100 (Table 19). All marshes were found to have high scores in 54 Aquatic Monitoring Report 2011 Central Lake Ontario Conservation Authority


 which is considered a species")
, Northern Pike (see photo middle/left")
.")
63 2011. Lower Napanee Marsh does prove challenging to sample because of its large size. Quinte continues to produce a high diversity of predator species as well as smaller forage fish. Interesting results include catching Bowfin (see photo middle/right), Grass Pickerel (see photo top/left) which is considered a species at risk (COSEWIC), Common Carp (see photo top right), Northern Pike (see photo middle/left and bottom/right), and Largemouth Bass (see photo bottom left). Central Lake Ontario Conservation Authority Aquatic Monitoring Report
 56 Aquatic Monitoring Report 2011 Central Lake Ontario Conservation")
64 Figure 18: Map of the upper Bay of Quinte showing wetlands and depth contours (Bay of Quinte Remedial Action Plan, 2007) 56 Aquatic Monitoring Report 2011 Central Lake Ontario Conservation Authority
65 7.0 FISHERIES RELATED RESEARCH Freshwater mussels are part of the Phylum Mollusca (molluscs), which also includes snails, slugs, clams, scallops, oysters, squids and octopuses. In Ontario all of the mussels are part of the Family Unionidae. Of the 55 species that occur in Canada, Ontario has 41, 28 of which are showing signs of decline. In North America 21 species are already extinct (Metcalfe-Smith and MacKenzie and Carmichael and McGoldrick, 2005). Many methods are used to sample mussels and include: visual searches, tactile searches, sediment collection and sieving, or special methods such as brail bars, dredges, or muskrat middens (Strayer and Smith, 2003). Mussels are preyed upon by various animals such as River Otters, Mink, Raccoons, Muskrats, birds and fish. Many of these predators especially Muskrats, leave piles of mussel shells called middens along the shore and around structures such as tree roots and bridge abutments. During periods of low water, shorelines can be walked to determine if mussels are present in the area (Metcalfe-Smith and MacKenzie and Carmichael and McGoldrick, 2005). No one agency or organization has unlimited resources available to devote to environmental monitoring and research. To help address this fact, whenever possible, CLOCA participates in and partners with national, provincial or municipal networks and agencies. Through just such a partnership, during the summer of 2011, an important discovery was made within the Lynde Shores Conservation Area; specifically the Lynde Creek Marsh. A survey targeting freshwater mussels was conducted by the MNR at various sample locations within the marsh as part of a larger study area along Lake Ontario coastal wetlands. This resulted in the first known record of the Eastern Pondmussel within Lynde Creek Marsh and the CLOCA jurisdiction. This discovery was important due to the fact that the Eastern Pondmussel is a Species at Risk (SAR). Some of the threats facing the Eastern Pondmussel include upstream watershed land uses, Lake Ontario water level regulation, global warming, and likely the largest threat being the Zebra and Quagga Mussel. The Zebra and Quagga Mussel are invasive species that attaches itself to other mussels in large numbers, causing them to suffocate or die from starvation, (MNR, 2010). Central Lake Ontario Conservation Authority Aquatic Monitoring Report
66 8.0 PARTNERSHIPS 8.1 Non-native Aquatic Species Non-Native species (also known as Introduced, Invasive, Alien, Exotic, Naturalized) are plants, animals and microorganisms introduced into areas beyond their native range due to human actions. The introduction might be: Deliberate or accidental Beneficial or harmful From other continents, neighboring countries or from other ecosystems in Canada Invasive species are those most commonly heard about as they are the non-native species whose introduction and spread threatens the environment, the economy or society, including human health. Non-native species are recognized as a serious problem that threatens global biodiversity and human health worldwide. They are one of the leading causes of native species becoming rare, threatened or endangered. The economy also suffers with the spread of non-native species. Millions of dollars are spent on trying to control invasive species when they alter aquatic and terrestrial environments, destroy crops, etc. In the Great Lakes Basin alone, nearly 200 species from around the world have been introduced, including such well known species as the Sea Lamprey and Round Goby (OMNR, 2009). Currently within CLOCA jurisdiction there are six aquatic non-native species of concern: Round Goby Sea Lamprey Common Carp Goldfish Green Sunfish White Perch Management of aquatic invasive species is a difficult task because of their wide range and aggressive life history strategies. For this reason partnerships are critical to monitor and manage changes in their populations. Through our aquatic monitoring programs we actively monitor population sizes and changes and report it each year s Aquatic Monitoring Report. 58 Aquatic Monitoring Report 2011 Central Lake Ontario Conservation Authority


 or the Aquatic Invasive Species program through MNR.")
67 When possible, management of species within our Conservation Lands occurs by either dealing with the biota directly or using education as a tool. Partners with CLOCA, such as Ontario Federation of Anglers and Hunters, the Department of Fisheries and Oceans and the Ministry of Natural Resources, work together to manage and deal with these species as effectively as possible. Information for each species is contained within CLOCA s 2010 Aquatic Monitoring Report. For more information please refer to InvadingSpecies.com through Ontario Federation of Anglers and Hunters (OFAH) or the Aquatic Invasive Species program through MNR. Central Lake Ontario Conservation Authority Aquatic Monitoring Report

68 8.2 Guide to Eating Ontario Sport Fish ( Edition) Through the Durham Region Coastal Wetland Monitoring Project (DRCWMP), CLOCA staff partnered with Ministry of the Environment staff to collect fish samples from various Durham Region Coastal Wetlands. The results from 2010 and 2011 will be incorporated in a future update of the Guide to Eating Ontario Sport Fish. It is anticipated that other locations included in the DRCWMP will be sampled in the near future as well About the guide Staff from the Ontario Ministry of Natural Resources and Ministry of the Environment collect the fish which are then analyzed for a variety of substances, including mercury, PCBs, mirex, DDT and dioxins. The results are used to develop the advisory tables which give sizespecific consumption advice for each species tested from each location. The guide is published every other year. A new interactive version of the guide is available at Guide to Eating Ontario Sport Fish ( Edition) Contaminants in Ontario sport fish Ontario is not unique in having consumption restrictions on sport fish. Most jurisdictions in North America also have them. An extensive review of consumption restrictions on sport fish in North America is available on the Internet at Contaminants found in sport fish originate not only from local sources, but some are transported thousands of kilometers in the atmosphere before being deposited with rainfall. Mercury, PCBs and toxaphene are a few of the contaminants that are known to be transported long distances and can cause low-level contamination even in isolated lakes and rivers. 60 Aquatic Monitoring Report 2011 Central Lake Ontario Conservation Authority

 In order to investigate an occurrence, it will assist")
69 8.3 Fishing Regulations and Enforcement Overview Where permitted, fishing regulations within Conservation Areas as well as throughout the CLOCA jurisdiction are regulated through the Ontario Ministry of Natural Resources (MNR). For up-to-date information on specific Regulations and Acts pertaining to fishing in Ontario, please contact the Ministry of Natural Resources Report a Violation All Ontarians can play a part in protecting our natural resources from waste, abuse and depletion. If you are witness to a resource violation within Ontario, please call the Ministry of Natural Resources TIPS line at: TIPS-MNR ( ) In order to investigate an occurrence, it will assist an officer to know the following information: Nature of violation Vehicle information Location of violation (address, county, township, municipality, lot, concession) Particulars of violation, other relevant information The TIPS-MNR reporting line is not an emergency response telephone number. If you are calling to report public safety matters please call 911 or the police. Please Note: This is not an information line. For general inquiries please call Information for section 10.2 is from ml accessed on April 1, Central Lake Ontario Conservation Authority Aquatic Monitoring Report
70 9.0 RECOMMENDATIONS Section Results Recommendations 2.0 Spawning Survey During 2011, spawning surveys targeting migratory adult Rainbow Trout, Chinook Salmon and White Sucker were conducted on various CLOCA watersheds: 1. Bennett 2. Bowmanville Creek 3. Corbett Creek 4. Darlington Creek 5. Gold Point Creek 6. Harmony Creek 7. Lynde Creek 8. Oshawa Creek 9. Pringle Creek 10. Robinson Creek 11. Tooley Creek 12. Westside Creek Overall stream monitoring efforts during the 2012 season will be focused in the Oshawa Creek watershed. Spawning Surveys should also continue on the Small Watersheds to determine accurate uses by different species. It is recommended that spawning surveys continue as this information is complimentary to standard fish community surveys. Continuing Spawning surveys during the fall is recommended in order to compare the following summer s catch of young-of-year Chinook Salmon. Fishes were observed within Bowmanville, Oshawa, Pringle, Soper and Tooley Creek. High numbers of both Rainbow Trout and Chinook Salmon make runs up the Bowmanville and Soper Creeks in particular. The other creeks may have had runs that were not detected because of low sampling effort. 62 Aquatic Monitoring Report 2011 Central Lake Ontario Conservation Authority
71 Section Results Recommendations 3.0 Biological Water Quality During May and June 2011, CLOCA staff sampled 22 OBBN sites throughout 8 watersheds (Figure 5). One of the sites sampled was a reference site and the remaining 21 sites were test sites, generally at new locations. This was the seventh season that CLOCA has sampled benthos using the OBBN protocol. Overall stream monitoring efforts during the 2012 season will be focused in the Oshawa watershed. In order to compliment this, it is recommended that the OBBN test site locations be selected with regard to OSAP site locations. 4.0 Stream Temperature In total, 78 portable temperature loggers (Figure 6) were installed throughout the CLOCA jurisdiction in 2011 largely in the Bowmanville/Soper Watershed (Figure 7). Overall stream monitoring efforts during the 2012 season will be focused in the Oshawa Watershed. In order to complement this, it is recommended that the majority of stream temperature loggers that are not dedicated to long-term sites be installed at or near OSAP site locations. Data indicates that coolwater and coldwater habitat dominates the areas surveyed with few warmwater sites recorded during The Bowmanville/Soper Creeks have maintained thermal stability is most areas within the headwaters but are at coolwater and close to warmwater in some areas near urban development. Continue to monitor and report on the thermal regimes within these sites over the long-term following the CLOCA Aquatic Monitoring Schedule. Fisheries staff coordinated logger sites with engineering staff as their respective programs complement each other i.e., thermal impacts of stormwater ponds on fish and fish habitat. It is recommended that fisheries staff continue to coordinate logger sites with engineering staff. No new temperature loggers were acquired in It is recommended that additional temperature loggers be acquired as needed to replenish aging stock. As recommended in the 2008 Aquatic Resource Monitoring Report temperature loggers continued to collect minimum temperature data in order to validate groundwater modeling. It is recommended that temperature loggers continue to collect minimum temperature data in order to validate groundwater modeling. Central Lake Ontario Conservation Authority Aquatic Monitoring Report
72 Section Results Recommendations 5.0 Fisheries - Streams During 2011, 58 OSAP sites were sampled by CLOCA as part of the annual aquatic monitoring program and another four were sampled through the OSAP Training Course in the Oshawa Creek watershed. Fish species that were captured are listed in Table 8, Table 9, Table 11, Table 12, and Table 13. Overall stream monitoring efforts during the 2012 season will be focused in the Oshawa watershed. It is recommended that a selection of historical CLOCA fisheries sites and new sites be sampled consistent with the goals and objectives of the FMP. The results of the 2011 CLOCA Aquatic Monitoring are consistent with the goals and objectives of the FMP. The main branches of Bowmanville and Soper Creeks are still dominated by migratory Salmonids and should remain managed as such. Upstream of impassable barriers to fish migration, streams remain dominated by resident coldwater fish communities including Brook Trout, Brown Trout and Sculpin species. These headwaters should continue to be managed for these sustainable and diverse fish communities. It is recommended that the Aquatic Monitoring Program continue to acknowledge and support the goals and recommendations of the CLOCA FMP. 64 Aquatic Monitoring Report 2011 Central Lake Ontario Conservation Authority
73 Section Results Recommendations 5.0 Fisheries Streams con t As with all CLOCA watersheds, aquatic invasive species are present within the Bowmanville/Soper Creek Watershed. Round Goby (Figure 16) are present in the lower sections of both Soper and Bowmanville Creek and although it is thought that Goby likely utilize other areas close to Lake Ontario, there was no evidence of it in It is recommended that fisheries monitoring be conducted annually in the lower section of the major watersheds to help detect change over the long-term e.g., invasion of Round Goby. Continued monitoring of other invasive species and range expansions is recommended for all of the watersheds. Electrofishing was that main method used for conducting fisheries assessments during It is recommended that we continue to explore other methods of sampling, such as rapid dip netting and minnow traps, as a supplemental technique. Each method provides good species distribution data with minimal effort and is a useful technique to help fill in data gaps. During the 2011 season, Gold Point, Robinson and Tooley Coastal Wetlands were sampled for the second time using the OSAP protocol. Results varied from the first round of sampling in It is recommended that these three sites continue to be monitored. Further data will help determine the importance of these systems to fish and how impacted they are. Central Lake Ontario Conservation Authority Aquatic Monitoring Report
74 Section Results Recommendations 6.0 Fisheries - Wetlands In Durham, fisheries sampling was conducted within 15 coastal wetlands through the Durham Region Coastal Wetland Monitoring Project (DRCWMP) in See tables for more information (Table 14, Table 15, Table 16, Table 17, Table 19 and Table 20). Sampling through the DRCWMP in 2012 will include all wetlands in the project. This past summer, fisheries sampling as part of the BQRAP began on August 11 th and finished August 31 st with five Quinte wetlands being sampled: Sampling in the Bay of Quinte area in 2012 through the DRCWMP will re-sample five different BQRAP wetlands. 1. Carnachan Bay Marsh 2. Carrying Place Marsh 3. Hay Bay South 4. Lower Napanee Marsh 5. Sawguin North Marsh As recommended in the 2008 Aquatic Resource Monitoring Report Round Goby locations (i.e., Frenchman s Bay Marsh and Port Newcastle Marsh) were monitored to track changing population trends. It is recommended that currently known Round Goby locations (i.e., Frenchman s Bay Marsh and Port Newcastle Marsh) continue to be monitored to track any changing population trends. Round Goby were found in the following marshes for the first time: Whitby Harbour Complex, Hydro Marsh, Duffins Creek Marsh. 66 Aquatic Monitoring Report 2011 Central Lake Ontario Conservation Authority
75 Section Results Recommendations 6.0 Fisheries Wetlands con t As recommended in the 2008 Aquatic Resource Monitoring Report the barrier beach at McLaughlin Bay Marsh was monitored for breakages to help better understand fish utilization of the marsh. It is recommended that the barrier beach at McLaughlin Bay Marsh continue to be monitored for breakages to help better understand fish utilization of the marsh. As recommended in the 2008 Aquatic Resource Monitoring Report the currently known Goldfish locations (i.e., Rouge River Marsh, Corbett Creek Marsh, Pumphouse Marsh and Oshawa Second Marsh) were monitored to track any changing population trends. It is recommended that currently known Goldfish locations (i.e., Rouge River Marsh, Corbett Creek Marsh, Pumphouse Marsh and Oshawa Second Marsh) continue to be monitored to track any changing population trends. Public education regarding the harmful effects of releasing non-native species into waterways should continue through the DRCWMP, proper signage and public outreach events in which CLOCA is involved. Populations in Pumphouse Marsh and Oshawa Second Marsh appear to be rising continuously. These two marshes have the most established populations of Goldfish. Results from MOE contaminant sampling showed elevated levels of PCB in Common Carp within Lynde Creek Marsh. It is recommended that more sampling and analysis occur at Lynde Creek Marsh. Common Carp should again be analyzed to determine if they are continually high in contaminates and fish with a smaller range should also be analyzed to try and determine if the PCBs are being picked up from Lynde Creek Marsh or a neighbouring wetland and/or Lake Ontario. Sampling conducted by the Ministry of Natural Resources found a population of Eastern Pondmussel (SAR) within Lynde Creek Marsh. It is recommended that CLOCA encourage continued sampling of Eastern Pondmussel in Lynde Creek Marsh and the other wetlands within DRCWMP. CLOCA should also consider Eastern Pondmussel when reviewing planning applications and managing the Conservation Area as directed by MNR. Central Lake Ontario Conservation Authority Aquatic Monitoring Report
76 10.0 REFERENCES Allan, J.D Landscapes and Riverscapes: The influence of Land use of Stream Ecosystems. Annual Review of Ecology, Evolution, and Systematics. 35: Anderson Status of Redside Dace in the Lynde and Pringle Creek Watersheds of Lake Ontario. Canadian Field Naturalist. Bay of Quinte RAP The Big Cleanup, ( Bay of Quinte Remedial Action Plan A Fish Habitat Management Plan for the Bay of Quinte. Bowlby, J.N A Definition for Cold Water Stream. Lake Ontario Management Unit, MNR. Carmine Shiner Recovery Team Recovery strategy for the carmine shiner (Notropis percobromus) in Canada. Species at Risk Act Recovery Strategy Series. Ottawa: Fisheries and Oceans Canada. viii + 40 pp. CLOCA/MNR Draft Central Lake Ontario Fisheries Management Plan: Encompassing the Watersheds of Lynde Creek, Oshawa Creek, Black/Harmony/Farewell Creeks and Bowmanville/Soper Creeks. Central Lake Ontario Conservation Authority and the Ontario Ministry of Natural Resources. 486p. CLOCA Ecological Land Classification mapping. Coker, G.A., C.B. Portt, and C.K. Minns Morphological and ecological characteristics of Canadian freshwater fishes. Can. Man. Rep. Fish. Aquat. Sci. No Dillon Consulting Limited Westside Marsh and Creek Reconfiguration Project completed for St. Mary s Cement Canada Inc. Draft Terms of Reference - Fisheries Management Plan for the Major Watersheds of the Central Lake Ontario Conservation Authority Encompassing the Watersheds of Lynde, Oshawa, Black/Harmony/Farewell and Bowmanville/Soper Creeks Environment Canada Climate Trends and Variations Bulletin Spring Retrieved on May 11, 2011 from Environment Canada and Central Lake Ontario Conservation Authority Durham Region Coastal Wetland Monitoring Project: Methodology Handbook - Second Approximation. 68 Aquatic Monitoring Report 2011 Central Lake Ontario Conservation Authority
77 Environment Canada and Central Lake Ontario Conservation Authority. 2004a. Durham Region Coastal Wetlands: Baseline Conditions and Study Findings (2002 and 2003). Environment Canada, Downsview, ON: ECB-OR, Cat No. En164-3/2003E. Environment Canada and Central Lake Ontario Conservation Authority. 2004b. Durham Region Coastal Wetland Monitoring Project: Year 2 Technical Report. Department of Fisheries and Oceans Operational Statement: Fish habitat and constructing ponds, Fisheries and Oceans, ( Earthfx Inc SPC Accepted CLOCA Tier 1 Water Budget Central Lake Ontario Source Protection Area. Prepared for Central Lake Ontario Conservation Authority. 181pp. Ebersole, J.L., W.J. Liss, and C.A. Frissell Relationship between stream temperature, thermal refugia and rainbow trout Oncorhynchus mykiss abundance in arid-land streams in the northwestern United States. Ecology of Freshwater Fish. 10: Fowler, S.L., D. Hamilton, and S. Currie A comparison of the heat shock response in juvenile and adult rainbow trout (Oncorhynchus mykiss) implications for increased thermal sensitivity with age. Canadian Journal of Fisheries and Aquatic Science. 66: Gartner Lee Ltd Environmental Input to the Stone Street Master Plan. GLL Griffiths, R.W Sampling and Evaluating the Water Quality of Streams in Southern Ontario. Ministry of Municipal Affairs, Toronto, Ontario. Holm, E., and Crossman, E.J A report on a 1985 attempt to survey some areas within the Ontario distribution of Clinostomus elongates, the Redside Dace and to summarize previous records. Royal Ontario Museum. Holm, E., Mandrak, N.E., and Burridge, M.E The ROM field guide to freshwater fishes of Ontario. Royal Ontario Museum, Toronto, Ontario. Jenkins, R.E., and N.M. Burkhead Freshwater fishes of Virginia. American Fisheries Society, Bethesda, Maryland. Jones III, E.B.D, G.S. Helfman, J.O. Harper, and P.V. Bolstad Effects of Riparian Forest Removal on Fish Assemblages in Southern Appalachian Streams. Conservation Biology. 13(6): Jones, N.E., and C. Chu Instruction Manual for Stream Temperature Analysis Tool and Exchange (STATE). River and Stream Ecology Lab, Ontario Ministry of Natural Resources, Trent University, Ontario Jude, D. J. and Pappas, J Fish Utilization of Great Lakes Coastal Wetlands. Journal of Great Lakes Research. 18(4): Central Lake Ontario Conservation Authority Aquatic Monitoring Report
78 Karr, J. R Assessment of biotic integrity using fish communities. Fisheries (Bethesda) 6: LeBlanc, R.T., R.D. Brown, and J. E. FitzGibbon Modeling the Effects of Land Use Change on the Water Temperature in Unregulated Urban Streams. Journal of Environmental Mangement. 49: MacCrimmon, H. R., and J. S. Campbell World distribution of Brook Trout, Salvelinus fontinalis. Journal of the Fisheries Research Board of Canada 26: Metcalfe-Smith, J., A. MacKenzie, I. Carmichael and D. McGoldrick Photo Field Guide to the Freshwater Mussels of Ontario. 60 pp. St. Thomas Field Naturalist Club Inc., St. Thomas, ON, Canada. ISBN Ministry of Environment (MOE) Request for Proposals ("RFP") detailed quantitative ecological risk assessment for Whitby Harbour/Pringle Creek and the floodplain. MNR American Eel (Anguilla rostrata). Fact Sheet MNR Eastern Pondmussel (Ligumia nasuta). Fact Sheet Moore, A.A. and M.A. Palmer Invertebrate biodiversity in agriculture and urban headwater streams: Implications for conservation and management. Ecological Applications. 15(4): Municipality of Clarington Robinson Creek and Tooley Creek Watershed Plan Existing Conditions OBBN, Ministry of Environment (MOE) and Environment Canada (EC) and Acadia Centre for Estuarine Research Ontario Benthos Biomonitoring Network (OBBN) - Protocol Manual, Version 1.0 (May 2005). Ontario Federation of Anglers and Hunters. Fact Sheet - Round Goby (Apollonia melanostoma), accessed 17 June Ontario Ministry of Natural Resources. Species at Risk, Ontario Ministry of Natural Resources and Institute for Watershed Science ThermoStatV2 Tools for Analyzing Thermal Regimes. River and Stream Ecology Lab Trent University Aquatic Monitoring Report 2011 Central Lake Ontario Conservation Authority
79 Oscoz, T., P.M. Leunda, F. Campos, M.C. Escala, C. Garcia-Fresca, R. Miranda Spring diet composition of Rainbow Trout, Oncorhynchus mykiss (Walbuam, 1792) in the Urederra River (Spain). International Journal of Limnology. 41(1): Price, K. and D.S. Leigh Comparative water quality of lightly and moderately impacted streams in the southern Blue Ridge Mountains, USA. Environmental Monitoring and Assessment. 120: Richardson, M. J., F. G. Whoriskey, and L. H. Roy Turbidity generation and biological impacts of an exotic fish Carassius auratus, introduced into shallow seasonally anoxic ponds. Journal of Fish Biology 47: Redside Dace Recovery Team Recovery Strategy for Redside Dace (Clinostomus elongatus)in Ontario. Ontario Recovery Strategy Series. Prepared for the Ontario Ministry of Natural Resources. vi + 24 pp. Roy, A.H., M.C. Freeman, B.J. Freeman, S.J. Wenger, W.E. Ensign, and J.L. Mayer Investigating hydrologic alteration as a mechanism of fish assemblage shifts in urbanizing streams. Journal of the North American Benthological Society. 24(3): Scott W.B. and E.J. Crossman Freshwater Fishes of Canada. Fisheries Research Board of Canada, Bulletin 184. Minister of Supply Services, Hull, Quebec. Sponseller, R.A., E.F. Benfield, and H.M. Valett Relationship between land use, spatial scale and stream macroinvertebrate communities. Freshwater Biology. 46: Stanfield, L. (Editor) Ontario Stream Assessment Protocol. Version 7, Fish and Wildlife Branch. Ontario Ministry of Natural Resources. Peterborough, Ontario. 256 pages. Stanfield, L., Gibson, S., and Borwick, J Using a Landscape Approach to Identify the Distribution and Density Patterns of Salmonids in Lake Ontario Tributaries. American Fisheries Society. 48: Strayer, D.L., and D.R. Smith A guide to sampling freshwater mussel populations. American Fisheries Society Monograph 8: Stoneman, C.L. and M.L. Jones A Simple Method to Classify Stream Thermal Stability with Single Observations of Daily Maximum Water and Air Temperatures. North American Journal of Fisheries Management. 16: Torgersen, C.E., D.M. Price, H.W. Li, and B.A. McIntoch Multiscale thermal refugia and stream habitat associations of Chinook salmon in northeastern Oregon. Ecological Applications. 9: Central Lake Ontario Conservation Authority Aquatic Monitoring Report
80 Utz, R.M., R.H. Hilderbrand, and D.M. Boward Identifying regional difference in threshold responces of aquatic invertebrates to land cover gradients. Ecological Indicators. 9: Utz, R.M., R.H. Hilderbrand, and R.L. Raesly Regional differences in patterns of fish species loss with changing land use. Biological Conservation. 143: Wang, L., J. Lyons, and P. Kanehl Impacts of Urbanization on Stream Habitat and Fish Across Multiple Spatial Scales. Environmental Management. 28(2): Aquatic Monitoring Report 2011 Central Lake Ontario Conservation Authority
81 11.0 APPENDIX I SPAWNING SURVEYS Table 5: Summary of 2011 Spring Spawning Survey observations. Site Number of Times Surveyed Type of Survey Observed Rainbow White Trout Sucker Redd SSBOW01 1 Road Side X SSBOW02 1 Road Side X SSBOW03 1 Road Side SSBOW04 1 Road Side X SSBOW05 1 Road Side X SSBOW06 1 Road Side SSBOW07 1 Road Side SSBOW08 1 Road Side SSBOW09 1 Road Side SSBOW10 1 Road Side SSBOW11 1 Road Side SSBT01 1 Roadside SSCOR02 1 Road Side SSCOR04 1 Road Side SSDAR01 1 Road Side SSDAR02 1 Road Side SSDAR05 1 Road Side SSGP01 1 Creek Walk SSHAR06 1 Creek Walk SSHAR07 1 Creek Walk SSHAR14 1 Creek Walk SSLYN36 1 Creek Walk SSOSH06 1 Creek Walk X X SSOSH07 1 Creek Walk X X SSOSH08 1 Creek Walk X SSOSH09 1 Creek Walk X SSOSH10 1 Creek Walk SSOSH11 1 Creek Walk X SSOSH12 1 Creek Walk X SSOSH13 1 Creek Walk X SSPRI08 1 Creek Walk SSPRI12 1 Road Side SSPRI15 2 Creek Walk X X SSPRI16 2 Creek Walk X SSROB03 1 Creek Walk Site Number of Times Type of Survey Observed Spawning Central Lake Ontario Conservation Authority Aquatic Monitoring Report
82 Surveyed Rainbow White Trout Sucker Redd Spawning SSROB04 1 Creek Walk X SSTLY01 2 Road Side SSTLY03 2 Road Side SSTLY04 2 Road Side X X X SSSOP02 1 Road Side SSSOP04 1 Road Side SSSOP05 1 Road Side SSSOP09 1 Road Side X X SSSOP10 1 Road Side X SSSOP11 1 Road Side SSSOP12 1 Road Side SSSOP13 1 Road Side SSSOP14 1 Road Side SSSOP15 1 Road Side SSSOP16 1 Roadside X X Roadside survey is observations made at the intersection of the road and Creek Walk has a start point and an end point over a larger area 74 Aquatic Monitoring Report 2011 Central Lake Ontario Conservation Authority
83 12.0 APPENDIX II BIOLOGICAL WATER QUALITY Table 6: Percent EPT and Family Richness for OBBN sites sampled in 2011 including their historical results if applicable. Side Code Date Methodology %EPT Family Richness 05/10/05 Combined Riffle /23/06 Riffle BOWOB01 Pool Riffle /18/11 Riffle Pool /27/05 Combined Riffle /30/06 Riffle Pool Riffle /05/07 Riffle Pool BOWOB03 Riffle /30/08 Riffle Pool Riffle /19/10 Riffle Pool Riffle /11/11 Riffle Pool /25/05 Combined OAOB03 Riffle /30/11 Riffle Pool Riffle OAOB22 05/27/11 Riffle Pool Central Lake Ontario Conservation Authority Aquatic Monitoring Report
84 Side Code Date Methodology %EPT 76 Aquatic Monitoring Report 2011 Central Lake Ontario Conservation Authority Family Richness Riffle OAOB23 05/31/11 Riffle Pool Riffle OAOB24 05/16/11 Riffle Pool Riffle OAOB25 05/17/11 Riffle Pool /03/05 Combined Riffle /24/06 Riffle SOPOB01 Pool Riffle /31/11 Riffle Pool Riffle HC /30/11 Riffle Pool Riffle HD /11/11 Riffle Pool Riffle HD /27/11 Riffle Pool Riffle HD /16/11 Riffle Pool Riffle HD /17/11 Riffle Pool Riffle HD /24/11 Riffle Pool
85 Side Code Date Methodology %EPT 15 2HD /16/ HD /20/ HD /25/ HD /17/ HD /18/ HD /24/ HD /24/ HD /30/11 Family Richness Riffle Riffle Pool Riffle Riffle Pool Riffle Riffle Pool Riffle Riffle Pool Riffle Riffle Pool Riffle Riffle Pool Riffle Riffle Pool Riffle Riffle Pool Central Lake Ontario Conservation Authority Aquatic Monitoring Report
86 13.0 APPENDIX III STREAM TEMPERATURE Table 7: Summary of temperature logger data collected from CLOCA jurisdiction during 2011 with comparison to data when available. Site Code Year Logger Serial No. Period of Record Percent of period within thermal regime Max. ( C) Min. ( C) Percent of Period Above Upper Lethal Percent of time exceeding (for summer period) Classification Entire Data Set Chinook Salmon ( > 24.1 o C) Brown/Brook Trout (> 24.9 o C) Rainbow Trout (> 25.2 o C) Atlantic Salmon (> 26.1 o C) Cold Cool Warm 5% 25% July 1, 2005 to August 31, Coldwater 2 TLBOW July 1, 2008 to August 31, Coldwater July 1, 2011 to August 31, Coldwater July 1, 2005 to August 31, Coolwater 5 TLBOW July 1, 2008 to August 31, Coldwater July 1, 2011 to August 31, Coldwater July 1, 2005 to August 31, Coldwater July 1, 2006 to August 31, Coldwater 9 TLBOW July 1, 2007 to August 31, Coldwater July 1, 2008 to August 31, Coldwater July 1, 2011 to August 31, Coldwater July 1, 2006 to August 31, Warmwater 13 TLBOW July 1, 2010 to August 31, Coolwater July 1, 2011 to August 31, Coolwater July 1, 2006 to August 31, Coolwater TLBOW July 1, 2011 to August 31, Coolwater July 1, 2006 to August 31, Coldwater 18 TLBOW July 1, 2008 to August 31, Coldwater July 1, 2011 to August 31, Coldwater July 1, 2006 to August 31, Coolwater TLBOW July 1, 2011 to August 31, Coolwater July 1, 2006 to August 31, Coldwater TLBOW July 1, 2011 to August 31, Coldwater July 1, 2006 to August 31, Coolwater TLBOW July 1, 2011 to August 31, Coolwater July 1, 2006 to August 31, Coldwater TLBOW July 1, 2011 to August 31, Coldwater July 1, 2006 to August 31, Coldwater 29 TLBOW July 1, 2007 to August 31, Coldwater July 1, 2011 to August 31, Coldwater July 22, 2006 to August 31, Coldwater** TLBOW July 1, 2011 to August 31, Coldwater July 1, 2006 to August 31, Coolwater** TLBOW July 1, 2011 to August 31, Coolwater July 1, 2008 to August 31, Coolwater TLBOW July 1, 2011 to August 31, Coolwater Aquatic Monitoring Report 2011 Central Lake Ontario Conservation Authority
87 Site Code Year Logger Serial No. Period of Record Percent of period within thermal regime Max. ( C) Min. ( C) Percent of Period Above Upper Lethal Percent of time exceeding (for summer period) Classification Entire Data Set Chinook Salmon ( > 24.1 o C) Brown/Brook Trout (> 24.9 o C) Rainbow Trout (> 25.2 o C) Atlantic Salmon (> 26.1 o C) Cold Cool Warm 5% 25% July 1, 2008 to August 31, Coolwater TLBOW July 1, 2011 to August 31, Coolwater July 1, 2008 to August 31, Coldwater TLBOW July 1, 2011 to August 31, Coldwater July 1, 2008 to August 31, Coldwater TLBOW July 1, 2011 to August 31, Coldwater July 1, 2008 to August 31, Coldwater TLBOW July 1, 2011 to August 31, Coolwater 45 TLBOW July 1, 2011 to August 31, Coldwater 46 TLBOW July 1, 2011 to August 31, Coldwater 47 TLBOW July 1, 2011 to August 31, Coolwater 48 TLBOW July 1, 2011 to August 31, Coldwater 49 TLBOW July 1, 2011 to August 31, Coldwater 50 TLBOW July 1, 2011 to August 31, Coolwater 51 TLBOW July 1, 2011 to August 31, Coolwater 52 TLBOW July 1, 2011 to August 31, Coldwater 53 TLBOW July 4, 2011 to August 31, Coldwater 54 TLBOW July 4, 2011 to August 31, Coldwater 55 TLBOW July 1, 2011 to August 31, Coolwater 56 TLBOW July 1, 2011 to August 31, Coolwater June 1, 2008 to August 31, Coolwater TLBT July 1, 2010 to August 31, 2010 No Data Logger Missing July 1, 2011 to August 31, Coolwater June 24, 2005 to August 31, Warmwater July 1, 2006 to August 31, Coolwater 62 TLCE July 4, 2009 to August 31, Coolwater July 1, 2010 to August 31, Coolwater July 1, 2011 to August 31, Coolwater June 23, 2005 to August 31, Warmwater July 1, 2006 to August 31, Coolwater 67 TLCW July 4, 2009 to August Coolwater July 1, 2010 to August 31, Warmwater July 1, 2011 to August 31, Warmwater July 1, 2005 to August 31, Coolwater July 1, 2006 to August 31, Coolwater 3 TLDN July 3, 2009 to August 31, Coolwater July 1, 2011 to August 31, Coolwater July 1, 2005 to Aug 31, Coolwater July 1, 2006 to Aug 31, Coolwater 76 TLDN July 2, 2009 to August 31, Coolwater July 1, 2010 to August 31, Coolwater July 1, 2011 to August 31, Coolwater Central Lake Ontario Conservation Authority Aquatic Monitoring Report
88 Site Code Year Logger Serial No. Period of Record Percent of period within thermal regime Max. ( C) Min. ( C) Percent of Period Above Upper Lethal Percent of time exceeding (for summer period) Classification Entire Data Set Chinook Salmon ( > 24.1 o C) Brown/Brook Trout (> 24.9 o C) Rainbow Trout (> 25.2 o C) Atlantic Salmon (> 26.1 o C) Cold Cool Warm 5% 25% June 1, 2008 to August 31, Coolwater July 1, 2009 to August 31, Coolwater TLFA July 1, 2010 to August 31, Coolwater July 1, 2011 to August 31, Coolwater June 1, 2008 to August 31, Coolwater July 1, 2009 to August 31, Coolwater TLFA July 1, 2010 to August 31, Coolwater July 1, 2011 to August 31, Coolwater July 1, 2010 to August 31, 2010 No Data Logger Missing TLGP July 1, 2011 to August 31, Coolwater June 1, 2008 to August 31, Coolwater June 25, 2009 to August 31, Coolwater TLHA July 1, 2010 to August 31, Coolwater July 1, 2011 to August 31, Coolwater July 1, 2009 to August 31, Coolwater 94 TLLY July 1, 2010 to August 31, 2010 No Data Logger Missing July 1, 2011 to August 31, Coolwater July 1, 2007 to August 31, Coolwater 97 TLOA July 1, 2010 to August 31, Coolwater July 1, 2011 to August 31, Coolwater July 1, 2009 to August 31, Coldwater 100 TLOSB July 8, 2010 to August 31, ** 18.3** Coldwater July 1, 2011 to August 31, Coldwater No Data Logger Missing May 24, 2006 to Jan 4, Coolwater July 1, 2007 to August 31, Coolwater 105 TLPR June 1, 2008 to August 31, Coolwater July 1, 2009 to August 31, Coolwater July 1, 2010 to August 31, Coolwater July 1, 2011 to August 31, Coolwater July 1, 2007 to August 31, Coolwater June 26, 2008 to August 31, Coolwater TLPR July 1, 2010 to August 31, Coolwater July 1, 2011 to August 31, Coolwater July 1, 2009 to August 31, Coolwater 114 TLPR July 1, 2010 to August 31, Coolwater July 1, 2011 to August 31, Coolwater July 1, 2005 to August 31, Warmwater July 1, 2006 to August 31, Warmwater TLROB July 1, 2010 to August 31, Warmwater July 1, 2011 to August 31, Warmwater 9 80 Aquatic Monitoring Report 2011 Central Lake Ontario Conservation Authority
89 Site Code Year Logger Serial No. Period of Record Percent of period within thermal regime Max. ( C) Min. ( C) Percent of Period Above Upper Lethal Percent of time exceeding (for summer period) Classification Entire Data Set Chinook Salmon ( > 24.1 o C) Brown/Brook Trout (> 24.9 o C) Rainbow Trout (> 25.2 o C) Atlantic Salmon (> 26.1 o C) Cold Cool Warm 5% 25% 120 TLROB July 1, 2009 to August 31, Coolwater July 1, 2009 to August 31, Coolwater July 1, 2010 to August 31, Coolwater July 1, 2011 to August 31, Coolwater July 1, 2005 to August 31, Warmwater TLSOP July 1, 2006 to August 31, Coolwater July 1, 2011 to August 31, Coldwater July 1, 2005 to August 31, Coolwater 128 TLSOP July 1, 2006 to August 31, Coolwater July 1, 2011 to August 31, Coolwater May 25, 2006 to December 21, Coolwater 131 TLSOP July 1, 2010 to August 31, Coolwater July 1, 2011 to August 31, Coolwater July 1, 2006 to August 31, Coldwater 134 TLSOP July 1, 2009 to August 31, Coldwater July 1, 2011 to August 31, 2011 No Data Logger Missing July 1, 2006 to August 31, Coldwater TLSOP July 1, 2011 to August 31, Coldwater July 20, 2006 to August 31, Coolwater** 139 TLSOP July 1, 2009 to August 31, Coolwater July 1, 2011 to August 31, Coolwater July 26, 2006 to August 31, Coolwater** TLSOP July 1, 2011 to August 31, Coolwater July 24, 2006 to August 31, Coolwater** TLSOP July 1, 2011 to August 31, Coolwater July 1, 2005 to August 31, Coldwater June 1, 2006 to November 13, Coldwater July 1, 2007 to August 31, Coldwater 148 TLSOP July 1, 2008 to August 31, Coldwater July 3, 2009 to August 31, Coldwater July 1, 2010 to August 31, Coldwater July 1, 2011 to August 31, Coldwater July 1, 2005 to August 31, Coldwater June 10, 2006 to November 22, Coldwater July 1, 2007 to August 31, Coldwater 155 TLSOP July 1, 2008 to August 31, Coldwater July 2, 2009 to August 31, Coldwater July 1, 2010 to August 31, Coldwater July 1, 2011 to August 31, Coldwater July 1, 2009 to August 31, Coldwater 3 TLSOP July 1, 2011 to August 31, Coldwater TLSOP July 1, 2009 to August 31, Coldwater Central Lake Ontario Conservation Authority Aquatic Monitoring Report
90 Site Code Year Logger Serial No. Period of Record Percent of period within thermal regime Max. ( C) Min. ( C) Percent of Period Above Upper Lethal Percent of time exceeding (for summer period) Classification Entire Data Set Chinook Salmon ( > 24.1 o C) Brown/Brook Trout (> 24.9 o C) Rainbow Trout (> 25.2 o C) Atlantic Salmon (> 26.1 o C) Cold Cool Warm 5% 25% July 1, 2011 to August 31, Warmwater July 1, 2009 to August 31, Coldwater TLSOP July 1, 2011 to August 31, Coldwater 165 TLSOP July 1, 2011 to August 31, Coldwater 166 TLSOP July 1, 2011 to August 31, Coldwater 167 TLSOP July 1, 2011 to August 31, Coolwater 168 TLSOP July 1, 2011 to August 31, Coldwater 169 TLSOP July 1, 2011 to August 31, Coldwater 170 TLSOP July 1, 2011 to August 31, Coldwater 171 TLSOP July 1, 2011 to August 31, Coldwater 172 TLSOP July 1, 2011 to August 31, Coolwater 173 TLSOP July 1, 2011 to August 31, Coldwater 174 TLSOP July 1, 2011 to August 31, Coolwater 175 TLSOP July 1, 2011 to August 31, ?? 176 TLSOP July 1, 2011 to August 31, Coolwater 177 TLSOP July 1, 2011 to August 31, Coolwater 178 TLSOP July 1, 2011 to August 31, Coolwater 179 TLSOP July 1, 2011 to August 31, Coolwater 180 TLSOP July 1, 2011 to August 31, Coolwater 181 TLSOP July 1, 2011 to August 31, Coolwater 182 TLSOP July 1, 2011 to August 31, Coolwater June 29, 2005 to August 31, Warmwater July 1, 2006 to August 31, Coolwater 185 TLTY July 1, 2009 to August 31, Coolwater July 1, 2010 to August 31, ** 22.3** Coolwater July 1, 2011 to August 31, Warmwater 13 Maximum temperature generally occurs during July or August but is reported from entire data set Minimum temperature is reported from entire data set which generally also includes cold-weather conditions i.e., sampling period in December Minimum temperature does not completely reflect cold-weather conditions since the Period of Record ended before coldest part of Winter ** Exceedence based on August temperatures only *Minimum temperature recorded during time where Logger was likely out-of-water Maximum temperature occurred during June ## - represents the number of days the logger recorded and out-of-water day (over ten degree Celsius change in temperature within one day) likely mis-representing thermal regime as air temperature is being recorded 82 Aquatic Monitoring Report 2011 Central Lake Ontario Conservation Authority
91 14.0 APPENDIX IV FISHERIES SAMPLING (STREAM) Table 8: Number of fish species and individuals caught at OSAP sites during 2011 sampling compared to historical sampling results (when available) BA01 BA04 BA05 BA12 BA13 BAS01 BAS02 BAS03 BAS04 BAS05 BB02 BB04 BB08 BB09 BB17 BC03 BC06 BD01 BD04 BD05 Fish Species (common name) American Brook Lamprey Blacknose Dace Bluntnose Minnow Brook Trout Brook Trout (YOY) Brown Trout Brown Trout (YOY) Chinook Salmon Coho Salmon Common Shiner Creek Chub Fathead Minnow 1 Golden Shiner 1 Johnny Darter Log Perch 1 1 Longnose Dace Mottled Sculpin Northern Redbelly Dace Pumpkinseed Raindow Darter Rainbow Trout (YOY) Rainbow Trout Round Goby 19 Sea Lamprey 1 Slimy Sculpin Unknown YOY minnows* Unknown YOY salmonids* 7 White Sucker No Catch No Catch No Catch No Catch Yellow Perch 1 Grand Total Species Total Effort (s/m 3 ) Central Lake Ontario Conservation Authority Aquatic Monitoring Report
 con t.")
92 Table 9: Number of fish species and individuals caught at OSAP sites during 2011 sampling compared to historical sampling results (where available) con t. 84 Aquatic Monitoring Report 2011 Central Lake Ontario Conservation Authority


 con t.")

93 Table 10: Number of fish species and individuals caught at OSAP sites during 2011 sampling compared to historical sampling results (where available) con t.: Central Lake Ontario Conservation Authority Aquatic Monitoring Report


.")

94 Table 11: Number of fish species and individuals caught a long-term annual monitoring OSAP sites during 2011 sampling compared to historical sampling results (where available). 86 Aquatic Monitoring Report 2011 Central Lake Ontario Conservation Authority


95 Table 12: Number of fish and individuals caught at BWDJ in 2011 compared to historical results. * - undetermined identification; possibly American Brook Lamprey or Sea Lamprey Note: YOY or young-of-the-year refers to fishes that are in their first year of life i.e., < 100 mm. Central Lake Ontario Conservation Authority Aquatic Monitoring Report


96 Table 13: Number of species caught at OSAP Training Course sites within Oshawa Creek watershed in 2011 compared to historical results (where applicable). Note: YOY or young-of-the-year refers to fishes that are in their first year of life i.e., < 100 mm. - site was not sampled with consistent effort therefore only presence information is reported. 88 Aquatic Monitoring Report 2011 Central Lake Ontario Conservation Authority


97 15.0 APPENDIX V FISHERIES SAMPLING (COASTAL WETLAND) Table 14: Number of fish and species caught at CLOCA coastal wetlands from Central Lake Ontario Conservation Authority Aquatic Monitoring Report


98 Table 15: Number of fish and species caught at CLOCA coastal wetlands from con'd. 90 Aquatic Monitoring Report 2011 Central Lake Ontario Conservation Authority


99 Table 16: Number of fish and species caught at GRCA coastal wetlands from Central Lake Ontario Conservation Authority Aquatic Monitoring Report


100 Table 17: Number of fish and species caught at TRCA coastal wetlands from Aquatic Monitoring Report 2011 Central Lake Ontario Conservation Authority


101 Table 18: Number of fish and species caught at TRCA coastal wetlands from Central Lake Ontario Conservation Authority Aquatic Monitoring Report


.")

102 Table 19: Number of fish and species caught at Quinte coastal wetlands during 2011 sampling compared to historical sampling results (where available). 94 Aquatic Monitoring Report 2011 Central Lake Ontario Conservation Authority


103 Table 20: IBI results of DRCWMP Fish Sampling from Central Lake Ontario Conservation Authority Aquatic Monitoring Report
104 Table 21: Average IBI score for all wetlands sampled within in each jurisdictional area (Ganaraska Region CA, Central Lake Ontario CA, Toronto Region CA, Quinte) per year. Years may vary in the number of wetlands sampled due to water levels or other uncontrollable conditions Total Ganaraska Region CA Wetlands Central Lake Ontario CA Wetlands Toronto Region CA Wetlands Quinte Wetlands Aquatic Monitoring Report 2011 Central Lake Ontario Conservation Authority

 Central Lake")

105 16.0 APPENDIX VI CLIMATE TRENDS (ENVIRONMENT CANADA, 2011) Central Lake Ontario Conservation Authority Aquatic Monitoring Report


106 98 Aquatic Monitoring Report 2011 Central Lake Ontario Conservation Authority


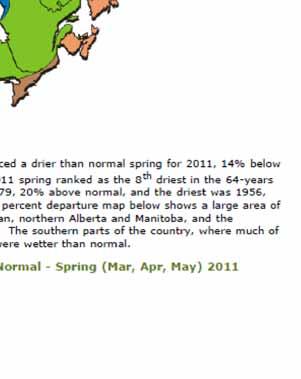
107 Central Lake Ontario Conservation Authority Aquatic Monitoring Report


108 100 Aquatic Monitoring Report 2011 Central Lake Ontario Conservation Authority


109 Central Lake Ontario Conservation Authority Aquatic Monitoring Report


110 17.0 AMERICAN EEL 102 Aquatic Monitoring Report 2011 Central Lake Ontario Conservation Authority


111 Central Lake Ontario Conservation Authority Aquatic Monitoring Report


112 104 Aquatic Monitoring Report 2011 Central Lake Ontario Conservation Authority


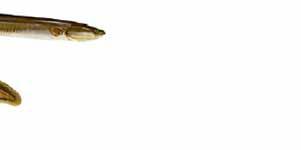
113 Central Lake Ontario Conservation Authority Aquatic Monitoring Report


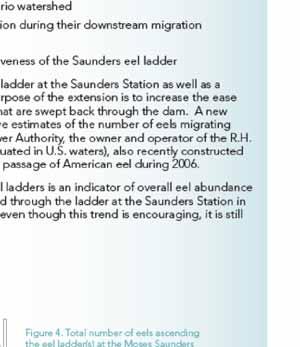

114 106 Aquatic Monitoring Report 2011 Central Lake Ontario Conservation Authority


115 Central Lake Ontario Conservation Authority Aquatic Monitoring Report
Aquatic Monitoring Report
 2012 Aquatic Monitoring Report What we do on the land is mirrored in the water Working In Partnership: Report No.: 2011-03MR ACKNOWLEDGEMENTS Contributors to the 2012 Aquatic Monitoring Report include:
FISHERIES MANAGEMENT PLAN FOR DUFFINS CREEK AND CARRUTHERS CREEK JUNE, 2004
 FISHERIES MANAGEMENT PLAN FOR DUFFINS CREEK AND CARRUTHERS CREEK JUNE, 2004 Toronto and Region Conservation 2004 ISBN0-9732764-0-1 www.trca.on.ca 5 Shoreham Drive, Toronto, Ontario M3N 1S4 phone: 416-661-6600
Minnesota Department of Natural Resources Division of Fish and Wildlife Section of Fisheries. Stream Survey Report. Luxemburg Creek.
 Minnesota F-29-R(P)-24 Area 315 Study 3 March 2016 Minnesota Department of Natural Resources Division of Fish and Wildlife Section of Fisheries Stream Survey Report Luxemburg Creek 2015 Mark Pelham Sauk
Minnesota Department of Natural Resources Division of Fish and Wildlife Section of Fisheries. Stream Survey Report. Cold Spring Creek.
 Minnesota F-29-R(P)-24 Area 315 Study 3 March 2015 Minnesota Department of Natural Resources Division of Fish and Wildlife Section of Fisheries Stream Survey Report Cold Spring Creek 2014 Mark Pelham Montrose
CHAPTER 4 DESIRED OUTCOMES: VISION, GOALS, AND OBJECTIVES
 CHAPTER 4 DESIRED OUTCOMES: VISION, GOALS, AND OBJECTIVES Vision One of the first steps in developing this Plan was articulating a vision - a clear statement of what the Plan strives to achieve and what
Instream Barrier Action Plan
 Instream Barrier Action Plan Action Plan #17 February 2017 Contents 1. INTRODUCTION... 1-1 1.1 PURPOSE... 1-1 1.2 CONTEXT OF THIS ACTION PLAN AND WATERSHED PLANNING... 1-2 2. METHODOLOGY... 2-1 3 Top Barriers
FISHERIES BLUE MOUNTAINS ADAPTATION PARTNERSHIP
 FISHERIES A warming climate, by itself, substantially affects the hydrology of watersheds in the Blue Mountains. Among the key hydrologic changes projected under all scenarios for the 2040s and beyond
Five Counties Salmonid Conservation Program - Fish Passage Design Workshop. February 2013
 Program - Aquatic Organisms and Stream Crossings Ecological Connectivity A watershed is a network of channels that drain a common boundary. Channel characteristics formed by interaction of precipitation,
Columbia Lake Dam Removal Project
 Columbia Lake Dam Removal Project The Columbia Lake dam located 1/4 mile upstream of the Paulins Kill River's confluence with the Delaware River in Knowlton Township, Warren County has been proposed for
Relationships Between Aggregate Extraction, Groundwater and Salmonid Populations in a Southern Ontario Trout Stream.
 Relationships Between Aggregate Extraction, Groundwater and Salmonid Populations in a Southern Ontario Trout Stream. C.D. Wren 1, N.A. Harttrup 1, A. Hims 2, R. VanOoteghem 3 and S. Lowe 4. 1. ESG International
The Blue Heron Slough Conservation Bank
 1 The Blue Heron Slough Conservation Bank CONSERVATION BANKING July 19-23, 2010 CASE STUDY SERIES The Blue Heron Slough Conservation Bank (Washington) I. OVERVIEW & BACKGROUND: Location: Snohomish River
STEELHEAD SURVEYS IN OMAK CREEK
 STEELHEAD SURVEYS IN OMAK CREEK 2002 Annual Report Prepared by Chris Fisher John Arterburn Colville Confederated Tribes Fish and Wildlife Department P.O. Box 150 Nespelem, WA 99155 Prepared for Project
MINISTRY OF ENVIRONMENT ENVIRONMENTAL STEWARDSHIP DIVISION FISH AND WILDLIFE BRANCH. Horsefly River Angling Management Plan
 MINISTRY OF ENVIRONMENT ENVIRONMENTAL STEWARDSHIP DIVISION FISH AND WILDLIFE BRANCH Horsefly River Angling Management Plan January 30 th, 2006 Area/Fishery Description The Horsefly River watershed provides
Eastern Brook Trout. Roadmap to
 Eastern Brook Trout Roadmap to CONSERVATION Our Brook Trout heritage he wild Brook Trout is an American symbol of persistence, adaptability, and the pristine wilderness that covered North America prior
Final Bull Trout Genetics Monitoring Plan for the Wallowa Falls Hydroelectric Project. (FERC No. P-308) June 2017
 June 2017") Final for the Wallowa Falls Hydroelectric Project (FERC No. P-308) June 2017 Prepared by: Jeremiah Doyle PacifiCorp 825 NE Multnomah Street Portland, OR 97232 June, 2017 Page 1 of 8 Table of Contents 1.0
Final for the Wallowa Falls Hydroelectric Project (FERC No. P-308) June 2017 Prepared by: Jeremiah Doyle PacifiCorp 825 NE Multnomah Street Portland, OR 97232 June, 2017 Page 1 of 8 Table of Contents 1.0
Job 1. Title: Estimate abundance of juvenile trout and salmon.
 STUDY PERFORMANCE REPORT State: Michigan Project No.: F-53-R-13 Study No.: 461 Title: Population dynamics of juvenile rainbow trout and coho salmon in Lake Superior tributaries Period Covered: April 1,
Minnesota Department of Natural Resources Division of Fish and Wildlife Section of Fisheries. Stream Survey Report. Cold Spring Creek.
 Minnesota F-29-R(P)-24 Area 315 Study 3 March 2013 Minnesota Department of Natural Resources Division of Fish and Wildlife Section of Fisheries Stream Survey Report Cold Spring Creek 2012 Mark Pelham Montrose
Klamath Lake Bull Trout
 Klamath Lake Bull Trout Existing Populations The Klamath Lake Bull Trout SMU is comprised of seven existing populations and four populations classified as extinct or functionally extinct (Table 189). Populations
2013 Electrofishing Program Summary. Miramichi Salmon Association In collaboration with the Department of Fisheries and Oceans
 2013 Electrofishing Program Summary Miramichi Salmon Association In collaboration with the Department of Fisheries and Oceans Prepared by: Alex Parker Biologist Miramichi Salmon Association 485, Route
Fraser River. FISH SURVEY AND MANAGEMENT INFORMATION Jon Ewert - Aquatic Biologist (Hot Sulphur Springs)
") Fraser River FISH SURVEY AND MANAGEMENT INFORMATION Jon Ewert - Aquatic Biologist (Hot Sulphur Springs) General Information: The Fraser River is a highly diverse river offering many transitions in habitat
Fraser River FISH SURVEY AND MANAGEMENT INFORMATION Jon Ewert - Aquatic Biologist (Hot Sulphur Springs) General Information: The Fraser River is a highly diverse river offering many transitions in habitat
Abundance of Steelhead and Coho Salmon in the Lagunitas Creek Drainage, Marin County, California
 scanned for KRIS Abundance of Steelhead and Coho Salmon in the Lagunitas Creek Drainage, Marin County, California Prepared for: Marin Municipal Water District 220 Nellen Drive Corte Madera, California
Minnesota Department of Natural Resources Division of Fish and Wildlife Section of Fisheries. Stream Survey Report. Three Mile Creek 2011
 Minnesota Department of Natural Resources Division of Fish and Wildlife Section of Fisheries Stream Survey Report Three Mile Creek 2011 By Joseph D. Stewig Montrose Area Fisheries Office TABLE OF CONTENTS
Trout Unlimited Comments on the Scope of Environmental Impact Statement for the Constitution Pipeline Project, Docket No. PF12-9
 October 9, 2012 Kimberly D. Bose, Secretary Federal Energy Regulatory Commission 888 First Street, NE, Room 1A Washington, DC 20426 RE: Trout Unlimited Comments on the Scope of Environmental Impact Statement
Black Sturgeon Regional Plan
 Black Sturgeon Regional Plan This is one of twenty Regional Plans that support implementation of the Lake Superior Biodiversity Conservation Strategy (Strategy). The Strategy, prepared and overseen by
STREAM SURVEY File form No..
 scanned for KRIS THE RESOURCES AGENCY OF CALIFORNIA California Department of Fish and Game STREAM SURVEY File form No.. Date: September 4, 1969. NAME: North Fork Schooner Gulch Creek COUNTY: Mendocino.
COLUMBIA LAKE DAM REMOVAL PROJECT
 COLUMBIA LAKE DAM REMOVAL PROJECT Major Goals of the Columbia Lake Dam Removal: Reconnect 10 miles of the Paulins Kill River to the Delaware River, restoring natural flow regime and sediment transport.
Columbia Lake Dam Removal Project
 Columbia Lake Dam Removal Project Major Goals of the Columbia Lake Dam Removal: Reconnect 10 miles of the Paulins Kill River to the Delaware River, restoring natural flow regime and sediment transport.
Firth Creek Habitat Enhancement Project 1993
 Firth Creek Habitat Enhancement Project 1993 A. R. Langston December 1993 PWFWCP Report No. 77 The Peace/Williston Fish & Wildlife Compensation Program is a cooperative venture of BC Hydro and the provincial
Distribution. PFBC Northcentral Region Law Enforcement Office, Attention: WCO Kraynak, 1150 Spring Creek Road, Bellefonte, PA 16823
 Distribution Pennsylvania Department of Environmental Protection, Northcentral Region Office, Attention: Steve Means, 208 West Third St. Suite 101, Williamsport, PA 17701 PFBC Northcentral Region Law Enforcement
Report prepared for: Prepared by: January 2002 BEAK Ref
 AQUATIC ENVIRONMENTAL STUDY KANATA WEST CONCEPT PLAN Report prepared for: ROBINSON CONSULTANTS Prepared by: BEAK INTERNATIONAL INCORPORATED 14 Abacus Road Brampton, Ontario L6T 5B7 January 2002 BEAK Ref.
FISHERIES MANAGEMENT PLAN FOR DUFFINS CREEK AND CARRUTHERS CREEK
 FISHERIES MANAGEMENT PLAN FOR DUFFINS CREEK AND CARRUTHERS CREEK JUNE, 2004 Toronto and Region Conservation 2004 ISBNO-9732764-0-1 www.trca.on.ca 5 Shoreham Drive, Toronto, Ontario M3N 1S4 phone: 416-661-6600
ELECTRO-FISHING REPORT 2016 UPPER TWEED
 ELECTRO-FISHING REPORT 2016 UPPER TWEED The electro-fishing programme carried out each summer by The Tweed Foundation is part of our management plan, which details the information that is required to manage
Notebooks or journals for drawing and taking notes
 Title: Have to Have a Habitat Grade Level: 5 th -8 th grade Topic: Trout Habitat Background: The following chart lists the ideal conditions for trout habitat. Dissolved Oxygen: > 7 mg/l ph: 5.5-7 Next
Appendix A Recommended EPA Temperature Thresholds for use in Establishing Thermal Potential and Species Life Stage Numeric Criteria
 Appendix A Recommended EPA Temperature Thresholds for use in Establishing Thermal Potential and Species Life Stage Numeric Criteria 1. Temperature Limits Recommended to Protect Salmonid Guilds In this
Alberta Conservation Association 2017/18 Project Summary Report
 Alberta Conservation Association 2017/18 Project Summary Report Project Name: Abundance, Distribution, Spawning, and Thermal Habitat of Westslope Cutthroat Trout and Bull Trout in the Stimson Creek Watershed
Southern Oregon Coastal Cutthroat Trout
 Species Management Unit Description Southern Oregon Coastal Cutthroat Trout The Southern Oregon Coastal Cutthroat Trout SMU includes all populations of cutthroat trout inhabiting ocean tributary streams
Big Spring Creek Habitat Enhancement and Fishery Management Plans
 Big Spring Creek Habitat Enhancement and Fishery Management Plans November 5, 2012 Big Spring Events and Activities Center Newville, PA Charlie McGarrell Regional Habitat Biologist Pennsylvania Fish and
Executive Summary. Map 1. The Santa Clara River watershed with topography.
 Santa Clara River Steelhead Trout: Assessment and Recovery Opportunities December 2005 Prepared By: Matt Stoecker and Elise Kelley, Ph.D. University of California, Santa Barbara Prepared For: The Santa
STREAM CLASSIFICATION AND MAPPING. Prepared For. MacMillan Bloedel Ltd. Menzies Bay Division BOX 6000, Campbell River V9W 5E1.
 STREAM CLASSIFICATION AND MAPPING OF STREAMS IN MENZIES AND OYSTER BAY Prepared For MacMillan Bloedel Ltd. Menzies Bay Division BOX 6000, Campbell River V9W 5E1 September 1998 a a North Island Biological
Deschutes Bull Trout
 Deschutes Bull Trout Existing Populations The Deschutes Bull Trout SMU is comprised of eight populations, three of which are classified as extinct (Table 1). Populations are identified according to those
Final Fish Salvage & Temporary Tailrace Barrier Report for the Wallowa Falls Hydroelectric Project Tailrace. (FERC No. P-308) December 20, 2018
 December 20, 2018") Final Fish Salvage & Temporary Tailrace Barrier Report for the Wallowa Falls Hydroelectric Project Tailrace (FERC No. P-308) December 20, 2018 Prepared by: Jeremiah Doyle PacifiCorp 825 NE Multnomah Street
Final Fish Salvage & Temporary Tailrace Barrier Report for the Wallowa Falls Hydroelectric Project Tailrace (FERC No. P-308) December 20, 2018 Prepared by: Jeremiah Doyle PacifiCorp 825 NE Multnomah Street
3. Some of this money will be spent on the Baker Creek Rehabilitation project in 2018 this project has already been approved by Mono Council.
 April 5, 2018 Mayor Laura Ryan & Mono Council 1. As per the Town of Mono-Headwater Streams Committee, MoU (March 12, 2012), any new project undertaken by the Headwater Streams Committee (HSC) involving
Discussion on the Selection of the Recommended Fish Passage Design Discharge
 Discussion on the Selection of the Recommended Fish Passage Design Discharge Introduction The provision of fish passage is a requirement for most proposed culvert and bridge installations in Alberta, depending
Project Name: Distribution and Abundance of the Migratory Bull Trout Population in the Castle River Drainage (Year 4 of 4)
") Alberta Conservation Association (ACA) Date: 2014-2015 Project Name: Distribution and Abundance of the Migratory Bull Trout Population in the Castle River Drainage (Year 4 of 4) Fisheries Program Manager:
Alberta Conservation Association (ACA) Date: 2014-2015 Project Name: Distribution and Abundance of the Migratory Bull Trout Population in the Castle River Drainage (Year 4 of 4) Fisheries Program Manager:
Study Update Fish Distribution and Species Composition
 Study Update Fish Distribution and Species Composition Goals and Study Area Gain a better understanding of fish species composition and abundance in waters associated with the Packwood Lake Hydroelectric
Steelhead Sport Fishing Regulations Proposals Vancouver Island Region for April 1, 2007
 Steelhead Sport Fishing Regulations Proposals Vancouver Island Region for April 1, 2007 Sport fishing regulations governing steelhead fishing have changed many times over the past 30 years. Generally the
Chagrin River TMDL Appendices. Appendix F
 Appendix F The following are excerpts from the Eastern Brook Trout Joint Venture s Conservation Strategy (Working Draft v.6), Conserving the Eastern Brook Trout: Strategies for Action Found at: http://www.easternbrooktrout.org/constrategy.html
Know Your River Conwy Salmon & Sea Trout Catchment Summary
 Know Your River Conwy Salmon & Sea Trout Catchment Summary Introduction This report describes the status of the salmon and sea trout populations in the Conwy catchment. Bringing together data from rod
3. The qualification raised by the ISRP is addressed in #2 above and in the work area submittal and review by the ISRP as addressed in #1.
 Please find attached a response from The Confederated Tribes of the Warm Springs Reservation of Oregon (CTWSRO) for Project # 2008-301-00, Habitat Restoration Planning, Design and Implementation within
5B. Management of invasive species in the Cosumnes and Mokelumne River Basins
 5B. Management of invasive species in the Cosumnes and Mokelumne River Basins Cosumnes River The Cosumnes River basin has a number of distinct habitat types that require different management strategies
Juvenile Steelhead and Stream Habitat Conditions Steelhead and Coho Salmon Life History Prepared by: DW ALLEY & Associates, Fishery Consultant
 Juvenile Steelhead and Stream Habitat Conditions Steelhead and Coho Salmon Life History Prepared by: DW ALLEY & Associates, Fishery Consultant I-1. Steelhead and Coho Salmon Ecology Migration. Adult steelhead
Tips for Using & Printing Spreadsheets
 Key to Spreadsheets Spreadsheet # Type Description/Purpose a Development & Construction in Waterways b Debits Development & Construction in Other Aquatic Areas c Indirect Impacts to Waterways from Development
Redd Dewatering and Juvenile Salmonid Stranding in the Lower Feather River,
 Redd Dewatering and Juvenile Salmonid Stranding in the Lower Feather River, 2005-2006 Interim Report for NOAA Fisheries Prepared by: California Department of Water Resources Division of Environmental Services
Know Your River River Afan Salmon and Sea Trout Catchment Summary
 Know Your River River Afan Salmon and Sea Trout Catchment Summary Introduction This report describes the status of the salmon and sea trout populations in the Afan catchments. Bringing together data from
Cold Small River. A Brief Ecological Description of this Michigan River Type
 Cold Small River A Brief Ecological Description of this Michigan River Type Cold Small River segments are defined (by the Michigan Department of Natural Resources, Fisheries Division) as typically having
Know Your River Conwy Salmon & Sea Trout Catchment Summary
 Know Your River Conwy Salmon & Sea Trout Catchment Summary Introduction This report describes the status of the salmon and sea trout populations in the Conwy catchment. Bringing together data from rod
Final Fish Salvage & Temporary Tailrace Barrier Report for the Wallowa Falls Hydroelectric Project Tailrace. (FERC No. P-308) December 18, 2017
 December 18, 2017") Final for the Wallowa Falls Hydroelectric Project Tailrace (FERC No. P-308) December 18, 2017 Prepared by: Jeremiah Doyle PacifiCorp 825 NE Multnomah Street Portland, OR 97232 December 18, 2017 Page 1
Final for the Wallowa Falls Hydroelectric Project Tailrace (FERC No. P-308) December 18, 2017 Prepared by: Jeremiah Doyle PacifiCorp 825 NE Multnomah Street Portland, OR 97232 December 18, 2017 Page 1
Booklet translated by SREJ at CSDC 1
 Name: Gr. : Booklet translated by SREJ at CSDC 1 This is the beginning of a new project about Aquaculture. Before we start, I would like to see what you already know about the subject. Write all the words
ADOPT-A-STREAM WATERSHED APPROACH COMMUNITY-BASED STEWARDSHIP. Nova Scotia Salmon Association March 2005
 ADOPT-A-STREAM A WATERSHED APPROACH TO COMMUNITY-BASED STEWARDSHIP Nova Scotia Salmon Association March 2005 This manual is a revised and updated version of the 1994 Adopt-a-Stream manual that was prepared
Warner Lakes Redband Trout
 Warner Lakes Redband Trout Existing Populations Warner Valley is an endorheic basin that contains a complex series of interconnected lakes, marshes, sloughs, and potholes, all of which are remnants of
Untested Assumptions in Fisheries Management: the role of competition in Brook Trout declines?
 Untested Assumptions in Fisheries Management: the role of competition in Brook Trout declines? Brian Morrison Fisheries Biologist Ganaraska Region Conservation Authority November 22, 2012 Alternate Titles
Climate Change Adaptation and Stream Restoration. Jack Williams;
 Climate Change Adaptation and Stream Restoration Jack Williams; jwilliams@tu.org 1 Goals for this presentation Develop strategies for adapting streams to climate impacts by Thinking like a watershed Understanding
Know Your River River Loughor Salmon and Sea Trout Catchment Summary
 Know Your River River Loughor Salmon and Sea Trout Catchment Summary Introduction This report describes the status of the salmon and sea trout populations in the Loughor catchments. Bringing together data
Temperature Profiling Within the Trout Creek Sub-Watershed 2013 Prepared by the Kennebecasis Watershed Restoration Committee January 2014
 Temperature Profiling Within the Trout Creek Sub-Watershed 2013 Prepared by the Kennebecasis Watershed Restoration Committee January 2014 A partnership project between the KWRC and Agriculture and Agri-Foods
Understanding the Impacts of Culvert Performance on Stream Health
 Understanding the Impacts of Culvert Performance on Stream Health Kristin Thomas Aquatic Ecologist Michigan Trout Unlimited Transportation and the Environment Conference 12/5/2018 Importance of adequately
Fish Passage Culvert Inspection (FPCI) Nicklen Creek Watershed
 Nicklen Creek Watershed") Fish Passage Culvert Inspection (FPCI) Nicklen Creek Watershed FPCI Sites funded by FIA Prepared for: Tolko Industries Ltd., Okanagan Regional Woodlands & British Columbia Timber Sales, Okanagan-Shuswap
Fish Passage Culvert Inspection (FPCI) Nicklen Creek Watershed FPCI Sites funded by FIA Prepared for: Tolko Industries Ltd., Okanagan Regional Woodlands & British Columbia Timber Sales, Okanagan-Shuswap
Michigan Department of Natural Resources Status of the Fishery Resource Report Page 1
 Michigan Department of Natural Resources 2008-59 Status of the Fishery Resource Report Page 1 Bowens Manistee County, (T24N R16W Sec. 11, 12, 13, 14, 15, 24, and 30). Last surveyed 2008 Mark A. Tonello
Cold water fish habitat management in the Nairn Creek sub-basin. Prepared by: Mari Veliz, Aquatic Biologist Ausable Bayfield Conservation Authority
 Cold water fish habitat management in the Nairn Creek sub-basin. Prepared by: Mari Veliz, Aquatic Biologist Ausable Bayfield Conservation Authority June 2003 Photographs on Front Cover (left to right):
FINAL REPORT. Yonkers Creek Migration Barrier Removal Project Wonderstump Road Del Norte County. Submitted By:
 FINAL REPORT Yonkers Creek Migration Barrier Removal Project Wonderstump Road Del Norte County Submitted By: Del Norte County Community Development Department Yonkers Creek Migration Barrier Removal Project
Holderness. The Three Watersheds within the Newfound Lake Drainage Dorchester. Groton Plymouth. Ashland. Hebron. Canaan. Bridgewater.
 Background Brook trout are the only native stream dwelling trout species in New Hampshire, having a historic range that extended from Georgia to eastern Canada. It is believed that wild brook trout were
Okanagan Sockeye Reintroduction
 Okanagan Sockeye Reintroduction Backgrounder Elders accounts, and other forms of Traditional Ecological Knowledge (TEK) tell us that many species of salmon once came into the Okanagan Valley and tell us
FISH PASSAGE IMPROVEMENT in California s Watersheds. Assessments & Recommendations by the Fish Passage Forum
 FISH PASSAGE IMPROVEMENT in California s Watersheds Assessments & Recommendations by the Fish Passage Forum FISH PASSAGE IMPROVEMENT in California s Watersheds The mission of the Fish Passage Forum is
Know Your River - River Ogmore Salmon and Sea Trout Catchment Summary
 Know Your River - River Ogmore Salmon and Sea Trout Catchment Summary Introduction This report describes the status of the salmon and sea trout populations in the Ogmore catchments. Bringing together data
WFC 10 Wildlife Ecology & Conservation Nov. 29, Restoration Ecology: Rivers & Streams. Lisa Thompson. UC Cooperative Extension
 Restoration Ecology: Rivers and Streams WFC 10 29 Nov 2010 Restoration of ecosystems often involves creating new systems with only partial resemblance to the original ecosystems Lisa Thompson Fisheries
COA-F17-F-1343 YEAR END REPORT
 DAVE MARSHALL SALMON RESERVE RESTORATION, MAINTENANCE, AND UPGRADES YEAR END REPORT Prepared for: Fish and Wildlife Compensation Program Prepared by: Edith Tobe, RPBio, Executive Director Box 1791, Squamish,
Ecology of Columbia River redband trout (Oncorhynchus mykiss gairdneri) in high desert streams
 in high desert streams") Ecology of Columbia River redband trout (Oncorhynchus mykiss gairdneri) in high desert streams Dry Creek October 2012 Chris A. Walser Ph.D., Professor of Biology Department of Biology and Environmental
Ecology of Columbia River redband trout (Oncorhynchus mykiss gairdneri) in high desert streams Dry Creek October 2012 Chris A. Walser Ph.D., Professor of Biology Department of Biology and Environmental
Ecology of Place: What salmon need Eric Beamer Skagit River System Cooperative. November 2010
 Ecology of Place: What salmon need Eric Beamer Skagit River System Cooperative November 2010 Acknowledgements NOAA Fisheries NW Fisheries Science Center Tim Beechie George Pess Correigh Greene Talk overview
Jason Blackburn, Paul Hvenegaard, Dave Jackson, Tyler Johns, Chad Judd, Scott Seward and Juanna Thompson
 Alberta Conservation Association (ACA) Date: 2014-2015 Project Name: Owl River Walleye and Aquatic Habitat Assessment Fisheries Program Manager: Peter Aku Project Leader: Tyler Johns Primary ACA staff
Catlow Valley Redband Trout
 Catlow Valley Redband Trout Existing Populations The Catlow Valley Redband Trout SMU is comprised of five populations (Table 1). Three exist in Home, Threemile, and Skull creeks, located on the east side
Study Update Tailrace Slough Use by Anadromous Salmonids
 Study Update Tailrace Slough Use by Anadromous Salmonids Goals and Objectives Identify what anadromous salmonids use the tailrace slough by: Life Stage (Juvenile, migrating and spawning adults) Timing
Cold-transitional Stream
 Cold-transitional Stream A Brief Ecological Description of this Michigan River Type Cold-transitional Stream segments are defined (by the Michigan Department of Natural Resources, Fisheries Division) as
1.Mill Creek Watershed Summary Description and Land Use
 1.Mill Creek Watershed Summary Description and Land Use Table xxx: Mill Creek Watershed Overview Watershed Size 31,435 acres/49.1 sq miles/ 127.1 sq km Elevation Range 5,594 feet [4,967-10,561] Stream
WFC 50 California s Wild Vertebrates Jan. 11, Inland Waters (Lakes and Streams) Lisa Thompson
 Lisa Thompson") Inland Waters: Lakes and Streams WFC 50 11 January 2011 Lisa Thompson Fisheries Extension Specialist Wildlife, Fish, & Conservation Biology Department University of California, Davis Take home messages
Inland Waters: Lakes and Streams WFC 50 11 January 2011 Lisa Thompson Fisheries Extension Specialist Wildlife, Fish, & Conservation Biology Department University of California, Davis Take home messages
Steelhead Society of BC. Thompson River Watershed Restoration and Enhancement Project #4 Nicola River Bank Stabilization and Enhancement Project
 Steelhead Society of BC Presents: Thompson River Watershed Restoration and Enhancement Project #4 Nicola River Bank Stabilization and Enhancement Project Application for Funding December 2013 1.0 BACKGROUND
Brook Trout in Massachusetts: A Troubled History, A Hopeful Future
 Brook Trout in Massachusetts: A Troubled History, A Hopeful Future Brook trout are one of the most beautiful and beloved fish in the Eastern United States. In Massachusetts, anglers prize opportunities
Don Pedro Project Relicensing
 Don Pedro Project Relicensing M ODESTO I RRIGATION D ISTRICT TURLOCK I RRIGATION D ISTRICT FERC PROJECT N O. 2299 Resident Fish in Don Pedro Reservoir Don Pedro Reservoir Fish Stocking (1971-Present) CDFG
Eastern Brook Trout Joint Venture Completed Project Report Form
 Eastern Brook Trout Joint Venture Completed Project Report Form Project Title: Assessing the Efficacy of Remediating Episodic Low ph (and High Aluminum) Concentrations in Headwater Brook Trout Streams
David K. Hering and Mark W. Buktenica, Crater Lake National Park
 Eradication of Nonnative Trout and the Response of Threatened Bull Trout at Crater Lake National Park: Extending Conservation Across Park Boundaries to a Watershed Scale David K. Hering and Mark W. Buktenica,
Chinook Salmon Spawning Study Russian River Fall 2005
 Chinook Salmon Spawning Study Russian River Fall 2005 Sonoma County Water Agency 2150 West College Avenue Santa Rosa, California 95401 Prepared by David Cook - Senior Environmental Specialist March 27,
Burns Paiute Tribe Fisheries Department. Evaluate The Life History Of Native Salmonids Within The Malheur Subbasin Project #
 Burns Paiute Tribe Fisheries Department Evaluate The Life History Of Native Salmonids Within The Malheur Subbasin Project # 199701900 Prior to 1990 Technical and/or scientific background Malheur population,
Salmon Biology Station
 Salmon Biology Station OBJECTIVES: Students learn: Wild salmon are indicator species and keystone species whose survival is connected to the health of the watershed. o Riparian salmon need trees and trees
Joe Rathbun Michigan DEQ Water Resources Division Nonpoint Source Unit * Thanks to The Nature Conservancy
 Joe Rathbun Michigan DEQ Water Resources Division Nonpoint Source Unit rathbunj@mi.gov * Thanks to The Nature Conservancy Road-stream intersections = 67,511 Culverts = 60,700 Bridges = 6,811 Perched Piping
Amendment to a Biological Assessment/Evaluation completed for the Coon Creek Land Disposal completed December Grand Valley Ranger District
 Amendment to a Biological Assessment/Evaluation completed for the Coon Creek Land Disposal completed December 2007 Grand Valley Ranger District Grand Mesa, Uncompahgre, Gunnison National Forests Prepared
Oregon Coast Coastal Cutthroat Trout
 Oregon Coast Coastal Cutthroat Trout Species Management Unit Description The Oregon Coast Coastal Cutthroat Trout Species Management Unit (SMU) includes all populations of cutthroat trout inhabiting ocean
SECTION 2 HYDROLOGY AND FLOW REGIMES
 SECTION 2 HYDROLOGY AND FLOW REGIMES In this section historical streamflow data from permanent USGS gaging stations will be presented and discussed to document long-term flow regime trends within the Cache-Bayou
Minnesota Department of Natural Resources Fisheries Division, Lake Superior Area
 Minnesota F-9-R(P)- Study 4 Job 616 Minnesota Department of Natural Resources Fisheries Division, Lake Superior Area Coaster Brook Trout Status in Minnesota-Lake Superior Tributaries Following Regulation
Trip Report: Eagle Creek, Arizona
 Trip Report: Eagle Creek, Arizona 15-17 June 2009 Participants: Abraham Karam, Brian Kesner, and Mike Childs Native Fish Lab Marsh & Associates, LLC 5016 South Ash Avenue Suite 108 Tempe, Arizona 85282
OKANAGAN RIVER RESTORATION INITIATIVE - FAQ
 OKANAGAN RIVER RESTORATION INITIATIVE - FAQ Initiative background: The health of the q awsitk w (Okanagan River) has been severely impacted by the channelization works that occurred in the mid-1950 s.
AN ANALYSIS OF STREAM TEMPERATURE PROFILES IN NORTHERN NEW HAMPSHIRE (2014)
") AN ANALYSIS OF STREAM TEMPERATURE PROFILES IN NORTHERN NEW HAMPSHIRE (2014) STATE: New Hampshire GRANT: F-50-R-31 GRANT TITLE: JOB 2: Anadromous and Inland Fisheries Operational ManagementInvestigations
AN ANALYSIS OF STREAM TEMPERATURE PROFILES IN NORTHERN NEW HAMPSHIRE (2014) STATE: New Hampshire GRANT: F-50-R-31 GRANT TITLE: JOB 2: Anadromous and Inland Fisheries Operational ManagementInvestigations
TABLE 1. Riverscape surveys completed in the upper Chehalis River, Newaukum, and Satsop rivers.
 RIVERSCAPE SURVEYS OF IN-STREAM FISH ASSEMBLAGES AND HABITAT IN THE CHEHALIS RIVER Mara Zimmerman and John Winkowski Washington Department of Fish and Wildlife, Fish Program EXECUTIVE SUMMARY Introduction