Phase II Florida s Ocean and Coastal Economies Report
|
|
|
- Daniel Powers
- 5 years ago
- Views:
Transcription

1 Center for the Blue Economy Digital Center for the Blue Economy Publications National Ocean Economics Program Summer Phase II Florida s Ocean and Coastal Economies Report Judith T. Kildow Dr National Ocean Economic Program, jakildow@gmail.com Follow this and additional works at: Part of the Agricultural and Resource Economics Commons, Growth and Development Commons, Science and Technology Studies Commons, and the Urban Studies and Planning Commons Recommended Citation Kildow, Judith T. Dr, "Phase II Florida s Ocean and Coastal Economies Report" (2008). Publications This Article is brought to you for free and open access by the National Ocean Economics Program at Digital Center for the Blue Economy. It has been accepted for inclusion in Publications by an authorized administrator of Digital Center for the Blue Economy. For more information, please contact ccolgan@miis.edu.
2 Phase II Florida s Ocean and Coastal Economies Report Abstract Phase II of Florida s Ocean and Coastal Economics Report was prepared for the Florida Oceans and Coastal Council and funded under contract #RM077 by the Florida Department of Environmental Protection. The Phase I report of Florida s Ocean and Coastal Economies provided basic information that the NOEP compiles for all coastal states about employment, wages and output of those activities located geographically along Florida s shoreline (Coastal Economy) as well as those activities directly dependent upon the oceans (Ocean Economy). That information not only described the status and trends of Florida s Coastal and Ocean Economy but allowed comparison to economies in other states as well as comparisons among counties in Florida. It also provides basic data about fisheries productivity and estimates of the non-market value of coastal recreation. The Phase II report is in three volumes: this report, Phase II, Florida s Ocean and Coastal Economies, a smaller summary version, Phase II Facts and Figures, and Phase II Appendices. Phase II expands and provides more detailed information about additional economic activities that particularly define Florida s Ocean Economy that were not included in Phase I. These include: the passenger cruise industry, the commercial and recreational fishing, coastal real estate the value of coastal real estate, value of tourist real estate and data on seasonal housing; marine research and education institutions, coastal construction activities including beach nourishment and dredging, and finally marine transportation and port activities. In addition, an expanded marine recreation section provides detail about the location of Florida s coastal recreational assets, the number provides information on the number of people using them, and estimates of the value of numerous recreational activities such as boating, surfing, etc. A major study on boating and marinas is currently underway for the state of Florida by other contractors1. To provide context for the expanded descriptions of economic activities, the NOEP has also prepared an update of the Phase I report using a summary of the most recent numbers available for Florida s Coastal and Ocean economic contributions, e.g. a summary update of the estimates from the Phase I report. This article is available at Digital Center for the Blue Economy:


3 Phase II Florida s Ocean and Coastal Economies Report Judith Kildow, Principal Investigator Monterey Bay Aquarium Research Institute June 2008
4 Acknowledgments The National Ocean Economics Program research team prepared this report in collaboration with the following people named below along with their contributions to this work. Judith Kildow was Principal Investigator and led the team. Charles Colgan, University of Maine, provided oversight for the Ocean Economy sectors: Real Estate, Cruise Industry, Fishing Industry and Transportation. Linwood Pendleton, Fellow at the Ocean Foundation, provided oversight for the Coastal Recreation chapters. Other members of the NOEP research team who contributed to many of the chapters and preparation of the report included Bonnie Lockwood, Pat Johnston, Scott Norris, Kirstin Csik, Nick Rome, Elizabeth Rogers, Bethany Taylor, and Nat Miller. Research teams at Florida Atlantic University were led by Principal Investigator Lenore Alpert from the Center for Urban and Environmental Solutions at Florida Atlantic University; William B. Stronge, Professor Emeritus and Senior Fellow; M.J. Matthews, Senior Research Associate; and Angela Grooms, Research Associate; who were responsible for the following chapters: 1) The Cruise Industry, 2) Real Estate, 3) Tourist Real Estate, and 4) Coastal Recreation. Other research assistants who contributed to these chapters were Lauren Schild, Marc Miller, Ian Singer, and Jose Mena. The research team at the University of Florida, Gainesville, responsible for information in the Fisheries Industry chapter included Charles Adams, Principal Investigator and Christopher de Bodisco, post-doctoral assistant.
5
6
7 Florida s Ocean and Coastal Economies Phase II Table of Contents Part I Introduction and Background...1 Chapter 1 Chapter 2 Context for the Study...1 Glossary of Terms and Definitions...3 Part II Executive Summary and Update...7 Chapter 3 Executive Summary...7 Chapter 4 Updates from Phase I Report Florida Coastal Economy Coastal Economy Growth Economic Growth at the County Level Population and Housing Conclusion...23 Part III Ocean Economy: Sector Supplements...25 Chapter 5 Fishing Industry Fishing Industry Overview...26 Commercial Fisheries Recreational Fisheries Imports and Exports Seafood Processors and Wholesalers Commercial and Pleasure Water Vessel Registrations Conclusion...45 Chapter 6 Marine Transportation including Ports Introduction National and State Comparisons Conclusion...56 Chapter 7 Marine Construction Beach Nourishment Dredging Operations Beach Nourishment Conclusion...70 Chapter 8 Coastal Tourism and Recreation The Cruise Industry Introduction to Florida s Cruise Industry Overview of Florida s Cruise Economy National Comparisons of the Cruise Tourism Industry State Economic Impacts of the Cruise Industry Analysis of Individual Florida Cruise Ports Conclusion...81 Chapter 9 Coastal Real Estate Coastal Real Estate Values Tourist-Oriented Coastal Property in Florida Seasonal Housing i
8 9.4 Conclusion Chapter 10 Marine Research and Education Introduction Marine Institutions Survey Results Conclusion Part IV Coastal Recreation Activities and Assets Chapter 11 Introduction and Overview Non-Market Values Organization of this Report Impacts of the 2004 and 2005 Hurricane Seasons in Florida Coastal Recreation in Florida Chapter 12 Park Visitation and Attendance Introduction Florida s State Parks State and National Park Attendance Recreational Reef Use Data Gaps in Coastal Park Visitation Chapter 13 Recreational Boating in Florida Introduction Boating within Florida s Park System Boating Activity Boating and Recreational Reef Use Data Gaps Chapter 14 Recreational Fishing in Florida Introduction Fishing and Recreational Reef Use by Anglers Data Gaps Chapter 15 Scuba Diving and Snorkeling in Florida Introduction Recreational Reef Use Data Gaps Chapter 16 Beach Activities in Florida Introduction Beach Regions Beach Attendance State Beach Parks Selected Studies of Florida Beaches Surfing in Florida Data Gaps Chapter 17 Conclusion Part V References ii
9 List of Tables Sectors and Industries of the Ocean Economy... 4 Table 4.1 Florida s Ocean Economy, Table 4.2 Florida s Coastal Economy, 2006 (shoreline counties only)... 9 Table 4.3 Florida Economy Total Regional Values and Contribution to State Economy, Table 4.4 Florida Regional Coastal Economy Table 4.5 Top Five Counties by Percent Change Table 4.6 Top Five Counties by Real Change Table 4.7 Bottom Five Counties by Percent Change Table 4.8 Bottom Five Counties by Real Change Table 4.9 Florida County Comparisons of Economic Indicators, Table 4.10 Florida s Regional Population and Housing Table 4.11 Distribution of Florida s Population, Table 4.12 Distribution of Florida s Housing, Table 4.13 Florida Counties Population, Growth, and Density, Table 4.14 Florida Counties Housing, Growth, and Density, Table 4.15 Coastal States Coastal Population and Density, Table 4.16 Coastal States Coastal Housing and Density, Table 5.1 Commercial Seafood Harvests, 1990, 1994, Table 5.2 Commercial Seafood Groups, Table 5.3 Seafood Groups of the Atlantic and Gulf Coasts, Table 5.4 Recreational License Sales Table 5.5 Recreational Marine Fishing Values, Table 6.1 U.S. Port Container Volumes, 1997, 2006, and Table 6.2 Gulf vs. Atlantic, Trade Values Table 6.3 Gulf vs. Atlantic, Trade Volume Table 6.4 Associated Counties of the Individual Florida Ports Table 6.5 Total Value and Containerized Cargo Value Table 6.6 Dollar Value of Florida s Exports and Imports by Port, Table 6.7 Florida s Total Waterborne Trade, Tons Table 6.8 Cargo Types Carried at Florida s Seaports FY Table 6.9 Container Movements, TEUs Table 6.10 Seaport Capital Improvement Needs FY 2008 FY Table 7.1 Time Series of Contracted Dredging by the USACE in Florida Table 7.2 Volume of Beach Nourishment Projects by County Table 7.3 Funding Sources for Total Volume and Cost of Beach Nourishment Table 7.4 Breakdown of Federal Funding Type for Total Volume Table 7.5 Department of Environmental Protection Regional Erosion, iii
10 Table 7.6 Counties in Department of Environmental Protection Regions for Reference Table 8.1 Florida Ocean Tourism & Recreation Industries - Excluding Cruise Line, Table 8.2 Embarkations by Port Table 8.3 Florida's Share of U.S. Cruise Industry, Table 8.4 Total Economic Impacts of Cruise Purchasing on Business Sectors in Florida, Table 8.5 Economic Impact of Cruise Industry on Direct Spending in Florida Table 8.6 Economic Impact of Cruise Industry on Florida Spending Table 8.7 Cruise Operations, Embarkations and Disembarkations FY 2005 FY Table 9.1 Seasonal Homes by State, 1990 and Table 9.2 Percentage of Seasonal Homes, 1990 and Table 10.1 Florida Marine Economic Indicators Table 10.2 Major Marine and Coastal Research and Education Institutions in Florida, Table 12.1 National Estuarine Research Reserves Attendance Table 15.1 Expenditures for Scuba Diving and Snorkeling in Florida iv
11 List of Figures Figure 5.1 Commercial Seafood Harvests Figure 5.2 Commercial Seafood Landings by Coast Figure 5.3 Commercial Seafood Groups Figure 5.4 Commercial Marine Ornamental Landed Values Figure 5.5 Ornamental Finfish and Invertebrate Harvests Figure 5.6 Marine Ornamental Live Rock and Sand Figure 5.7 Commercial Marine Fishing Licenses FY to FY Figure 5.8 Commercial Fishing License Types FY to Figure 5.9 Aquaculture Operations, Workers, and Sales Figure 5.10 Aquaculture Product Sales Figure 5.11 Recreational Fish Landings Figure 5.12 Top Ten Recreation Fish Figure 5.13 Saltwater Fishing Licenses Sold Figure 5.14 Individual Recreational Fishing Licenses, Resident and Non-Resident Figure 5.15 Annual Imports of Seafood Figure 5.16 Imports of Finfish and Shellfish Figure 5.17 Seafood Exports Figure 5.18 Exports of Finfish and Invertebrates Figure 5.19 Seafood Re-Exports Figure 5.20 Re-Exports of Finfish and Invertebrates Figure 5.21 Seafood Processing and Wholesale Plants Figure 5.22 Seafood Processing and Wholesale Plants Figure 5.23 Processed Seafood Weight and Value Figure 5.24 Total Commercial and Pleasure Registrations FY to FY Figure 5.25 Commercial Fish Landings vs. Seafood Imports Figure 6.1 Map of Florida s Seaports Figure 6.2 Percentage Changes of Cargo Values and Volume Figure 6.3 Distribution of Florida Seaports based on Total Value, FY Figure 6.4 Distribution of Florida s Seaports by Tons, FY Figure 6.5 Florida Ports Import vs. Export Tonnage, FY Figure 6.6 Percentages of Cargo Types at Florida Seaports, FY Figure 6.7 Container Movements FY 1996-FY Figure 6.8 Distribution of Florida Seaports based on Container Movements, Figure 6.9 Distribution of Estimated Funding, FY Figure 7.1 Time Series of Contracted Dredging by the USACE in Florida Figure 7.2 Top Ten Beach Nourishment States in the U.S. by Cost v
12 Figure 7.3 Top Ten Beach Nourishment States in the U.S. by Volume Figure 7.4 Cost and Volume of Beach Nourishment Projects in Florida Figure 7.5 Funding Sources for Total Volume and Cost of Beach Nourishment Figure 7.6 Main Sources of Funding for Beach Nourishment Figure 7.7 Regional Funding for Beach Nourishment Projects Figure 7.8 Map of Critical Erosion Areas in Florida Figure 7.9 Map of the Florida State Coastal Construction Control Line Figure 8.1 Map of Florida s Cruise Ports Figure 8.2 Embarkations by Port Figure 8.3 Florida's Percentage Share of U.S. Cruise Industry, Figure 8.4 Employment, Income, and Direct Spending: Florida Cruise Industry Figure 8.5 Total Global Embarkations Figure 8.6 Percent of Global Cruise Embarkations, Figure 8.7 Total Embarkations from Florida Ports Figure 8.8 Percentage Share of Florida Cruise Embarkations by Port Figure 8.9 Percentage Growth in Cruising at Florida Ports Figure 8.10 Embarkations and Disembarkations from Florida Ports by Length of Cruise Figure 9.1 Number of Florida Coastal Properties by Land Use Figure 9.2 Value of Florida Coastal Properties by Land Use Figure 9.3 Value of Florida Coastal Residential Properties, Figure 9.4 Average Value of Florida Coastal Residential Properties, Figure 9.5 Value of Florida Coastal Commercial Properties, Figure 9.6 Growth in the Number of Florida Coastal Properties Figure 9.7 Growth in the Value of Florida Coastal Properties Figure 9.8 Growth in the Average Value of Florida Coastal Properties Figure 9.9 Florida Comprehensive Recreation Planning Regions Figure 9.10 Distribution of the Number of Coastal Properties by Coastal Region, Figure 9.11 Distribution of Coastal Property Values by Coastal Region, Figure 9.12 Distribution of Average Coastal Property Values by Coastal Region, Figure 9.13 Distribution of Property Values by Land Use in Coastal Regions, Figure 9.14 Average Coastal Property Values by Land Use in Coastal Regions, Figure 9.15 Coastal Value as a Percent of Total Value in Coastal Regions, Figure 9.16 Percent Growth in Coastal Values in Coastal Regions Figure 9.17 Property Tax Revenues from Coastal Parcels by Region Figure 9.18 Distribution of the Number of Coastal Properties by County Northeast Region, Figure 9.19 Distribution of Coastal Property Values by County Northeast Region, Figure 9.20 Distribution of Average Coastal Property Values in Northeast Coastal Region, Figure 9.21 Coastal Value as a Percent of Total Value in Northeast Coastal Region, vi
13 Figure 9.22 Percent Growth in Coastal Value in Northeast Coastal Region Figure 9.23 Distribution of Coastal Property Values by Land Use in Northeast Coastal Region, Figure 9.24 Average Value of Coastal Properties by Land Use in Northeast Coastal Region, Figure 9.25 Property Tax Revenues from Coastal Parcels by County in Northeast Coastal Region, Figure 9.26 Distribution of the Number of Coastal Properties by County Southeast Region, Figure 9.27 Distribution of Coastal Property Values by County in Southeast Region, Figure 9.28 Distribution of Average Coastal Property Values in Southeast Coastal Region, Figure 9.29 Coastal Value as Percent of Total Value in Southeast Coastal Region, Figure 9.30 Percent Growth in Coastal Value in Southeast Coastal Region Figure 9.31 Distribution of Coastal Property Values by Land Use in Southeast Coastal Region, Figure 9.32 Average Coastal Property Values by Land Use in Southeast Coastal Region, Figure 9.33 Property Tax Revenue from Coastal Parcels by County in Southeast Coastal Region, Figure 9.34 Distribution of Number of Coastal Properties by County Southwest Region, Figure 9.35 Distribution of Coastal Property Values by County in Southwest Region, Figure 9.36 Distribution of Average Coastal Property Values in Southwest Coastal Region, Figure 9.37 Coastal Values as Percent of Total Value in Southwest Coastal Region, Figure 9.38 Percent Growth in Coastal Value in Southwest Coastal Region Figure 9.39 Distribution of Coastal Property Values by Land Use in Southwest Coastal Region, Figure 9.40 Average Coastal Property Values by Land Use in Southwest Coastal Region, Figure 9.41 Property Tax Revenues from Coastal Parcels by County in Southwest Coastal Region, Figure 9.42 Distribution of the Number of Coastal Properties by County Big Bend Region, Figure 9.43 Distribution of Coastal Property Values by County in Big Bend Region, Figure 9.44 Distribution of Coastal Property Values by Land Use in Big Bend Coastal Region, Figure 9.45 Coastal Value as Percent of Total Value in Big Bend Coastal Region, Figure 9.46 Percent Growth in Coastal Value in Big Bend Coastal Region Figure 9.47 Distribution of Coastal Property Values by Land Use in Big Bend Coastal Region, Figure 9.48 Average Coastal Property Values by Land Use in Big Bend Coastal Region, Figure 9.49 Property Tax Revenues from Coastal Parcels by County in Big Bend Coastal Region, Figure 9.50 Distribution of the Number of Coastal Properties by County Northwest Region, Figure 9.51 Distribution of Coastal Property Values by County in Northwest Region, Figure 9.52 Distribution of Average Coastal Property Values in Northwest Coastal Region, Figure 9.53 Coastal Value as Percent of Total Value in Northwest Coastal Region, Figure 9.54 Percent Growth in Coastal Value in Northwest Coastal Region Figure 9.55 Distribution of Coastal Property Values by Land Use in Northwest Coastal Region, Figure 9.56 Average Coastal Property Values by Land Use in Northwest Coastal Region, Figure 9.57 Property Tax Revenues from Coastal Parcels by County Northwest Coastal Region, Figure 9.58 Type of Accommodations Used by Domestic Visitors to Florida Figure 9.59 Licenses for Tourist and Transient Housing in Florida, vii
14 Figure 9.60 Value of Coastal Retail and Entertainment Properties, Figure 9.61 Entertainment & Recreation in Florida Coastal Properties, Figure 9.62 Value of Coastal Hotels by Region, Figure 9.63 Value of Coastal Restaurants by Region, Figure 9.64 Retail and Entertainment Values by Coastal Region Figure 9.65 Tourist-Oriented Property Values in Northeast Florida by County Figure 9.66 Tourist-Oriented Property Values in Northeast Florida by Type Figure 9.67 Value of Tourist-Oriented Property in Northeast Florida by County, Figure 9.68 Tourist-Oriented Property Values in Southeast Florida by County Figure 9.69 Tourist-Oriented Property Values in Southeast Florida by Type Figure 9.70 Value of Tourist-Oriented Properties in Southeast Florida by County, Figure 9.71 Tourist-Oriented Property Values in Southwest Florida by County Figure 9.72 Tourist-Oriented Property Values in Southwest Florida by Type Figure 9.73 Value of Tourist-Oriented Properties by County in Southwest Florida, Figure 9.74 Tourist-Orientated Property Values in the Big Bend Region by County Figure 9.75 Tourist-Oriented Property Values in the Big Bend Region by Type Figure 9.76 Value of Tourist-Oriented Properties by County in the Big Bend Region, Figure 9.77 Tourist-Oriented Property Values in Northwest Florida by County Figure 9.78 Tourist-Oriented Property Values in Northwest Florida by Type Figure 9.79 Value of Tourist-Oriented Properties by County in Northwest Florida, Figure 9.80 Percentage Seasonal Homes within Select Counties, 1990 and Figure 9.81 Seasonal Homes for Select Counties, 1990 and 2006 (arranged by population) Figure 9.82 Change in Number of Seasonal Homes for Select Counties Figure 9.83 Rate of Change of Seasonal Homes Figure 9.84 Changes in Seasonal Homes for Selected Counties Figures 9.85 and 9.86 Growth in Seasonal Homes (percent change), and Figure 10.1 Sources of Funding, FY Figure 10.2 Areas of Research Spending, FY Figure 11.1 Florida Coastal Regions Map Figure 11.2 Map of Public Beaches by County Figure 11.3 Map of Public Parks by County Figure 11.4 Map of Marine Facilities by County Figure 11.5 Map of Boat Ramps by County Figure 11.6 Map of Piers by County Figure 12.1 Florida Comprehensive Recreation Planning Regions Figure 12.2 Map of Florida State Park Districts Figure 12.3 Attendance at Florida State Parks, FY to FY Figure 12.4 Attendance at Florida State Parks by District, FY to FY viii
15 Figure 12.5 Attendance at National Parks in Florida Figure 12.6 Attendance by Region at National Parks in Florida Figure 12.7 Recreational Reef Use by Counties Figure 12.8 Recreational Reef Use by User Type Figure 12.9 Non-Market Economic Value of Recreational Use of Reefs by User Figure Reef Use by Activity Figure 13.1 Florida Vessel Registration FY to FY Figure 13.2 Estimated Recreational Boating Activity FY to FY Figure 13.3 Estimated Recreational Boating Activity by Region FY to FY Figure 14.1 Saltwater Fishing and Sportsman Licenses for Residents and Non-Residents FY to FY Figure 14.2 Saltwater Fishing and Sportsman Licenses for Residents and Non-Residents FY to FY , Coastal Regions Only Figure 14.3 Saltwater Fishing and Sportsman Licenses for Residents and Non-Residents by Region FY to FY Figure 14.4 Saltwater Fishing and Sportsman Licenses for Counties in Southwest Region, FY 2005/ Figure 16.1 Estimated Annual Activity Days Figure 16.2 Estimated Beach Activity Days by Region Figure 16.3 Estimated Beach Activity Days by Geographic Origin Figure 16.4 Florida State Parks Attendance by Beach Region FY to FY Figure 16.5 Characteristics of Beach Visits to Cocoa Beach, Winter Figure 16.6 Beach Visits by Purpose of Activity in Cocoa Beach, Winter ix
16 x
17 Chapter 1 Part I Introduction and Background Context for the Study Phase II of Florida s Ocean and Coastal Economics Report was prepared for the Florida Oceans and Coastal Council and funded under contract #RM077 by the Florida Department of Environmental Protection. The Phase I report of Florida s Ocean and Coastal Economies provided basic information that the NOEP compiles for all coastal states about employment, wages and output of those activities located geographically along Florida s shoreline (Coastal Economy) as well as those activities directly dependent upon the oceans (Ocean Economy). That information not only described the status and trends of Florida s Coastal and Ocean Economy but allowed comparison to economies in other states as well as comparisons among counties in Florida. It also provides basic data about fisheries productivity and estimates of the non-market value of coastal recreation. The Phase II report is in three volumes: this report, Phase II, Florida s Ocean and Coastal Economies, a smaller summary version, Phase II Facts and Figures, and Phase II Appendices. Phase II expands and provides more detailed information about additional economic activities that particularly define Florida s Ocean Economy that were not included in Phase I. These include: the passenger cruise industry, the commercial and recreational fishing, coastal real estate the value of coastal real estate, value of tourist real estate and data on seasonal housing; marine research and education institutions, coastal construction activities including beach nourishment and dredging, and finally marine transportation and port activities. In addition, an expanded marine recreation section provides detail about the location of Florida s coastal recreational assets, the number provides information on the number of people using them, and estimates of the value of numerous recreational activities such as boating, surfing, etc. A major study on boating and marinas is currently underway for the state of Florida by other contractors 1. To provide context for the expanded descriptions of economic activities, the NOEP has also prepared an update of the Phase I report using a summary of the most recent numbers available for Florida s Coastal and Ocean economic contributions, e.g. a summary update of the estimates from the Phase I report. Background Florida s economy has been strongly tied to the oceans through tourism and recreation for decades. Yet, there are many facets of its economy that are also dependent on its long and lovely coastline, but don t get reported in any single document or coherent report. 1 Urban Harbors Institute, et al. (forthcoming in 2008). Boating Access Facilities Inventory and Economic Study. University of Massachusetts-Boston, Mass. Prepared for Florida Fish and Wildlife Conservation Commission. 1
18 That is the purpose of this effort. The combination of these activities adds up to a diverse economy that sustains Florida. Marine industries, for example, are a major economic engine for the state of Florida. In 2005 it was reported that the marine-related industry statewide generated $18.4 billion in annual economic impact and 220,000 jobs in the areas of seaports, boating and marinas, fishing, and marine science research. Almost 100,000 of these jobs were in manufacturing. 2 This report attempts to provide important details, some of which can be found in separate reports and separate websites which were our sources and reported throughout the following pages, and some of which were generated specifically for this report, such as the real estate values and those for the marine research and education sector, two new sectors that NOEP added to its data series with the anticipation that these sectors will soon be measured in other states as well. These newly added sectors are also important to report because they add an important dimension to Florida s economy. Coastal real estate carries a high price tag with various tax revenues that flow to the state. At the same time, that market has gone through volatile times recently, leaving the state with far lower revenues as a result of lower values. It is instructive to be able to track these values so that contingencies can be created with more accurate forecasting. The research and education sector chapter provides a window into the potential effectiveness of Florida s efforts to attract research institutions as a way of diversifying its economy to a less volatile service sector. The Marine Research and Education sector provides an interesting microcosm, and only three-fifths of the institutions actually responded, so this chapter is still underestimating values. Dollar values in this report are reported in current dollars when only one year is available and in real dollars (2000 base year) for multiple years. For those who have not read Phase I, we include a description of the two types of economies we have measured in both reports: Ocean and Coastal Economies. See Glossary. The Coastal and Ocean Economies Are Not the Same Economic Activity Located Along the Coast Economic Activity Using the Ocean as an Input Coastal Economy Ocean Economy 2 Murray, Thomas & Associates, Inc. (2005). Florida s Recreational Marine Industry Economic Impact and Growth: p. iii. Cited in Marine Industries Association of Florida. Boating is Big Business in Florida. Retrieved 11/15/
19 Chapter 2 Glossary of Terms and Definitions To avoid repetition and for clarification purposes, the following terms and definitions regarding economic indicators and valuation categories are found in the beginning of this report, so that the reader can fully understand what is intended throughout the text. Coastal Economy: The sum of all economic activity occurring in counties defined by states as part of their coastal zone management program or part of a coastal watershed as defined by the U.S. Geological Survey. For purposes of analyzing the Florida Coastal Economy, counties are divided between shore-adjacent and inland counties to better illuminate the differences between the shoreline and inland regions. Unless otherwise noted, coastal counties will indicate shoreline counties in this document. Ocean Economy: The concept of the Ocean Economy derives from the ocean (or Great Lakes) and its resources being a direct or indirect input of goods and/or services to an economic activity: a) an industry whose definition explicitly ties the activity to the ocean, or b) which is partially related to the ocean and is located in a shore adjacent zip code. This is defined in part by the definition of a sector, such as Maritime Transportation in the North American Industrial Classification System 3 or an industry that is part of the sector (for example, Deep Sea Freight Transportation) and partly by geographic location (for example, a hotel in a coastal town). North American Industrial Classification System (NAICS): NOEP Economic statistics are grouped by a classification system known as the North American Industrial Classification System (NAICS), which imperfectly reflects the relationship between economic activity and the ocean. The NAICS is the successor to the Standard Industrial Classification. It was developed in the 1990s as a part of the North American Free Trade Agreement (NAFTA) to provide a common basis for the United States, Canada, and Mexico to measure their economic activity. The definition of the Ocean Economy industries is derived from the NAICS classifications for the following industries (see Table 1). 3 As of 2000, all industries are classified using the North American Industry Classification System (NAICS) rather than the Standard Industrial Classification (SIC by BLS). NAICS focuses on how products and services are created, as opposed to SIC which focuses on what is produced. Using NAICS yields significantly different industry groupings from those produced using SIC. 3
20 Sectors and Industries of the Ocean Economy Construction Marine Tourism & Recreation Coastal Amusement and Recreation Services, NEC* Living Resources Marine Boat Dealers Fishing Eating & Drinking Places Fish Hatcheries and Aquaculture Hotels & Lodging Places Seafood Processing Marinas Seafood Markets Recreational Vehicle Parks & Campgrounds Minerals Offshore Scenic Water Tours Limestone, Sand, & Gravel Sporting Goods Retailers Oil and Gas Exploration Zoos, Aquaria Oil and Gas Production Transportation Marine Deep Sea Freight Transportation Marine Passenger Transportation Ship & Boat Building Marine Transportation Services Boat Building and Repair Search and Navigation Equipment Ship Building and Repair Warehousing *Not elsewhere classified The sectors Marine Construction, Marine Living Resources, Offshore Minerals, Ship & Boat Building and Repair, Coastal Tourism & Recreation, and Marine Transportation include specific industries that contribute to the Ocean Economy. Those industries shown in italics are considered ocean-related only when they are located in near-shore areas, which is defined by location in a shore-adjacent zip code. The use of NAICS codes and geography provides the best means of measuring the Ocean Economy. This methodology is based on available data consistent across all states and can provide information from the national to the local level. The NOEP has created two more sectors that lie outside of the National Income and Product Accounts, but which contribute to the Ocean Economy in ways not normally measured: Coastal Real Estate and Marine Research and Education. Categories of value and content compiled for both of these sectors have been designed to fulfill the same consistency and metrics as the NAICS sectors to the extent possible, so that these sectors can be compared across geographies and sectors as well. Dollar Values Values are expressed in constant dollars with 2000 as the base year unless otherwise stated. Because most federal statistics are still benchmarked to the year 2000, using any other base year would make it difficult to compare values across years. Wages are adjusted using the U.S. Consumer Price Index (CPI). The Gross Domestic Product (GDP) is estimated using Bureau of Economic Analysis estimates of real GDP. 4 4 Landefeld, J.S. and Robert Parker, BEA's Chain Indexes, Time Series, and Measures of Long Term Economic Growth. Survey of Current Business, May1997. It can be downloaded from the BEA website at 4
21 Dollar values are estimated as direct and indirect values. Indirect values include induced values. Direct values are those activities associated only with the designated ocean sectors such as Recreation & Tourism and Living Resources (examples include labor and capital costs associated with fish processing or ship building. Multipliers are indirect and induced values. Multipliers affect the estimates of employment, wages, and output within the region. Indirect effects include both the change in economic activity in industries within the region that buy or sell from ocean industries (examples include sales of food to restaurants and hotels and the activities of travel agents booking trips) and the change in economic activity resulting from the spending of the wages earned by those employed of the ocean industries within the region (induced). All indirect values or multiplier effects are based on IMPLAN, a standard and widely used economic impact model. Unless otherwise indicated, all measures are stated as direct values. Employment Employment is the annual average wage and salary employment (excluding selfemployment) as reported in the Quarterly Census of Employment and Wages (formerly known as the ES-202 employment series). This definition covers about 90% of employment in the U.S. It excludes farm employment, the military, railroads, and self-employment. Wage and salary employment measures employment by place of work, not by place of residence. It also measures jobs, not people. It does not distinguish between full and part time work, and yearround and part-year jobs. The data in the NOEP database is annual average employment. Employment in the fisheries harvesting sector is generally excluded from the unemployment insurance laws and thus is not included in the NOEP data. Gross Domestic Product (GDP) GDP is a measure of the contribution of the sector to the value of goods and services in the economy. GDP is a measure of value-added, or sales, minus the cost of inputs. Using this measure eliminates double counting, among sectors. 5 GDP data is published only at the state level and for industry aggregations greater than used in the Ocean Economy definition. In order to estimate a share of GDP in an Ocean or Coastal Economy industry, the proportion of the GDP for a given sector is calculated based on the proportion of total wages paid in that sector by a given establishment. Since wages often account for as much as 60% of GSP, this 5 Bureau of Economic Analysis defines GDP as the value added in production by the labor and property located in a state. GDP for a State is derived as the sum of the gross state product originating in all industries in a State. In concept, an industry's GDP, referred to as its "value added", is equivalent to its gross output (sales or receipts and other operating income, commodity taxes, and inventory change) minus its intermediate inputs (consumption of goods and services purchased from other U.S. industries or imported). Thus, GDP is often considered the state counterpart of the nation's gross domestic product (GDP), BEA's featured measure of U.S. output. In practice, GDP estimates are measured as the sum of the costs incurred and incomes earned in the production of GDP. 5
22 method is a reasonable approximation of individual establishments contribution to GDP. Housing Patterns and Trends These include both single and multi-family housing units including seasonal and year round, owner occupied and rental. The U.S. Bureau of Census is the source for these data. National Ocean Economics Program (NOEP): Externally funded program to understand and estimate changes in the nature and value of the coastal and ocean-based economy of the United States. Wages and Salaries: Total wages and salaries paid; all wages are shown in year 2000 dollars 6
23 Part II Executive Summary and Update Chapter 3 Executive Summary Florida s Coastal Economy generated almost $562B in Florida s Ocean Economy contributed $25B in Fishing Industry Commercial saltwater landings generated $143M in inflation-adjusted dockside sales in 2007, compared to $247.5M in Annual commercial saltwater landings declined 66% by weight and 56% in constant value between 1990 and Commercial vessel registrations declined 13.3% from 1990 to 2007, while pleasure craft registrations increased by 11%. Seafood Imports totaled $2.1B in 2007, an annual growth of 5.7% since Seafood Exports were $89.1B in In 2006, over 2M saltwater anglers contributed $3B in retail sales with over 180M fish landed, making Florida the number one recreational fishing state in the United States. Marine Transportation Florida's international trade value, including both waterborne and airborne commodities moving through coastal access points and over land, totaled $115B, a $5B increase in 2007 (4.7%) over the previous record of $110B in Florida s 14 deepwater seaports managed 121 million tons of cargo, generating an overall $73B economic contribution. Coastal Construction Dredging costs increased during the period , but declined sharply since, with a peak in 2000 at $41.2M, and value in 2005 being $3.3M. 59% of Florida s beaches (485 miles) are experiencing erosion; of these, 192 miles are nourished beaches managed by federal entities. $1.1B was spent from 1960 through 2007 on beach nourishment activities in Florida. Tourism and Recreation The Cruise Industry More than 9M cruise passengers embarked on cruises from U.S. ports in The top three Florida ports accounted for over 4M of the 9M passengers that embarked on cruises from U.S. ports in 2006 or an estimated 50% of all U.S. cruise embarkations. Florida businesses received almost $6B in 2006, or one-third of the direct expenditures generated by the cruise industry in the United States. 7
24 Real Estate Florida s 367,000 coastal properties were valued for tax purposes in 2006 at $181B, yielding $2B in property tax revenues. Coastal parcels made up 7.5% of the value of all real estate in Florida. From , the number of coastal parcels grew by about 10%, but the value of coastal parcels more than doubled reflecting the strong demand for coastal real estate in the early part of this decade. Seasonal Housing Florida ranks first in the nation for number of seasonal housing units. In 1990 Florida accounted for 14% of all seasonal housing units in the United States with 417,670. In 2006 Florida accounted for 16% of U.S. seasonal housing units with 655,647. From Florida added 237,977 seasonal housing units, a 57% growth rate, compared to an overall U.S growth in seasonal housing units of 37%. Marine Research and Education, 39 of 55 institutions reporting Annual Budgets totaled $272.5M. Annual Wages totaled $154M. Annual Employment totaled 2,925. Number of degree students totaled 2,234. Coastal Recreation In Fiscal Year 2007, the Florida system of State Parks provided a direct economic impact of over $936M to local economies throughout the state. For every 1,000 persons attending a State Park, total direct economic impact exceeded $43,200. On average, if a State Park were closed for one year, a loss of nearly $5.9M would impact the state economy. Similarly, if the State Park system increased annual attendance by 10% during the next fiscal year, the state s economy would rise by an additional $65M. In 2005, the recreational marine-related industry statewide generated $18.4B in annual economic impact, 220,000 jobs in the areas of boating and marinas, fishing, and marine science research. Almost 100,000 of these jobs were in manufacturing. 6 6 Murray, Thomas & Associates, Inc. (2005). Florida s Recreational Marine Industry Economic Impact and Growth: p. iii. Cited in Marine Industries Association of Florida. Boating is Big Business in Florida. Retrieved 11/15/
25 Chapter 4 Updates from Phase I Report To set the stage for the economic studies included in this report, the most recent estimates available for both the Ocean and Coastal economies for Florida are present below. Florida s Ocean Economy contributed $25B to state GDP during This comprised 4% of the total GDP. Without the multiplier effects, the Ocean Economy produced direct output of more than $14B. Table 4.1 Florida s Ocean Economy, 2005 Ocean Economy Employment, 2005 Sector Direct Indirect & Induced Total Construction 3,580 3,077 6,657 Living Resources 4,135 4,419 8,554 Minerals Ship & Boat Building 13,556 11,960 25,516 Tourism & Recreation 261, , ,873 Transportation 32,049 75, ,708 Ocean Economy 314, , ,173 Ocean Economy Wages, 2005 Sector Direct Indirect & Induced Total Construction $163,800, ,166,798 $300,967,608 Living Resources $122,450, ,230,122 $283,680,279 Minerals $20,717,729 66,319,522 $87,037,251 Ship & Boat Building $497,270, ,392,941 $844,663,111 Tourism & Recreation $4,786,359,214 2,935,474,106 $7,721,833,320 Transportation $1,615,599,892 2,610,163,186 $4,225,763,078 Ocean Economy $7,206,197,972 6,257,746,675 $13,463,944,647 Ocean Economy GDP, 2005 Sector Direct Indirect & Induced Total Construction $365,690, ,436,142 $699,126,142 Living Resources $354,640, ,507,072 $647,147,072 Minerals $68,900,000 49,311,730 $118,211,730 Ship & Boat Building $396,090, ,053,144 $658,143,144 Tourism & Recreation $10,512,590,000 7,697,318,398 $18,209,908,398 Transportation $2,322,960,000 2,200,307,712 $4,523,267,712 Ocean Economy $14,020,870,000 10,834,934,198 $24,855,804,198 Florida s coastal (shoreline counties) contributed almost $562B to state GDP for This was 82% of state GDP. Table 4.2 Florida s Coastal Economy, 2006 (shoreline counties only) Supersector Establishments Employment Wages GDP Construction 55, ,960 $19,370,199,234 $43,098,844,063 Financial Activities 55, ,621 $23,727,596,107 $141,238,751,050 Education and Health Services 41, ,115 $36,270,400,396 $44,543,391,374 Information 7, ,939 $6,915,884,613 $22,581,285,553 9
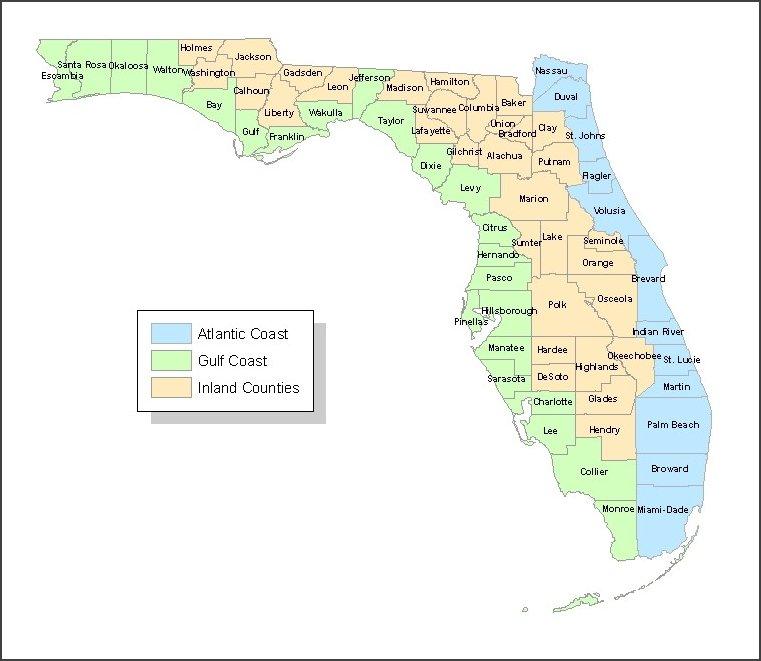
26 Supersector Establishments Employment Wages GDP Leisure and Hospitality 33, ,340 $12,812,829,992 $26,402,075,726 Manufacturing 13, ,599 $13,852,457,530 $27,480,902,806 Natural Resources and Mining 2,908 58,923 $1,384,373,389 $4,351,546,699 Other Services 38, ,734 $5,157,590,478 $14,166,289,754 Professional and Business Services 91, ,109 $39,061,614,696 $72,180,894,146 Public Administration 2, ,459 $15,733,744,365 $60,070,901,103 Trade, Transportation, and Utilities 97,711 1,226,712 $43,642,006,508 $105,637,428,623 Total, all industries 445,634 5,782,478 $226,403,461,926 $561,752,310, Florida Coastal Economy 2006 This section provides an update of Florida s Coastal Economy for It includes the most recent values of industries within the shoreline region, for the Atlantic and Gulf coasts, and their contribution to Florida s economy overall. Comparisons are made to the 2003 values, which were the most recent data available in NOEP s Florida Ocean and Coastal Economies, 2006 report. Percent changes from 2003 are shown on a state, regional, and county level. Overall, economic growth from was strong, with the smallest growth rates for employment at 10% increase, and the highest growth for GDP at 17.5%. While the final numbers for 2007 and 2008 are not yet available, initial evaluations show a reversal of the growth seen leading up to 2006, with declines in 2007 and Florida s shoreline and coastal regions contribution to the state economy in 2006 are provided in table 4.3. Florida s shoreline makes up over 75% of economic activity whether measured by GDP, wages, employment, or establishments, yet the shoreline counties make up only 56% of land area. Both coastal regions showed economic contributions that were inversely proportional to their land area. While the Gulf Coast makes up 34% of land area, it contributed approximately 30% of economic activity in Florida; however, the Atlantic Coast takes up 21% of land area and showed a range of economic activity from 45% of Florida s employment to almost 50% contribution to Florida s GDP. This disproportionate division of economic distribution is due to the urban counties such as Miami-Dade, Broward, Palm Beach, and Duval along the Atlantic Coast. These four counties alone make up 42% of Florida s overall GDP. Table 4.3 Florida Economy Total Regional Values and Contribution to State Economy, 2006 Establishments % of FL Total Employment % of FL Total Florida Total 560, % 7,632, % Shoreline Total 445, % 5,782, % Atlantic Shoreline 273, % 3,425, % Gulf Shoreline 172, % 2,356, % Wages % of FL Total GDP % of FL Total Florida Total $291,926,053, % $713,504,000, % Shoreline Total $226,403,461, % $561,752,310, % Atlantic Shoreline $139,954,527, % $352,075,624, % Gulf Shoreline $86,448,933, % $209,676,685, % 10
27 4.2 Coastal Economy Growth Florida experienced large economic growth rates from despite this short time period. The smallest changes were seen in employment, with the Atlantic Coast at 8.8% and the Gulf Coast at 9.8%, compared to the Florida state overall growth of 10% (shown in table 4.4). Combined, shoreline counties lagged the overall state growth trends somewhat, reflecting both the mature economies of the urban coastal areas and continued strong growth in central Florida around the Orlando area. However, the Gulf of Mexico shoreline counties did show somewhat faster growth than the state rates. Table 4.4 Florida Regional Coastal Economy % Change Establishments Employment Wages GDP Florida Total 17.36% 10.07% 14.51% 17.47% Shoreline Total 16.16% 9.22% 13.91% 16.91% Atlantic Shoreline 13.76% 8.83% 13.43% 16.26% Gulf Shoreline 20.20% 9.81% 14.71% 18.01% 4.3 Economic Growth at the County Level At the county level, growth over was uneven. Although state numbers show greater growth inland, more individual shoreline counties ranked among the top counties, in particular by real change, while more inland counties ranked among the bottom counties (tables 4.5 through 4.8). While this is the case, the actual change and percent change helps to identify the overall impact throughout the state for growth in both shoreline and inland counties. Without an indication of what the actual change or baseline for change is, percent change can not tell a complete story. For instance, different shoreline counties rank highest in growth when measured by percent change or by real change (tables 4.5 and 4.6). This demonstrates that while more significant changes are occurring in shoreline counties such as Flagler, Santa Rosa, Wakulla, and Walton (reflected in percent change), strong growth is still occurring in major shoreline counties such as Broward, Hillsborough, Miami-Dade, and Palm Beach (reflected in real change). While these latter counties do not rank high in percentage change, their real growth is high because they are some of the largest economic producers in the state, and any significant growth will produce the largest real change in value. On the other hand, inland counties such as Sumter, Liberty, and Baker counties have relatively small contributions to the overall state economy. However, growth in these inland counties has been consistently strong when measured by percent change, and these are some of the fastest growing counties in the state. This county comparison helps to explain why inland counties are showing a stronger percent change in state data than the shoreline; the coastal region consists of matured economies which, while contributing more to the overall state economy, show less growth than inland counties. Even though the inland counties contribute less to the state economy, they exhibit larger percent change. 11
28 Table 4.5 Top Five Counties by Percent Change County Establishment % Change Establishments 2003 Establishments 2006 Establishments Real Change Walton 70.14% 1,152 1, Flagler 61.49% 1,301 2, Sumter 53.66% Osceola 37.92% 3,940 5,434 1,494 Baker * 36.69% County Employment % Change Employment 2003 Employment 2006 Employment Real Change Sumter 71.03% 10,186 17,421 7,235 Liberty* 56.71% 1,617 2, Walton 49.32% 13,477 20,124 6,647 Bradford* 38.21% 5,237 7,238 2,001 Flagler 32.92% 14,138 18,792 4,654 County Wages % Change Wages 2003 Wages 2006 Wages Real Change Liberty* 73.04% $39,812,563 $68,891,679 $29,079,116 Sumter 64.85% $278,143,126 $458,531,465 $180,388,339 Walton 63.48% $316,331,449 $517,136,541 $200,805,092 Bradford* 44.25% $125,846,557 $181,537,045 $55,690,488 Santa Rosa 33.15% $682,672,506 $908,986,759 $226,314,253 County GDP % Change GDP 2003 GDP 2006 GDP Real Change Walton 71.69% $751,857,495 $1,290,852,682 $538,995,187 Sumter 63.23% $634,055,442 $1,034,973,740 $400,918,298 Liberty* 58.48% $36,913,186 $58,498,877 $21,585,691 Suwannee 48.19% $362,706,983 $537,500,333 $174,793,350 Wakulla 42.16% $214,012,226 $304,232,446 $90,220,220 Note: Shoreline counties highlighted in blue. Table 4.6 Top Five Counties by Real Change County Establishments Real Change Establishments 2003 Establishments 2006 Establishment % Change Broward 7,013 55,633 62, % Palm Beach 6,860 41,724 48, % Orange 5,747 28,440 34, % Hillsborough 5,568 29,990 35, % Miami-Dade 4,631 78,963 83, % County Employment Real Change Employment 2003 Employment 2006 Employment % Change Orange 74, , , % Broward 67, , , % Palm Beach 53, , , % Hillsborough 46, , , % Miami-Dade 40, ,453 1,007, % * Totals do not include Public Administration because county data for that sector are not available from BLS in useful form. 12
29 Establishments Establishments Establishments Establishment County Real Change % Change County Wages Real Change Wages 2003 Wages 2006 Wages % Change Miami-Dade $3,593,694,647 $33,385,154,936 $36,978,849, % Broward $3,496,434,270 $22,831,332,503 $26,327,766, % Orange $3,143,547,280 $19,575,051,161 $22,718,598, % Palm Beach $2,241,439,624 $17,877,340,999 $20,118,780, % Hillsborough $2,218,903,449 $19,839,780,747 $22,058,684, % County GDP Real Change GDP 2003 GDP 2006 GDP % Change Miami-Dade $12,044,132,282 $83,005,023,786 $95,049,156, % Broward $11,084,886,265 $57,498,727,832 $68,583,614, % Orange $9,301,099,182 $46,317,027,183 $55,618,126, % Hillsborough $8,072,891,960 $49,623,045,643 $57,695,937, % Palm Beach $6,012,352,388 $43,476,759,483 $49,489,111, % Note: Shoreline counties highlighted in blue. The bottom five counties showing the smallest growth, and sometimes declines, are consolidated in tables Unlike the top five counties, which showed a significant difference in counties that had strongest growth by percent change compared to real change, these bottom counties are consistently low regardless of whether measured by percent change or real change. This is due in part to most of the bottom five counties experiencing declines, which are negative regardless of how they are measured. However, some counties experienced drastic falls in particular aspects of their economy, leading to a strong decline in both real values and percent change. For instance, Putnam county saw a sharp fall in the Construction sector from , which led to the overall losses seen in employment, wages, and GDP. Both shoreline counties, Franklin and Monroe, saw growth in all sectors but Education, which fell in both counties during this period. For additional information on counties not included in tables , see Appendix A. Table 4.7 Bottom Five Counties by Percent Change County Establishment % Change Establishments 2003 Establishments 2006 Establishments Real Change Monroe 3.01% 3,981 4, Hamilton 1.84% Madison 1.42% Franklin -1.44% Liberty* -2.04% County Employment % Change Employment 2003 Employment 2006 Employment Real Change Glades -1.33% 1,357 1, Putnam -1.66% 19,219 18, Madison -2.77% 5,093 4, Monroe -4.34% 36,958 35,353-1,605 Charlotte % 49,500 43,639-5,861 13
30 County Wages % Change Wages 2003 Wages 2006 Wages Real Change Jackson 4.65% $338,535,945 $354,268,886 $15,732,941 Gadsden 4.37% $350,457,321 $365,759,813 $15,302,492 Madison 3.30% $106,572,640 $110,092,848 $3,520,208 Charlotte 1.60% $1,186,653,971 $1,205,614,757 $18,960,786 Putnam -1.20% $510,402,796 $504,260,494 ($6,142,302) County GDP % Change GDP 2003 GDP 2006 GDP Real Change Charlotte 6.83% $2,245,478,258 $2,398,900,143 $153,421,885 Leon 6.57% $10,020,353,645 $10,678,433,147 $658,079,502 Calhoun* 3.87% $89,298,128 $92,754,913 $3,456,785 Putnam 2.51% $1,061,916,994 $1,088,610,228 $26,693,234 Hamilton 1.09% $119,396,808 $120,693,491 $1,296,683 Note: Shoreline counties highlighted in blue. Table 4.8 Bottom Five Counties by Real Change County Establishments Real Change Establishments 2003 Establishments 2006 Establishment % Change Lafayette % Madison % Hamilton % Liberty* % Franklin % County Employment Real Change Employment 2003 Employment 2006 Employment % Change Glades -18 1,357 1, % Madison ,093 4, % Putnam ,219 18, % Monroe -1,605 36,958 35, % Charlotte -5,861 49,500 43, % County Wages Real Change Wages 2003 Wages 2006 Wages % Change Franklin $8,438,278 $69,523,674 $77,961, % Glades $6,231,603 $29,464,529 $35,696, % Madison $3,520,208 $106,572,640 $110,092, % Lafayette $2,145,640 $34,969,492 $37,115, % Putnam ($6,142,302) $510,402,796 $504,260, % County GDP Real Change GDP 2003 GDP 2006 GDP % Change Glades $16,519,303 $48,944,399 $65,463, % Madison $15,065,484 $197,911,128 $212,976, % Lafayette $9,840,419 $80,196,239 $90,036, % Calhoun* $3,456,785 $89,298,128 $92,754, % Hamilton $1,296,683 $119,396,808 $120,693, % Note: Shoreline counties highlighted in blue. 14
31 Table 4.9 displays the most recent 2006 values for employment, wages, and GDP, as well as both average wage and average contribution to GDP per employee for each county. Table 4.9 Florida County Comparisons of Economic Indicators, 2006 Avg. Wage per Employee Avg. Contribution to GDP per Employee County Employment Wages GDP Alachua 124,818 $3,703,063,276 $29,668 $6,401,714,619 $51,288 Baker * 6,540 $153,832,698 $23,522 $232,217,183 $35,507 Bay 73,069 $2,079,693,284 $28,462 $4,897,986,202 $67,032 Bradford* 7,238 $181,537,045 $25,081 $262,641,142 $36,286 Brevard 207,781 $7,058,910,011 $33,973 $16,081,775,779 $77,398 Broward 746,928 $26,327,766,773 $35,248 $68,583,614,097 $91,821 Calhoun* 2,891 $65,892,453 $22,792 $92,754,913 $32,084 Charlotte 43,639 $1,205,614,757 $27,627 $2,398,900,143 $54,971 Citrus 33,923 $909,883,233 $26,822 $1,887,026,545 $55,627 Clay 44,792 $1,165,825,399 $26,028 $2,248,684,564 $50,203 Collier 134,891 $4,529,338,578 $33,578 $10,777,234,315 $79,896 Columbia 21,674 $580,744,104 $26,795 $1,193,696,373 $55,075 DeSoto 9,062 $216,482,545 $23,889 $543,967,041 $60,027 Dixie 2,794 $65,060,027 $23,286 $136,396,134 $48,818 Duval 461,726 $16,649,684,731 $36,060 $44,625,799,157 $96,650 Escambia 129,644 $3,735,416,044 $28,813 $8,579,697,747 $66,179 Flagler 18,792 $487,003,195 $25,915 $1,179,088,850 $62,744 Franklin 3,373 $77,961,952 $23,114 $210,200,513 $62,319 Gadsden 14,947 $365,759,813 $24,470 $639,100,359 $42,758 Gilchrist* 2,603 $57,816,528 $22,211 $102,113,555 $39,229 Glades 1,339 $35,696,132 $26,659 $65,463,702 $48,890 Gulf 4,181 $106,936,502 $25,577 $261,469,177 $62,537 Hamilton 3,636 $113,030,013 $31,086 $120,693,491 $33,194 Hardee 8,218 $186,300,446 $22,670 $404,281,617 $49,195 Hendry 12,309 $301,012,228 $24,455 $680,276,374 $55,267 Hernando 40,029 $990,885,229 $24,754 $2,117,575,206 $52,901 Highlands 28,666 $673,680,685 $23,501 $1,483,787,259 $51,761 Hillsborough 639,459 $22,058,684,196 $34,496 $57,695,937,603 $90,226 Holmes 3,544 $77,592,059 $21,894 $168,759,837 $47,618 Indian River 50,027 $1,445,071,659 $28,886 $3,379,419,634 $67,552 Jackson 14,755 $354,268,886 $24,010 $832,975,456 $56,454 Jefferson 3,212 $77,194,135 $24,033 $184,050,515 $57,301 Lafayette 1,689 $37,115,132 $21,975 $90,036,658 $53,308 Lake 83,915 $2,311,951,430 $27,551 $5,235,571,465 $62,391 Lee 224,141 $7,092,817,944 $31,644 $16,619,715,374 $74,148 Leon 146,206 $4,497,701,522 $30,763 $10,678,433,147 $73,037 Levy 9,033 $201,570,521 $22,315 $453,207,016 $50,172 Liberty* 2,534 $68,891,679 $27,187 $58,498,877 $23,086 Madison 4,952 $110,092,848 $22,232 $212,976,612 $43,008 * Totals do not include Public Administration because county data for that sector are not available from BLS in useful form. 15
32 Avg. Wage per Employee Avg. Contribution to GDP per Employee County Employment Wages GDP Manatee 127,815 $3,681,451,676 $28,803 $8,175,420,874 $63,963 Marion 103,211 $2,761,857,643 $26,759 $6,664,222,330 $64,569 Martin 60,512 $1,812,362,483 $29,950 $4,276,018,989 $70,664 Miami-Dade 1,007,472 $36,978,849,583 $36,705 $95,049,156,068 $94,344 Monroe 35,353 $1,053,945,438 $29,812 $2,548,503,932 $72,087 Nassau* 17,008 $490,899,687 $28,863 $1,058,879,347 $62,258 Okaloosa 83,882 $2,464,217,808 $29,377 $6,264,366,946 $74,681 Okeechobee 10,831 $267,289,021 $24,678 $592,612,693 $54,714 Orange 678,547 $22,718,598,441 $33,481 $55,618,126,365 $81,967 Osceola 68,517 $1,784,845,894 $26,050 $3,830,140,729 $55,901 Palm Beach 561,564 $20,118,780,623 $35,826 $49,489,111,871 $88,127 Pasco 99,437 $2,636,163,767 $26,511 $5,439,562,860 $54,704 Pinellas 444,590 $14,035,536,899 $31,570 $34,626,983,424 $77,885 Polk 207,857 $5,951,066,430 $28,631 $13,843,627,615 $66,602 Putnam 18,900 $504,260,494 $26,680 $1,088,610,228 $57,598 St. Johns 55,228 $1,630,320,858 $29,520 $3,799,080,808 $68,789 St. Lucie 70,255 $2,026,539,065 $28,845 $4,678,505,021 $66,593 Santa Rosa 32,622 $908,986,759 $27,864 $1,901,059,263 $58,275 Sarasota 159,078 $5,075,024,010 $31,903 $12,322,431,331 $77,462 Seminole 177,452 $5,728,763,569 $32,283 $14,613,794,670 $82,354 Sumter 17,421 $458,531,465 $26,321 $1,034,973,740 $59,410 Suwannee 9,991 $231,668,618 $23,188 $537,500,333 $53,798 Taylor 6,991 $184,606,215 $26,406 $428,281,782 $61,262 Union 4,096 $110,558,453 $26,992 $92,215,996 $22,514 Volusia 167,235 $4,453,689,929 $26,631 $9,662,694,402 $57,779 Wakulla 5,468 $136,754,037 $25,010 $304,232,446 $55,639 Walton 20,124 $517,136,541 $25,698 $1,290,852,682 $64,145 Washington 6,384 $148,456,751 $23,255 $233,291,788 $36,543 Note: Shoreline counties highlighted in blue. 4.4 Population and Housing Inland counties from showed the most growth with a 6% growth in population and almost an 8% growth in housing (table 4.10). However, inland counties have the smallest population and housing numbers of any region. The density along the shoreline (a combination of both the Atlantic and Gulf coasts) is almost three times larger than inland counties for population and housing, which is due to the large density along the Atlantic Coast from
33 Table 4.10 Florida s Regional Population and Housing Population Housing Region 2004 Population 2004 Density 2006 Population 2006 Density Population Growth 2004 Housing 2004 Density 2006 Housing 2006 Density Housing Growth Shoreline 13,307, ,786, % 6,232, ,619, % Inland 4,059, ,303, % 1,777, ,914, % Atlantic 7,938, ,173, % 3,506, ,697, % Gulf 5,368, ,612, % 2,725, ,921, % Florida 17,366, ,089, % 8,010, ,533, % The shoreline showed the least growth in comparison to the overall state and inland counties, but accounts for the majority of Florida s population at 76% from 2004 to 2006 (table 4.11). The Atlantic Coast has about 45% of the population, while the Gulf Coast has 31%, and the inland counties region has almost 24% from 2004 to Table 4.11 Distribution of Florida s Population, 2006 Region Population Percent Shoreline 13,786, % Inland 4,303, % Atlantic 8,173, % Gulf 5,612, % The majority, almost 78%, of Florida s housing is also along the shoreline counties, while only 22% are in inland counties from 2004 to 2006 (table 4.12). About 43% of the housing exists along the Atlantic Coast from 2004 to 2006, whereas about 34% is along the Gulf Coast. Table 4.12 Distribution of Florida s Housing, 2006 Region Housing Percent Shoreline 6,619, % Inland 1,914, % Atlantic 3,697, % Gulf 2,921, % Population and Housing by County Most counties experienced a growth in population from , but five counties experienced a negative growth (Pinellas at -0.2%, Escambia at -0.2%, Okaloosa at -0.2%, Charlotte at -1.7%, and Monroe at -4.1%), as shown in Table Nine counties experienced a population growth of at least 10% (Lee, Pasco, Lake, St. Lucie, Osceola, St. Johns, Hernando, Flagler, and Sumter). Flagler experienced the highest population growth at almost 21% and Sumter, the next highest, at about 14%. 17
34 Table 4.13 Florida Counties Population, Growth, and Density, 2006 Rank County Population Population Population Growth Density County Rank 1 Miami-Dade 2,402, % 3,303 Pinellas 1 2 Broward 1,787, % 1,483 Broward 2 3 Palm Beach 1,274, % 1,320 Seminole 3 4 Hillsborough 1,157, % 1,234 Miami-Dade 4 5 Orange 1,043, % 1,150 Orange 5 6 Pinellas 924, % 1,108 Hillsborough 6 7 Duval 837, % 1,083 Duval 7 8 Lee 571, % 711 Lee 8 9 Polk 561, % 647 Sarasota 9 10 Brevard 534, % 645 Palm Beach Volusia 496, % 604 Pasco Pasco 450, % 525 Brevard Seminole 406, % 450 Volusia Sarasota 369, % 446 Escambia Marion 316, % 442 St. Lucie Collier 314, % 423 Manatee Manatee 313, % 368 Leon Escambia 295, % 346 Hernando Lake 290, % 305 Lake St. Lucie 252, % 300 Polk Leon 245, % 298 Clay Osceola 244, % 278 St. Johns Alachua 227, % 260 Alachua Okaloosa 180, % 259 Indian River Clay 178, % 251 Martin St. Johns 169, % 237 Citrus Hernando 165, % 223 Charlotte Bay 163, % 214 Bay Charlotte 154, % 200 Marion Santa Rosa 144, % 193 Okaloosa Martin 139, % 185 Osceola Citrus 138, % 171 Flagier Indian River 130, % 155 Collier Highlands 97, % 142 Santa Rosa Flagler 83, % 126 Sumter Monroe 74, % 103 Putnam Putnam 74, % 102 Nassau Sumter 68, % 97 Bradford Columbia 67, % 95 Highlands Nassau 66, % 90 Gadsden Walton 52, % 84 Columbia Jackson 49, % 75 Monroe Gadsden 46, % 62 Union Hendry 40, % 57 Suwannee Okeechobee 40, % 55 DeSoto Suwannee 39, % 54 Jackson 46 18
35 Rank County 2006 Population Population Growth 2006 Population Density County 47 Levy 39, % 52 Okeechobee DeSoto 35, % 49 Walton Wakulla 29, % 49 Wakulla Hardee 28, % 48 Gilchrist Bradford 28, % 45 Hardee Baker 25, % 43 Baker Washington 22, % 40 Holmes Taylor 19, % 39 Washington Holmes 19, % 35 Hendry Madison 19, % 35 Levy Gilchrist 16, % 28 Madison Dixie 14, % 28 Hamilton Union 14, % 25 Gulf Jefferson 14, % 25 Jefferson Hamilton 14, % 24 Calhoun Gulf 14, % 21 Dixie Calhoun 13, % 19 Taylor Glades 11, % 19 Franklin Franklin 10, % 15 Lafayette Lafayette 8, % 15 Glades Liberty 7, % 9 Liberty 67 Rank All counties from 2004 to 2006 experienced a growth in housing, as shown in table From 2004 to 2006, thirteen counties experienced a housing growth of at least 10% (Lee, Lake, St. Lucie, Osceola, Bay, St. Johns, Hernando, Indian River, Clay, Flagler, Sumter, Walton, and Wakulla). Flagler and Sumter experienced the greatest housing growth at, respectively, about 36% and 28% from 2004 to
36 Table 4.14 Florida Counties Housing, Growth, and Density, 2006 Rank County Housing Housing Housing Growth Density County Rank 1 Miami-Dade 953, % 1,781 Pinellas 1 2 Broward 796, % 661 Broward 2 3 Palm Beach 631, % 552 Seminole 3 4 Hillsborough 505, % 491 Duval 4 5 Pinellas 498, % 490 Miami-Dade 5 6 Orange 440, % 485 Orange 6 7 Duval 379, % 481 Hillsborough 7 8 Lee 341, % 425 Lee 8 9 Polk 269, % 380 Sarasota 9 10 Brevard 260, % 320 Palm Beach Volusia 243, % 286 Pasco Sarasota 216, % 256 Brevard Pasco 212, % 225 Manatee Collier 187, % 221 Volusia Seminole 169, % 219 St. Lucie Manatee 166, % 207 Escambia Marion 152, % 179 Leon Escambia 136, % 162 Hernando Lake 134, % 147 Indian River St. Lucie 125, % 144 Polk Leon 119, % 141 Lake Osceola 109, % 139 Charlotte Alachua 106, % 135 Martin Charlotte 96, % 132 St. Johns Bay 95, % 126 Citrus Okaloosa 91, % 125 Bay St. Johns 80, % 122 Alachua Hernando 77, % 116 Clay Martin 74, % 98 Okaloosa Indian River 74, % 97 Marion Citrus 73, % 96 Flagier Clay 69, % 93 Collier Santa Rosa 58, % 83 Osceola Monroe 53, % 75 Sumter Highlands 53, % 57 Santa Rosa Flagler 46, % 54 Monroe Sumter 40, % 52 Highlands Walton 40, % 49 Putnam Putnam 35, % 49 Nassau Nassau 31, % 38 Walton Columbia 25, % 36 Gadsden Jackson 20, % 34 Bradford Gadsden 18, % 32 Columbia Levy 17, % 24 Suwannee Suwannee 16, % 23 DeSoto Okeechobee 16, % 22 Jackson 46 20
37 Rank County 2006 Housing Housing Growth 2006 Housing Density County Rank 47 DeSoto 14, % 21 Okeechobee Hendry 13, % 21 Wakulla Wakulla 12, % 18 Gilchrist Hardee 10, % 17 Washington Bradford 10, % 17 Holmes Taylor 10, % 16 Union Washington 9, % 16 Hardee Baker 8, % 16 Levy Gulf 8, % 15 Gulf Franklin 8, % 15 Franklin Holmes 8, % 15 Baker Madison 8, % 12 Madison Dixie 7, % 11 Hendry Gilchrist 6, % 11 Dixie Glades 6, % 10 Hamilton Jefferson 5, % 10 Calhoun Calhoun 5, % 10 Taylor Hamilton 5, % 10 Jefferson Union 3, % 8 Glades Liberty 3, % 5 Lafayette Lafayette 2, % 4 Liberty 67 Florida Versus Other Coastal States Compared to other coastal states, from 2004 to 2006, Florida ranks third in coastal population and thirteenth in coastal density (table 4.15). 21
38 Table 4.15 Coastal States Coastal Population and Density, 2006 Rank State Population Coastal % Coastal of State Land Density State Rank 1 California 27,413, % 1,393 4,308 Illinois 1 2 New York 16,395, % 1,729 1,682 Pennsylvania 2 3 Florida 13,786, % 5,639 1,390 New Jersey 3 4 New Jersey 7,836, % 3,546 1,363 Massachusetts 4 5 Illinois 6,001, % 1,045 1,022 Rhode Island 5 6 Texas 5,836, % 2, Connecticut 6 7 Michigan 5,061, % 19, New York 7 8 Massachusetts 4,834, % 3, Ohio 8 9 Virginia 4,826, % 39, California 9 10 Washington 4,390, % 6, Maryland Maryland 3,771, % 8, Virginia Pennsylvania 2,907, % 1, Indiana Ohio 2,702, % 29, Florida Connecticut 2,172, % 1, Delaware Wisconsin 2,008, % 1, New Hampshire Louisiana 1,927, % 15, Texas Oregon 1,449, % 18, Washington Hawaii 1,285, % 2, Alabama South Carolina 1,105, % 6, Hawaii Rhode Island 1,067, % 1, Mississippi Maine 984, % 10, Wisconsin North Carolina 904, % 6, South Carolina Delaware 853, % 31, Michigan Indiana 764, % 13, Louisiana Georgia 579, % 5, Georgia Alabama 573, % 9, North Carolina Alaska 568, % 12, Maine New Hampshire 416, % 19, Oregon Mississippi 342, % 10, Minnesota Minnesota 246, % 381,120 1 Alaska 30 United States 123,015, % 696, United States Florida ranks second in coastal housing compared to other coastal states from 2004 to 2006, but twelfth in housing density (table 4.16). 22
39 Table 4.16 Coastal States Coastal Housing and Density, 2006 Rank State Housing Coastal % Coastal of State Land Density State Rank 1.California 9,913, % 1,393 1,728.Illinois 1 2.Florida 6,619, % 1, Pennsylvania 2 3.New York 6,564, % 3, Massachusetts 3 4.New Jersey 3,135, % 5, New Jersey 4 5.Illinois 2,408, % 1, Rhode Island 5 6.Texas 2,294, % 2, Connecticut 6 7.Michigan 2,281, % 19, New York 7 8.Massachusetts 2,045, % 3, Ohio 8 9.Virginia 1,982, % 39, California 9 10.Washington 1,888, % 6, Maryland Maryland 1,580, % 8, Virginia Pennsylvania 1,237, % 29, Florida Ohio 1,231, % 1, Indiana Wisconsin 909, % 1, Delaware Connecticut 885, % 1, New Hampshire Louisiana 808, % 15, Texas Oregon 619, % 18, Washington South Carolina 570, % 2, Alabama Maine 506, % 1, Mississippi Hawaii 500, % 10, Wisconsin North Carolina 486, % 6, South Carolina Rhode Island 449, % 6, Hawaii Delaware 382, % 31, Michigan Indiana 320, % 13, Louisiana Alabama 273, % 9, North Carolina Georgia 253, % 5, Georgia Alaska 233, % 12, Maine New Hampshire 172, % 19, Oregon Mississippi 156, % 10, Minnesota Minnesota 127, % 381,120 1.Alaska 30 United States 50,836, % 672, United States 4.5 Conclusion While this update provides the current values, and changes from the 2003 values in the Phase I report, the overall change during the time period of available data was not noteworthy. However, some counties showed significant growth; most notably the inland counties, which had less established economies and base populations from which to grow. Other counties, typically urban shoreline counties, showed small percentage growth in their economies, population, and housing. This was due to the mature nature of these communities; they have established bases of population and housing and their economies are already some of the largest in the state. In 2006, the Florida Coastal Economy GDP was $562B, 82% of the state total. Density of both population and housing in 2006 along the shoreline of Florida was almost three times greater than inland counties. The shoreline counties made up 76% of the state population (13.8M people) and 78% of state housing (6.6M housing units). 23
40 In 2005, the headlining industry in the state s Ocean Economy was still Coastal Tourism and Recreation, making up 73% of state GDP ($18.2B). Marine Transportation was the next largest sector at $4.5B in state GDP, while Marine Construction and Marine Living Resources combined made up less than a third of this amount, contributing $699M and $647M respectively. 24
41 Part III Ocean Economy: Sector Supplements The Ocean Economy includes those economic sectors that are directly dependent upon the ocean. In Phase I, the NOEP reported the status of four economic indicators for Florida establishments, employment, wages and GDP for six sectors: Coastal Tourism, Marine Transportation, Fishing, Coastal Construction, Offshore Minerals, and Ship and Boat Building and Repair. These also included basic production data for fisheries as part of the Fishing sector. Chapter 4 of this report provided a summary update for those Ocean sectors, using the same indicators in Phase I as context for the remaining part of the Phase II Report. Phase II goes beyond what was presented in Phase I without repeating, but rather expands those sectors and adds two new ones Real Estate values, and Marine Research and Education. The last two fall outside the statistical framework of the National Income and Product Accounts used for the other NOEP industrial sectors, so the NOEP has created a template that allows comparisons among other states for these new sectors, but not among sectors; Research and Education sector. The Real Estate sector measures property values and uses, comparing shoreline with inland values to reflect the value added by proximity to the oceans; only employment and wages are comparable to the other sectors in the Marine..Expanded sectors for Phase II include A) Chapter 5: detailed fishing industry indicators that reflect changes over time and trends and opportunities; B) Marine Transportation data reflecting trade patterns and values according to geographies and cargo, providing counties increased indicators that reflect their economic engines; C) Coastal Tourism and Recreation: Passenger and revenue data from the Cruise Industry which has a dominant role in Florida s economy, but is not a direct addition to the estimates from Phase I, just a different way of measuring impacts with additional data; D) Marine Construction: detailed beach nourishment data and dredging information to enhance the estimates from Phase I. 25
42 Chapter 5 Fishing Industry 5.1 Fishing Industry Overview Florida s fishing industry has two primary industries: commercial fisheries (seafood and wild ornamental collection) and recreational fishing. There are also important freshwater and saltwater aquaculture sectors. Also included in this chapter are detailed data for seafood processing, and seafood imports and exports. Imports and exports were added to demonstrate the difference in the scale of volume between domestically harvested and imported commercial species and to explain the changes in the seafood processing industry, which processes both domestically harvested and imported fish. Data on employment in the commercial fishing industry is not available for Florida, as is the case for most other states. As a proxy for employment, this section presents data on commercial fishing licenses for salt water use. In contrast to commercial fishing, where the initial value of production (dockside value and value of output from the processing industry) is determined through on-going data collection programs, the economic activity associated with recreational fishing is measured through periodic surveys of marine sports fishing participants. The recreational value (or expenditures) is generated through data collected by these surveys which describe the number of days spent fishing and the expenditures by recreational anglers for food, bait, boats, etc. These recreational-oriented expenditure measures are not consistent with the dockside and processed value measures for the commercial industry, so it is not possible to add the two together to obtain a "total economic value" for all fishing activities. Historically, Florida has been a top marine recreational fishing and seafood producing state. Resident and out-of-state anglers are enjoying the abundance of Florida waters in record numbers, and marine seafood landing values consistently place Florida among the top ten states. Highlights from the collected data follow. Commercial Fisheries Though historically an important source of domestic seafood products for the U.S. market, the volume and value of landings by the commercial fishing industry has declined during the past decade, partly due to reduced fish stocks, as well as management decisions concerning gear and catch limitations. o Commercial saltwater landings generated $143M in inflation-adjusted dockside sales in 2007, compared to $247.5M in 1990 o Annual commercial saltwater landings dropped 66% by weight (181.6M pounds to 80.1M pounds) and 56% ($247.5M to $143M) 7 in constant value 8 between 1990 and Florida Fish and Wildlife Conservation Commission. Commercial Fisheries Landings in Florida. 8 Values expressed in constant 2000 dollars are deflated by consumer price index. 26
43 o Commercial ornamental harvests (ornamental fish, invertebrates, rock and sand, and marine plants), while small in value compared to seafood landings, continue to represent an important component of the overall commercial fisheries harvest industry. o Commercial fishing licenses dropped by 38% between FY 1995 and FY 2006, probably tracking the decline in catch. o Aquaculture contributed $100M (nominal) in 2003 sales, but only a small portion was devoted to edible products, with the major component represented by cultured, freshwater, ornamental fish. o Hard clams reported considerable growth between 1995 and 2005: $10.7M in sales by 153 growers in 2005 versus 1995 sales of $5.41M by 142 growers. o Cultured oysters reported sales of $0.9M during 2005 with little if any growth. Though most oysters are harvested from public beds, some oyster culture is currently being conducted on several shellfish leases located in Apalachicola Bay (Floridaaquaculture.com). o Aside from hard clam culture, the edible seafood component of the Florida aquaculture industry has not shown much growth and has recently been shown to be very susceptible to hurricane-related damage. Recreational Fisheries With a stable record of economic contribution, saltwater recreational fishing has been valuable to Florida s Ocean Economy. o ~2M saltwater anglers contributed $3B in retail sales in 2006 making Florida first in the nation in both categories. o >180M fish landed in 2006, making Florida the number one recreational fishing state in the United States in terms of numbers of fish caught. o Number of fishing licenses and permits grew at an annual rate of 3.1%, from 1M in 2004 to 1.1M in 2007, and annual revenue from sales grew 4.3% from $14.8M to $17M. Seafood Processing, Imports and Exports Though Florida s commercial landings and processed seafood value declined between 1990 and 2007, seafood imports and exports increased. o Seafood Imports totaled $2.1B in 2007, an annual growth of 5.7% since o Seafood Exports were $89.1B in 2007, an annual rate of 6.4% since o Seafood Re-Exports (imports that are exported without processing) grew 10.9% annually since 1990, worth $15.7B in o Number of seafood processors and wholesale plants declined by 30% since Employment in these plants declined by 22%. Commercial vessel registrations Commercial vessel registrations dropped 13.3% from 1990 to 2007, while pleasure craft registrations increased by 11%. Commercial Fisheries Landings The commercial fishing industry represents an important component of the natural resource-based businesses in Florida. However, commercial marine seafood landings have declined steadily since 1990 (figure 5.1.1). From a high of 181M pounds in 1990 to 27
44 a low of 80M pounds in 2007, the weight of total landings has declined by 56%. The decline in the volume of landings is somewhat offset by an increase in value as the resource becomes more scarce. The result is that the nominal value of landings has declined only slightly. However, in constant dollars, the value of Florida s marine seafood landings declined 42% between 1990 and 2007, and 44% between the 1994 peak and Much of the annual variation is based on environmental conditions affecting year-to-year spawning, recruitment, and effort. However the consistent downward trend beginning in the mid-1990 s can be largely traced to increasingly stressed stocks and more stringent management. Specifically, the use of entangling nets was banned from state waters beginning in In addition, permit moratoria, more stringent harvest quotas, and other constraints have contributed to the declining commercial catch. Million Pounds $Million (2000 $) Landed Weight Landed Value Figure 5.1 Commercial Seafood Harvests Table 5.1 Commercial Seafood Harvests, 1990, 1994, 2007 Year Million Pounds $Million (nominal) $ $ $170.9 Of the coastal regions, the Gulf Coast has, on average, landed 70-75% of Florida s domestic seafood catch by weight and 70-80% by value (figure 5.2). Both coasts have shown similar decline in production with each dropping 49% in weight from the 1994 peak. The Atlantic Coast declined 55% in constant value while the Gulf Coast fell 40% between 1994 and Florida marine seafood is also landed at inland and out of state ports, which accounted for 1.2M pounds, valued at $1.4M in
45 140 $200 Million Pounds $180 $160 $140 $120 $100 $80 $60 $40 $20 $Million (2000 $) $0 Atlantic Weight Gulf Weight Atlantic Value Gulf Value Figure 5.2 Commercial Seafood Landings by Coast Marine seafood products are divided into four main groups; finfish, food shrimp, bait shrimp, and invertebrates, which include clams, oysters, crabs, lobsters, squids and sponges (figure 5.3). Finfish and invertebrates make up over two thirds of the catch each year. In 2007, 43.3M pounds of finfish were landed, valued at $65M and 22.4M pounds of invertebrates were caught worth $72M (table 5.2). 140 $ $100 Million Pounds $80 $60 $40 $Million (2000 $) 20 $ $0 Finfish Invertebrates Bait Shrimp Food Shrimp Finfish Value Invertebrates Value Bait Shrimp Value Food Shrimp Value Figure 5.3 Commercial Seafood Groups Table 5.2 Commercial Seafood Groups, 2007 Seafood Group Million Pounds $Million (nominal) Finfish 43.3 $64.8 Invertebrates 22.4 $72.0 Food Shrimp 12.7 $26.5 Bait Shrimp 1.8 $7.5 29
46 The Gulf Coast (including Monroe county) produced the most seafood in 2007, totaling 54.9M pounds valued at over $128.4M (table 5.3). This was 70% of the weight of Florida s landings and 75% of the value. Finfish accounted for the majority of the Gulf Coast s catch by weight; invertebrates generated the most value ($62.7M) of the seafood groups. Table 5.3 Seafood Groups of the Atlantic and Gulf Coasts, 2007 Coast Seafood Group Weight Nominal Value Atlantic Coast Gulf Coast FINFISH 13,683,525 $19,628,031 SHRIMP, FOOD 5,750,915 $12,314,930 INVERTEBRATES 4,313,726 $7,987,062 SHRIMP, BAIT 276,948 $1,142,296 Total 24,025,114 $41,072,319 INVERTEBRATES 17,082,521 $62,742,155 FINFISH 29,373,141 $45,087,443 SHRIMP, FOOD 6,938,452 $14,153,570 SHRIMP, BAIT 1,490,713 $6,401,922 Total 54,884,827 $128,385,090 Monroe County was the largest commercial producer in 2007 with over 9.4M pounds worth $30.5M. Duval, Franklin, Pinellas, and Lee counties rounded out the top five with over 6.1M pounds each, valued between $9.5M and $14.3M. For a complete list of counties with landed values, see Appendix B1. Commercial Ornamental Harvests A little known commercial fishery in Florida is the collection of wild, marine ornamental species. Various finfish, invertebrate, and plant species are collected primarily for the aquarium hobbyist market. The collection of marine species for this purpose is conducted primarily in south Florida, with the majority of the commercial activity in Monroe County. The wild caught commercial landings account for most of the marine ornamental products and were valued at $2.9M in 2007 (figure 5.4), down from its peak of $4.8M in $5,000,000 Landed Value (2000 $) $4,000,000 $3,000,000 $2,000,000 $1,000,000 $ SOURCE: Figure 5.4 Commercial Marine Ornamental Landed Values
47 Marine ornamentals are divided into four groups, finfish, invertebrates, live rock and sand, and plants. Invertebrates include, but are not limited to, clams, crabs, jellyfish, lobsters, octopus, snails, starfish, and soft corals. Live rock and sand products are measured in pounds while plants and animals are counted as individual specimens. Finfish and invertebrates generate about 90% of the ornamental value (figure 5.5). However, finfish volume has been declining from its 1994 peak to its lowest value in 2005 and harvests of invertebrates have been increasing since 1990 in contrast to the finfish production. Number Landed 10,000,000 9,000,000 8,000,000 7,000,000 6,000,000 5,000,000 4,000,000 3,000,000 2,000,000 1,000, $2,500,000 $2,000,000 $1,500,000 $1,000,000 $500,000 $0 Landed Value (2000 $) Finfish Invertebrates Finfish Value Invertebrate Value Figure 5.5 Ornamental Finfish and Invertebrate Harvests The 1994 peak in finfish landings netted almost 425 thousand specimens worth $1.8M. Since then, finfish landings dropped fairly steadily until 2005 and have remained relatively stable. In contrast, 1,900,000 ornamental invertebrates were taken in 1994, valued at only $1.3M. Invertebrate landings peaked in 2006 with 8.9M specimens valued at $1.9M. While landings were slightly lower in 2004, they were valued at a record $2.2M. While the finfish and invertebrates landings and value have been fairly stable for the last decade, landings and values for live rock have been highly volatile (figure 5.6). The landing weights of live rock has soared to highs of over a million in 1994 and 1995, and again in 2003 and 2004, and they have declined to lows of 150,000 in 1990, 1998, and again in The total annual value of live rock and sand followed the landing weights up and down in the 1990 s, but the value did not keep pace with the increased landings in the early part of this decade. The value of live rock and sand peaked in 1995 at $1.6M, plummeted to $194,000 in 1997, but stabilized in this decade to range from $200,000 to $444,000, despite large fluctuations in the number of landings. 31
48 Pounds 1,400,000 1,200,000 1,000, , , , , $1,800,000 $1,600,000 $1,400,000 $1,200,000 $1,000,000 $800,000 $600,000 $400,000 $200,000 $0 Landed Value (2000 $) Live Rock & Sand Value Figure 5.6 Marine Ornamental Live Rock and Sand The increase in the landing of live rock and sand in 1994 and 1995 was due to the increase in the harvest of natural live rock, which gained in popularity during that period. However, the prohibition of the removal of natural live rock in the mid-1990 s caused a sharp downturn in harvests. Leases for the planting of cultured live rock began to be developed in the mid-1990 s, with initial harvests occurring in the period. Cultured harvests have become somewhat erratic since. For further information about commercial ornamental harvests, see Appendix B2. Commercial Fishing Licenses Commercial licenses are required by the State of Florida for any persons or companies harvesting live sea products for profit, and for wholesale and retail dealers purchasing products from licensed fishers. For more information regarding commercial fishing licenses, see Appendix B3. Overall, the number of commercial marine licenses declined by 38% between and , from 52,911 to 32,856 (figure 5.7). For a list of commercial license sales by county, see Appendix B3. 32
49 60,000 50,000 40,000 30,000 20,000 10, Fiscal Year Figure 5.7 Commercial Marine Fishing Licenses FY to FY The number of retail and wholesale dealer licenses increased by 9% from 6,127 in to 6,652 in probably reflecting the increased presence of imported seafood in the market (figure 5.8). Saltwater Products licenses had the largest numeric decline, falling from 19,421 to 11,226, a 42% decline. Stone Crab licenses had the largest proportional decline, falling by 79%, from 6066 permits in to 1277 permits in In 2001 a new limited access program was adopted which eliminated all the inactive permits, and the permits for stone crab went from being non-fee based to feebased. The implementation of a fee-based permit resulted in inactive licenses being removed from the system. License-Permit Sales Fiscal Year SALTWATER PRODUCTS RESTRICTED SPECIES RETAIL DEALER BLUE CRAB STONE CRAB CRAWFISH/LOBSTER WHOLESALE DEALER Figure 5.8 Commercial Fishing License Types FY to The overall decline in total commercial fishing licenses is due primarily to declines in the number of saltwater product licenses issued since A major change occurred in 1995, with the banning of entangling nets in Florida waters. This removed a large number of the smaller, inshore craft from the fleet. The numbers of blue crab and stone crab 33
50 permits have also declined steadily since 1994, further reflecting the departure of the small-scale commercial fishing enterprise from the nearshore waters of Florida. Fueling part of this decline is the diminished availability of waterfront offloading facilities where harvesters can make the initial sale to a first-handler. Aquaculture Aquaculture represents an extremely diverse industry in Florida. More varieties of aquatic organisms are cultured in Florida than in any other state. The farm gate value of commercial aquaculture in Florida exhibited a general upward trend until However, year to year fluctuations reflect a changing market for Florida seafood products, as well as an industry characterized by frequent entry and exits associated with new producers and speculative investors. Operations and Workers Number of Operations Number of Workers Total Sales $120 $100 $80 $60 $40 $20 $0 Sales in $Million (2000 $) Figure 5.9 Aquaculture Operations, Workers, and Sales The number of aquaculture operations grew fairly steadily from 1989 to 1999 when it peaked at 712 firms. Since then the number of firms has declined until it reached its lowest point in 2005 with 359 firms reporting sales (figure 5.9). There were an additional 351 firms that failed to report any earnings in The number of workers in the industry trended upwards from 1991 until 2003, where it reached a peak of 2,144, but in 2005 the number of workers plummeted to 1,055. The primary explanation for the large number of idle firms and the large drop in employment in the industry is the damage caused by multiple hurricanes in 2004 and Workers include full-time workers, parttime workers, and unpaid workers. Sales also declined significantly in 2005, but not to the extent of employment. Sales rose from 1987 through 1997, where they peaked at $108.9M (figure 5.9). By 2003 sales had dropped slightly to $89.4M, before falling sharply in 2005 to $66.1M. Farm-gate sales are divided into 5 major types of aquaculture products: Ornamental Fish, Aquatic Plants, Clams and Oysters, Alligators, and Other (figure 5.10). 34
51 $60 $50 Sales in $Million $40 $30 $20 $10 $ Ornamental Fish Aquatic Plants Clams, Oysters Alligators Other Figure 5.10 Aquaculture Product Sales Ornamental fish generate the largest share of sales revenue in the industry, accounting for $29.3M or nearly half of all revenue in Ornamental fish revenue peaked in 1997 at $61.4M, and declined thereafter. The decline in ornamental fish production and sales since 1997 is associated with several factors, including an increase in the competition from imported product, a stagnating domestic market for freshwater ornamentals, and periodic reporting problems. Revenue from aquatic plants, however, has risen fairly steadily since 1987, peaking in 2001 at $20.7M and declining to $15.5M in Growth in revenue from clams and oysters, and from other aquaculture followed a similar pattern. Hard clams represent the single most important aquatic food item cultured in Florida. This industry began in the early 1990 s in the Indian River Region of Florida, but is currently centered in Levy County on the Gulf Coast. Recent declines in hard clam production are associated with fluctuating water quality conditions, seed availability, and damage associated with hurricanes. For further information about aquaculture harvests, see Appendix B Recreational Fisheries Landings Florida is a leading state in terms of marine recreational fishing participation. In terms of numbers of angler trips, Florida alone accounted for 33% of all marine angler trips taken in the United States during During that same year, Florida exceeded all other states in terms of the numbers of fish harvested and released for recreation purposes. According to National Marine Fisheries Service estimates, recreational anglers in Florida caught 180.5M fish in 2006 with a weight of over 25M pounds (figure 5.11). Between 1990 and 2006, the estimated weight of landed recreational fish increased slightly, while the number of fish caught more than doubled. 35
52 Million Pounds Million Fish Weight Number Caught Figure 5.11 Recreational Fish Landings From 1991 through 2006, the estimated total number of fish landed in Florida s recreational fishery cycled through a broad, but clearly identifiable range. The low end of the range is set at approximately 117M fish based on landings in The high end of the range is set at 186M, based on landings in Throughout the 1990 s, landings varied annually but the cycles tended to remain in the lower part of that range. In the early part of this decade, landings began to steadily increase towards the high end of that range, peaking in There is a dip in recreational landings in 2005 that coincides with a decrease in the number of recreational licenses issued. Both of these declines may be related to the unusually active hurricane season in The number of fish caught has generally increased, while the aggregate weight has been decreasing. This suggests that more, smaller fish are being landed (figure 5.12). Of the top ten types of recreational fish, the Herring (a relatively small species) catch was the fastest growing from 1990 to 2006 and represented 37% of the 2006 catch, which might explain the apparent declining average weight. Landings of other larger fish remained relatively stable during the period or declined in numbers. For further information about recreational fisheries landings, see Appendix B5. 36
53 70,000,000 60,000,000 Number of Fish 50,000,000 40,000,000 30,000,000 20,000,000 10,000, CATFISHES DOLPHINS DRUMS GRUNTS JACKS HERRINGS PORGIES SEA BASSES SNAPPERS TUNAS AND MACKERELS Figure 5.12 Top Ten Recreation Fish The top ten species of fish during the period has remained relatively stable. The numbers of Herring have increased over five times, which accounts for the greater increase in the number of fish caught compared with weight. Drum have nearly doubled while Dolphin have declined by a third. Recreational Fishing Licenses Florida s recreational fishery is one of the largest in the nation and an important component of the state s tourism industry. Nearly half the estimated recreational fishing trips in Florida are made by visitors to the state. For further information about recreational fishing license data collection, see Appendix B6. Overall, the total number of recreational saltwater fishing licenses sold has increased by 10% since 2004 (figure 5.13). Licenses Sold 1,140,000 1,115,000 1,090,000 1,065,000 1,040,000 1,015, , , , , Licenses Sold 1,021, ,339 1,091,912 1,118,753 Revenue $15,908,860 $15,834,334 $16,817,993 $18,056,772 Year 18,500,000 18,000,000 17,500,000 17,000,000 16,500,000 16,000,000 15,500,000 15,000,000 License Revenue Figure 5.13 Saltwater Fishing Licenses Sold
54 Table 5.4 Recreational License Sales License Sales License Group Boat-Licenses 5,507 5,617 6,190 7,174 Individual Non-Resident 387, , , ,531 Individual Resident 628, , , ,985 Other Licenses Total 1,021, ,339 1,091,912 1,109,073 License Revenues (Nominal $) License Group Boat-Licenses $44,000 $41,200 $46,400 $64,400 Individual Non-Resident $4,739,275 $4,528,673 $4,622,991 $5,329,028 Individual Resident $10,091,885 $10,245,935 $11,130,822 $11,595,010 Other Licenses $18,982 $10,926 $4,630 $17,182 Total $14,894,142 $14,826,734 $15,804,843 $17,005,620 SOURCE: Office of Licensing and Permitting Florida Fish and Wildlife Conservation Commission Monroe and Lee counties account for the most sales with 8% and 6% of all 2007 sales, respectively. Pinellas, Dade, Collier, Bay, and Brevard counties each accounted just over 4% of statewide sales in For a complete list of 2007 county license sales, see Appendix B6. As shown in table 5.4, Florida consistently attracts a large number of out-of-state anglers. These non-resident anglers contribute to a growing economic impact from marine recreational fishing. During 2007, 33% of the total marine recreational license sales were to non-residents. Permits Sold 800, , , , $14,000,000 $12,000,000 $10,000,000 $8,000,000 $6,000,000 $4,000,000 $2,000,000 $0 Revenue (Nominal) Individual Non-Resident 387, , , ,531 Individual Resident 628, , , ,985 Non-Resident Revenue $4,739,275 $4,528,673 $4,622,991 $5,329,028 Resident Revenue $10,091,885 $10,245,935 $11,130,822 $11,595,010 Figure 5.14 Individual Recreational Fishing Licenses, Resident and Non-Resident
55 The Value of Recreational Fishing Florida is ranked as the most popular recreational fishing state in a recent report produced for the American Sportfishing Association 9. Saltwater anglers in Florida number over 2M, 23.5% of the U.S. total (table 5.5) and generate nearly $3B in expenditures and retail sales, 27% of the U.S. total. Nearly half of the anglers are non-resident. Table 5.5 Recreational Marine Fishing Values, 2006 Saltwater Fishing U.S. Florida % of U.S. Anglers 8,528,000 2,002, % Expenditures/Retail Sales $11,051,345,543 $2,997,500, % Total Multiplier Effect (Economic Output) $30,327,313,593 $5,123,992, % Salaries, Wages and Business Earnings $9,407,680,614 $1,568,389, % Jobs 263,898 51, % Federal Tax Revenues $378,902,841 State and Local Tax Revenues $311,265,319 Note: Values are nominal 5.4 Imports and Exports Imports Overall the value of imported seafood has risen steadily since In 1990 the value of imports was $772M. By 2007, the value of imported seafood was $1.8B (figure 5.15). The steady upward trend in seafood imports results from the overall increase in domestic demand for all types of seafood products, as well as the domestic seafood harvesting sector s inability to produce enough seafood from domestic stocks. Million Kilos $2,000 $1,800 $1,600 $1,400 $1,200 $1,000 $800 $600 $400 $200 $0 $Million (2000 $) Weight Value Figure 5.15 Annual Imports of Seafood Historically, Florida has imported more finfish, measured by weight, than it has invertebrates such as shrimp, crab and squid. Since 1999, however, that difference has 9 Southwick Associates. Sportfishing In America: An Economic Engine and Conservation Powerhouse,
56 grown by an order of magnitude such that Florida now imports twice as much finfish as shellfish on a weight basis. Because of that large increase in imports of finfish, the value of imported finfish, which was historically lower than invertebrates, actually surpassed the value of imported invertebrates in In 1990, the value of imported invertebrates was almost double the value of imported finfish, $278M versus $494M (figure 5.16). By 2007, the value of imported finfish had risen to $1.1B, while imports of invertebrates had stabilized at $686M. Million Kilos $1,200 $1,000 $800 $600 $400 $200 $Million (2000 $) $0 Finfish Invertebrates Finfish Value Invertebrates Value Figure 5.16 Imports of Finfish and Shellfish Exports Overall, the real value of seafood exports rose fairly steadily from $29.4M in 1990 to $58.9M in 2000 (figure 5.17). The value of seafood exports fell sharply in the early part of this decade, but recovered strongly in 2006 and Seafood exports reached a nineyear low in 2002 with a value of $31.4M, but rose to all time highs in 2006 and 2007, with total values of $61.1M and $74.5M, respectively. Million Kilos $80 $70 $60 $50 $40 $30 $20 $10 $0 $Million (2000 $) Export Weight Export Value Figure 5.17 Seafood Exports During the first part of this decade, when the value of seafood exports was relatively low, exports were dominated by finfish. As exports of valuable invertebrates such as shrimp, crab, and mussels began to increase in 2003, the value of exports began to climb (figure 40
57 5.18). By 2007, exports of invertebrates exceeded exports of finfish in weight as well as in value, and the total value of seafood exports was increasing dramatically. Seafood exports, as well as other exports, increase during periods of a weakening U.S. dollar on the world market. Million Kilos Finfish Invertebrates Finfish Value Invertebrates Value $60 $50 $40 $30 $20 $10 $0 $Million (2000 $) Figure 5.18 Exports of Finfish and Invertebrates Re-Exports Re-exports are defined as imported seafood that is immediately exported, without processing in this country. These re-exports represent seafood products that are brought into Florida ports of entry, but do not enter into the Florida seafood market, and are instead shipped to another foreign destination. Seafood re-export information is maintained annually by the Fisheries Statistics and Economics Division of the National Marine Fisheries Service based on data from the Foreign Trade Division of the U.S. Census Bureau. For more information regarding seafood import/export data, see Appendix B7. As with imports and exports, the weight and value of re-exports are increasing (figure 5.19). Numerically, re-exports resemble imports in that the weight of finfish consistently exceeds the weight of invertebrates. On the other hand, they resemble exports in that the value of exported invertebrates frequently exceeds the value of finfish. 41
58 Kilos 3,500,000 3,000,000 2,500,000 2,000,000 1,500,000 1,000, ,000 $14 $12 $10 $8 $6 $4 $2 $Million (2000 $) $0 Re-Export Weight Re-Export Value Figure 5.19 Seafood Re-Exports After some variability in the early 1990 s, the weight of re-exports of both finfish and invertebrates increased steadily (figure 5.20). Re-exports of finfish increased from 315,000 kilos (694,000 pounds) in 1995 to 2M kilos (4.4 M pounds) in Re-exports of invertebrates increased from 243,000 kilos (536,000 pounds) in 1995 to 1.3M kilos (2.8M pounds) in Kilos 2,000,000 1,800,000 1,600,000 1,400,000 1,200,000 1,000, , , , , $Million (2000 $) Finfish Re-Exports Invertebrate Re-Exports Finfish Value Invertebrate Value Figure 5.20 Re-Exports of Finfish and Invertebrates Seafood Processors and Wholesalers Overall, there appears to be significant cyclical forces in the seafood processing industry. Employment in the industry fell in the early 1990 s, rose in the latter half of the decade, and then fell from 1999 through 2004 (figure 5.21). The total number of plants followed a similar, but less-pronounced pattern. By 2005 there were 341 plants, the lowest number since before 1990, while the number of workers was at 4712, up from its lowest level the previous year. The steady decline in the number of processing facilities reflects a greater reliance of the Florida and regional seafood market on seafood products processed in foreign facilities. 42
59 For example, the number of blue crab processing facilities in Florida has declined dramatically over the last two decades. This is in part due to a decline in the availability of domestic blue crab landings, but also is due to the increase in imported processed crab meat. Labor availability may also have played a role in the economically undiversified coastal communities in which many of these facilities were located. Seafood Plants ,000 6,000 5,000 4,000 3,000 2,000 1,000 0 Number of Workers Seafood Processing Plants Processing Employment Figure 5.21 Seafood Processing and Wholesale Plants The number of processing plants has declined faster than wholesale facilities. This has been particularly the case since 2001 (figure 5.22). As the need for processing capacity has declined, the need for wholesale storage capacity and distribution capabilities has not. Plants Workers Processing Plants Wholesale Plants Processing Workers Wholesale Workers Figure 5.22 Seafood Processing and Wholesale Plants There is a high level of variation in production in the industry, with some annual changes of 20% or more. The year 1990 had the highest level of output in both pounds and dollars with 126,000,000 pounds sold for $550.2M (figure 5.23). The last two years for which there is data, 2004 and 2005, suffered the lowest output for any year since In 2004, 62,000,000 pounds of seafood were processed at a value of $212.3M, while in 2005, 66,000,000 pounds were processed at a value of $216M. For further information on seafood processors and wholesalers see Appendix B8. 43
60 Million Pounds $Million (2000 $) Processed Seafood Weight Seafood Value Figure 5.23 Processed Seafood Weight and Value Commercial and Pleasure Water Vessel Registrations Since 2000, the DHSMV has reported the number of vessel registration transactions. The number of pleasure vessel registrations increased 11% between fiscal years and Commercial vessel registrations declined by 13% during that period (figure 5.24). The direction of these trends is consistent with recreational saltwater fishing licenses, which have been increasing, and commercial saltwater fishing licenses, which have been in decline. The steady upward trend in recreational vessel registrations mirrors the increase in Florida s coastal population, and reflects a wide interest in boating and water-related activities. For further information regarding commercial and pleasure water vessel registrations see Appendix B9. Commercial Vessels 60,000 50,000 40,000 30,000 20,000 10, , , , , , , , , , ,000 Pleasure Vessels Commercial Registrations Pleasure Registrations Figure 5.24 Total Commercial and Pleasure Registrations FY to FY
61 5.7 Conclusion There have been some major shifts in Florida s fishing industries. Commercial landings continue to decline due to receding stocks and necessary protective measures, while the seafood import-export and recreational fishing industries are growing. Commercial fish landings have declined 56% in weight and 42% in real value between 1990 and 2007 (figure 5.25). To meet increased demand, seafood imports have grown 158% in weight and 130% in value during the same period. Million Pounds ,000 1,800 1,600 1,400 1,200 1, $Million (2000 $) Commercial Landings Seafood Imports Landings Value Imports Value Figure 5.25 Commercial Fish Landings vs. Seafood Imports Commercial landings produced just 80M pounds in 2007, valued at $171M. Ornamental harvests were valued at $3.5M and have stabilized. Aquaculture value dropped to $75M in 2005, partly due to hurricane damage after producing between $80M and $110M in previous years. Seafood imports rose to $2.1B in nominal value in Exports were valued at $89M and re-exports were almost $16M. Seafood import-export, along with the weakened dollar, has also helped maintain wholesale processor companies and their 2,500 workers. Recreational fishing generates an estimated 52,000 jobs, $1.6B in salaries and earnings, and $3B in sales. Recreational fish landings have also increased to 180.5M fish in

62 Chapter 6 Marine Transportation including Ports 6.1 Introduction In the NOEP Ocean Economy data series, the Marine Transportation sector encompasses various ocean-related industries from Deep Sea Freight Transportation to Search and Navigable Equipment (reported in Florida Ocean & Coastal Economies, 2006). This chapter focuses on the Marine Cargo Transportation sector, based on information provided by the individual ports and the Florida Ports Council (FSTED, 2008). 10 Florida s geography includes roughly 1,350 miles of coastline which underlines the importance of seaport operations to Florida s economy. Its global location as the gateway to the Caribbean, Central and South America generates substantial economic benefits and creates economic opportunities throughout the state. SOURCE: Florida Ports Council website, Figure 6.1 Map of Florida s Seaports Florida s deepwater seaports handled 121M tons of cargo (table 6.7), directly generating $73B in 2007 (table 6.6), which represented a 7.6M tonnage decrease and a $1.1B value increase over International trade values for Florida including all commodities from waterborne and airborne that travel through coastal access points and over land, totaled $115B, a $5B increase in 2007 (4.7%) over the previous record of $110B in Overall, growth in Florida s ports continued to increase by $1.1B from 2006 to FY 2007, a positive change of 1.5%. In 2007, the top five counties for cargo value were Duval County Port of Jacksonville ($20.9B), Miami-Dade County Port of Miami ($20.4B), Broward County Port Everglades ($20.3B), Hillsborough County Port of Tampa ($4.2B), and Bay County Port of Panama City ($3.7B). The ports located within these counties handle some of the most lucrative cruise, container, and petroleum activities among other products and services. 10 Includes only the 14 deepwater seaports and does not include private ports because no information was available to NOEP. 46
63 The economic contributions generated by Florida ports are not only an important local, state, and national asset, but also serve to facilitate globalization. Located within 2000 miles of 22 foreign countries, Florida provides important access for products from throughout the United States for export. During the last decade, imports from Latin America and the Caribbean have been robust and consistent regardless of economic conditions. However, in 2007 waterborne imports declined 5.6% and exports increased 11.6%. The strength of the export market in Florida is exemplified by the competitive containerized cargo trade; Florida s ports are one of the few places which can balance inbound and outbound containers, a critical competitive advantage as a balance prevents a buildup in containers which can disrupt logistics planning. 6.2 National and State Comparisons In 2007, many U.S. deepwater seaports experienced declines in the amount of containers passing through (table 6.1) (FSTED, 2008). The three seaports that directly compete with Florida were exceptions with increases in port container volumes from 2006 to 2007 and they include: the Port of Savannah (20%), the Port of Houston (10%), and the Port of Hampton Roads (4%). Improving after Hurricane Katrina, the Port of New Orleans grew by 42% and surpassed the Port of Palm Beach in container shipments. Table 6.1 U.S. Port Container Volumes, 1997, 2006, and 2007 Rank 2007 Seaport % Change FY 06 to Year CAGR 1 Los Angeles 2,960,000 8,469,980 8,355, % 10.90% 2 Long Beach 3,505,000 7,289,365 7,316, % 7.60% 3 New York/New Jersey 2,457,000 5,092,806 5,299, % 8.10% 4 Savannah 735,000 2,160,168 2,604, % 13.50% 5 Oakland 1,531,000 2,391,598 2,307, % 4.50% 6 Hampton Roads 1,233,000 2,046,285 2,128, % 5.90% 7 Seattle 1,476,000 1,987,360 1,973, % 2.90% 8 Tacoma 1,158,000 2,067,186 1,924, % 5.20% 9 Houston 934,000 1,606,786 1,768, % 6.60% 10 Charleston 1,218,000 1,968,474 1,754, % 3.70% 11 Port Everglades 719, , , % 2.80% 12 Miami 761, , , % 1.50% 13 Jacksonville 675, , , % 0.50% 14 Baltimore - 627, , % - 15 Wilmington (DE) - 262, , % - 16 Portland (OR) - 214, , % - 17 Philadelphia - 247, , % - 18 New Orleans - 175, , % - 19 Palm Beach 174, , , % 4.00% 20 Boston - 200, , % - SOURCE: AAPA seaport data and independent analysis. Referenced from FSTED, CAGR (Compounded Annual Growth Rate) is the year-over-year growth rate of an investment over a specified period of time. 47
64 Florida s three largest container ports continued managing some of the largest quantities of container shipments in the country, which include Port Everglades, the Port of Miami, and the Port of Jacksonville. Port Everglades and the Port of Palm Beach increased container movements by 9.8% and 5.5%, respectively, even considering a lower rank for the Port of Palm Beach. Some of the Florida seaports representing smaller container enterprises in Florida grew in FY 2007, including the Port of Tampa (63.5%), the Port of Pensacola (123.3%), and the Port of Fort Pierce (35.9%). All other small Florida ports experienced declines in container movements (section 6.2.2, table 6.9). Overall, the eleven ports in Florida that engage in container operations placed the state fourth in the nation for containerized cargo, following California, Washington, and New York/New Jersey (FSTED, 2008). U.S. Seaports and National Economic Impacts In 2007, United States deepwater seaports and businesses directly dependent on the nation s ports generated approximately 8 million jobs and contributed $2T to the national economy. Businesses related to managing imports and exports, ( retailers, wholesalers, manufacturers, distributors and logistics companies ) provided almost 7 million jobs. Firms that assist with seaport goods and services provided $315B for wages and salaries, of which, $207B derived from businesses involved specifically with international waterborne commerce (Martin Associates, 2007) Atlantic and Gulf Coast Comparisons The Atlantic Coast of Florida provides a significantly higher economic contribution at $64B in trade, than the Gulf Coast, which added $9B of trade in 2007 (tables 6.2, 6.3). Although Gulf Coast trade grew in value by 26.8% in 2006, that figure dropped dramatically in 2007 to -11.2% (figure 6.2). The volume of shipments through Gulf ports decreased by -7.2%, seven points lower than the previous year. The Atlantic Coast experienced similar growth rate slowdowns but to a lesser extent. Growth among Atlantic Coast ports slowed to 1.7%, down from 14.2% in The volume shipments on Florida s Atlantic Coast fell by over 3M tons or -4.8% compared to Domestic trade remained steady on the Gulf Coast at around 30M tons, although ports on the Atlantic Coast experienced a drop to 22M tons in domestic trading, down almost seven million tons from the previous year. Table 6.2 Gulf vs. Atlantic, Trade Values Measure Gulf Coast Atlantic Coast Imports $5,805,198,203 $34,609,889,525 Exports $3,090,332,508 $29,878,053,806 Total Value 2007 $8,895,530,711 $64,487,943,331 Total Value 2006 $10,022,553,009 $63,435,106,749 % Change -11.2% 1.7% Total Change -$1,127,022,298 $1,052,836,582 SOURCE: U.S. Census Bureau, Foreign Trade Division. Note: These waterborne numbers are based on port level data using the District of Unloading methodology to obtain slightly different results than the Enterprise Florida methodology ($113.1 billion vs. $114.9 billion, which includes commodities moving over land, sea, and air). The 2006 numbers have been revised from those previously shown. Referenced from FSTED, *The cargo values indicated for these locations reflect operations other than at the specific port docks, as calculated by the federal government. 48
65 Table 6.3 Gulf vs. Atlantic, Trade Volume Measure Gulf Coast Atlantic Coast Imports 18,256,657 32,013,943 Exports 7,855,119 11,231,035 Domestic 29,826,387 22,060,018 Total Volume ,938,163 65,304,996 Total Volume ,248,199 68,592,962 % Change -7.2% -4.8% Total Change -4,310,036-3,287,966 SOURCE: Individual seaport data. Referenced from FSTED, % 50.0% 40.0% 30.0% 20.0% 10.0% 0.0% -10.0% -20.0% Atlantic Volume Gulf Volume Atlantic Value Gulf Value SOURCE: Individual seaport data and U.S. Census Bureau, Foreign Trade Division. Referenced from FSTED, Figure 6.2 Percentage Changes of Cargo Values and Volume County Comparisons (by Port) Although Florida s ports are all part of a state system, county totals are reported to provide local managers information about the engines that drive their local revenues. 11 Each of Florida s ports is located within an individual county. Those grouped by Gulf and Atlantic Coast are listed and illustrated below (table 6.4, figure 6.2). Table 6.4 Associated Counties of the Individual Florida Ports Gulf Coast Atlantic Coast Port County Port County Key West Monroe Canaveral Brevard Manatee Manatee Everglades Everglades Panama City Bay Fernandina Nassau Pensacola Escambia Fort Pierce St. Lucie St. Joe Gulf Jacksonville Duval St. Petersburg Pinellas Miami Miami/Dade Tampa Hillsborough Palm Beach Palm Beach The Port of Key West is located in the zip code of Monroe County and for this study is being included in the Gulf of Mexico region. 11 The NOEP has a policy of reporting count level data for all sectors to ensure comparability and consistency in reporting. 49
66 Florida s Waterborne Trade Values In 2007, Florida imported and exported over $73B worth of goods through its seaports to and from foreign countries (table 6.5), a 1.5% increase over Containerized cargo slightly decreased by 0.1% or $36M (FSTED, 2008). Table 6.5 Total Value and Containerized Cargo Value Change Total Seaport Total Value Containerized Cargo Value Total Value Containerized Cargo Value Value Canaveral $589,237,166 $12,303,286 $663,864,116 $21,181, % Everglades $20,298,083,644 $11,676,338,216 $17,980,876,535 $10,382,259, % Fernandina $370,042,527 $231,137,781 $398,110,141 $248,093, % Fort Pierce $120,511,831 $10,349,013 $95,074,861 $4,965, % Jacksonville $20,936,022,863 $3,335,485,797 $20,623,343,689 $3,699,869, % Key West* $6,096,391 $1,893,634 $11,723,443 $5,967, % Manatee $901,227,703 $172,065,973 $927,875,827 $234,987, % Miami $20,363,437,047 $15,670,086,974 $20,883,511,146 $16,341,782, % Palm Beach $1,810,608,253 $1,575,113,708 $1,923,266,887 $1,630,239, % Panama City $3,672,774,701 $1,164,970,230 $4,630,093,290 $1,529,645, % Pensacola $10,802,653 $183,973 $42,834,256 $8,211, % St. Petersburg $83,182,427 $872,240 $107,934 $43, % Tampa $4,221,446,836 $494,650,356 $4,111,830,860 $274,064, % Total $73,383,474,042 $34,345,451,181 $72,292,512,985 $34,381,311, % SOURCE: U.S. Census Bureau, Foreign Trade Division. Note: These waterborne numbers are based on port level data using the District of Unloading methodology to obtain slightly different results than the Enterprise Florida methodology ($113.1 billion vs. $114.9 billion, which includes commodities moving over land, sea, and air). The 2006 numbers have been revised from those previously shown. Referenced from FSTED, *The cargo values indicated for these locations reflect operations other than at the specific port docks, as calculated by the federal government. Table 6.6 presents the value of Florida s waterborne international imports and exports. In 2007, Florida s seaports imported $40B (55.1%) and exported $33B (44.9%) worth of goods. Growth in Florida s waterborne exports has increased over the past two years. Florida s waterborne imports declined 5.6% to $40B in 2007, while waterborne exports increased 11.6% to $33B in Table 6.6 Dollar Value of Florida s Exports and Imports by Port, 2007 Port Imports Exports Total 2007 Total 2006 % Change Canaveral $484,279,119 $104,958,047 $589,237,166 $663,864, % Everglades $10,850,209,373 $9,447,874,271 $20,298,083,644 $17,980,876, % Fernandina $87,004,091 $283,038,436 $370,042,527 $398,110, % Fort Pierce $7,044,074 $113,467,757 $120,511,831 $95,074, % Jacksonville $11,938,334,438 $8,997,688,425 $20,936,022,863 $20,623,343, % Key West* $767,200 $5,329,191 $6,096,391 $11,723, % Manatee $766,263,313 $134,964,390 $901,227,703 $927,875, % Miami $10,677,045,463 $9,686,391,584 $20,363,437,047 $20,883,511, % Palm Beach $565,972,967 $1,244,635,286 $1,810,608,253 $1,923,266, % Panama City $3,099,999,043 $572,775,658 $3,672,774,701 $4,630,093, % Pensacola $3,554,632 $7,248,021 $10,802,653 $42,834, % 50
67 Port Imports Exports Total 2007 % Change Total St. Petersburg* $79,481,990 $3,700,437 $83,182,427 $107, % Tampa $1,855,132,025 $2,366,314,811 $4,221,446,836 $4,111,830, % Total $40,415,087,728 $32,968,386,314 $73,383,474,042 $72,292,512, % SOURCE: U.S. Census Bureau, Foreign Trade Division. Note: These waterborne numbers are based on port level data using the District of Unloading methodology to obtain slightly different results than the Enterprise Florida methodology ($113.1 billion vs. $114.9 billion, which includes commodities moving over land, sea, and air). The 2006 numbers have been revised from those previously shown. Referenced from FSTED, *The cargo values indicated for these locations reflect operations other than at the specific port docks, as calculated by the federal government. Three of Florida s ports represent 84% of the value generated by cargo shipping. The ports of Jacksonville, Miami, and Everglades almost equally shared Florida s cargo values in 2007, at approximately $20B for each port (figure 6.3). Jacksonville 28% Key West 0% Pensacola 0% Fort Pierce 0% St. Petersburg 0% Miami 28% Fernandina 1% Canaveral 1% Manatee 1% Palm Beach 2% Eve r glade s 28% Panama City 5% Tampa 6% SOURCE: U.S. Census Bureau, Foreign Trade Division. Referenced from FSTED, Figure 6.3 Distribution of Florida Seaports based on Total Value, FY 2006 Florida s Waterborne Trade Volume Florida s waterborne trade in FY 2007 declined 5.9% from 128M tons to 121M tons. According to the Florida Seaport Transportation and Economic Development Council the decline corresponds with trade decreases experienced across the nation, economic downturn, and construction industry declines (FSTED, 2008). Table 6.7 presents imports, exports, and domestic tonnage for Florida seaports in FY 2007 and FY Imports at Florida s seaports comprised 41.5% of the total 121M tons in FY 2007, which is a slight decrease from 42% in FY Florida s seaport exports comprised 15.7% of all waterborne trade in FY 2007, compared to 13.6% in FY
68 Finally, domestic cargo represented 42.8% of all waterborne trade down from 44.1% in FY Table 6.7 Florida s Total Waterborne Trade, Tons Seaport Imports Exports Domestic Total Canaveral 3,008, , ,650 3,572,206 Everglades 13,141,831 3,246,951 9,213,368 25,602,150 Fernandina 107, , ,708 Fort Pierce 61, , , ,000 Jacksonville 9,930,000 1,706,000 12,372,000 24,008,000 Manatee 7,448,910 1,368,158-8,817,068 Miami 4,373,190 3,461,942-7,835,132 Palm Beach 1,392,157 1,891,643-3,283,800 Panama City 855, , ,150 1,302,347 Pensacola 446,254 26,318 52, ,243 Tampa 9,505,649 6,129,290 29,658,566 45,293,505 FY 06/07 50,270,600 19,086,154 51,886, ,243,159 FY 05/06 54,415,945 17,586,418 56,838, ,841,161 SOURCE: Individual seaport data. Referenced from FSTED, Domestic cargo includes goods transported in the coastwise trade between two or more states or between the United States and Puerto Rico (FSTED, 2008). Liquid and dry bulk commodities include petroleum and phosphate products, sugar, aggregates, and are among typical domestic cargo. Domestic cargo fell to 52M tons in FY 2007, which represents an 8.7% decline compared to the previous year. Domestic tonnage helps to meet Florida s fuel demand and the construction industry s needs. Petroleum is a major domestic cargo good that is traded primarily through the Ports of Tampa, Everglades, and Jacksonville (figure 6.4). Tampa 38% Fort Pierce 0% Pensacola 0% Fernandina 0% Panam a City 1% Eve r glade s 22% Palm Beach 3% Canaveral 3% Jacksonville 20% Manatee 7% Miami 6% SOURCE: Individual seaport data. Referenced from FSTED, Figure 6.4 Distribution of Florida s Seaports by Tons, FY
69 Import tonnage declined by 7.6% since FY 2006, while exports increased by 8.5%, which demonstrate the changing global market and the rise and fall of individual country s currencies (FSTED, 2008). In addition, high-value exports help to balance trade of Florida s imports and exports. FY 2007 reversed the trend of increasing imports and decreasing exports from the previous year. Figure 6.5 provides the 2007 volumes of imports and exports for the individual Florida ports. 14 Millions of Tons Imports Exports 2 0 Fort Pierce Fernandina Pensacola Panama City Palm Beach Canaveral M iami M anatee Tampa Jacksonville Everglades SOURCE: Individual seaport data. Figure 6.5 Florida Ports Import vs. Export Tonnage, FY 2007 Table 6.8 depicts the different types of cargo that were carried through Florida s seaports in FY Liquid bulk, which includes mainly petroleum products, at approximately 61M tons, made up 50% of the weight transferred through the seaports, dry bulk was 32M tons (27%), general cargo 24M tons (20%), and break-bulk was 4M tons (3%) (figure 6.6). Containerized cargo is included within the general cargo category. Table 6.8 Cargo Types Carried at Florida s Seaports FY 2007 Seaport Dry Bulk Liquid Bulk Breakbulk General Cargo* Total Canaveral 1,806,341 1,251, ,694 3,572,206 Everglades 1,752,974 17,486, ,301 6,060,149 25,602,150 Fernandina , , ,708 Fort Pierce 155,000 5,000 53, , ,000 Jacksonville 6,163,000 9,983,000 1,341,000 6,521,000 24,008,000 Manatee 1,886,635 5,851,577 1,038,263 40,593 8,817,068 Miami ,835 7,788,297 7,835,132 Palm Beach 774,073 1,179, ,113 1,221,095 3,283,800 Panama City 313,764 39, , ,342 1,302,347 Pensacola 442,921 46,432 35, ,243 Tampa 19,060,630 24,854,949-1,377,926 45,293,505 Total 32,355,338 60,697,403 3,941,088 24,249, ,243,159 SOURCE: Individual seaport data. Referenced from FSTED, *Includes containerized cargo. 53
70 Dry Bulk 27% General Cargo 20% Breakbulk 3% Liquid Bulk 50% SOURCE: Individual seaport data. Referenced from FSTED, Figure 6.6 Percentages of Cargo Types at Florida Seaports, FY 2007 The Twenty-foot Equivalent Unit (or TEU) is an inexact unit of cargo capacity often used to describe the capacity of container ships and container terminals. It is based on the volume of a 20-foot long shipping container, a standard-sized metal box which can be easily transferred between different modes of transportation, such as ships, trains and trucks. In FY 2007, Florida s seaports traded 3M TEUs, a 1.4% decrease from the previous year. Table 6.9 shows the container movements in FY 2007 compared to FY Figure 6.7 shows a timeline of these movements over a ten-year period. Table 6.9 Container Movements, TEUs Seaport FY 2007 FY 2006 Canaveral 760 1,047 Everglades 948, ,030 Fernandina 32,116 37,906 Fort Pierce 15,760 11,600 Jacksonville* 710, ,239 Manatee 4,902 5,576 Miami 884, ,514 Palm Beach 257, ,000 Panama City 54,480 58,000 Pensacola Tampa 39,653 24,253 Total 2,949,546 2,991,465 SOURCE: Individual seaport data. Referenced from FSTED, * Calendar year. TEUs (Millions) /96 96/97 97/98 98/99 99/00 00/01 01/02 02/03 03/04 04/05 05/06 06/07 Fiscal Year SOURCE: Individual seaport data. Referenced from FSTED, Figure 6.7 Container Movements FY 1996-FY
71 Florida s ports vary in container handling capacity, although some ports move more tonnage, others are importing and exporting more boxes of cargo. The Port of Everglades moves almost 900,000 TEU s of cargo, the largest amount in Florida in FY Four ports comprise 95% of cargo TEU s that transport through Florida s ports (figure 6.8). Everglades 32% Pensacola 0% Canaveral 0% Manatee 0% Fort Pierce 1% Miami 30% Fernandina 1% Tampa 1% Jacksonville 24% Panam a City 2% Palm Beach 9% SOURCE: Individual seaport data. Referenced from FSTED, Figure 6.8 Distribution of Florida Seaports based on Container Movements, Capital Improvements Seaports continually need to update their capital assets in order to accommodate the changing dynamics of the shipping industry. Typical capital improvements are expensive and sometimes large-scale projects, which can include creating deeper channels, longer, stronger berths, and bigger cranes. This section examines the estimated expenditures needed to complete capital improvements per individual port. The Collective Seaport Five-Year Capital Improvement Program outlines the estimated expenses required to undertake each of Florida s seaports projected capital improvements. Table 6.10 outlines the estimated cost of capital improvements, provided by the individual seaports, and included in the most recent Collective Seaport Five-Year Capital Improvement Program. Overall, Florida s ports have determined their estimated funding for capital improvements at over $615M for FY All estimated capital improvements for the entire five-year period totals over $2B collectively for all of the ports (FSTED, 2008). The top five most expensive port improvements for FY 2008 are all estimated to range from $30M-$300M. The Port of Jacksonville comprises 49% of all estimated port capital improvements at $293M for FY 2008 and include major road and site improvements, followed by Port Everglades and Port of Tampa with 17% ($100M) and 11% ($69M) of all capital improvements, respectively (figure 6.9). 55
72 Table 6.10 Seaport Capital Improvement Needs FY 2008 FY 2012 Seaport FY 2008 FY 2009 FY 2010 FY 2011 FY 2012 Jacksonville $293,053,934 $296,770,538 $195,563,946 $161,196,500 $228,896,500 Everglades $100,169,000 $106,575,000 $47,563,000 $50,651,000 $117,012,000 Tampa $68,840,000 $108,686,925 $56,535,000 $63,582,500 $44,775,000 Canaveral $36,285,000 $25,137,000 $15,542,000 $14,031,000 $33,694,000 Miami $32,534,000 $94,149,000 $61,288,000 $53,138,000 $15,100,000 Manatee $31,500,000 $30,500,000 $39,000,000 $6,000,000 $2,000,000 Palm Beach $14,348,000 $6,250,000 $5,076,000 $5,076,000 $2,000,000 Panama City $13,000,000 $15,050,000 $2,125,000 $2,975,000 $8,300,000 Fort Pierce $11,787,043 $43,652,000 $50,000 $100,000 $100,000 Port St. Joe $6,612,000 $1,824,000 $420,000 $4,630,000 $2,000,000 Pensacola $2,655,000 $1,535,000 $1,835,000 $2,735,000 $1,150,000 Key West $1,750,000 $5,006,000 $7,100,000 $2,310,000 - St. Petersburg $1,500,000 $2,100,000 $2,250,000 $1,700,000 - Fernandina $1,305,000 $1,205,000 $4,400,000 $5,450,000 $4,060,000 Total $615,338,977 $738,440,463 $438,747,946 $373,575,000 $459,087,500 SOURCE: Information provided by seaports in January Referenced from FSTED, Tampa 11% Canaveral 6% Miami 5% Manatee 5% Palm Beach 2% Eve r glade s 17% Jacksonville 49% Panama City 2% Fort Pierce 2% Port St. Joe 1% Pensacola 0% Key We st 0% St. Petersburg 0% Fernandina 0% SOURCE: Information provided by seaports in January Referenced from FSTED, Figure 6.9 Distribution of Estimated Funding, FY Conclusion In conclusion, Florida s deepwater seaports play a vital role in the Marine Transportation sector, facilitating global trade and enhancing the economy of Florida, the U.S. and foreign countries. Overall, Florida ranks 4 th among the nation s top ports and has continued to experience positive growth over the past decade. However, the Marine 56
73 Transportation sector, along with a number of other ocean and coastal industries is not sheltered from financial volatility and a changing global market. Thus, the Marine Transportation sector has seen declines throughout the port industries as reported by the FY 2007 numbers and values. Although the volume of goods being traded has been reduced, the value of these goods appreciated illustrating the ability of Florida s trade market to adapt. In an industry that generates $2T for the national economy, Florida s economic contribution is significant in terms of its share of the market at 3.7% or $73B in FY 2008 and growth rate of 105.3% over the past decade to help sustain the jobs, wages, and income for the State of Florida and its citizens. 57
74 Chapter 7 Marine Construction Beach Nourishment Marine construction covers a variety of construction activities affecting the infrastructure of the Ocean Economy. In this chapter the focus is on dredging and beach nourishment, including a discussion of erosion issues which give rise to the need for beach nourishment. Other infrastructure issues are discussed in other sections of this report. 7.1 Dredging Operations Dredging-related activities are critical to maintain viability of the commercial and recreational use of Florida waterways and ports. Harbors, channels, rivers, and lakes are dredged periodically to remove accumulated sediment, expand channel depth, or to construct new harbor facilities (EPA 2008). The United States Army Corps of Engineers (USACE) is the major permitting authority, responsible for maintaining over 25,000 miles of navigation channels, including 400 major and minor ports nationwide (USACE 2006). USACE-permitted private operators (Contractors) complete much of the dredgingrelated work Dredging Projects in Florida by Cost and Volume Dredging activities are most often measured using one of two metrics; cost of dredging or volume dredged. The cost of dredging activities comes not only from the physical removal of the sediment, but also the transport and disposal of the dredged material. The type of site at which sediment is disposed depends upon the physical, chemical, and toxicological characteristics of the dredged material. Common disposal methods include ocean disposal 12, confined disposal facilities, or upland sediment placement. Since 1970, dredged sediments have also been utilized as materials for beneficial uses. Common beneficial uses include beach nourishment, habitat development, shoreline stabilization, and aquaculture among others. The data featured in table 7.1 represent only U.S. Army Corps of Engineers Contractor dredging-related activities for the state of Florida from While the USACE is responsible for the ocean disposal permitting, ocean disposal is only authorized for those sites designated Ocean Dredged Material Disposal Sites as selected by the Environmental Protection Agency (USACE 2006). 58
75 Table 7.1 Time Series of Contracted Dredging by the USACE in Florida Fiscal Year Volume (CY) Cost (2000 U.S.$) ,079 $ 4,561, ,317,721 $ 3,851, ,012,545 $ 24,840, ,383,234 $ 16,725, ,090,485 $ 18,807, ,311,383 $ 20,896, ,344,306 $ 15,983, ,900,256 $ 17,524, ,234,889 $ 24,007, ,742,959 $ 15,538, ,549,030 $ 40,878, ,144,253 $ 18,931, ,586 $ 4,267, ,849 $ 6,134, ,500 $ 174, ,415 $ 3,273,356 Total 77,053,490 $ 236,393,975 Figure 7.1 displays the annual cost and volume of contracted dredging from 1990 through Volume of dredged material peaked in 1998 with over $23M cubic yards removed. Since that time, dredging volumes have decreased and remained low. The highest expenditures on dredging occurred in 2000 with a value of almost $41M, despite a relatively low volume of dredged material for the same year. Overall, costs increased during the period of 1990 to 2000 and have declined sharply since. 59
76 $45,000,000 $40,000,000 $35,000,000 Volume (CY) Cost (2000 US$) 25,000,000 20,000,000 $30,000,000 Cost (2000 US$) $25,000,000 $20,000,000 $15,000,000 15,000,000 10,000,000 Volume (CY) $10,000,000 5,000,000 $5,000,000 $ Figure 7.1 Time Series of Contracted Dredging by the USACE in Florida Beach Nourishment Over 485 miles, or approximately 59% of Florida s beaches, are experiencing erosion. At present, about 387 of the state's 825 miles of sandy beaches have experienced critical erosion, a level of erosion which threatens substantial development, recreational, cultural, or environmental interests (Florida DEP, 2008). While some of this erosion can be attributed to natural forces and coastal development, most of it is caused by the building up of jetties and the construction and deepening of navigation inlets. Often, the jetties and inlet channels interrupt the natural flow of sand, causing a build-up of sand in the inlet channels on one side of the jetty and a loss of sand to the beaches on the other side of the jetty (Catanese Center-FAU, 2003). Beaches are an important source of revenue for the state. Beaches have multiple benefits including enhancing property values, protection from storm surges, providing habitat for plants and animals and providing employment, wages, and income to the state. In 2000, over 23.2 million tourists visited Florida s beaches. Total spending, including direct and indirect spending, by beach visitors was estimated at $41.6B, with $700M in sales tax revenues from direct tourist spending (Catanese Center-FAU, 2003). Beach nourishment is one method to restore beaches that have been eroded. A typical beach nourishment project includes dredging sand from offshore and then piping it onto the beach. Bulldozers are then used to move this new sand around. Florida has led the nation in terms of spending for beach nourishment activities. From Florida 60
77 spent $1.1B on beach nourishment activities. Currently local, state, and federal entities are managing over 192 miles of restored beaches in Florida (Florida DEP, 2008) Beach Nourishment Projects in Florida compared to States by Cost and Volume Florida has spent the most of any state on beach nourishment activities since 1960 and accounted for 40% of national combined total spending (figure 7.2). During this time Florida spent $1.1B followed by New Jersey ($545M) and New York ($228M). North Carolina, Virginia, and South Carolina all spent between $100M and $200M. North Carolina spent at $197M, Virginia spent $149M and South Carolina at $118M. Maryland and California, two drastically different sized states, spent $90M and $71M respectively. And, finally, Louisiana spent $50M and Georgia spent $25M. While data exists for Texas, many of the values were unable to be integrated into the database. The geographic distribution, particularly of grouped states such as North Carolina, Virginia, and South Carolina, and the size of certain states versus their respective expenditures is notable. While Florida had the strongest expenditures, the two states following were smaller northern states, and directly following New Jersey and New York were three Mid- Atlantic States. Virginia South Carolina North Carolina New York Maryland California Louisiana New Jersey Georgia Florida SOURCE: Western Carolina University PSDS beach nourishment database Figure 7.2 Top Ten Beach Nourishment States in the U.S. by Cost While Florida was the location of the most spending for beach nourishment activities, California placed the most volume of sand on its beaches (figure 7.3). From California placed 664,474,853 cubic yards, followed by Florida (223,336,719 cy). New Jersey followed Florida at 148,368,829 cubic yards, and New York at 106,214,296 cubic yards. Virginia and Louisiana placed similar amounts of sand in beach nourishment 61
78 projects, at 22,834,570 cubic yards and 16,683,975 cubic yards respectively. Georgia placed about half the amount of Louisiana, at 8,460,000 cubic yards, and Alabama cumulatively placed nearly half of this at 3,945,400 cubic yards. Massachusetts (3,650,953 cy) and New Hampshire (2,210,000 cy) were the only remaining states in the nation to place more than 1 million cubic yards of sand in beach nourishment projects. New Jersey New York Virginia Louisiana Florida Georgia Alabama Massachusetts New Hampshire California SOURCE: Western Carolina University PSDS beach nourishment database Figure 7.3 Top Ten Beach Nourishment States in the U.S. by Volume Beach Nourishment Projects in Florida by Cost and Volume In 1960, less than 300,000 cubic yards of sand were placed on Florida beaches at a cost of approximately $1.4M compared to nearly 13 million cubic yards at a cost of over $102M in In the 2005, the costliest year, 12.6M cubic yards of sand nourished Florida s coastline at $134M. The historical trend in beach nourishment projects in Florida is shown in figure
79 Volume (cubic yards) Volume (CY) Cost $1,600 $1,400 $1,200 $1,000 $800 $600 $400 $200 Cost (100,000 US$) $0 SOURCE: Western Carolina University PSDS beach nourishment database Figure 7.4 Cost and Volume of Beach Nourishment Projects in Florida Beach Nourishment Projects within Florida s Counties by Volume The Atlantic Coast of Florida is the location for the largest number of beach nourishment projects. Although the Atlantic Coast makes up only 38% of the shoreline, 59% of the sand from these projects is in Atlantic Coast counties, while 41% of the volume of sand is from the Gulf Coast. Table 7.2 highlights the volume of sand associated with individual counties from each coastline. Some key counties, particularly along the Atlantic Coast, are Duval, Brevard, Indian River, Palm Beach, and Miami-Dade Counties. In the Gulf region, Escambia, Bay, Pinellas, and Sarasota are notable counties. Table 7.2 Volume of Beach Nourishment Projects by County GULF COAST ATLANTIC COAST County Volume (cy) County Volume (cy) Escambia 19,738,897 Nassau 6,768,235 Santa Rosa 75,300 Duval 12,241,000 Okaloosa 433,000 St. Johns 7,930,000 Walton 0 Flagler 0 Bay 13,865,240 Volusia 2,374,900 Gulf 1,332,000 Brevard 12,607,900 Franklin 138,000 Indian River 2,235,342 Wakulla 0 St. Lucie 4,866,940 Jefferson 0 Martin 3,919,576 Taylor 0 Palm Beach 49,343,405 Dixie 0 Broward 9,133,000 Levy 0 Miami-Dade 21,054,590 Citrus 0 Total 132,474,888 Hernando 0 63
80 GULF COAST County Volume (cy) Pasco 0 Hillsborough 0 Pinellas 15,884,094 Manatee 8,950,000 Sarasota 12,067,114 Charlotte 819,151 Lee 10,754,536 Collier 6,768,499 Monroe 66,000 Total 90,891,831 SOURCE: Western Carolina University PSDS beach nourishment database Duval and Brevard County each accounted for approximately 10% of the volume of sand placed along the Atlantic coastline from 1944 through Palm Beach and Miami Dade Counties made up the two largest contributors in the state. Palm Beach County made up 22% of state sand volume and Miami-Dade County contributed 9% of total sand volume. Along the Gulf Coast, the largest contributing county was Pinellas, a port county with 7% of Florida s overall nourishment volume. Following Pinellas was Escambia County along the panhandle and bordering the Western edge of Florida. Escambia County contributed to 22% of the Gulf region s volume in cubic yards of sand used in beach nourishment, and 9% of Florida sand placement. Bay County made up 15% of volume on the Gulf Coast, and 6% of volume in Florida as a whole. Sarasota County, located just one county south of Pinellas County, made up 5% of total volume in Florida from 1944 through Funding for Beach Nourishment Funding for beach nourishment activities in Florida comes from the Federal government, Emergency funds, State/Local funds, Local/Private sources, Non-federal sources, and from a Null category, which means there is no indication of where the data came from, or no available information for the project. Overall the Federal government has placed the most volume of sand on Florida s beaches and spent the most money Sources of Funding The total volume of sand placed on Florida s beaches from 1960 to 2005 was 200M cubic yards at a cost of $817.2M (see table 7.3). During this time the Federal government placed the most volume (72%) and spent the most money (87%) on beach nourishment activities, followed by State/Local agencies placing 14% of total volume on Florida s beaches and spending 7% of the total cost. Though Local/Private and Emergency sources do not contribute a significant amount of funding, these are lower bound estimates because not all activities have values associated with them. 64
81 Table 7.3 Funding Sources for Total Volume and Cost of Beach Nourishment Funding Source Volume % Volume Cost % Cost Local/Private 2,120, % $ 5,048, % State/Local 28,919, % $ 57,753, % Federal 144,599, % $ 709,763, % Emergency , % $ 726, % Null/Other 23,532, % $ 43,893, % Total 199,527, % $ 817,186, % SOURCE: Western Carolina University PSDS beach nourishment database Figure 7.5 shows the break down by funding source of cost and volume placed for beach nourishment activities. The Federal government spent more money and placed more volume than all of the other sources combined. Null Emergency % Cost % Volume Federal Non-federal State/Local Local/Private 0% 10% 20% 30% 40% 50% 60% 70% 80% Percent of Program Funded SOURCE: Western Carolina University PSDS beach nourishment database Figure 7.5 Funding Sources for Total Volume and Cost of Beach Nourishment Federal Funding Types by Volume Because the Federal government places the most volume and incurs the greatest cost for beach nourishment activities, this section determines where that money is being allocated by volume. The majority of the volume has gone towards Storm and Erosion and Navigation activities, with a combined contribution of 75% (table 7.4). Null was the third highest for volume with 15% of total volume placed. 13 The Emergency category in Table 7.3 and Figure 7.5 addresses the source where funding came from, while the Emergency category in Table 7.4 addresses what type of activity the Federal government s funding is going towards. As such, the values for the Emergency category in Table 7.4 can be seen within the Federal values of Table 7.3 and Figure
82 Table 7.4 Breakdown of Federal Funding Type for Total Volume Funding Type Volume % Volume FEMA Reimbursement 105, % Minerals Management Service 1,500, % Emergency 14 12,143, % Null/Other 22,996, % Navigation 37,074, % Storm and Erosion 75,011, % Total 148,829, % SOURCE: Western Carolina University PSDS beach nourishment database DEP Regional Funding The total number of miles of eroded beach has increased by 104 miles since 1989, from 332 miles in 1989 to over 435 miles in In 1989, 218 miles of beach were critically eroded and in 2003, approximately 333 miles were designated as critically eroded. Such erosion threatens private and public development and infrastructure and significant cultural and environmental resources (Schmidt & Woodruff, 1999). Of the critically eroded shoreline in the state, just over 161 miles are being managed by the state (Catanese Center-FAU, 2003). Table 7.5 shows the different regions managed by Florida s Department of Environmental Protection (DEP), including the miles of beach that are critically eroded and percent that is managed by the DEP. The Southwest Gulf is experiencing the most erosion with 91 miles of its beaches critically eroded. This is followed by the Southeast Atlantic (69 miles), the Panhandle Gulf (62 miles), and the Central Atlantic (55.8 miles). Monroe County, which makes up the Florida Keys, contains 7.7 miles of eroded beaches. The Southeast Atlantic has the highest percentage of beaches that are managed with 62%, followed by the Southwest Gulf (51%), the Central Atlantic (49%) and the Northeast Atlantic (38%). Table 7.5 Department of Environmental Protection Regional Erosion, 2003 DEP Region Critically Eroded Beaches Percent Managed Northeast Atlantic 45.7 miles 38.0% Central Atlantic 55.8 miles 49.0% Southeast Atlantic 69.0 miles 62.0% Florida Keys 7.7 miles 8.0% Panhandle Gulf 62.0 miles 29.0% Big Bend Gulf 1.7 miles 0% Southwest Gulf 91.0 miles 51.0% SOURCE: Catanese Center for Urban and Environmental Solutions at Florida Atlantic University 2003 Table 7.6 lists the counties in each DEP region. 14 The Emergency category in Table 7.3 and Figure 7.5 addresses the source where funding came from, while the Emergency category in Table 7.4 addresses what type of activity the Federal government s funding is going towards. As such, the values for the Emergency category in Table 7.4 can be seen within the Federal values of Table 7.3 and Figure

83 Table 7.6 Counties in Department of Environmental Protection Regions for Reference DEP Regions Northeast Atlantic Central Atlantic Southeast Atlantic Florida Keys Panhandle Gulf Duval Brevard Broward Monroe Gulf Counties Flagler Martin Miami-Dade Bay in the Nassau St. Lucie/ Palm Beach Escambia Region St. Johns Indian Franklin Volusia River Okaloosa Walton Southwest Gulf Charlotte Collier Lee Manatee Pinellas Sarasota SOURCE: Catanese Center for Urban and Environmental Solutions at Florida Atlantic University 2003 Figure 7.6 shows the sources of government funding in nominal values for beaches from During this time a total of 91 beach projects were completed or underway. From , about 55 miles of Florida s beaches were restored or nourished. In 2002, 27 miles of Florida s beaches were restored or nourished (Catanese Center-FAU, 2003). SOURCE: Catanese Center for Urban and Environmental Solutions at Florida Atlantic University 2003 Note: Nominal values Figure 7.6 Main Sources of Funding for Beach Nourishment Figure 7.7 breaks down the government funding totals by region from The Southwest Gulf received the largest share of Federal funding, while the Southeast Atlantic Coast received the largest share of both Local and State funding. The Northeast Atlantic Coast, the Panhandle Gulf and the Florida Keys received much less finding in comparison to the other regions. 67

84 Source: Catanese Center for Urban and Environmental Solutions at Florida Atlantic University 2003 Note: Nominal values Figure 7.7 Regional Funding for Beach Nourishment Projects Additional Information: Beach Erosion Erosion along Florida s beaches is a major factor contributing to the need for beach nourishment projects. While construction projects and maintenance of ports, harbors, jetties, and other infrastructure may require beach nourishment, the main cause for nourishment projects is the ever-present threat of erosion of Florida s valuable coastline. Hurricanes and tropical storms can contribute significantly to the erosion of beaches, and especially to those segments of shoreline already experiencing extreme rates of sediment loss. The 2004 and 2005 Hurricane seasons alone tracked five hurricanes and tropical storms (Charley, Dennis, Frances, Jeanne, and Wilma) that passed through critical erosion areas along Florida s coastline. In addition, Hurricane Frances passed a second and third time through two non-critically eroded zones, causing extensive erosion in these otherwise moderately healthy areas. Figure 7.8 shows Florida s 2005 Critical Erosion areas as classified by the State DEP Strategic Beach Management Plan. 68
 is an essential element of Florida's coastal management program (CCCL, 2008).")
85 SOURCE: Florida State Department of Environmental Protection Strategic Beach Management Plan Figure 7.8 Map of Critical Erosion Areas in Florida The Coastal Construction Control Line Program (CCCL) is an essential element of Florida's coastal management program (CCCL, 2008). The CCCL was initiated by the Florida legislature to protect coastal areas from poorly designed and improperly sited structures which can destroy or destabilize sensitive beach and dune areas. By adopting the CCCL, specific design and siting criteria are established for construction and other related activities taking place in these sensitive areas. CCCL standards can be more stringent than those in the rest of the coastal building zone because of the higher likelihood of damage to seaward areas during storm events. Figure 7.9 diagrams the CCCL as administered by the Florida Department of Environmental Protection. Notice that there is significant overlap between the critical erosion areas and the CCCL, showing that they both cover the same areas. 69
86 SOURCE: Florida State Department of Environmental Protection Figure 7.9 Map of the Florida State Coastal Construction Control Line 7.3 Conclusion While some of the built infrastructure of Florida s coast is discussed in other sections of this report, this chapter has highlighted the use of both dredging and beach nourishment operations to maintain and improve the vital coastline of the state. Dredging projects, permitted mostly through the U.S. Army Corps of Engineers (USACE), are typically carried out by private operators, or contractors. U.S. Army Corps of Engineers Contractor activities dredged over 77M cubic yards of material out of Florida s harbors, rivers, lakes, and channels from , at a cost of $236M. While disposal of dredged material varies, beneficial uses of clean dredge spoils for beach nourishment projects have been occurring since Erosion along Florida s coastline is also a pressing issue: 59% of Florida s beaches are experiencing erosion, and 387 of the state s 825 miles of coastline are experiencing critical erosion which threatens substantial development, recreational, cultural, or environmental assets. This may explain why from Florida had the largest expenditures in the nation for overall cost of beach nourishment projects, with 40% of national costs totaling $1.1B. Florida ranked second nationally in volume of sand nourished beaches, at 223M cubic yards from The majority of activity is on 70
87 the Atlantic Coast with 59% of the sand placement from these projects, an area which makes up only 38% of the total U.S. coastline. The Federal government provided the majority of funds for beach nourishment activity, contributing $710M, or 87%, of total funds awarded from The remainder of funds is provided by local, private, state, and emergency sources. The majority of the federal funds go towards storm and erosion projects, which are over 50% of all activities. This is explainable in view of the amount of Florida s beaches that are critically eroded, and the high number and intensity of storms which degrade Florida s shorelines even further. Considering that total spending by beach visitors was estimated at $41.6B in 2003, the money spent on beach nourishment activities is a necessary expense to sustain the massive tourism industry within Florida which derives much of its revenue from beaches. 71
88 Chapter 8 Coastal Tourism and Recreation The Cruise Industry 8.1 Introduction to Florida s Cruise Industry Tourism & Recreation is the largest sector in Florida s Ocean Economy and significantly impacts the overall national economy. The sector includes the full range of tourism, leisure, and recreational activities that take place on coastal waters and in coastal areas. This chapter provides a discrete analysis of the cruise ship industry, since its vast economic influence warrants a separate discussion. The cruise ship industry is primarily measured by U.S. statistical codes in the transportation sector, but since tourism is the underlying motive for those taking cruises and many of the impacts are on the tourism sector, it is appropriate to place it in the Tourism and Recreation sector. The reader can refer to the Phase I report for further details regarding the other Florida Ocean Tourism & Recreation industries, which include Amusement and Recreation Services, Boat Dealers, Eating & Drinking Places, Hotels & Lodging Places, Marinas, Recreational Vehicle Parks & Campsites, Scenic Water Tours, Sporting Goods Retailers, and Zoos, Aquaria. Table 8.1 provides a snapshot of the other Tourism & Recreation industries and the associated economic outputs in Table 8.1 Florida Ocean Tourism & Recreation Industries - Excluding Cruise Line, 2004 Industry Employment Wages GDP Amusement and Recreation Services 5,487 $113,852,302 $1,057,498,800 Boat Dealers 4,196 $153,871,721 $328,553,700 Eating & Drinking Places 177,029 $2,637,139,074 $4,835,594,300 Hotels & Lodging Places 68,387 $1,573,117,698 $4,065,781,100 Marinas 3,508 $95,252,352 $219,512,200 Recreational Vehicle Parks & Campsites 1,013 $20,162,396 $52,110,500 Scenic Water Tours 1,414 $31,373,626 $58,059,900 Sporting Goods Retailers 606 $19,707,476 $59,637,100 Zoos, Aquaria 1,002 $24,440,891 $44,418,600 Total 262,643 $4,668,917,536 $10,721,166,200 SOURCE: National Ocean Economics Program 8.2 Overview of Florida s Cruise Economy Florida is an important national and world center for the cruise ship industry with a significant proportion of embarkations occurring from Florida ports. Direct expenditures by cruise lines in Florida for 2006 resulted in 125,104 jobs and almost $6B in income for Florida s economy. The same year, the industry served over 14.2M passengers from Florida ports. However, there was a small decrease in passengers from FY2006 to FY2007, when the number of passengers slightly decreased to 14.1M. Yet, over the ten year period from 1997 to 2007, the total number of embarkations and disembarkations increased by 42.8% from 8M to 14M (FSTED, 2008). Multi-day cruise passengers constitute the staple of the Florida cruise industry. Florida s ports account for nearly 56% of all cruise embarkations nationally, handling more than 72
.")
89 5M embarkations in The volume of passenger embarkations has continued to increase even though Florida s overall share has declined because of growth in other areas. The state holds the largest share, 25%, of all resident passengers nationwide, over 2M passengers. The number of Florida s cruise passengers rose 35% from 2000 to 2006 (CLIA, 2007). Seven seaports in Florida engage in active cruise operations (see figure 8.1). These include ports Canaveral, Everglades, Jacksonville, Miami, and Tampa, all of which are ports of embarkation (or cruise origination). Also noteworthy are ports in Key West and Palm Beach, which rank among Florida s top tourist destination ports. For descriptions of individual Florida cruise ports, refer to Appendix C1. Florida also serves as a commercial hub for most of the cruise lines, housing their corporate and/or administrative offices. Figure 8.1 Map of Florida s Cruise Ports Growth in the cruise industry in Florida is expected to continue, driven by a new generation of cruise ships, including super mega ships. At least 34 new cruise ships are projected, with an additional 82,729 berths in the future, accounting for two-thirds of additions to the North American fleet. The arrival of larger cruise ships will require Florida s ports to adapt capital facilities to accommodate the new generation of larger ships. 73
90 National Comparisons of the Cruise Tourism Industry Florida overwhelmingly leads the nation in Cruise industry statistics, including being the home of the three largest cruise ports. Over 9M cruise passengers embarked on cruises from U.S. ports in The top three Florida ports accounted for over 4M passengers or almost 50% of the U.S. total cruise embarkations (table 8.2). Together, Florida s ports account for 56% of all embarkations in the United States (CLIA, 2007). For a comprehensive list of global embarkations see Appendix C2. Table 8.2 Embarkations by Port Port Change 04'-06' % Change 04'-06' Miami 1,682,000 1,771,000 1,890, , % Port Canaveral 1,220,000 1,234,000 1,396, , % Port Everglades 1,324,000 1,283,000 1,145, , % Galveston 435, , ,000 86, % Los Angeles 470,000 61, , , % New York 547, , , , % Tampa 385, , ,000 49, % Long Beach 367, , ,000 15, % Seattle 285, , ,000 36, % Honolulu 171, , ,000 82, % All Other Ports 1,145,000 1,476,000 1,299, , % United States 8,100,000 8,612,000 9,001, , % SOURCE: Business Research and Economic Advisors Florida s cruise industry experienced slight growth for port embarkations, based on the top three cruise ports during the period from , (table 8.2). Port Everglades skewed the overall amount of change with negative growth. The decline for Port Everglades is attributed to various impacts including: Hurricane Wilma, less demand for day-cruises, competition from new gambling venues, and a shift toward European cruises rather than Caribbean (Florida, 2008) Thousands Miami Port Canaveral Port Everglades Galveston Los Angeles New York Tampa Long Beach Seattle Honolulu All Other Ports SOURCE: Business Research and Economic Advisors Figure 8.2 Embarkations by Port
91 8.4 State Economic Impacts of the Cruise Industry Given the proximity for Florida residents to cruise homeports in Florida and along the Gulf Coast and cruise destinations, the state leads the nation in resident cruise passengers with over 2M Florida resident passengers, 25% of all U.S. resident cruise passengers (table 8.3). However, with more than twice as many embarkations as resident passengers, the cruise industry in Florida is clearly a net generator of visitor activity in the state (Business, 2007). Table 8.3 Florida's Share of U.S. Cruise Industry, 2006 Economic Impact Category Activity Levels in Florida Florida s Percentage Share of Cruise Industry s U.S. Impact Passenger Embarkations 5,018, % Resident Cruise Passengers 2,279, % Expenditures (Millions) $5, % Total Employment 125, % Total Wages (Millions) $5, % Cruise Line Direct Employment 14, % SOURCE: Business Research and Economic Advisors Overall, direct cruise line employment in Florida generated about 14,000 jobs or approximately 40% of the total cruise industry employment for the United States (figure 8.3). Florida s share of the U.S. domestic cruise industry employment has declined as the cruise ship industry has grown in other parts of the country, notably Hawaii. Cruise Line Direct Employment 40% Total Wages Total Employment Expenditures 34% 33% 36% Resident Cruise Passengers 25% Passenger Embarkations 56% 0% 10% 20% 30% 40% 50% 60% SOURCE: Business Research and Economic Advisors Figure 8.3 Florida's Percentage Share of U.S. Cruise Industry, 2006 As a result of the cruise industry, Florida businesses received almost $6B in 2006, or onethird of the direct expenditures generated by the cruise industry in the United States that year. This represented nearly a 7% increase over Due to the scale of the industry, cruise ship related expenditures in Florida impacted just about all segments of the economy (table 8.4). These included tourism-related businesses, such as travel agencies, airlines, hotels, restaurants and providers of ground transportation, which were the main 75
92 beneficiaries of the cruise industry. These industries received over $2B, or 41% of the industry s direct expenditures in Florida. Another $821M, or 17% of the total, was spent with businesses in five business segments: food processors and chemical manufacturers (including, paints, pharmaceuticals and cleaning supplies); advertising agencies, management and technical consulting companies and manpower agencies. Table 8.4 Total Economic Impacts of Cruise Purchasing on Business Sectors in Florida, 2006 Direct Purchases Total Total Wages Sector (thousands) Employment (thousands) Agriculture, Mining, Utilities & Construction $15,587 1,494 $61,975 Manufacturing $1,325,612 8,374 $414,822 Nondurable Goods $651,595 5,281 $268,076 Durable Goods $674,017 3,093 $146,746 Wholesale & Retail Trade $265,420 13,340 $539,752 Transportation $2,359,059 29,216 $1,389,607 Information Services $27,052 1,089 $66,227 Finance, Insurance, Real Estate & Leasing $40,047 5,242 $294,076 Services & Government $1,813,846 66,349 $2,256,086 Professional, Scientific & Technical Services $284,074 7,499 $574,043 Administrative & Waste Management Services $746,601 23,819 $678,601 Health, Education & Social Services $74,083 12,240 $479,345 Other Services & Government $709,088 22,791 $524,097 Total $5,846, ,104 $5,022,545 SOURCE: Business Research and Economic Advisors. The economic impact of the cruise industry in terms of direct spending on Florida increased by 40% since 2000 to nearly $6B in 2006 (table 8.5). Expenditures generated total economic impacts of 125,104 jobs and $5B in income throughout the Florida economy during 2006 (table 8.6). Since the previous year, Florida s total employment impacts declined by 2.3% as a result of the shift in the mix of direct spending and increases in labor productivity (figure 8.4). However, the total income impacts increased by 5% as labor productivity gains resulted in increased income. These impacts accounted for 36% of the national employment impact and 34% of the national income impact within the cruise industry. 76
93 $7, ,000 (Millions US$) $6,000 $5,000 $4,000 $3,000 $2,000 $1,000 $0 Total Income Direct Spending Total Employment , ,000 90,000 70,000 50,000 # of Employees SOURCE: Business Research and Economic Advisors Figure 8.4 Employment, Income, and Direct Spending: Florida Cruise Industry Table 8.5 Economic Impact of Cruise Industry on Direct Spending in Florida Economic Impact of the Cruise Industry Direct Spending on Florida Year Direct Spending ($ Millions) Direct Spending % Share of U.S $3, % 2001 $4, % 2002 $4, % 2003 $4, % 2004 $5, % 2005 $5, % 2006 $5, % SOURCE: Business Research and Economic Advisors Table 8.6 Economic Impact of Cruise Industry on Florida Spending Economic Impacts of the Cruise Industry on Florida Employment, Year Total Employment Employment % Share of U.S. Total Income ($ Millions) Income % Share of U.S , % $3, % , % $3, % , % $4, % , % $4, % , % $4, % , % $4, % , % $5, % SOURCE: Business Research and Economic Advisors 77
94 8.5 Analysis of Individual Florida Cruise Ports Florida s share of the world cruise market was 42% in 2006.The state s share has fallen due to increased cruising from other U.S. ports outside Florida and those outside North America. The United States has maintained over three-fifths of the world cruise market, up to 75% in 2006, or 9M passengers, while the rest of the world has less than one-fifth of the cruise business. In terms of total number of passengers, Florida s cruising rose 149% from and 35% from Passengers (Millions) Florida Total U.S. World SOURCE: Business Research and Economic Advisors Figure 8.5 Total Global Embarkations % 70% % of Global Embarkations 60% 50% 40% 30% 20% 10% 0% Florida Total U.S. World SOURCE: Business Research and Economic Advisors Figure 8.6 Percent of Global Cruise Embarkations, 2006 Three of Florida s cruise ports the Port of Miami and Port Everglades in the south and Port Canaveral near Orlando, comprise nearly one-third of the global cruise market. For a profile of South Florida s cruise port industry, see Appendix C3. The ports of 78
95 Jacksonville and Tampa also contribute to Florida s cruise industry on a smaller scale for a total of about half a million passengers annually, or 12% of the Florida market and 5% of the world cruising market (CLIA, 2007) Embarkations (Millions) Miami Port Canaveral Port Everglades Tampa SOURCE: Business Research and Economic Advisors Figure 8.7 Total Embarkations from Florida Ports % 60% % Florida Embarkations 50% 40% 30% 20% 10% 0% Miami Port Canaveral Port Everglades Tampa SOURCE: Business Research and Economic Advisors Figure 8.8 Percentage Share of Florida Cruise Embarkations by Port The ports of Miami, Everglades, and Canaveral led growth in Florida s cruise industry, with Everglades growing at 44% from , followed by Canaveral at 38%, and Miami relatively unchanged at 12%. The Ports of Jacksonville and Tampa are also growing as cruise ports, with the Port of Tampa showing the most growth, at 99% from 15 Port of Jacksonville began handling cruises in 2004 and totaled 130,000 cruises in Port of Palm Beach only has one-day cruises, so is not included here, although it does handle about half a million one-day cruises per year. 79
96 reflecting the emergence of Tampa as a location for cruise operations. The state s cruising increased 35% during this same time period (BERA, 2007). Port of Miami 12% Port Canaveral 38% Everglades 44% Port of Tampa 99% Florida 35% 0% 20% 40% 60% 80% 100% % Growth SOURCE: Business Research and Economic Advisors Figure 8.9 Percentage Growth in Cruising at Florida Ports Cruise operations at Florida seaports have grown from a total of over 8M to 14M passengers (including embarkations and disembarkations) 16 during FY to This growth is primarily due to the increase in multi-day cruises from 6M in FY to 11.2M in FY One-day cruises increased from 2.5M to 2.9M over the ten-year period, remaining relatively unchanged compared to multi-day cruises that have nearly doubled over the same timeframe (Florida, 2008). Table 8.7 Cruise Operations, Embarkations and Disembarkations FY 2005 FY 2007 County Seaport One-Day Multi-Day FY 04/05 FY 05/06 Total 06/07 Brevard Canaveral 1,612,526 2,663,396 4,388,851 4,542,056 4,275,922 Broward Everglades 719,888 2,690,058 3,801,464 3,239,154 3,409,546 Nassau Fernandina Duval Jacksonville 0 259, , , ,816 Monroe Key West ,000,000 1,012,978 1,022,500 1,000,000 Miami-Dade Miami 0 3,787,410 3,605,201 3,731,457 3,787,410 Palm Beach Palm Beach 566, , , ,408 Pinellas St. Petersburg , Hillsborough Tampa 0 781, , , ,861 Total 2,898,222 11,182,541 14,528,756 14,233,198 14,081,363 SOURCE: 2008 Florida Ports Council 16 The cruise ports count embarkations and disembarkations, unlike the data presented above by the Cruise Lines Industry Association, which records only embarkations. 17 Key West is a destination port, not a departure port, since ships do not originate from there. Total numbers in the table differ from CLIA numbers that report only embarkations. 80
97 16 14 Cruise Passengers (Millions) FY1997 FY1998 FY1999 FY2000 FY2001 FY2002 FY2003 FY2004 FY2005 FY2006 FY2007 One-Day Multi-Day Total SOURCE: 2008 Florida Ports Council Figure 8.10 Embarkations and Disembarkations from Florida Ports by Length of Cruise 8.6 Conclusion In summary, Florida s cruise industry contributes a major portion of revenue and passengers to the overall U.S. cruise industry economy. Florida dominates the cruise industry with almost 56% of the 9 million total passengers embarking on cruises nationwide. The economic impacts of the cruise industry are also driven by Florida s residents. Of the 5 million passengers embarking on cruises from Florida ports, almost half are Florida residents contributing to the nearly $6B dollars in expenditures by the cruise industry in Florida. These economic contributions are spread over a number of different businesses such as agriculture, retail, transportation, and others, which account for over 125,000 jobs and $5M in wages. The cruise industry serves as a vital component of the Coastal Tourism and Recreation sector in Florida and the United States. 81
98 Chapter 9 Coastal Real Estate 9.1 Coastal Real Estate Values Measurement of the contribution of the ocean to the economy is most often done by examining flows of economic activity such as employment, income, cargo, passengers, and the value of output. The discussion of the Ocean Economy elsewhere in this study follows this approach. But the ocean also has a profound effect on the stock of asset value stored in real estate. Coastal and shorefront properties in Florida, as elsewhere, are in greater demand and thus of higher value than similar real estate without a shore location. This value has been changing rapidly over the last few years, although the period of rapid appreciation throughout the state has come to an end. Understanding how the value of coastal real estate is distributed across the state and how it has been changing is thus a key part of the Florida Ocean Economy. Florida is fortunate to have an excellent property records system, which permits at least a generalized analysis of property values in shoreline areas and other areas. While it is not possible to determine the contribution of the ocean to the values of individual properties using this data, it is possible to determine the aggregate property values statewide and by county and region. This section explores coastal property values throughout Florida, starting with a statewide overview and then providing additional detail for major regions and the coastal counties. For purposes of this discussion coastal property is defined as a parcel that is seaward of the nearest shore-parallel road. For most of Florida, this definition encompasses shorefront property plus one to two tiers of parcels inland from the shore-adjacent parcel. This definition permits a straightforward identification of parcels using geographic information systems applied to the Florida property tax records. See Appendix D for a discussion of the property value data system and the methods used for this analysis. Florida s 367,000 coastal properties were valued for tax purposes in 2006 at $181B, yielding $2B in property tax revenues. Coastal parcels made up 7.5% of the value of all real estate in Florida. From , the number of parcels grew by about 10%, but the value of parcels more than doubled reflecting the strong demand for coastal real estate in the early part of this decade. Overwhelmingly, Florida s coastal real estate is residential; 70% of the parcels and 80% of the value are in residential uses as classified under the State s land use classification system. Actually, when the northwestern region (with its heavy proportion of military land) is taken out, over 80% of land parcels are in residential uses. Of the residential properties, over half (60%) is in some form of collective ownership (cooperatives or condominiums). The importance of residential land use is reinforced by the fact that of commercial properties on the coast (only 4% of parcels, but 7% of value), the vast majority of commercial properties (71%) are hotels and lodging facilities. Though data from other states is lacking, few other states come close to Florida in the dominance of residential uses in its coastal property and property values. 82
99 The recent property value boom in Florida has left the impression that the entire state was undergoing a transformation. While the property value appreciation affected all regions of the state, there is a considerable amount of variation within the state. In 2007 the southeastern region accounted for the largest share of property values, which is not surprising since this region includes the major metropolitan areas of southern Florida. The southwestern region had the highest average value, but the southeastern region had the highest residential value, reflecting the strong demand for shore property in urban areas. The high values of urban coastal property are also reflected in the fact that the coastal properties of the southeast region accounted for more than half of the value of all the property taxes paid of all Florida coastal property. The value of the coastal properties in the Northwest region make up the highest percent of total value, at more than 22%; the coastal proportion of total value was lowest in the Big Bend region. But taken together, the Big Bend and Northwest regions were the hot areas in terms of coastal value growth rates over This reflects the fact that much of the rest of Florida was already substantially built out along the shoreline, and that these two Gulf Coast regions were where the high growth in property values would have proportionately larger effects. Among the coastal counties, Collier County in the Southwest region had the highest average parcel value in 2007 of $1,681,110, while Wakulla County in the Northwest had the lowest average value at $295,112. Bay (41%) and Monroe (38%) counties had the highest proportion of their property values located in the coastal area; Jefferson County in the Big Bend region had the lowest proportion (0.1%) Escambia County in the Northwest showed the greatest growth in property values at 450% over , but this was driven in large part by a particular piece of government property. That example aside, the largest coastal property value growth was in Taylor County (311%) and Flagler County (200%). The following sections of provide additional detail on property values for the state, its regions, and counties. The time period used for measuring change represented a unique period of very high property value appreciation, which has come to an end as of The important role played by shore properties in Florida s real estate values will be changing over the next 2-4 years as the effects of the boom period work themselves out. Those interested in the role of coastal property values will want to track changes closely. It is likely that coastal properties will maintain their values better than inland areas, but some areas such as those with very high average values or very fast recent appreciations may undergo more rapid depreciation even for coastal property. Statewide Overview Coastal real estate accounted for 7.5% of the total market value in Florida in 2006, up from 7.3% four years earlier in In 2007, there were 367,359 properties on Florida s Atlantic and Gulf coasts, defined to be seaward of the nearby shore parallel road. These properties had a market value of more than $181B as determined by the County Property Appraisers. These locally elected officials are charged by the state with establishing 83
100 property values as part of the process of determining property taxes paid to the state to finance public education and paid to local authorities to finance their operations and debt service. Property Appraisers establish values for all properties, whether the properties pay taxes or not. Properties are valued during the first six months of the year on the basis of their condition at the beginning of the year. 4% 4% 8% 5% 9% 70% Vacant Total Residential Total Commercial Institutional Government Miscellaneous Figure 9.1 Number of Florida Coastal Properties by Land Use Most Florida coastal properties (70%) have a residential land use. Vacant coastal properties are at 9%, and 8% are owned by government (local, state, or federal). Coastal properties that are commercial are 4%, and another 4% are institutional, not for profit enterprises such as churches and yacht clubs. Properties in a heterogeneous miscellaneous category that includes a small number of agricultural properties, dunes and submerged lands make up 5%. 7% 0% 5% 1% 5% 82% Vacant Total Residential Total Commercial Institutional Government Miscellaneous Figure 9.2 Value of Florida Coastal Properties by Land Use The dominance of residential land uses is even greater in terms of the value of Florida coastal real estate. More than 80% of Florida coastal real estate value is residential and 7% is commercial. Vacant and government-owned properties each account for 5%. Institutional and miscellaneous parcels have relatively small values. 84
101 4% 36% 60% Single Family Condominiums & Cooperatives Miscellaneous Residential Figure 9.3 Value of Florida Coastal Residential Properties, 2007 Condominiums, and to a lesser degree cooperatives which are similar to condominiums, account for 60% of Florida s residential real estate value. Most of the rest of the residential value is accounted for by single family housing units. A heterogeneous miscellaneous residential category accounts for 4% of the value. This category includes multi family properties and mobile homes. Average Value $1,000,000 $900,000 $800,000 $700,000 $600,000 $500,000 $400,000 $300,000 $200,000 $100,000 $0 Single Family Condominiums & Cooperatives Miscellaneous Residential Average Value $913,527 $427,906 $244,380 Figure 9.4 Average Value of Florida Coastal Residential Properties, 2007 In 2007, the average market value of a coastal single family home was $913,527, and the average value of a coastal condominium or cooperative was $427,
102 29% 71% Hotels Other Commercial Figure 9.5 Value of Florida Coastal Commercial Properties, 2007 More than 70% of coastal commercial property value is accounted for by hotels. Other commercial properties found on Florida s coasts include retail and office buildings, restaurants and bars. The period from was one of very rapid, indeed unprecedented changes in the value of Florida coastal property. Figure 9.6 through figure 9.8 document some of these changes. In these figures, the 2002 value is set equal to 100 on an index and subsequent years are shown as a multiple of the 2002 value Index 2002= Figure 9.6 Growth in the Number of Florida Coastal Properties Florida s coasts are largely built out. The index chart above shows each year s percentage increase relative to the number of coastal properties in It indicates that in the five year period ending in 2007, the number of Florida coastal properties increased by only 10%. This was a period when Florida s construction industry was booming. The index chart figure 9.7 shows that Florida coastal values more than doubled by 2006 before dramatically slowing in
103 Index 2002= Figure 9.7 Growth in the Value of Florida Coastal Properties Index 2002= Figure 9.8 Growth in the Average Value of Florida Coastal Properties Figure 9.8 shows that average values leveled off in 2007 after having doubled between 2002 and 2006 More than 245,000 Florida coastal properties pay property taxes in the state. Most taxes are collected by local governments such as counties, county-wide school districts, and cities. There are some regional taxing authorities, including water management districts and inland navigation districts, and there are many special taxing districts for local services, including mosquito control, health, hospitals, fire prevention. There are even special taxing districts on the coasts for inlet management and erosion control. In 2007, taxing authorities collected more than $2B ($2.04B) in property tax revenues from Florida s coastal properties. 87
104 Florida s Coastal Regions The Florida Department of Environmental Protection (FDEP) identifies four beach regions on the state s coasts: the Northeast and Southeast on the state s Atlantic Coast, the Southwest and Northwest on the state s Gulf Coast. An additional region known as the Big Bend lies where Florida s Gulf Coast turns from a northerly to a westerly direction. This is not identified as a beach region because it lacks beaches the coast is largely made up of mangroves and other natural vegetation. 88
105 SOURCE: CUES, Figure 9.9 Florida Comprehensive Recreation Planning Regions 89
106 This report uses a regional classification made up of the FDEP beach regions supplemented by the Big Bend. These regions group coastal counties that are relatively similar in their coastal activities together. For example, both the Northeast and Northwest regions have beaches that attract large numbers of visitors in the summer and relatively few in the winter. Big Bend 2% Northwest 17% Northeast 13% Southwest 21% Southeast 47% Figure 9.10 Distribution of the Number of Coastal Properties by Coastal Region, 2007 Almost half of coastal properties included in this study come from the Southeast coast of the state, the most intensively developed of the state s coastal regions. Relatively few of the properties come from the Big Bend region, reflecting its lack of coastal development. Big Bend 1% Northwest 16% Northeast 11% Southwest 27% Southeast 45% Figure 9.11 Distribution of Coastal Property Values by Coastal Region, 2007 The Southeast region has the highest value of coastal properties. Although the share of the Southwest region coastal property is only 21%, its coastal values jump to 27%, reflecting the high average value of parcels in that region relative to the other regions in the state. 90
107 Northwest Big Bend Southwest Southeast Northeast $0 $200,000 $400,000 $600,000 $800,000 $1,000,000 Northeast Southeast Southwest Big Bend Northwest Series1 $559,862 $649,703 $870,382 $338,046 $652,138 Figure 9.12 Distribution of Average Coastal Property Values by Coastal Region, 2007 The Southwest region has the highest average value of coastal properties, at $870, % 90% 80% 70% 60% 50% 40% 30% 20% 10% 0% Northeast Southeast Southwest Big Bend Northwest Residential Commercial Other Figure 9.13 Distribution of Property Values by Land Use in Coastal Regions, 2007 Residential land uses account for about 80% of total coastal value in each of the state s five coastal regions, except for the Northwest where air force and naval facilities ensure a large amount of valuable government-owned property. There is relatively little commercial value in the less urbanized Big Bend and Northwest regions of the state. 91
108 Northwest Big Bend Southwest Southeast Northeast $0 $500,000 $1,000,000 $1,500,000 $2,000,000 $2,500,000 $3,000,000 $3,500,000 $4,000,000 $4,500,000 Residential Commercial Other Figure 9.14 Average Coastal Property Values by Land Use in Coastal Regions, 2007 Although the Southwest region has the highest average value for coastal properties overall, this reflects its relatively high average residential value. The average value of coastal commercial real estate is highest in the Southeast region of the state. Average values of all coastal land uses are lowest in the Big Bend region. Northwest Big Bend Southwest Southeast Northeast Northeast Southeast Southwest Big Bend Northwest Percent Figure 9.15 Coastal Value as a Percent of Total Value in Coastal Regions, 2006 Coastal values accounted for more than 20% of total values in the Northwest region, more than twice the coastal share in the Northeast, the second highest share in the state. In the southern half of the state, the coastal share was about 8%, and it was only 2% in the Big Bend region. 92
109 Northwest Big Bend Southwest Southeast Northeast Northeast Southeast Southwest Big Bend Northwest Percent Figure 9.16 Percent Growth in Coastal Values in Coastal Regions Coastal values more than doubled in all of Florida s coastal regions between 2002 and 2007, except for the Southwest where the growth was 70%. The slower growth in the Southwest may reflect the major hurricanes of 2004 and 2005, especially the category 4 hurricane Charley which struck the center of the region in The Northwest region was also struck by a category 4 hurricane, but the point of landfall was immediately west of the western boundary of the region. $1,200 $1,000 $1,017.9 Million $ $800 $600 $400 $200 $0 $565.5 $249.9 $200.2 $6.8 Northeast Southeast Southwest Big Bend Northwest Figure 9.17 Property Tax Revenues from Coastal Parcels by Region Coastal properties in the southern half of the state pay a larger share of property taxes than do coastal properties in the northern regions, while Big Bend properties make a negligible contribution to property tax revenues. About one half the property taxes in the Southeast region are paid by coastal properties, and coastal properties account for more than one-quarter in the Southwest. The coastal properties in the state paid more than $2B in property taxes in The Southeast region paid $1.0B and the Southwest region paid more than $500M 93
110 ($565.5M). More than $200 million was paid by the Northeast Region ($249.9M) and the Northwest region ($200.2M), and the Big Bend paid $6.8M. The Northeast Florida Coastal Region The Northeast Florida coastal region consists of the five counties in the northeast corner of the state ranging southwards through Nassau, Duval, St. Johns, Flagler and Volusia counties. Nassau contains the beachfront communities of Fernandina Beach and Amelia Island. Duval is home to the large city of Jacksonville and the three beachfront communities south of the St. Johns River: Atlantic Beach, Neptune Beach and Jacksonville Beach. St Johns is home to Ponte Vedra Beach and St. Augustine Beach. Flagler County is home to Flagler Beach, and Volusia County is home to the beachfront communities of Ormond Beach, Daytona Beach and New Smyrna Beach. Jacksonville was the historic point of entry to the state in the last half of the nineteenth century and the beachfront communities in the Northeast region are among the most historic in the state. Jacksonville Beach, formerly known as Pablo Beach, was the site of Henry Flagler s only hotel to serve summer season visitors, and the firm sands of Daytona Beach attracted racing cyclists before the end of the 19 th century. As the twentieth century began, automobile drivers used the beach as a racetrack. 11% 8% 54% 15% 12% Nassau Duval St. Johns Flagler Volusia Figure 9.18 Distribution of the Number of Coastal Properties by County Northeast Region, 2007 There were 32,271 coastal properties in the northeast Florida region in 2007, with more than half the properties in Volusia County. The large number of properties in Volusia County reflected its lengthy and relatively intensely developed coastline. 94
111 13% 42% 11% 23% 11% Nassau Duval St. Johns Flagler Volusia Figure 9.19 Distribution of Coastal Property Values by County Northeast Region, 2007 The region s properties had a value of $18.1B, with 42% in Volusia County and 23% in Duval County. Volusia $441,607 Flagler $512,154 St. Johns $852,143 Duval $722,584 Nassau $659,115 $0 $200,000 $400,000 $600,000 $800,000 $1,000,000 Figure 9.20 Distribution of Average Coastal Property Values in Northeast Coastal Region, 2007 St. Johns County had the highest average value of coastal properties ($852,143) in 2007, followed by Duval and Nassau. The lowest average value was in Volusia County. 95
112 Nassau Duval St. Johns Flagler Volusia Figure 9.21 Coastal Value as a Percent of Total Value in Northeast Coastal Region, 2006 Coastal real estate accounted for the largest share of total property values in Nassau County (25%) and the smallest share in Duval County, which contains the major metropolitan area of Jacksonville inland from the county s coast. Nassau Duval St. Johns Flagler Volusia Figure 9.22 Percent Growth in Coastal Value in Northeast Coastal Region Coastal values grew most rapidly in Flagler County between 2002 and 2007, followed by Volusia County, the two southernmost counties in the region. The slowest growth in coastal value occurred in Nassau County, the northernmost county in the region. 96
113 100% 90% 80% 70% 60% 50% 40% 30% 20% 10% 0% Nassau Duval St. Johns Flagler Volusia Residential Commercial Other Figure 9.23 Distribution of Coastal Property Values by Land Use in Northeast Coastal Region, 2007 Residential land uses accounted for the largest share of the value in all five counties in the Northeast Florida coastal region. Both St. Johns and Flagler counties had a relatively large amount of government-owned property. Commercial uses were a relatively small part of total coastal values in the region. Nassau Duval St. Johns Flagler Volusia $0 $1,000,000 $2,000,000 $3,000,000 $4,000,000 $5,000,000 Residential Commercial Other Figure 9.24 Average Value of Coastal Properties by Land Use in Northeast Coastal Region, 2007 Commercial properties had much higher average values than residential and other land uses in all five counties in the region. Flagler County had the highest average commercial values, followed by St. Johns County. 97
114 $140 $120 $128.1 $100 Million $ $80 $60 $40 $20 $32.5 $22.3 $45.2 $21.8 $0 Nassau Duval St. Johns Flagler Volusia Figure 9.25 Property Tax Revenues from Coastal Parcels by County in Northeast Coastal Region, 2007 Property tax revenues received by taxing authorities from coastal real estate in the Northeast beach region ranged from about $22M in Duval and Flagler counties to $128M in Volusia County in The Southeast Florida Coastal Region The Southeast Florida coastal region consists of the eight counties in the southeast corner of the state ranging southwards through Brevard, Indian River, St. Lucie, Martin, Palm Beach, Broward, Miami-Dade and Monroe counties. Brevard contains the beachfront communities of Cape Canaveral, Cocoa Beach, Satellite Beach, Indian Harbor Beach and Melbourne Beach, as well as Patrick Air Force Base and Cape Canaveral National Seashore. Indian River County contains Wabasso, Indian River Shores and Vero Beach. St. Lucie and Martin counties contain beachfront communities on Hutchinson and Jupiter Islands. St. Lucie County also has a nuclear power plant adjacent to the beach, with another plant located in Miami-Dade County. Palm Beach County is home to beachfront communities in Juno Beach, Palm Beach, Manalapan, Briny Breezes, Gulfstream and Highland Beach. Several cities in the county have large beachfront areas including Delray Beach and Boca Raton. Several Broward County cities also have major beachfronts including Deerfield Beach, Pompano Beach, Fort Lauderdale, Hollywood and Hallandale Beach. Miami-Dade County has the large beachfront community of Miami Beach, as well as several smaller communities. Monroe County consists of Everglades National park and the remarkable archipelago known as the Florida Keys. The islands in the Keys, of course, have two coasts. 98
115 26% 6% 4%6% 1% 19% 13% 25% Brevard Indian River St. Lucie Martin Palm Beach Broward Miami-Dade Monroe Figure 9.26 Distribution of the Number of Coastal Properties by County Southeast Region, 2007 There were 30,470 coastal properties in the Southeast Florida region in 2007, with about one fourth of the properties in each of Broward and Monroe counties. The large number of properties in Monroe County reflects the bi-coastal islands in the Keys, and the large number of parcels in Broward reflects the large number of large condominium developments. 21% 3% 4%4%3% 17% 29% 19% Brevard Indian River St. Lucie Martin Palm Beach Broward Miami-Dade Monroe Figure 9.27 Distribution of Coastal Property Values by County in Southeast Region, 2007 The coastal properties had a value of $15.9B, with 29% in Palm Beach County and 21% in Monroe County. 99
116 Monroe $519,416 Miami-Dade $893,717 Broward $476,770 Palm Beach $981,690 Martin $1,391,193 St. Lucie $398,231 Indian River $758,837 Brevard $406,301 $0 $200,000 $400,000 $600,000 $800,000 $1,000,000 $1,200,000 $1,400,000 $1,600,000 Figure 9.28 Distribution of Average Coastal Property Values in Southeast Coastal Region, 2007 Martin County had the highest average value of coastal properties ($1,391,193) in 2007, followed by Palm Beach and Miami-Dade. The lowest average value was in St. Lucie County. Brevard 4.4 Indian River 13.8 St. Lucie Martin Palm Beach Broward Miami-Dade 3.8 Monroe Percent Figure 9.29 Coastal Value as Percent of Total Value in Southeast Coastal Region, 2006 Coastal real estate accounted for the largest share of total property values in Monroe County (almost 40%). It had the smallest share in Miami-Dade County, which contains the major metropolitan area of Miami inland from the county s coast. 100
117 Brevard Indian River St. Lucie Martin Palm Beach Broward Miami-Dade Monroe Percent Growth Figure 9.30 Percent Growth in Coastal Value in Southeast Coastal Region Coastal values grew most rapidly in Brevard County between 2002 and 2007, followed by Broward and Monroe counties. The slowest growth in average coastal values occurred in Martin and Palm Beach counties. 100% 90% 80% 70% 60% 50% 40% 30% 20% 10% 0% Brevard Indian River St. Lucie Martin Palm Beach Brow ard Miami-Dade Monroe Residential Commercial Other Figure 9.31 Distribution of Coastal Property Values by Land Use in Southeast Coastal Region, 2007 Residential land uses accounted for the largest share of coastal value in all eight counties in the Southeast Florida coastal region. St. Lucie, Martin and Palm Beach counties have relatively little coastal commercial development, while Broward and Miami-Dade have a relatively high commercial value. Brevard, St. Lucie and Monroe counties have relatively high government-owned coastal values. 101
118 Brevard Indian River St. Lucie Martin Palm Beach Broward Miami-Dade Monroe $0 $5,000,000 $10,000,000 $15,000,000 $20,000,000 Residential Commercial Other Figure 9.32 Average Coastal Property Values by Land Use in Southeast Coastal Region, 2007 Commercial properties had much higher average values than residential and other land uses in all eight counties in the region. Miami-Dade and Palm Beach had the highest average coastal commercial values. Average commercial values were relatively low outside the highly urbanized area of Palm Beach, Broward and Miami- Dade counties, with the exception of Martin County. $350 $300 $250 $308.3 $245.6 $247.8 Million $ $200 $150 $100 $50 $30.1 $39.2 $41.1 $26.2 $79.6 $0 Brevard Indian River St. Lucie Martin Palm Beach Broward Miami- Dade Monroe Figure 9.33 Property Tax Revenue from Coastal Parcels by County in Southeast Coastal Region, 2007 Property tax revenues received by taxing authorities from coastal real estate in the Southeast region were much higher in the highly urbanized counties of Palm Beach, Broward and Miami-Dade. One reason for this was the relatively larger amount of taxable value on the coasts of those counties. 102
119 The Southwest Florida Coastal Region The Southwest Florida coastal region consists of the seven counties in the Southwest corner of the state ranging northwards through Collier, Lee, Charlotte, Sarasota, Manatee, Hillsborough and Pinellas counties. Historically, this region developed from north (the Tampa Bay Area) to south with much of the most recent development occurring in Collier County at the southern end. Pinellas County in the north has a series of top ranked beaches; Hillsborough, the next county south, has little by way of beaches but has a major port. Manatee County has nice beaches on Anna Maria Island, and Sarasota County has top ranked beaches similar to those in Pinellas County. Charlotte County has a relatively small beachfront, and Lee County to the south has famous beaches on its offshore islands. Collier County at the south end of the region has a well developed beachfront, particularly at Naples and Marco Island. 22% 8% 19% 22% 4% 4% 21% Collier Lee Charlotte Sarasota Manatee Hillsborough Pinellas Figure 9.34 Distribution of Number of Coastal Properties by County Southwest Region, 2007 There were 51,469 coastal properties in the Southwest Florida region in 2007, with about one fifth of the properties in each of Sarasota, Hillsborough and Pinellas counties. There were relatively few coastal properties in Charlotte County. 103
120 20% 16% 16% 19% 3% 4% 22% Collier Lee Charlotte Sarasota Manatee Hillsborough Pinellas Figure 9.35 Distribution of Coastal Property Values by County in Southwest Region, 2007 The coastal properties had a value of $44.8B, with 22% in Pinellas County and about 20% in Hillsborough and Pinellas counties. Pinellas Hillsborough Manatee Sarasota Charlotte Lee $787,787 $781,758 $795,698 $917,255 $582,432 $749,854 Collier $1,681,110 $0 $500,000 $1,000,000 $1,500,000 $2,000,000 Figure 9.36 Distribution of Average Coastal Property Values in Southwest Coastal Region, 2007 Collier County had the highest average value of coastal properties ($1,681,110) in 2007, followed by Sarasota County ($927,255). The lowest average value was in Charlotte County. 104
121 Pinellas Hillsborough Manatee Sarasota Charlotte Lee Collier Percent Figure 9.37 Coastal Values as Percent of Total Value in Southwest Coastal Region, 2006 Coastal values in Sarasota County accounted for a larger share of the region s property values. Coastal real estate accounted for the largest share of total property values in Sarasota County (almost 40%), with the smallest share in Charlotte County. Pinellas Hillsborough Manatee Sarasota Charlotte Lee Collier Percent Figure 9.38 Percent Growth in Coastal Value in Southwest Coastal Region Coastal values grew most rapidly in Manatee County between 2002 and 2007, followed by Sarasota and Pinellas counties. The slowest growth in coastal values occurred in Collier and Lee counties. 105
122 100% 80% 60% 40% 20% 0% Pinellas Hillsborough Manatee Sarasota Charlotte Lee Residential Commercial Other Collier Figure 9.39 Distribution of Coastal Property Values by Land Use in Southwest Coastal Region, 2007 Residential land uses accounted for the largest share of coastal value in all seven counties in the Southwest Florida coastal region. Commercial values are relatively more important in Collier County and also in Hillsborough and Pinellas in the most urbanized counties. Hillsborough and Pinellas also have relatively high governmentowned coastal values. Pinellas Hillsborough Manatee Sarasota Charlotte Lee Collier $0 $2,000,000 $4,000,000 $6,000,000 $8,000,000 $10,000,000 $12,000,000 $14,000,000 Residential Commercial Other Figure 9.40 Average Coastal Property Values by Land Use in Southwest Coastal Region, 2007 Commercial properties had much higher average values than residential and other land uses in the seven county Southwest Florida region. Collier County had by far the highest average coastal commercial value, and Charlotte County had the lowest. 106
123 $160 $140 $143.1 Million $ $120 $100 $80 $60 $102.0 $110.9 $98.6 $70.6 $40 $20 $25.4 $15.0 $0 Pinellas Hillsborough Manatee Sarasota Charlotte Lee Collier Figure 9.41 Property Tax Revenues from Coastal Parcels by County in Southwest Coastal Region, 2007 Property tax revenues received by taxing authorities from coastal real estate in the Southwest region were more than $100M in Pinellas, Sarasota and Hillsborough counties. Property tax revenues were small in Charlotte and Manatee counties. The Big Bend Coastal Region The seven counties of the Big Bend range northwestward from the Tampa-St. Petersburg area through Pasco, Hernando, Citrus, Levy, Dixie, Taylor and Jefferson counties. The two southernmost counties result primarily from urban spillovers from the Tampa Bay area further south, accounting for almost 85% of the total population in the seven-county region. Jefferson and Dixie counties each have about 15,000 in population, and Taylor County has fewer than 25,000 residents. Jefferson County has only a single coastal parcel which is government-owned. The Big Bend region is remarkable for its lack of coastal beaches, a fact that inhibited the historical development of its coastal areas. 11% 8% 0% 15% 53% 3% 10% Pasco Hernando Citrus Levy Dixie Taylor Jefferson Figure 9.42 Distribution of the Number of Coastal Properties by County Big Bend Region, 2007 There were 6,407 coastal properties in the Big Bend region in 2007, with over onehalf of the properties in Pasco County. Hernando County had 10%, Levy County (the site of the historic coastal community of Cedar Key) had 15% and Dixie County had 11%. 107
124 6% 5%0% 12% 5% 11% 61% Pasco Hernando Citrus Levy Dixie Taylor Jefferson Figure 9.43 Distribution of Coastal Property Values by County in Big Bend Region, 2007 The coastal properties had a value of $1.5B, with 61% in Pasco County, 10% in Hernando and 15% in Levy counties. 100% 90% 80% 70% 60% 50% 40% 30% 20% 10% 0% Jefferson Taylor Dixie Levy Citrus Hernando Residential Commercial Other Pasco Figure 9.44 Distribution of Coastal Property Values by Land Use in Big Bend Coastal Region, 2007 The single government-owned coastal parcel gave Jefferson County the highest average value of coastal parcels in the Big Bend region. Citrus County had an average value of $491,552, and the remaining counties had average coastal values in the $200,000 or $300,000 ranges. Taylor County, home of a historic forestry industry, had the lowest average coastal value in the region. 108
125 Jefferson 0.1 Taylor 4.4 Dixie 5.4 Levy 4.2 Citrus 0.5 Hernando 1.2 Pasco Percent Figure 9.45 Coastal Value as Percent of Total Value in Big Bend Coastal Region, 2006 Coastal real estate accounted for small shares of total county property values in all the counties of the Big Bend region. Only in Dixie County did the share exceed 5%. Jefferson 0.0 Taylor Dixie Levy Citrus Hernando Pasco Percent Figure 9.46 Percent Growth in Coastal Value in Big Bend Coastal Region Coastal values grew most rapidly in Taylor County between 2002 and 2007, followed by Dixie and Citrus counties. The slowest growth in coastal values occurred in Pasco and Levy counties. Jefferson County had no coastal growth between 2002 and
126 100% 90% 80% 70% 60% 50% 40% 30% 20% 10% 0% Jefferson Taylor Dixie Levy Citrus Hernando Residential Commercial Other Pasco Figure 9.47 Distribution of Coastal Property Values by Land Use in Big Bend Coastal Region, 2007 Residential land uses accounted for the largest share of coastal value in five of the seven counties in the Big Bend Florida coastal region. Both Citrus and Jefferson counties have large amounts of government-owned coastal property. Commercial values are relatively unimportant on the region s coast except for Levy County, home to the historic community of Cedar Key. Jefferson Taylor Dixie Levy Citrus Hernando Pasco $0 $200,000 $400,000 $600,000 $800,000 $1,000,000 $1,200,000 $1,400,000 $1,600,000 $1,800,000 Residential Commercial Other Figure 9.48 Average Coastal Property Values by Land Use in Big Bend Coastal Region, 2007 Commercial properties had much higher average values than residential and other land uses in the region, except in Jefferson and Citrus counties. Pasco County had the highest average coastal commercial value, and Dixie County had the lowest. 110
127 Million $ $10 $9 $8 $7 $6 $5 $4 $3 $2 $1 $0 $9.3 $2.5 $2.0 $1.4 $0.8 $0.3 $0.0 Pasco Hernando Citrus Levy Dixie Taylor Jefferson Figure 9.49 Property Tax Revenues from Coastal Parcels by County in Big Bend Coastal Region, 2007 Property tax revenues received by taxing authorities from coastal real estate in the Big Bend region were relatively modest. Only in Pasco County did revenues approach $10M; in the other counties, property tax revenues were less than $3,000,000. The Northwest Florida Coastal Region The seven counties in the northwest beach region range westwards across Florida s Panhandle through Wakulla, Franklin, Gulf, Bay, Walton, Okaloosa, Santa Rosa and Escambia counties. Wakulla has very little in the way of beach resources, and Franklin and Gulf counties have most of their beach resources on St. George Island and St. Joseph Peninsula. These three counties have very small populations with about 10,000 in Franklin, 14,000 in Gulf and 30,000 in Wakulla, which is affected by Leon County to the north where the state capital of Tallahassee is located. Bay County, the next county westward, has more than 160,000 people and its coastal area is dominated by Panama City, one of the state s signature beaches. Walton County to the west is another lightly populated county with a population of about 50,000 persons. To the west is Okaloosa County, with more than 180,000 persons and the beachfront communities of Destin and Ft. Walton Beach. The large Eglin Air Force Base occupies much of Okaloosa County. Further west is Santa Rosa, and most of the island off the coast (occupied by Pensacola Beach) lies in Escambia County, except for Navarre Beach. Escambia County, home of Pensacola and the most populous county in the Florida Panhandle, stretches westwards to the Alabama state line, with the beachfront community of Perdido Key on its southern coast. 111
128 11% 2% 2% 6% 5% 25% 27% 22% Wakulla Franklin Gulf Bay Walton Okaloosa Santa Rosa Escambia Figure 9.50 Distribution of the Number of Coastal Properties by County Northwest Region, 2007 There were 40,929 coastal properties in the Northwest Region in 2007, with about one-half of the properties in each of Bay and Okaloosa counties; Walton County had more than one-fifth of the total. 18% 1% 7% 6% 2% 19% 21% 26% Wakulla Franklin Gulf Bay Walton Okaloosa Santa Rosa Escambia Figure 9.51 Distribution of Coastal Property Values by County in Northwest Region, 2007 The coastal properties had a value of $26.7B, with 26% in Pasco County, 21% in Okaloosa and 18% in Escambia counties. 112
129 Wakulla $295,112 Franklin Gulf $771,809 $765,694 Bay $445,147 Walton $802,119 Okaloosa Santa Rosa Escambia $522,657 $580,075 $1,073,146 $0 $200,000 $400,000 $600,000 $800,000 $1,000,000 $1,200,000 Figure 9.52 Distribution of Average Coastal Property Values in Northwest Coastal Region, 2007 Several large valuable government-owned coastal parcels, including Pensacola Naval Air Station, Fort Pickens State Park and Gulf Islands National Seashore, gave Escambia County in the far west the highest average value of coastal parcels in the Northwest Region. The lowest average value was in far east rural Wakulla County. Wakulla Franklin Gulf Bay Walton Okaloosa Santa Rosa Escambia Percent Figure 9.53 Coastal Value as Percent of Total Value in Northwest Coastal Region, 2006 Coastal real estate accounted for over 40% of total county property values in Bay County. Coastal property value accounted for a higher proportion of the total in this county than in any other Florida coastal county. It was even higher than in Monroe County with its Florida Keys archipelago. Coastal property values accounted for less than 10% in Okaloosa and Santa Rosa counties. 113
130 Wakulla Franklin Gulf Bay Walton Okaloosa Santa Rosa Escambia Percent Figure 9.54 Percent Growth in Coastal Value in Northwest Coastal Region Coastal values grew most rapidly in Escambia County between 2002 and However, much of this increase in value resulted from a sharp revaluation of government-owned property in the county in Private properties in Escambia increased by 169% between 2002 and 2007, which was the fifth highest rate among the eight counties in the Northwest region. County government-owned properties do not pay property taxes, and there are occasions where Property Appraisers make adjustments to their values with a lag. 100% 90% 80% 70% 60% 50% 40% 30% 20% 10% 0% Wakulla Franklin Gulf Bay Walton Okaloosa Santa Rosa Escambia Residential Commercial Other Figure 9.55 Distribution of Coastal Property Values by Land Use in Northwest Coastal Region, 2007 Residential land uses accounted for the largest share of coastal value in all of the eight counties in the Northwest Florida coastal region. Only Bay County has a substantial amount of commercial land use on the beach. 114
131 Wakulla Franklin Gulf Bay Walton Okaloosa Santa Rosa Escambia $0 $2,000,000 $4,000,000 $6,000,000 $8,000,000 $10,000,000 Residential Commercial Other Figure 9.56 Average Coastal Property Values by Land Use in Northwest Coastal Region, 2007 Setting Escambia aside, it is noteworthy that the rate of appreciation in property values was highest at the eastern end of the region and declined with movement westward across the region, with one exception. It suggests that the category 4 Hurricane Ivan which made landfall on the western boundary of Escambia County in 2004 may have had adverse impacts on property appreciation across Northwest Florida, with the magnitude of the impact diminishing farther eastward from the landfall. The exception is St. Joseph Peninsula in Gulf County, which juts out into the Gulf making it more vulnerable to hurricanes to the west. Commercial properties had generally higher average values than residential and other land uses in the region, except in the less intensively developed coastal areas of Santa Rosa, Gulf and Wakulla counties. The highest commercial values are in Escambia and Bay counties. $80 $70 $67.7 Million $ $60 $50 $40 $30 $47.7 $50.6 $20 $12.7 $10.0 $10 $6.1 $2.5 $2.9 $0 Wakulla Franklin Gulf Bay Walton Okaloosa Santa Rosa Escambia Figure 9.57 Property Tax Revenues from Coastal Parcels by County Northwest Coastal Region,
132 Property tax revenues received by taxing authorities from coastal real estate in the Northwest region were relatively modest, except for Bay, Walton and Okaloosa counties that provided over $50M in tax revenues. 9.2 Tourist-Oriented Coastal Property in Florida As noted previously, tourist-oriented property on Florida s coasts include accommodations, restaurants and groceries, retail stores and shopping centers, and entertainment and recreational facilities. Hotels Hotels alone account for more than 70% of the total commercial property value in the areas near the shore. 18 They are also a primary form of accommodation used by 19 domestic visitors to the state. Ship 3% Condo/Timeshare 7% Second Home/Apt/Condo 3% Other 8% Hotel/Motel/Bed& Breakfast 45% Home/Apt/Condo 34% Figure 9.58 Type of Accommodations Used by Domestic Visitors to Florida About 45% of domestic visitors to Florida stay in hotels, motels or the relatively small number of bed and breakfast facilities. The Florida Division of Hotels and Restaurants licenses lodging facilities in the state. In 2008, the number of licensed bed and breakfasts (BNBs) is less than 6% of the total of hotels/motels and BNBs. It is likely that BNBs are considerably smaller on average than hotels and motels. 18 Coastal Real Estate Study, page See 2006 Florida Visitor Study, p
133 Transient Apartments 17% Transient Rooming Houses 4% Bed & Breakfast 5% Hotels/Motels 74% Figure 9.59 Licenses for Tourist and Transient Housing in Florida, 2008 Tourists visiting Florida also stay with friends and relatives in private homes, in second homes and in homes owned by groups of friends and relatives. Many of these facilities are on the beach, but the real estate data do not provide a basis for distinguishing properties used in this way from other properties with similar uses. There were a total of 792 hotels and motels in the coastal counties of Florida in 2007 with a total market valuation of $6.7B. It was possible to match a number of the properties in the real estate database to the properties in the license database and to obtain the capacity in rooms for the matched properties. 20 The number of rooms per $1,000 of property value was computed for the matched properties by coastal region, and the capacities of other properties were extrapolated from these estimates. The coastal hotels and motels in Florida have a total capacity of 90,742 rooms in These amounted to 23.5% of the total hotel and motel rooms in the state almost one in four hotel/motel rooms in the state are located along the state s coasts. Restaurants Restaurants, like hotels, are important places where tourists in Florida spend their dollars. Both types of establishments, of course, receive the dollars of local residents as well as tourists. The real estate database contains information on free standing restaurants on property tax paying facilities which are not part of larger facilities, such as hotels and shopping centers. There were 259 freestanding restaurants in the shore-adjacent zone of Florida s coasts. These properties had a value of $418.8M. Matching restaurants in the real estate file to restaurants in the license files, and calculating the number of seats per $1,000 of value, resulted in an estimate of 77,424 seats in these free standing coastal restaurants. These properties accounted for only a small percentage (2.5%) of the 3.5M seats in all licensed restaurants in the state. 20 The names of the owners of the properties in the real estate database are not always the same as the names of the licensees in the license database, particularly when the property tax bills are sent to banks or real estate agencies rather than directly to the property owners. Licenses may also be issued to central corporate offices rather than individual properties. 117
134 Retail and Entertainment Facilities The value of retail and entertainment facilities along Florida s coasts amounted to $1.4B in Of this, approximately two thirds was in retail facilities and one third was in entertainment facilities. Entertainment & Recreation, $430 (Millions of Dollars) Retail, $942 Figure 9.60 Value of Coastal Retail and Entertainment Properties, 2007 Coastal entertainment facilities include attractions, bars, arenas, stadiums and race tracks, theatres and golf courses. One-third of the value of these properties is accounted for by attractions, and over 30% is accounted for by golf courses. A fourth of the value is accounted for by bars and nightclubs. Golf Courses 33% Attractions 35% Theatres 3% Arenas, Stadiums, Tracks 9% Bars & Nightclubs 20% Figure 9.61 Entertainment & Recreation in Florida Coastal Properties, 2007 Tourist-Oriented Facilities in Coastal Regions Coastal hotels and motels in Southeast Florida had a value of $3.9B in 2007, almost 60% of the value of coastal hotels and motels in the state. Southwest Florida had the second largest share (21.5%) and the share of the Big Bend area was relatively insignificant (less then 1%). 118
135 $5 $4 $3.91 Billion $ $3 $2 $1 $0 $1.43 $0.76 $0.55 $0.01 Northeast Southeast Southwest Big Bend Northwest Figure 9.62 Value of Coastal Hotels by Region, 2007 Free-standing restaurants are distributed along Florida s coasts differently than the state s hotels. The largest share of the statewide value of free standing coastal restaurants is found in the northwest section of the state. Northwest Florida accounted for 34.2% of the value of coastal free standing restaurants in 2007 followed by the Southeast region of the state (29.5%). Million $ $160 $120 $80 $50 $124 $98 $143 $40 $0 Northeast Southeast Southwest Big Bend Northwest $3 Figure 9.63 Value of Coastal Restaurants by Region, 2007 Coastal retail and entertainment property values are concentrated in Southeast Florida where their value in total amounts to over $800M. The second largest concentration of value is in Northwest Florida ($244M) and values in Southwest ($113M) and Northeast Florida ($155M) are each below $200M. 119
136 Million $ $700 $600 $500 $400 $300 $200 $100 $0 Northeast Southeast Southwest Big Bend Northwest Retail $61 $627 $77 $12 $165 Entertainment $95 $220 $36 $0 $79 Figure 9.64 Retail and Entertainment Values by Coastal Region The Northeast Florida Coastal Region The Northeast Florida coastal region contains five counties ranging southwards through Nassau, Duval, St. Johns, Flagler and Volusia counties. Out-of-state beach visitors to this region tend to arrive during the summer months, and they come from other states in the American South. Of the total $963M in property values in the region, 54% was in the southernmost county of Volusia, home to historic Daytona Beach, and 25% was in St. Johns County, where North America s oldest continuously inhabited city of St. Augustine is located. Nassau 12% Duval 7% Volusia 54% Flagler 6% St. Johns 21% Figure 9.65 Tourist-Oriented Property Values in Northeast Florida by County 120
137 Hotel properties accounted for 79% of the tourist-oriented property value, and entertainment facilities accounted for 10%. Entertainment 10% Retail 6% Restaurants 5% Hotels 79% Figure 9.66 Tourist-Oriented Property Values in Northeast Florida by Type Nassau Duval St. Johns Flagler Volusia $0 $100 $200 $300 $400 $500 $600 Volus ia Flagler St. Johns Hotels $482 $1 $158 $42 $75 Restaurants $6 $2 $18 $5 $20 Entertainment $3 $56 $21 $3 $12 Retail $22 $0 $9 $17 $13 Million $ Duval Figure 9.67 Value of Tourist-Oriented Property in Northeast Florida by County, 2007 Nassau There was relatively little tourist-oriented property value in Flagler County except for entertainment properties. Free standing restaurants were the second largest source of tourist-oriented property in coastal Nassau County and entertainment properties were the second largest category in St. Johns County. The Southeast Florida Coastal Region Coastal Southeast Florida ranges southwards from Brevard County, through Indian River, St. Lucie, Martin, Palm Beach, Broward, Miami-Dade and Monroe counties. Out-ofstate beach visitors to these counties tend to arrive in the winter months and include a relatively large number from the Northeast U.S.. Summer beach use tends to be 121
138 dominated by Florida residents. Miami-Dade County receives a large number of international visitors over the course of the entire year. Monroe County at the southern end of the region contains the Florid Keys archipelago and has relatively few beaches on its coast. It has major diving and fishery resources. Monroe 17% Brevard 3% Indian River 2% St. Lucie 0% Martin 0% Palm Beach 15% Miami-Dade 38% Broward 25% Figure 9.68 Tourist-Oriented Property Values in Southeast Florida by County Tourist-oriented property values in Southeast Florida amounted to $4.9B in Most of this value was concentrated in the four southern counties in the region: Miami-Dade (38%), Broward (25%), Monroe (17%) and Palm Beach (15%). Although relatively little of the region s tourist-oriented coastal value was in its northernmost counties, the $191M in value in Brevard County would have ranked third in Northeast Florida. Entertainment 5% Restaurants 3% Retail 13% Hotels 79% Figure 9.69 Tourist-Oriented Property Values in Southeast Florida by Type 122
139 Hotel properties accounted for 79% of the tourist-oriented property value and retail facilities accounted 13%. Brevard Indian River St. Lucie Martin Palm Beach Broward Miami-Dade Monroe $0 $200 $400 $600 $800 $1,000 $1,200 $1,400 $1,600 $1,800 Monroe Miam i- Dade Broward Palm Beach Hotels $562 $1,679 $976 $537 $11 $10 $32 $104 Restaurants $44 $12 $32 $11 $0 $4 $15 $6 Entertainment $19 $79 $45 $67 $0 $0 $8 $2 Retail $228 $47 $165 $120 $2 $1 $36 $29 Million $ Martin St. Lucie Indian River Figure 9.70 Value of Tourist-Oriented Properties in Southeast Florida by County, 2007 Brevard The Southwest Florida Coastal Region The seven counties of coastal Southwest Florida range northward from Collier County, through Lee, Charlotte, Sarasota, Manatee, Hillsborough, and Pinellas counties. Out of state beach visitors to these counties tend to arrive in the winter months and include a relatively large number from the Midwest U.S. Summer beach use tends to be dominated by Florida residents. Hillsborough County, almost entirely inside Tampa Bay, has relatively few beaches on its coast and is the location of a major commercial port. Much of Charlotte County is also cut off from the coast by the large Charlotte Harbor. Pinellas 40% Collier 16% Lee 20% Hillsborough 11% Manatee 6% Sarasota 7% Charlotte 0% Figure 9.71 Tourist-Oriented Property Values in Southwest Florida by County 123
140 Pinellas County at the northern boundary accounts for 40% of the $1.6B tourist-oriented property in the region. The second and third largest shares are in Lee (20%) and Collier counties (16%) at the region s southern end. Restaurants 6% Entertainment 2% Retail 5% Hotels 87% Figure 9.72 Tourist-Oriented Property Values in Southwest Florida by Type Hotel properties accounted for 87% of the tourist-oriented property value, free standing restaurants accounted for 6%, and retail facilities accounted for 5%. Pinellas Hillsborough Manatee Sarasota Charlotte Lee Collier $0 $100 $200 $300 $400 $500 $600 $700 Collier Lee Charlotte Sarasota Manatee Hillsborough Pinellas Retail $0 $20 $0 $1 $5 $35 $16 Entertainment $14 $4 $1 $0 $6 $6 $6 Restaurants $0 $30 $0 $1 $5 $41 $20 Hotels $241 $280 $5 $106 $84 $105 $607 Million $ Figure 9.73 Value of Tourist-Oriented Properties by County in Southwest Florida, 2007 The Big Bend Coastal Region The Big Bend ranges northwest from the central part of Florida s west coast through Pasco, Hernando, Citrus, Levy, Dixie, and Taylor counties before ending at Jefferson County in the state s Panhandle. These counties lack beaches and have limited coastal development. Jefferson County has a single government-owned parcel on its coast and 124
141 other counties, especially Taylor, have coastal forestry parcels. The region has only $22M in tourist-oriented coastal property, and this is virtually all in Pasco and Hernando counties (immediately north of the Tampa-St. Petersburg area) or in Levy County, home to the historic port city of Cedar Key. Dixie 2% Taylor 0% Jefferson 0% Pasco 11% Hernando 7% Levy 78% Citrus 2% Figure 9.74 Tourist-Orientated Property Values in the Big Bend Region by County Retail properties account for the largest part of tourist-oriented coastal properties in the Big Bend region, reflecting the lack of demand for coastal lodging because of the absence of beach resources. Retail 56% Hotels 27% Entertainment 2% Restaurants 15% Figure 9.75 Tourist-Oriented Property Values in the Big Bend Region by Type 125
142 Jefferson Taylor Dixie Levy Citrus Hernando Pasco $0 $2 $4 $6 $8 $10 $12 Pasco Hernando Citrus Levy Dixie Taylor Jefferson Retail $0 $1 $0 $10 $0 $0 0 Entertainment $0 $0 $0 $0 $0 $0 0 Restaurants $1 $0 $1 $2 $0 $0 0 Hotels $1 $0 $0 $5 $0 $0 0 Million $ Figure 9.76 Value of Tourist-Oriented Properties by County in the Big Bend Region, 2007 The Northwest Florida Coastal Region The eight counties of Northwest Florida range westwards from Wakulla in the east, through Franklin, Gulf, Bay, Walton, Okaloosa, Santa Rosa and Escambia counties. The region contains $942M in coastal tourist-oriented properties, with 35% in Bay (largely Panama City Beach), 33% in Okaloosa (including Destin) and Walton counties. There is also substantial coastal tourist-oriented property in Escambia in the far west. Escambia 10% Wakulla 0% Franklin 1% Gulf 0% Santa Rosa 0% Okaloosa 33% Walton 21% Bay 35% Figure 9.77 Tourist-Oriented Property Values in Northwest Florida by County 126
143 Hotels account for 59% of the tourist-oriented property, followed by retail properties and free standing restaurants. Entertainment 8% Retail 18% Restaurants 15% Hotels 59% Figure 9.78 Tourist-Oriented Property Values in Northwest Florida by Type Wakulla Franklin Gulf Bay Walton Okaloosa Santa Rosa Escambia $0 $50 $100 $150 $200 $250 $300 Escambia Santa Rosa Okaloosa Walton Franklin Wakulla Hotels $79 $0 $134 $59 $277 $0 $6 $0 Restaurants $3 $1 $83 $39 $14 $1 $2 $0 Entertainment $8 $0 $23 $16 $30 $1 $0 $0 Retail $1 $0 $74 $80 $8 $2 $0 $0 Million $ Figure 9.79 Value of Tourist-Oriented Properties by County in Northwest Florida, 2007 Bay Gulf 9.3 Seasonal Housing The U.S. Census Bureau defines Seasonal, Recreational, or Occasional Use Homes as vacant units used or intended for use only in certain seasons or for weekends or other occasional use throughout the year. Seasonal units include those used for summer or winter sports or recreation, such as beach cottages and hunting cabins. Seasonal units also may 127
144 include quarters for such workers as herders and loggers. Interval ownership units, sometimes called shared-ownership or time-sharing condominiums, also are included here 21. Florida has the highest overall number of seasonal homes in the nation. In 2006, Florida accounted for almost 16% of all seasonal homes in the United States, totaling 655,447 seasonal homes. In 2006, the state of Florida ranked sixth in the nation for percentage of seasonal homes with 7.7% of all Florida homes being seasonal. The five Florida counties with the largest percentage of seasonal homes in 2006 included Monroe County (28%), Collier County (25%), Charlotte County (17%), Lee County (16%), and Orange County (16%). These figures represent tourist and second home destinations with the Florida Keys, Naples, Punta Gorda and Fort Myers respective to the counties listed above. Other large tourist destinations such as Miami and Orlando are absent from this group, mainly due to high year-round resident populations. Some Florida counties are also experiencing large increases in the numbers of seasonal homes. Counties with the largest populations are also those with the largest share of Florida s seasonal homes including Lee, Collier, Palm Beach, Miami-Dade, and Pinellas counties. These counties added the largest number of seasonal homes in the state from In 2006, the three counties with the largest number of seasonal homes were Palm Beach County with 67,511 seasonal homes comprising 10% of Florida s total, Broward County had 58,225 or almost 9% of the total, and Lee County with 57,208 made up almost 9% of all seasonal homes in Florida. Table 9.1 shows the number of seasonal homes for the top 15 states in 1990 and Florida leads the nation in total number of seasonal homes for both years. In 1990, Michigan ranked second with 223,549 seasonal homes accounting for over 7% of the U.S. total, and New York ranked third with 212,625 seasonal homes, accounting for almost 7% of the U.S. total. In 2006, California jumped to second place with 275,870 seasonal homes, accounting for almost 7% of the U.S. total, and New York ranked third with 255,667 seasonal homes, accounting for 6.1% of the U.S. total. From seasonal homes grew by about 57% in Florida, while overall U.S growth in seasonal homes was 37%. States with the highest growth in seasonal homes from include Nevada at 174%, Hawaii at 160% and Tennessee at 127%. Table 9.1 Seasonal Homes by State, 1990 and Rank State Total seasonal homes % of U.S total % of U.S. total Total seasonal homes 2006 Rank State 1 Florida 417, % 15.56% 655,647 Florida 1 2 Michigan 223, % 6.55% 275,870 California 2 3 New York 212, % 6.07% 255,667 New York 3 4 California 195, % 5.86% 246,759 Michigan 4 21 The U.S. Census Bureau subdivides Vacant Units into seven categories: For Rent; Rented-Not Occupied; For Sale Only; Sold- not Occupied; Seasonal, Recreational or Occasional Use; For Migrant Workers; and Other Vacant. Only Seasonal, Recreational, or Occasional Use homes are included in this report. For further information and definitions go to the ACS Census Website: 128
145 Total % of % of Total 1990 seasonal U.S U.S. seasonal 2006 Rank State homes total total homes State Rank 5 Texas 151, % 4.60% 193,708 Texas 5 6 Wisconsin 150, % 3.96% 166,866 North Carolina 6 7 Pennsylvania 144, % 3.82% 160,989 Pennsylvania 7 8 Minnesota 105, % 3.81% 160,512 Arizona 8 9 New Jersey 100, % 3.61% 152,256 Wisconsin 9 10 North Carolina 98, % 2.84% 119,636 New Jersey Arizona 96, % 2.62% 110,451 Minnesota Massachusetts 90, % 2.46% 103,599 Massachusetts Maine 88, % 2.35% 99,118 Maine Colorado 63, % 2.28% 95,893 Colorado New Hampshire 57, % 2.21% 93,096 South Carolina 15 SOURCE: U.S. Census Bureau Table 9.2 shows the percentage of seasonal homes for selected states in 1990 and Florida ranked sixth in the nation for percentage of seasonal homes with almost 7% and 8%, respectively. The states with the highest percentage of seasonal homes in 2006 were Maine with 14%, Vermont with 14% and New Hampshire with almost 10%. These topranking states have the highest percentage of seasonal homes, in part because of their small population sizes. Table 9.2 Percentage of Seasonal Homes, 1990 and 2006 Rank State State Rank 1 Vermont 16.74% 14.34% Maine 1 2 Maine 15.00% 14.26% Vermont 2 3 New Hampshire 11.34% 9.62% New Hampshire 3 4 Wisconsin 7.33% 8.36% Alaska 4 5 Alaska 7.30% 8.21% Delaware 5 6 Florida 6.85% 7.68% Florida 6 7 Delaware 6.67% 6.67% Hawaii 7 8 Idaho 5.87% 6.48% Montana 8 9 Michigan 5.81% 6.16% Arizona 9 10 Arizona 5.79% 6.01% Wisconsin Minnesota 5.69% 5.93% Wyoming Montana 5.67% 5.47% Michigan Wyoming 4.65% 5.13% Idaho Colorado 4.32% 4.95% New Mexico Massachusetts 3.65% 4.84% Minnesota 15 SOURCE: U.S. Census Bureau Seasonal Homes in Florida Counties Figure 9.80 compares the percentage of homes that are seasonal within selected Florida counties in 1990 and This figure represents the percentage of homes within each county that are seasonal. For both 1990 and 2006, more than 20% of homes in Collier County were seasonal. The other two counties with a large percentage of seasonal homes are Monroe and Charlotte Counties. In 2006, Monroe County s percentage of seasonal 129
146 homes leapt up to almost 29% surpassing Collier County as having the highest percentage of seasonal homes in Florida. Another notable trend is the large growth in percentage of seasonal homes in both Orange and Nassau counties from While in Orange County the percentage of seasonal homes grew from 2% in 1990 to 16% in 2006, the total number of seasonal homes added was 3,023. Nassau County s percentage of seasonal homes grew from 4.5 % totaling 844 seasonal homes in 1990 to almost 15% totaling 4,700 seasonal homes in Counties with populations smaller than 65,000 were not included because of limited data in the 2006 ACS Census. Based on the 2000 Census, smaller counties with large percentages of seasonal homes included Glades County with 24% seasonal homes, Dixie County with almost 19%, Walton County with 26%, and Gulf County with 17% % 30.00% % of homes that are seasonal 25.00% 20.00% 15.00% 10.00% 5.00% 0.00% United States Florida Collier Monroe Charlotte Lee Highlands Martin Manatee Sarasota Palm Beach Putnam Citrus Flagler Indian River Bay Pasco St. Lucie Broward Osceola Lake Hernando Pinellas Marion Polk St. Johns Volusia Okaloosa Brevard Nassau Miami-Dade Clay Escambia Hillsborough Orange Seminole Santa Rosa Alachua Leon Duval SOURCE: U.S. Census Bureau Figure 9.80 Percentage Seasonal Homes within Select Counties, 1990 and 2006 Figure 9.81 shows the number of seasonal homes for selected counties in 1990 and These are arranged by 2006 highest population to lowest. The data determines that larger counties have much higher numbers of seasonal homes than smaller counties in Florida. There are exceptions: Hillsborough County, Duval and Orange Counties have much smaller numbers of seasonal homes despite having large populations. Collier and Sarasota Counties have very high numbers of seasonal homes despite their comparatively lower population size
147 80, , Number of Seasonal Homes 60,000 50,000 40,000 30,000 20,000 10,000 0 Miami-Dade Broward Palm Beach Pinellas Hillsborough Orange Duval Polk Brevard Volusia Lee St. Lucie Pasco St. Johns Escambia Manatee Marion Leon Alachua Lake Collier Sarasota Okaloosa Bay Charlotte Osceola Clay Hernando Martin Citrus Indian River Santa Rosa Seminole Monroe Highlands Putnam Nassau SOURCE: U.S. Census Bureau Figure 9.81 Seasonal Homes for Select Counties, 1990 and 2006 (arranged by population) Rates of Change of Seasonal Homes Figure 9.82 shows the change in number of seasonal homes for selected counties from Lee County experienced the largest increase in the number of seasonal homes, followed by Collier County and Miami-Dade County. These three counties all grew by more than 20,000 seasonal homes. 131
148 Clay Escambia Leon Hernando Alachua Hillsborough Highlands Citrus St. Johns Seminole Manatee Marion Duval Santa Rosa Lake Indian River Orange Flagler Martin Bay Nassau Brevard Osceola Okaloosa St. Lucie Broward Charlotte Monroe Volusia Sarasota Polk Pinellas Palm Beach Miami-Dade Collier Lee 0 5,000 10,000 15,000 20,000 25,000 30,000 Number of seasonal homes SOURCE: U.S. Census Bureau Figure 9.82 Change in Number of Seasonal Homes for Select Counties Figure 9.83 shows the rate of change of seasonal homes for selected counties from Santa Rosa County experienced the largest rate of change, increasing from the county s 1990 level of 349 seasonal homes to 3,085 homes in Santa Rosa also saw a 146% growth in GDP, a 102% growth in population and an 85% growth in employment from Duval, Alachua, and Nassau Counties also rank high in rate of change, but low in overall number of seasonal homes added due to the small number of seasonal homes in A few counties that had large numbers of seasonal homes in 1990 also saw high growth rates through 2006, adding a significant share of seasonal homes to Florida s total. From Miami-Dade County saw a 124% growth rate adding 23,574 seasonal homes, Collier County saw a 110% growth adding 24,895 homes, and Lee County saw an 82% growth rate adding 25,800 homes. 132
149 Clay Broward Manatee Hillsborough Hernando Highlands Palm Beach Escambia Marion Pinellas Citrus Lake Brevard Sarasota Martin Charlotte Bay Indian River Orange Volusia St. Johns Polk Lee St. Lucie Monroe Collier Osceola Miami-Dade Okaloosa Seminole Leon Flagler Alachua Duval Nassau Santa Rosa 0.00% % % % % % % % % % % change SOURCE: U.S. Census Bureau Figure 9.83 Rate of Change of Seasonal Homes Figure 9.84 shows the annual change in seasonal homes for selected counties from Hurricanes could have played a role in the large decrease in seasonal housing in Sarasota and Pinellas Counties from and in Miami-Dade, Palm Beach, Orange and Polk Counties from Of the fifteen counties depicted, eight experienced a decrease in seasonal homes from This decrease may be due in part to the damage associated with intense tropical storms and hurricanes. Between 2004 and 2005, eight out of the thirty costliest hurricanes in United States history occurred (National Weather Service, 2007) 23. The physical and economic impacts of these coastal hazards are a major factor determining seasonal housing populations of Florida and the Nation. 22 Only selected counties are depicted in the graph because the U.S. Census Bureau s annual census collects data for those counties with populations over 65, Adjusted for inflation to year 2006 value. 133
150 15, ,000 Change in Numbr of Seasonal Homes 5, ,000 Dade County Broward County Palm Beach County Pinellas County Hillsborough County Orange County Duval County Polk County Brevard County Volusia County Lee County Pasco County Escambia County Manatee County Sarasota County -10,000 SOURCE: U.S. Census Bureau Figure 9.84 Changes in Seasonal Homes for Selected Counties Figures 9.85 and 9.86 show the growth in seasonal homes from and from , respectively. Counties depicted in blue are not included in the American Community Survey. Figure 9.85 shows that from Santa Rosa, Flagler, Nassau and Seminole counties saw the largest growth rates. This is due to their small number of seasonal homes in 1990 causing higher percentage changes compared to other counties. Both Escambia and Pasco counties had negative growth rates during this period. Figure 9.86 shows the growth rate for selected counties from Counties with small numbers of seasonal homes in 1990 experienced the largest percent changes. Pasco and Putnam counties both had negative growth rates during this period. 134
, 2000-2006 and")
151 SOURCE: U.S. Census Bureau Figures 9.85 and 9.86 Growth in Seasonal Homes (percent change), and
152 9.4 Conclusion Florida leads the nation in number of seasonal homes. In 1990, Florida accounted for 14% of all seasonal homes in the U.S. and in 2006 accounted for 16%. From the number of seasonal homes in Florida grew at a faster rate (57%) than the U.S. as whole (37%). Florida s shoreline counties make up the majority of Florida s seasonal homes. In 2006, Palm Beach, Broward and Lee Counties, all shoreline counties, had the largest number of seasonal homes. In 2006, the top three counties with the largest percentage of homes that are seasonal were all shoreline counties and included Monroe County (28%), Collier County (25%) and Charlotte County (17%). The counties that saw the largest percent change in seasonal homes were Duval, Alachua, and Nassau Counties, and are also shoreline counties. In conclusion, Florida s shoreline counties provide a significant contribution to seasonal housing numbers within the state. 136
153 Chapter 10 Marine Research and Education 10.1 Introduction Marine Research The marine research and education industry is made up of a variety of institutions, primarily in higher education and in the non-profit research sector. This is an important part of the Ocean Economy of coastal states, but one which is very difficult to measure as much of the activity takes place within institutions like universities that conduct a wide variety of non-marine activities in addition to marine research. To estimate the dimensions of the marine research and education sector requires a special supplemental survey. In April 2008, NOEP sent a survey to all of Florida s marine and coastal research and education institutions. Data was collected for FY 2007 and includes: annual budgets, employment figures, annual earned wages, number of students, sources of funding and distribution of research funding. The Institutions Significant institutions or divisions that had a majority marine, coastal or watershed focus were included in the survey. The final list was comprised of 55 institutions and divisions throughout the state. The survey was completed and returned by 39 of these institutions. 24 Of the 39 respondents, 20 reported the number of students, all 39 reported employment numbers, 37 reported wages, 37 reported yearly budgets, 37 reported funding sources, and 33 reported on their research spending. The list of institutions is located at the end of this chapter (table 10.2) Marine Institutions Survey Results Annual Budgets Annual budgets for marine and coastal research and education institutions in Florida totaled $272.5M in FY The annual budget of an institution includes yearly expenses (operational costs), wages and overhead costs, but excludes fringe benefits. This number is an underestimate as only 37 of the reporting 39 institutions provided their yearly budgets. Total Wages The amount of wages for the institutions totaled $154M; 37 of the 39 institutions provided information on total wages and this number reflects their combined total. This amount includes the total of wages and salaries within the institution, but does not include fringe benefits. The average wage for this sector is $52,708 which is higher than the state s annual mean of $37,260 (Bureau of Labor Statistics, 2007). Total wage 24 See Appendix E for a list of institutions. 137
154 contribution from the marine research sector has been underestimated due to the number of institutions that did not provide data for this survey. Total Employees The total number of employees within the institutions totaled 2,925. This number reflects the combined total of all 39 institutions that returned a survey and provided employment figures. Total employees are calculated by a head count of all wage and salary employees at the institution or within the relevant division. Total Students The total number of students within the institutions was 2,234; 20 of the 39 institutions provided data on student numbers and this number reflects their combined total. This category totaled the number of undergraduate and graduate students studying towards a degree in marine, watershed, or coastal science/policy in the institution or division. This category excludes students in K-12 education as well as student employees. Table 10.1 Florida Marine Economic Indicators Marine and Coastal Research and Education Institutions, FY2007 Total Annual Budgets $272,504,486 Total Annual Wages $154,144,562 Total Employment 2,925 Total Students 2,234 Sources of Funding The survey asked respondents to report on sources of funding which were classified as: Federal, State/Local, Private, Foundations and Other; 37 of the 39 institutions provided data on funding sources and these numbers reflect their combined totals. The Federal category accounted for the largest funding source at 62%, compared to Private Sources and Foundations which contributed the smallest percentage, both at 3% (figure 10.1). 138
155 $33,274,182 15% $6,385,621 3% $6,914,819 3% Federal State/Local Private Foundations $36,458,091 17% $131,828,184 62% Other Figure 10.1 Sources of Funding, FY 2007 Research Spending The final section of the survey measured the allocation of money towards various categories of marine research; 33 of the 39 institutions provided budgeted amount of money designated to various research projects, and classified these research projects into seven categories. The seven categories of research include: Climate Change, Biodiversity, Coastal Processes, Chemical Cycling, Ocean Engineering, Marine Policy, and Other. This information determines what areas of research are getting the most attention and funding. The total amount spent on research was $162M and the total number of researchers was 858. Biodiversity received the largest portion of funding at 47%, in contrast to the small amounts allocated to Chemical Cycling 4%, Climate Change 5% and Marine Policy 5% (figure 10.2). 139
156 $17,171,676 11% $27,420,468 17% $8,151,635 5% Climate Change Biodiversity Chemical Processes Chemical Cycling Marine Policy Ocean Engineering Other $7,902,178 5% $5,939,898 4% $17,687,684 11% $77,299,638 47% Figure 10.2 Areas of Research Spending, FY 2007 In a similar study conducted along the central coast of California the same findings were made on research spending by marine research and education institutions. These findings are surprising, as climate change has become such an important issue. While it is known that the oceans play a large role in global temperature balance and the carbon cycle, there is still a great deal to be studied on the phenomena and its relation to the oceans. It seems clear that more funding should be dedicated to climate change research and marine policy as we discover the enormous role that oceans play in our climate system. Table 10.2 Major Marine and Coastal Research and Education Institutions in Florida, 2007 Institutions Responding Institutions Florida Atlantic University Center for Urban and Environmental Solutions Center for Urban and Environmental Solutions Department of Ocean Engineering Department of Ocean Engineering Department of Biological Sciences- Marine Biology Program Department of Chemistry and Biochemistry Florida Gulf Coast University Coastal Watershed Institute- Department of Coastal Watershed Institute- Department of Marine Marine and Ecological Sciences and Ecological Sciences Florida International University Biological Sciences (University Park Campus)- Biological Sciences (University Park Campus)- Marine Faculty Marine Faculty International Hurricane Research Center 140
157 Institutions Southeast Environmental Research Center Florida State University Department of Oceanography Florida State University Coastal and Marine Laboratory New College of Florida Division of Natural Sciences- Marine Biology Program University of Florida Department of Civil and Coastal Engineering Department of Zoology Archie Carr Center for Sea Turtle Research Seahorse Key Marine Laboratory Department of Fisheries and Aquatic Sciences Whitney Laboratory for Marine Bioscience University of South Florida College of Marine Science University of West Florida Department of Biology-Marine Biology Community Outreach Research and Learning Center (CORAL Center) Eckerd College Department of Marine Science Florida Institute of Technology Department of Biological Sciences- Aquaculture Program Department of Biological Sciences-Marine Biology Program Department of Marine and Environmental Systems Jacksonville University Department of Biology and Marine Science Nova Southeastern University Oceanographic Center Rollins College Marine Biology Program University of Miami Responding Institutions Southeast Environmental Research Center Department of Oceanography Florida State University Coastal and Marine Laboratory Division of Natural Sciences- Marine Biology Program Seahorse Key Marine Laboratory Whitney Laboratory for Marine Bioscience Department of Marine Science Department of Biological Sciences- Aquaculture Program Department of Biological Sciences-Marine Biology Program Department of Marine and Environmental Systems Department of Biology and Marine Science Oceanographic Center Rosenstiel School of Marine and Atmospheric Science (The School reported on behalf of all of the Divisions) Division of Applied Marine Physics Division of Applied Marine Physics Division of Marine and Atmospheric Chemistry Division of Marine and Atmospheric Chemistry Division of Marine Affairs and Policy Division of Marine Affairs and Policy Division of Marine Biology and Fisheries Division of Marine Biology and Fisheries 141
158 Institutions Division of Marine Geological Physics and Geophysics Division of Meteorology and Physical Oceanography Undergraduate Marine and Atmospheric Science University of Tampa Marine Science Center Gulf Coast Research Laboratory Statewide University-Based Programs Florida Sea Grant College Program-University of Florida (Gulf of Mexico and Southeast Atlantic) Private Non-Profit Marine Laboratories Harbor Branch Oceanographic Institution, Inc. Mote Marine Laboratory, Inc. State and Federal Agencies and Programs Fish and Wildlife Research Institute- Florida Fish and Wildlife Conservation Commission NOAA National Marine Fisheries Service- Southeast Regional Office NOAA National Marine Fisheries Service- Southeast Fisheries Science Center Panama City Laboratory NOAA Atlantic Oceanographic and Meteorological Laboratory NOAA Florida Keys National Marine Sanctuary Apalachicola National Estuarine Research Reserve Rookery Bay National Estuarine Research Reserve Guana Tolomato Matanzas National Estuarine Research Reserve NOAA National Undersea Research Center- Aquarius Reef Base/UNCW USGS-Florida Integrated Science Center- Center for Coastal & Watershed Studies Florida Department of Environmental Protection- Florida Geological Survey Non-Profit and Private Organizations Pigeon Key Foundation Marine Resources Development Foundation, Inc. Hubbs Research Institute at Sea World Additional Sanibel-Captiva Marine Laboratory Sarasota Bay National Estuary Program Charlotte Harbor National Estuary Program Charlotte Harbor Environmental Center Responding Institutions Division of Marine Geological Physics and Geophysics Division of Meteorology and Physical Oceanography Undergraduate Marine and Atmospheric Science Marine Science Center Florida Sea Grant College Program-University of Florida (Gulf of Mexico and Southeast Atlantic) Harbor Branch Oceanographic Institution, Inc. Mote Marine Laboratory, Inc. Fish and Wildlife Research Institute- Florida Fish and Wildlife Conservation Commission NOAA National Marine Fisheries Service-Southeast Fisheries Science Center NOAA Atlantic Oceanographic and Meteorological Laboratory NOAA Florida Keys National Marine Sanctuary Rookery Bay National Estuarine Research Reserve Guana Tolomato Matanzas National Estuarine Research Reserve NOAA National Undersea Research Center- Aquarius Reef Base/UNCW USGS-Florida Integrated Science Center- Center for Coastal & Watershed Studies Florida Department of Environmental Protection- Florida Geological Survey Pigeon Key Foundation Marine Resources Development Foundation, Inc. Hubbs Research Institute at Sea World Sarasota Bay National Estuary Program Charlotte Harbor National Estuary Program Charlotte Harbor Environmental Center 142
159 Institutions SRI International (Marine Technology Program) The Florida Aquarium Center for Conservation and Research Florida Institute of Oceanography Responding Institutions SRI International (Marine Technology Program) The Florida Aquarium Center for Conservation and Research Florida Institute of Oceanography Conclusion Florida s Marine Research and Education sector greatly contributes to Florida s economy. From FY2007 annual budgets totaled $272.5M, and wages totaled $154M. While the data collected is an underestimate of the total contribution to Florida s economy, due to the 2/3 response rate from institutions, it is nonetheless valuable. From the data collected, institutions received a majority of their funding from the Federal Government. And while just 5% of total research spending was allocated to Climate Change and 5% to Marine Policy, it is clear that more funding should be directed towards those two categories as climate change becomes an important priority in the years to come. 143
160 Part IV Chapter 11 Coastal Recreation Activities and Assets Introduction and Overview 11.1 Non-Market Values Much of the Florida coast is accessible to Florida residents for a variety of recreational activities including beach going, fishing, boating, scuba diving and snorkeling. Often, access to coastal areas is free or very low cost, but that does not mean that coastal resources do not represent a real economic value to Florida residents and visitors. In fact, it often is the case that resources that are available at the least cost have the highest value. Take, for example, our fascination with low prices and sales in the retail sector. We usually regard the best value as being when we pay the lowest price for something we want. The concept that we value items beyond what we pay for them is called nonmarket values. Because outdoor recreation opportunities are in high demand, but often come at low cost, economists have developed ways of estimating how much the public would pay for recreation if they had to. The willingness to pay for recreation, beyond what the public does pay is called non-market value and represents the net value added of coastal recreational resources. While hard to measure, the non-market value of coastal recreation has a substantial economic impact on state economies. The non-market value enjoyed by local residents ultimately factors into the higher prices people are willing to pay for homes near the coast. Non-market value also reflects the maximum residents would be willing to pay to go to a substitute coastal site if their favorite part of the coast became inaccessible. Tourists who visit Florida to use its beaches or explore coral reefs also enjoy non-market values in the same way as residents. A review of the estimates from the literature for the non-market value associated with important coastal recreational activities is given in Appendix F1, with examples from Florida highlighted in italics (all values are adjusted to 2007 dollars). Estimates differ due to differences in the quality of the recreational opportunity, the preferences of the local public, and differences in the methods used to estimate the values. While the literature differs on the exact non-market value associated with coastal recreation, the findings demonstrate that the value of coastal recreation is substantial, from $5 per person day as a low estimate for the value of beach going in Florida to more than $100 per person day for recreational fishing - one person day represents one visit, by one person, for one day or any part of a day. In Phase I of the Florida Ocean Economics Report, we estimated the likely total economic (non-market) value of coastal recreation in Florida, based on estimates of coastal visitation provided by the National Survey on Recreation and the Environment (Leeworthy and Wiley 2001.) In the chapter that follows, our collaborators from Florida Atlantic University take this analysis further by examining the available data on local coastal recreation in the state of Florida. Not surprisingly, the varied coast of Florida offers different recreational opportunities in different regions of the state. We found generally that state and local agencies do not consistently collect good data on local 144
161 coastal uses for the entire state; in many cases a distinction between local users and tourists is not made. Nevertheless, the data and estimates of coastal recreational activity show that the intensity of coastal use is high throughout the state, but varies widely across the regions of the state. The chapter that follows is our second step in an effort to better understand the comprehensive set of recreational activities, with a focus on the regional differences in recreation around the state. When possible we provide a first approximation of the local intensity of coastal recreational activity. If better data were available on coastal visitation by locals (measured as person days), we could use the estimates from the literature (see Appendix F1) to approximate the potential economic non-market value of coastal recreational resources in Florida. In the absence of such data, we provide the following as a summary of the state of the art in Florida s monitoring of these activities. We highlight specific gaps in data collection activities, and when possible provide recommendations regarding how these gaps can be filled Organization of this Report Outdoor recreation is commonly understood as a social need, which public agencies must consider in the allocation and management of the natural and cultural resource base. Broadly defined, outdoor recreation is any leisure-time activity conducted outdoors. There are two categories: user-oriented and resource-based recreation. User-oriented recreation can be provided nearly anywhere for the convenience of the user (e.g., baseball, basketball, golf, soccer, tennis). Resource-based recreation, whether active or passive, is provided at a site-specific source, i.e., one dependent upon some element (or combination of elements) in the natural or cultural environment not easily duplicated by man (e.g., boating, fishing, surfing). Although the overall national participation rate (per capita participation) in marine recreational activities is expected to decrease from 2000 to 2010, the number of participants in coastal recreation is expected to increase. This increase may be attributed to the projected population growth, which will offset the decline in participation rates. 25 The largest increases in marine recreational activities expected are for visiting beaches, with more than 3.9 million new participants for , and more than 7.3 million new participants for Florida is ranked number 1 for number of participants in coastal recreation pursuit, and therefore a dynamic and focused response to recreation planning is necessary to accommodate this increase Leeworthy, V.R., J.M. Bowker, J.D. Hospital, and E.A. Stone. (2005). Projected Participation in Marine Recreation: 2005 & U.S. Department of Commerce. National Oceanic and Atmospheric Administration. Silver Spring, Maryland. Available online at 26 Ibid. 27 Leeworthy, V.R. (2001). Preliminary Estimates from Versions 1-6: Coastal Recreation participation in National Survey on Recreation and the Environment U.S. Department of Commerce. National Oceanic and Atmospheric Administration. Silver Spring, Maryland. p.8. Retrieved 06/10/2008 from 145
162 As part of this statewide assessment, measures of coastal recreational activities at the county level are presented. Thirty-five counties in Florida are classified as coastal counties. Due to the state s diverse coastline and recreational activities, there is often great variation in the measures of recreational activity in different areas around the state. It may be useful to analyze activity data on a regional basis for comparison purposes. Thus, whenever possible throughout this report, information is presented for the following regional groupings: Northeast, Northwest, Southeast, Southwest, and Big Bend (see figure 11.1). The 35 coastal counties included by region are as follows: Northeast: Duval, Flagler, Nassau, St. Johns, Volusia Northwest: Bay, Escambia, Franklin, Gulf, Okaloosa, Santa Rosa, Wakulla, Walton Southeast: Brevard, Broward, Indian River, Martin, Miami-Dade, Monroe, Palm Beach, St. Lucie Southwest: Charlotte, Collier, Hillsborough, Lee, Manatee, Pinellas, Sarasota Big Bend: Citrus, Dixie, Hernando, Jefferson, Levy, Pasco, Taylor 146
163 Figure 11.1 Florida Coastal Regions Map 147
164 Data to estimate the level of coastal use is presented for four main activities: recreational boating; recreational saltwater fishing; scuba diving and snorkeling; and beach activities, including surfing. The best available data were used to document an activity at the finest scale feasible. Supporting variables, such as expenditures, for each of the four areas also are presented when available. To establish a baseline, a time series of data is reported for a period of at least five years prior to the most recent data available, when feasible. The focus here is on recreational activities of both residents and visitors. Generally, there are at least three fundamental measures of recreation: a measure of the number of people participating in recreation (sometimes referred to as visitors or participants), the number of user occasions (the number of times one person participated in one recreational activity), and the number of days these people spend participating in recreation (sometimes referred to as activity days, person days). One visitor may spend four days at the beach thus accounting for one user occasion or four activity days. A local resident may go to the coast one hundred times each year! Clearly, it is wrong to count that resident as 100 visitors. Unfortunately, a standard does not exist for measuring recreational activity across the state and in some cases reporting agencies refer to number of people or number of visitors when they mean to refer to number of visits or activity days. To be consistent, in the body of this report we have attempted to convert measures of recreational activity, as reported in state reports and other information sources, to either participants, user occasions or person days. The original data and the original measures provided by the original sources are maintained in the data reported in Appendix F1. It also is important to note here that we try to focus on recreation, as defined above, and not on "tourism" as measured by stays in hotels, meals in restaurants, etc. The values associated with those activities are discussed in the Phase I report. Finally, throughout this report, specific references are made to variations in data trends most likely the result of the unusual incidence of major storm events during the 2004 and 2005 hurricane seasons in Florida Impacts of the 2004 and 2005 Hurricane Seasons in Florida The period since 1990 has seen a sharp increase in the number of hurricanes and tropical storms accompanied by federal major disaster or emergency declarations in Florida, compared to the previous 30-year period. Five hurricanes struck the state in the 1960s, and there was one tropical storm and one hurricane in the 1970s. There were two hurricanes in the 1980s and eight hurricanes and two tropical storms in the 1990s. Since 2000, there have been eight more hurricanes and two more tropical storms. In 2004, a record four hurricanes struck the state, along with one tropical storm, and in 2005, there were three hurricanes that struck the state, plus the tropical storm winds from an offshore hurricane The 2004 Hurricane Season In 2004, Florida became the first state since Texas in 1886 to experience four hurricanes in a single year. The first 2004 federal disaster declaration in Florida was made on August 13, 2004 for Hurricane Charley and Tropical Storm Bonnie. Charley, a category 148
165 four hurricane, was the strongest storm to hit the United States since Andrew in Frances, the category two hurricane which struck the state on September 5 th, was much less powerful, but it was followed less than three weeks later by Jeanne, a category three, which struck the state in almost the same location. Ivan, a category three hurricane, landed near Gulf Shores in Alabama on September 16 th, about twelve miles west of the Florida state line. It had a major impact on the state. Individuals were eligible for assistance in 27 of the state s 67 counties as a result of Hurricane Charley; they were eligible for assistance in 44 counties as a result of Frances, 37 counties as a result of Ivan, and 47 counties as a result of Jeanne. As a result of the four disaster declarations, individuals in all 67 of the state s counties became eligible for disaster assistance. Indeed, 15 counties were included in all four disaster declarations, an additional 15 were included in three declarations, and 14 were included in two declarations. The state s remaining 23 counties were included in a single declaration. Although coastal counties are traditionally associated with hurricane-induced damages, six of the 15 counties that experienced damages from all hurricanes in 2004 were away from the coast, as were seven of the counties that experienced damage from three hurricanes The 2005 Hurricane Season Although 2004 stood out as the first time a state had been impacted by four hurricanes since Texas in 1886, Florida was again impacted by four hurricanes in Additionally, there were two tropical storms. The Florida season began with Tropical Storm Arlene which made landfall near Pensacola on June 11 th, followed by Hurricane Dennis which landed at almost the same location almost one month later. Katrina landed as a category one hurricane at Hollywood, Florida, on August 25 th, before crossing the peninsula and making its way north through the Gulf of Mexico to cause devastation along coastal Mississippi and Louisiana, particularly in New Orleans. Hurricane Rita did not make landfall in Florida, but it created tropical storm conditions in the Florida Keys as it traveled through the Florida Straits on September 20 th. Storms arrived on opposite ends of Florida's east coast in October: Tropical Storm Tammy made landfall near Jacksonville on October 5 th, and Hurricane Wilma landed near Everglades City as a category 3 storm on October 24 th. Damage from the 2005 storms was less extensive than in Two storm-related federal disasters were declared in Florida-one in connection with Hurricane Dennis and the other in connection with Hurricane Wilma Coastal Recreation in Florida The State of Florida, long considered a magnet for outdoor recreation enthusiasts, offers an abundance of natural areas and outdoor recreational facilities that attract millions of residents and tourists annually. An elongated peninsula totaling some 58,560 square miles, the state runs 450 miles from north to south and 470 miles east to west. No point in 149
166 the state is farther than 70 miles from the ocean. 28 The state consists of five physiographic regions, the Western Highlands, Marianna Lowlands, Tallahassee Hills, Central Highlands, and the Coastal Lowlands. Each region, characterized by different natural resources and amenities, offers a variety of opportunities for outdoor recreation. Managing coastal recreational resources, while ensuring their protection and preservation, involves numerous local, state, regional, and federal agencies. Through intergovernmental coordination and cooperation, together with active and dynamic planning processes, Florida has made significant progress toward developing an outdoor recreation program to meet the needs of its citizens and visitors alike. 29 To set the framework for this report and to serve as a generalized guide to the levels of various outdoor recreational activities enjoyed in Florida, figures 11.2 through 11.6 show the densities of public beaches, public parks, marine facilities (such as marinas, boat slips, dry-stack boat storage), and public boat ramps throughout the state. While these maps are not intended to provide definitive data on recreation amenities in Florida, they support the overall perspective that Florida is an ocean state with many recreation activities. The wide range of activities, whether it be boating, beach going, fishing, or diving, is dependent on the state s coasts and oceans. For information concerning the methodology used to generate maps used in this chapter, see Appendix G2. 28 Florida Department of Environmental Protection. (2000). Outdoor Recreation in Florida 2000, the Statewide Comprehensive Outdoor Recreation Plan (herein referred to as SCORP), available online from the Florida Department of Environmental Protection at p See SCORP, pp

167 Figure 11.2 Map of Public Beaches by County 151
168 Figure 11.3 Map of Public Parks by County 152
169 Figure 11.4 Map of Marine Facilities by County 153

170 Figure 11.5 Map of Boat Ramps by County 154

171 Figure 11.6 Map of Piers by County 155
172 Chapter 12 Park Visitation and Attendance 12.1 Introduction To understand the role of the State of Florida in supplying coastal recreational opportunities, such as park visitation by tourists and residents, it is useful to review the comprehensive planning system that has been established to assess needs and meet demands. The State Comprehensive Plan directs Florida to provide outdoor recreational opportunities for the general public. 30 The Florida Department of Environmental Protection (FDEP) is the agency responsible for preparing and implementing a multipurpose plan, 31 the Statewide Comprehensive Outdoor Recreation Plan (SCORP), 32 with assistance from other state agencies providing access to public lands. 33 SCORP is intended to serve as a framework, an information resource, and a guide for the development of a sustainable and integrated, diverse and balanced system of meeting Florida s current and future needs for outdoor recreational activities. Planning for adequate recreational resources for its visitors and residents requires FDEP to assimilate information from a variety of sources. FDEP engages in a variety of research activities in support of the plan, including periodic surveys to document participation rates in particular activities. In addition, an inventory of recreational resources is maintained and records are kept of such factors as park attendance and participant activities. These methods are used to develop Florida s SCORP 34 in a process used to estimate recreation needs statewide and in each of the state s 11 planning regions. (See figure 12.1 and Appendix G1 for a list of Florida Comprehensive Recreation Planning Regions and their associated counties.) 30 Chapter 187, Florida Statutes (2007). Available online at Seven goals and their related policies apply to providing outdoor recreational opportunities for the general public. These have been compiled in the Appendices in SCORP. 31 See Sections (Duties and Functions of Division of Recreation and Parks) and (Comprehensive Multipurpose Outdoor Recreation Plan), Florida Statutes (2007). Available online at SEC12.HTM&Title=->2007->Ch0418->Section%2012# and SEC021.HTM&Title=->2007->Ch0375->Section%20021# , respectively. 32 Florida Department of Environmental Protection. (2000). Outdoor Recreation in Florida 2000, the Statewide Comprehensive Outdoor Recreation Plan. Available online from the Florida Department of Environmental Protection at 33 These other state agencies include the Florida Commission on Tourism, the Florida Fish and Wildlife Conservation Commission, the Florida Department of Agriculture and Consumer Services, the Florida Department of Transportation, and the five water management districts. Section (1), Florida Statutes (2007). 34 See SCORP Chapter 5 Outdoor Recreation Demand and Need for the detailed methodology used to calculate statewide and regional supply and demand. 156

173 Figure 12.1 Florida Comprehensive Recreation Planning Regions 157
174 The most recently completed SCORP, entitled Outdoor Recreation in Florida 2000, was approved by the state and federal governments in 2002, and efforts are currently underway to update the plan by fall of Because projections of coastal recreation are based on statistical estimates from statewide surveys, the plan cautions that data used to determine demand at the statewide and planning district levels should not be used to assess needs at the local or sub-regional (county) level because a statistically appropriate sample may not exist for at the sub-regional level. Instead, counties must prepare Local Government Comprehensive Plans, 36 which incorporate the results of periodic needs assessments for parks and other recreational amenities within the Recreation and Open Space Element as well as other components of these planning documents. It should also be noted that each of the 11 Regional Planning Councils in Florida must prepare a Regional Policy Plan to guide future growth and development Florida s State Parks One of the largest in the country, the system of State Parks in Florida contributes to the allure of the Sunshine State. Covering more than 723,000 acres with 100 miles of white, sandy beaches, there are 161 parks, which offer swimming and diving, fishing and boating, and other activities year-around. State Parks support a variety of coastal use activities. We first review activities within State Parks and later discuss state use activity for each use type including State Parks and other areas of the Florida coast. The State Parks are divided for management purposes into the following five districts (figure 38, ). 35 Telephone interview (February 20, 2008) with Patricia M. Evans, Office of Park Planning, Florida State Parks, Florida Department of Environmental Protection, Tallahassee, Florida. All 50 states must prepare an updated SCORP every five years to be eligible for federal park funding appropriated by the National Park Service through the Federal Land and Water Conservation Fund. 36 The 1985 Florida Legislature enacted the Local Government Comprehensive Planning and Land Development Regulation Act (Chapter 163, Part II, Florida Statutes), which is known as the Growth Management Act. This law requires all of Florida s 67 counties and 410 municipalities to adopt Local Government Comprehensive Plans to guide future growth and development. In addition to recreation and open space, these plans include chapters or elements regarding coastal management, future land use, capital improvements, conservation, transportation, infrastructure, housing, and intergovernmental coordination. See, generally, 37 Section , Florida Statutes (2007). Available online at Statute&Search_String= &URL=CH0186/Sec507.HTM. 38 For further information, see Provided by Brady Harrison, OMCII GIS, Florida State Parks, Florida Department of Environmental Protection. Tallahassee, Florida. 39 It should be noted that these park management districts do not necessarily coincide with the five regional groupings of coastal counties identified above in figure and the accompanying text. 158
175 District 1: The Northwest District ranges from Perdido Key on the Alabama line to St. George Island near Apalachicola to Maclay Gardens in Tallahassee. This region has 37 State Parks, including nine beach parks along the Florida coastline. 40 District 2: The Northeast District stretches from Inverness to Fernandina and from Jacksonville to the Suwannee River. There are 34 State Parks in this district, four of which are considered coastal beach State Parks. 41 District 3: The Central District runs from Anastasia to Kissimmee Prairie. Its 30 State Parks offer cool springs and breathtaking beaches. In this district there are five coastal beach parks. 42 District 4: The Southwest District stretches from the Gulf of Mexico to the Lake Wales Ridge and from Inverness to the Everglades. The 35 State Parks in this area feature swamps, a salt spring, the world s longest fishing pier, and beautiful beaches. Among the nine coastal beach parks in this region 43 is Caladesi Island State Park, which was recently named as America s top beach destination by Dr. Stephen P. Leatherman (also known as Dr. Beach ) of Florida International University. 44 District 5: The Southeast District covers nearly 300 miles from Fort Pierce to Key West. With 25 State Parks, this region of island parks, coral reefs, bays, and marshes is as diverse as the communities and visitors served. There are 12 coastal beach State Parks in this district These include Bald Point State Park, Big Lagoon State Park, Camp Helen State Park, Deer Lake State Park, Dr. Julian G. Bruce St. George Island State Park, Grayton Beach, Henderson Beach State Park, St. Andrews State Park, and T.H. Stone Memorial St. Joseph Peninsula State Park. 41 These include Amelia Island State Park, Big Talbot Island State Park, Fort Clinch State Park, and Little Talbot Island State Park. 42 These include Anastasia State Park, Gamble Rogers Memorial State Recreation Area at Flagler Beach, North Peninsula, Sebastian Inlet State Park, and Washington Oaks Gardens State Park. 43 In addition to Caladesi Island State Park, there are Anclote Key Preserve State Park, Delnor-Wiggins Pass State Park, Don Pedro Island State Park, Egmont Key State Park, Gasparilla Island State Park, Honeymoon Island State Park, Lovers Key State Park, and Stump Pass Beach State Park. 44 Dr. Beach says Caladesi Island is nation s best beach in The Miami Herald. Retrieved 05/22/08 from 45 These include Avalon State Park, Bahia Honda State Park, Bill Baggs Cape Florida State Park, John Pennekamp Coral Reef State Park, Fort Pierce Inlet State Park, Fort Zachary Taylor Historic State Park, Hugh Taylor Birch State Park, Indian Key Historic State Park, John U. Lloyd Beach State Park, John D. MacArthur Beach State Park, Oleta River State Park, and St. Lucie Inlet Preserve State Park. 159

176 SOURCE: Communication from Brady Harrison, Florida State Parks, Florida Department of Environmental Protection. Tallahassee, Florida. ed on May 29, Figure 12.2 Map of Florida State Park Districts 160
Marine Recreational and Commercial Industries and Activities in Lee and Charlotte Counties: Economic Consequences and Impacts
 Marine Recreational and Commercial Industries and Activities in Lee and Charlotte Counties: Economic Consequences and Impacts Betty Staugler Florida Sea Grant Extension Marine Agent & Chuck Adams Florida
Economic Impact of the Recreational Marine Industry Broward, Miami-Dade, and Palm Beach Counties, Florida
 Economic Impact of the Recreational Marine Industry Broward, Miami-Dade, and Palm Beach Counties, Florida - 2018 Completed by THOMAS J. MURRAY & ASSOCIATES, INC. For MARINE INDUSTRIES ASSOCIATION OF SOUTH
Final Report, October 19, Socioeconomic characteristics of reef users
 Socioeconomic Study of Reefs in Southeast Florida - Executive Summary By Hazen and Sawyer in association with Florida State University and National Oceanic and Atmospheric Administration, October 19, 2001
colorado.edu/business/brd
 colorado.edu/business/brd Big Changes, Unknown Impacts Southwest Business Forum Place cover image here Richard Wobbekind Senior Economist and Associate Dean for Business and Government Relations January
The 2010 Economic Contribution of Tourism to the Meadowlands Liberty Region
 The 2010 Economic Contribution of Tourism to the Meadowlands Liberty Region Key Metrics & Evaluation 93 MAIN STREET :: ANNAPOLIS, MD 21401 WWW.VANTAGESTRATEGY.COM :: 202-449- 9708 1 Vantage Strategy ::.
Economic Contribution of the 2018 Recreational Red Snapper Season in the South Atlantic
 Economic Contribution of the 2018 Recreational Red Snapper Season in the South Atlantic Produced for the: American Sportfishing Association (ASA) PO Box 6435 Fernandina Beach, FL 32035 Office (904) 277-9765
Wenlin Liu, Senior Economist. Stateof Wyoming. Economic Analysis Division State of Wyoming 1
 WYOMING DEMOGRAPHIC AND ECONOMIC TREND LCCC LIFE Program April 7, 2012 Cheyenne, Wyoming Wenlin Liu, Senior Economist Economic Analysis Division Stateof Wyoming Economic Analysis Division State of Wyoming
The University of Georgia
 The University of Georgia Center for Agribusiness and Economic Development College of Agricultural and Environmental Sciences Economic Impacts of Alabama Quail Hunting Prepared by: Archie Flanders and
Big Changes, Unknown Impacts
 Big Changes, Unknown Impacts Boulder Economic Forecast Place cover image here Richard Wobbekind Senior Economist and Associate Dean for Business and Government Relations January 17, 2018 Real GDP Growth
COOPERATIVE EXTENSION Bringing the University to You
 COOPERATIVE EXTENSION Bringing the University to You Special Publication - 06-16 ECONOMIC IMPACT OF TOURISM ON COLORADO RIVER COMMUNITIES INCLUDING: LAUGHLIN BULLHEAD CITY FORT MOHAVE MOHAVE VALLEY GOLDEN
The 2001 Economic Benefits of Hunting, Fishing and Wildlife Watching in MISSOURI. Prepared by:
 The 2001 Economic Benefits of Hunting, Fishing and Wildlife Watching in MISSOURI Prepared by: Southwick Associates, Inc. PO Box 6435 Fernandina Beach, FL 32035 Ph (904) 277-9765 Fax (904) 261-1145 Email:
Hunter and Angler Expenditures, Characteristics, and Economic Effects, North Dakota,
 Agribusiness and Applied Economics Report No. 507-S January 2003 Hunter and Angler Expenditures, Characteristics, and Economic Effects, North Dakota, 2001-2002 Dean A. Bangsund and F. Larry Leistritz*
THE ECONOMIC CONTRIBUTION FROM HORSES
 THE ECONOMIC CONTRIBUTION FROM HORSES ECONOMIC CONTRIBUTION FROM HORSES HIGHLIGHTS The horse industry contributes more than $19 billion annually to the Canadian economy On-farm activities with horses generate
The Economic Impacts of Recreational Fishing in the Matagorda Bay System
 The Economic Impacts of Recreational Fishing in the Matagorda Bay System Prepared by Andrew Ropicki 1 Daniel Hanselka 2 Rebekka Dudensing 3 Rhonda Cummins 4 Bill Balboa 5 December 12, 2016 1 Assistant
2018 Annual Economic Forecast Dragas Center for Economic Analysis and Policy
 2018 Annual Economic Forecast Dragas Center for Economic Analysis and Policy PRESENTING SPONSOR EVENT PARTNERS 2 The forecasts and commentary do not constitute an official viewpoint of Old Dominion University,
The Economic Benefits of Hunting and Fishing Activities in Alberta in 2008
 The Economic Benefits of Hunting and Fishing Activities in Alberta in 2008 Submitted to Hunting For Tomorrow Foundation Submitted by May, 2009 Introduction Hunting and Fishing related expenditures by Alberta
The Power of Outdoor Recreation Spending in Pennsylvania:
 The Power of Outdoor Recreation Spending in Pennsylvania: How hunting, fishing, and outdoor activities help support a healthy state economy November, 2018 Prepared for the Theodore Roosevelt Conservation
VALUES ASSOCIATED WITH THE APALACHICOLA BAY MARINE ECONOMY
 PBTC 03-3 VALUES ASSOCIATED WITH THE APALACHICOLA BAY MARINE ECONOMY By Alan W. Hodges and Charles Adams PBTC 03-3 March 2003 POLICY BRIEF SERIES INTERNATIONAL AGRICULTURAL TRADE AND POLICY CENTER MISSION
The Economic Impacts of Recreational Fishing in the San Antonio Bay System
 The Economic Impacts of Recreational Fishing in the San Antonio Bay System Prepared by Andrew Ropicki 1 Daniel Hanselka 2 Rebekka Dudensing 3 Rhonda Cummins 4 December 12, 2016 1 Assistant Professor and
The 2006 Economic Benefits of Hunting, Fishing and Wildlife Watching in TEXAS. Prepared by:
 The 2006 Economic Benefits of Hunting, Fishing and Wildlife Watching in TEXAS Prepared by: Southwick Associates, Inc. P.O. Box 6435 Fernandina Beach, FL 32035 Ph (904) 277-9765 Fax (904) 261-1145 Email:
2018 Annual Economic Forecast Dragas Center for Economic Analysis and Policy
 2018 Annual Economic Forecast Dragas Center for Economic Analysis and Policy PRESENTING SPONSOR EVENT PARTNERS 2 The forecasts and commentary do not constitute an official viewpoint of Old Dominion University,
A Threatened Bay: Challenges to the Future of the Penobscot Bay Region and its Communities
 A Threatened Bay: Challenges to the Future of the Penobscot Bay Region and its Communities 1 A A Threatened Bay: Challenges to the Future of the Penobscot Bay Region and its Communities In 1996 the Island
Economic Growth in the Trump Economy
 Economic Growth in the Trump Economy Presented to State Data Center Conference William F. Fox, Director November 18, 2016 GDP Grows, Though Slowly 10.0 8.0 Percentage Change, Previous Qtr, SAAR 6.0 4.0
Coastal and marine recreation in New England is ingrained in the region s economic and
 RECREATION Coastal and marine recreation in New England is ingrained in the region s economic and social fabric. Recreation on the ocean and coast includes many of New Englanders most time-honored and
Appendix G Coastal Demographic and Economic Trends Additional Figures
 Appendix G Coastal Demographic and Economic Trends Additional Figures Figure 1. Unemployment Rate in 1970-2004 18.0 16.0 14.0 12.0 10.0 8.0 6.0 4.0 1970 1972 1974 1976 1978 1980 1982 1984 1986 1988 1990
Integration of Sustainable Development on Long Island s Coastal Industries 1
 Integration of Sustainable Development on Long Island s Coastal Industries 1 Sheng Li, (lis@farmingdale.edu) Richard Vogel (vogelrm@farmingdale.edu) Nanda Viswanathan (nanda.viswanathan@farmingdale.edu)
RESEARCH Massachusetts Recreational Boater Survey. Project Summary
 Coastal and Marine Spatial Planning RESEARCH Project Summary 2010 Massachusetts Recreational Boater Survey The 2010 Massachusetts Recreational Boater Survey gathered spatial and economic data relating
British Columbia's Fisheries & Aquaculture Sector May 2001
 British Columbia's Fisheries & Aquaculture Sector May 2001 Ministry of Finance and Corporate Relations Table of Contents Introduction... 1 What s new in this report?... 1 Highlights... 3 1. Defining the
Independent Economic Analysis Board. Review of the Estimated Economic Impacts of Salmon Fishing in Idaho. Task Number 99
 IEAB Independent Economic Analysis Board Roger Mann, Chair Noelwah R. Netusil, Vice-Chair Kenneth L. Casavant Daniel D. Huppert Joel R. Hamilton Lon L. Peters Susan S. Hanna Hans Radtke Review of the Estimated
Socioeconomic Values of Reefs in Monroe County
 Chapter 6: Socioeconomic Values of Reefs in Monroe County This chapter describes the Socioeconomic Value of Artificial and Natural Reefs in Monroe County to residents and visitors. Monroe County includes
The 2006 Economic Benefits of Hunting, Fishing and Wildlife Watching in NORTH CAROLINA. Prepared by:
 The 2006 Economic Benefits of Hunting, Fishing and Wildlife Watching in NORTH CAROLINA Prepared by: Southwick Associates, Inc. P.O. Box 6435 Fernandina Beach, FL 32035 Ph (904) 277-9765 Fax (904) 261-1145
Gulf of Mexico Oil Spill
 Bulletin 1204 May 2013 Estimation of the Baseline for Assessment of Economic Impacts of the Gulf of Mexico Oil Spill on Mississippi s Commercial Fishing Sector Discrimination based upon race, color, religion,
Nevada County Population Projections 2015 to 2034
 Nevada County Population Projections 2015 to 2034 Prepared By: Jeff Hardcastle, AICP Nevada State Demographer Nevada Department of Taxation Reno Office: 4600 Kietzke Lane, Building L Suite 235 Reno, NV
Recreational Saltwater Fishing Industry Trends and Economic Impact January 2007
 Document was created exclusively for RISAA and the information contained herein is not to be disclosed without their expressed permission Recreational Saltwater Fishing Industry Trends and Economic Impact
The Economic Impact of Recreational Fishing in the Everglades Region
 The Economic Impact of Recreational Fishing in the Everglades Region Prepared for: The Everglades Foundation Prepared by: Tony Fedler, Ph.D. For the Bonefish and Tarpon Trust December 2009 Table of Contents
The economic value of the EU shipping industry. Andrew P Goodwin
 The economic value of the EU shipping industry Andrew P Goodwin 2 nd April 2014 Introduction Shipping is a vital facilitator of world trade 135 % Increase in world GDP in the last two decades 180 % Increase
THE ECONOMIC IMPACT OF RECREATIONAL SALTWATER FISHING ON THE LOUISIANA ECONOMY
 THE ECONOMIC IMPACT OF RECREATIONAL SALTWATER FISHING ON THE LOUISIANA ECONOMY By Loren C. Scott & Associates, Inc. 743 Woodview Court Baton Rouge, LA 70810 225-751-1707 lorencscott@aol.com for The Coastal
Texas Housing Markets: Metropolitan vs. Border Communities. September 22, 2014
 Texas Housing Markets: Metropolitan vs. Border Communities Luis Bernardo Torres Ruiz, Ph.D. Research Economist El Paso Branch Dallas Federal Rio Grande Economic Association September 22, 2014 Contents
The Economic Impact of Golf In South Carolina
 The Economic Impact of Golf In South Carolina By Dudley Jackson Research Director South Carolina Department of Parks, Recreation and Tourism For South Carolina Golf Course Owners Association April 2016
Economic Growth and Revitalization on Long Island: the Role of the Recreational Fishing and Marine Economy
 Economic Growth and Revitalization on Long Island: the Role of the Recreational Fishing and Marine Economy Sheng Li, Richard Vogel, & Nanda Viswanathan, Farmingdale State College Abstract Long Island s
The Changing Global Economy Impacts on Seaports and Trade Dr. Walter Kemmsies
 The Changing Global Economy Impacts on Seaports and Trade Dr. Walter Kemmsies Chief Economist, PAGI Group, JLL (Port, Airport & Global Infrastructure) Agenda Where are we in the cycle? What are the barriers
Recreational Fishing License Sales in Florida:
 Recreational Fishing License Sales in Florida: 1990-2000 1 Kristina Stephan and Chuck Adams 2 Introduction The recreational fishing industry is an important natural resource-based industry in Florida.
Nevada County Population Projections 2013 to 2032 Based On The Last Estimate Year of 2012
 Nevada County Population Projections 2013 to 2032 Based On The Last Estimate Year of 2012 Prepared By: The Nevada State Demographer s Office Jeff Hardcastle, AICP NV State Demographer University of NV
Bob Costello Chief Economist & Vice President American Trucking Associations. Economic & Motor Carrier Industry Trends. September 10, 2013
 Bob Costello Chief Economist & Vice President American Trucking Associations Economic & Motor Carrier Industry Trends September 10, 2013 The Freight Economy Washington continues to be a headwind on economic
Commercial Red Grouper Fishing in the Gulf of Mexico States
 Commercial Red Grouper Fishing in the Gulf of Mexico States According to NOAA Fisheries (https://www.fisheries.noaa.gov/species/red-grouper), the red grouper (Epinephelus morio) fishery in the Gulf of
Economic Impact Analysis BOONE DOCKS RESORT AND MARINA, LLC
 Economic Impact Analysis BOONE DOCKS RESORT AND MARINA, LLC Analysis conducted using the on-line Boating Economic Impact Model developed by Drs. Ed Mahoney (mahoneye@msu.edu), Dan Stynes (stynes@msu.edu)
The Economic Impacts of Carolina Beach Inlet Navigability
 The Economic s of Carolina Beach Inlet Navigability June 27, 2014 By: Chris Dumas, Ph.D. Department of Economics and Finance Cameron School of Business UNC-Wilmington 601 South College Road Wilmington,
The Economic Impact of Colonial Downs in Virginia
 The Economic Impact of Colonial Downs in Virginia Prepared for Revolutionary Racing January 31, 2018 1309 E Cary Street, Richmond, VA 23219 1025 Huron Road East, Cleveland, OH 44115 chmuraecon.com Table
Economic Analysis of Marine Recreational Fishing at NOAA Fisheries
 Economic Analysis of Marine Recreational Fishing at NOAA Fisheries Office of Science & Technology Sabrina Lovell Recreational Fisheries Economist March 8, 2017 Presented at EAA Seminar: Sustainable fisheries
Economic Impact of Lobster Sector - Province of New Brunswick and Its Counties
 Economic Impact of Lobster Sector - Province of New Brunswick and Its Counties Pierre-Marcel Desjardins Economist February 2007 Introduction This assessment seeks to quantify the economic impact of the
THE FUTURE OF SALES TAX REVENUE
 THE FUTURE OF SALES TAX REVENUE Presented by Adam Fulton, Senior Economic Associate The Outlook for Sales Taxes State governments rely on state sales taxes for more than a fifth of their revenue Economic
Future Global Trade Trends - Risks & Opportunities. Pulse of the Ports: Peak Season Forecast March 21, 2013
 1 Future Global Trade Trends - Risks & Opportunities Pulse of the Ports: Peak Season Forecast March 21, 2013 June 2012 Dr. Walter Kemmsies Chief Economist Summary Higher economic growth in 2013, possible
Population workforce, and employment in Florida :
 University of South Florida Scholar Commons College of Business Publications College of Business 1-1-2000 Population workforce, and employment in Florida : 1999-2000 University of South Florida. Center
Ohio Sea Grant ECONOMIC IMPACT OF LAKE ERIE ON NORTHERN OHIO. Ohio State University Sea Grant Program. AGI HDlOl. no.604. c.6
 Ohio Sea Grant ECONOMIC IMPACT OF LAKE ERIE ON NORTHERN OHIO LEROY J. HUSHAK, Ph.D. KOFI K. APRAKU, Ph.D. GEORGE W. MORSE, Ph.D. Department of Agricultural Economics and Rural Sociology The Ohio Agricultural
Economic Impact of the Michigan Equine Industry, 2006
 Economic Impact of the Michigan Equine Industry, 2006 Summary Animals and operations 155,000 equine animals housed in Michigan on June 1, 2007-86,000 at private residences - 21,000 at breeding farms -
15, 2015 EXECUTIVE SUMMARY
 Economic Contribution, Impacts, and Economic Benefits of Deer, Waterfowl and Upland Game Bird Hunting in North and South Dakota: Relationship to CRP Lands Dr. John Loomis and Dr. Michelle Haefele in cooperation
Economic Impact of Hunting Expenditures on Southern U.S
 Economic Impact of Hunting Expenditures on Southern U.S Jagdish Poudel (Corresponding author) Graduate Research Assistant Forest and Wildlife Research Center College of Forest Resource Mississippi State
FLORIDA S OCEANS AND COASTS: AN ECONOMIC AND CLUSTER ANALYSIS
 FLORIDA S OCEANS AND COASTS: AN ECONOMIC AND CLUSTER ANALYSIS MAY 2013 ii Table of Contents Preface List of Board Members Acknowledgments Executive Summary 1 Introduction..6 I. Economic Contribution of
ECONOMIC DEVELOPMENT ELEMENT
 ECONOMIC DEVELOPMENT ELEMENT Background The Economic Development Element considers labor force and labor force characteristics, employment by place of work and residence, and analysis of the community
Canadian Teleconference: Can the Canadian Economy Survive the Turmoil in the United States?
 Canadian Teleconference: Can the Canadian Economy Survive the Turmoil in the United States? Nigel Gault Chief U.S. Economist Dale Orr Canadian Macroeconomic Services Copyright 2008 Global Insight, Inc.
Telling Canada s story in numbers Elizabeth Richards Analytical Studies Branch April 20, 2017
 Recent Developments in the Canadian Economy: How have the decline in oil prices and a weaker Canadian dollar affected Canada s economy? www.statcan.gc.ca Telling Canada s story in numbers Elizabeth Richards
Seafood Industry. The 2012 Juneau and Southeast Alaska Economic Indicators 11/1/12 Page 60
 Seafood Industry In 2011, fishermen in Southeast landed 395,628,268 pounds of fish with an ex vessel value of $391,091,684. This harvest resulted in 272.6 million pounds of product, with a wholesale value
Southern California Economic Forecast & Industry Outlook
 2016-17 Southern California Economic Forecast & Industry Outlook Robert A. Kleinhenz, Ph.D. Sr. VP/Chief Economist, LAEDC February 17, 2016 Outline U.S. Economy California Economy Southern California Economy
2013 ECONOMIC IMPACT OF FLATS FISHING IN BELIZE
 2013 ECONOMIC IMPACT OF FLATS FISHING IN BELIZE Prepared for: Bonefish and Tarpon Trust P.O. Box 644257 Vero Beach, FL 32964 Prepared by: Anthony J. Fedler, Ph.D. Human Dimensions Consulting 9707 SW 55th
The Economic Gains from Reallocating Specific Saltwater Fisheries
 The Economic Gains from Reallocating Specific Saltwater Fisheries Produced for the: American Sportfishing Association By: Southwick Associates May 12, 2015 Executive Summary Allocation arrangements between
2.6 Dry Bulk, Break-Bulk, and Yachts and Vehicles Cargo Market Assessment
 2.6 Dry, Break-, and Yachts and Vehicles Cargo Market Assessment 2.6.1 Forecast Summary Annual cargo demand for dry bulk, break-bulk, yachts and vehicles was forecast under three scenarios (see Figure
2015 Economic Forecast & Industry Outlook. Robert A. Kleinhenz, Ph.D. Chief Economist, Kyser Center for Economic Research, LAEDC October 8, 2014
 2015 Economic Forecast & Industry Outlook Robert A. Kleinhenz, Ph.D. Chief Economist,, LAEDC October 8, 2014 Outline U.S. Economy California Economy Southern California Economy & Industries Five-Year Outlook
The U.S. Economy How Serious A Downturn? Nigel Gault Group Managing Director North American Macroeconomic Services
 The U.S. Economy How Serious A Downturn? Nigel Gault Group Managing Director North American Macroeconomic Services Growth Is Cooling; But a Soft Landing Is Likely (Real GDP, annualized rate of growth)
National and Virginia Economic Outlook Professor Robert M. McNab Dragas Center for Economic Analysis and Policy Strome College of Business
 National and Virginia Economic Outlook Professor Robert M. McNab Dragas Center for Economic Analysis and Policy Strome College of Business October 24, 2018 The forecasts and commentary do not constitute
Agriculture and the Economy: A View from the Chicago Fed
 Agriculture and the Economy: A View from the Chicago Fed March 3, 2016 Riverside, Iowa David Oppedahl Senior Business Economist 312-322-6122 david.oppedahl@chi.frb.org Federal Reserve System Twelve District
Current Hawaii Economic Conditions. Eugene Tian
 Current Hawaii Economic Conditions Eugene Tian Department of Business, Economic Development & Tourism At the PATA/TTRA 2016 Annual Outlook & Economic Forecast Forum February 3, 2016 Positive Signs in the
Trade Growth - Fundamental Driver of Port Operations and Development Strategies
 Trade Growth - Fundamental Driver of Port Operations and Development Strategies Marine Terminal Management Training Program October 15, 2007 Long Beach, CA Paul Bingham Global Insight, Inc. 1 Agenda Economic
Table of contents. Florida ranks as the second highest state (after California) in the number of people participating in wildlife-viewing recreation.
 in the number of people participating in wildlife-viewing recreation.") Acknowledgments This report examines the contributions of wildlife viewing to the Florida economy. Rob Southwick and Thomas Allen are the authors. This project was funded by the Florida Fish and Wildlife
Acknowledgments This report examines the contributions of wildlife viewing to the Florida economy. Rob Southwick and Thomas Allen are the authors. This project was funded by the Florida Fish and Wildlife
Economic Update and Prospects for 2019 Professor Robert M. McNab Dragas Center for Economic Analysis and Policy Strome College of Business
 Economic Update and Prospects for 2019 Professor Robert M. McNab Dragas Center for Economic Analysis and Policy Strome College of Business January 3, 2019 The forecasts and commentary do not constitute
State of American Trucking
 State of American Trucking October 11, 2018 Rod Suarez Economic Analyst American Trucking Associations rsuarez@trucking.org Business Cycles U.S. Expansions Duration October 1949 - July 1953 May 1954 -
Appendix H Recreation and Tourism (Chapter 8) Contents. List of Tables
 Contents. List of Tables") Appendix H Recreation and Tourism (Chapter 8) Contents Trends Data... H-2 CA DMV records... H-2 CA DFG Hunting/Fishing Licenses... H-2 USDA Agricultural Tourism... H-4 United States Forest Service... H-6
Appendix H Recreation and Tourism (Chapter 8) Contents Trends Data... H-2 CA DMV records... H-2 CA DFG Hunting/Fishing Licenses... H-2 USDA Agricultural Tourism... H-4 United States Forest Service... H-6
The Economic Value of Federal Public Lands
 The Economic Value of Federal Public Lands Ver. 5-15-18 Outline Federal Lands Have Many Values Context: The U.S. Economy Context: The West s Economy A Theory of Rural Development The Role of Federal Lands
U.S. and Colorado Economic Outlook National Association of Industrial and Office Parks. Business Research Division Leeds School of Business
 U.S. and Colorado Economic Outlook National Association of Industrial and Office Parks Presented by the Business Research Division Leeds School of Business University of Colorado at Boulder U.S. Economic
Re: Algae/Cyanobacteria Bloom in St. Lucie, Martin, Palm Beach and Lee Counties.
 July 18, 2016 Richard L. Scott Governor, State of Florida 400 S Monroe St Tallahassee, FL 32399 Re: Algae/Cyanobacteria Bloom in St. Lucie, Martin, Palm Beach and Lee Counties. Dear Governor Scott: I am
The economic significance of the Gulf of Mexico related to population, income, employment, minerals, fisheries and shipping
 MPRA Munich Personal RePEc Archive The economic significance of the Gulf of Mexico related to population, income, employment, minerals, fisheries and shipping Emilio Hernandez-Hernandez and Charles Adams
 www.colorado.edu/leeds/brd CAREER ADVANCING DEGREES FROM LEEDS EVENING MBA PROGRAM FOR WORKING PROFESSIONALS #1 PART-TIME MBA Program in Colorado according to U.S. News & World Report Engage in a collaborative
Economic Contribution of Off-Highway Vehicle Recreation in Colorado. Executive Summary Season. A joint cooperation report
 Economic Contribution of Off-Highway Vehicle Recreation in Colorado Executive Summary 2014-2015 Season A joint cooperation report Page intentionally left blank to accommodate double-sided printing December
OR DUNGENESS CRAB FISHERY:
 E 55 OR DUNGENESS CRAB FISHERY: an economic analysis of productivity and profitability David S. Liao Joe B. Stevens OREGON STATE UNIVERSITY SEA GRANT COLLEGE PROGRAM Publication no. ORESU-T-75-005 AGRICULTURAL
The Economics of Atlantic Highly Migratory Species For-Hire Fishing Trips July - November 2013 Clifford Hutt and George Silva
 The Economics of Atlantic Highly Migratory Species For-Hire Fishing Trips July - November 2013 Clifford Hutt and George Silva U.S. Department of Commerce National Oceanic and Atmospheric Administration
North American Forging Shipment Forecast (Using FIA bookings information through December 2013)
") North American Forging Shipment Forecast 2014-2018 (Using FIA bookings information through December 2013) Percent Change Year Ago Best leading indicator combination for impression die bookings used to
North American Forging Shipment Forecast 2014-2018 (Using FIA bookings information through December 2013) Percent Change Year Ago Best leading indicator combination for impression die bookings used to
By making use of SAFRIM (South African Inter-Industry Macro-Economic Model) By Jeaunes Viljoen, Conningarth Economists, 1
 By Jeaunes Viljoen, Conningarth Economists, 1") By making use of SAFRIM (South African Inter-Industry Macro-Economic Model) By Jeaunes Viljoen, Conningarth Economists, South Africa 10/13/2011 1 1960: The economy experienced high growth rates mining
By making use of SAFRIM (South African Inter-Industry Macro-Economic Model) By Jeaunes Viljoen, Conningarth Economists, South Africa 10/13/2011 1 1960: The economy experienced high growth rates mining
Bob Costello Chief Economist & Vice President American Trucking Associations. Economic & Motor Carrier Industry Update.
 Bob Costello Chief Economist & Vice President American Trucking Associations Economic & Motor Carrier Industry Update February 26, 2013 The Worst Recession Since the Great Depression 0% Loss from Peak
Transitions: 2019 Economic Forecast for Metro Denver February 6, 2019
 Transitions: 2019 Economic Forecast for Metro Denver February 6, 2019 Prepared by: Can Stock Photo / jkirsh In Partnership with: Consumer Changes and Influences Slowing population growth Aging of the population
More of the Same; Or now for Something Completely Different?
 More of the Same; Or now for Something Completely Different? C2ER Place cover image here Richard Wobbekind Chief Economist and Associate Dean for Business and Government Relations June 14, 2017 Real GDP
Big Blue Adventure Event Analysis UTC Tourism Center October 2016
 A report summarizing Big Blue Adventure events economic impact on the Lake Tahoe region as well as participants assessments of their event experience Big Blue Adventure Event Analysis UTC Tourism Center
THE BLUE SKY REPORT A KERRIGAN QUARTERLY. Third Quarter 2018 December 2018
 THE BLUE SKY REPORT A KERRIGAN QUARTERLY Third Quarter 2018 December 2018 Contact Erin Kerrigan: (949) 439-6768 erin@kerriganadvisors.com Contact Ryan Kerrigan: (949) 728-8849 ryan@kerriganadvisors.com
Economy On The Rebound
 Economy On The Rebound Robert Johnson Associate Director of Economic Analysis November 17, 2009 robert.johnson@morningstar.com (312) 696-6103 2009, Morningstar, Inc. All rights reserved. Executive
10 County Conference. Richard Wobbekind. Executive Director Business Research Division & Senior Associate Dean Leeds School of Business
 10 County Conference Richard Wobbekind Executive Director Business Research Division & Senior Associate Dean Leeds School of Business Hmm... (http://myfallsemester.blogspot.com) Real GDP Growth Percent
Sport Fishing Expenditures and Economic Impacts on Public Lands in Washington
 Sport Fishing Expenditures and Economic Impacts on Public Lands in Washington For: Northwest Sportfishing Industry Association By: Southwick Associates Released June 2015 PO Box 6435 Fernandina Beach,
Lower Fryingpan River and Ruedi Reservoir Economic Impact Study
 Lower Fryingpan River and Ruedi Reservoir Economic Impact Study July, 2015 Martin Shields, Colorado State University Martin.Shields@colostate.edu John Loomis, Colorado State University Rebecca Hill, Colorado
PROVINCE OF SASKATCHEWAN INVESTOR PRESENTATION
 PROVINCE OF SASKATCHEWAN INVESTOR PRESENTATION May 2018 THE SASKATCHEWAN DIFFERENCE Economic Stability Diversified economy balances cyclicality of resources Growing population Majority government with
MAINTAINING MOMENTUM:
 MAINTAINING MOMENTUM: 2018 National Economic Update September 12, 2018 noun mo men tum \ mō-ˈmen-təm, mə- \ 1 b : the strength or force that allows something to continue or to grow stronger or faster as
SACO RIVER AND CAMP ELLIS BEACH SACO, MAINE SECTION 111 SHORE DAMAGE MITIGATION PROJECT APPENDIX F ECONOMIC ASSESSMENT
 SACO RIVER AND CAMP ELLIS BEACH SACO, MAINE SECTION 111 SHORE DAMAGE MITIGATION PROJECT APPENDIX F ECONOMIC ASSESSMENT Department of the Army New England District, Corps of Engineers 696 Virginia Road
2014 Economic Indicators, Trends & Observations. 51 South Main Street Janesville, WI P F RockCountyAlliance.
 2014 Economic Indicators, Trends & Observations 51 South Main Street Janesville, WI 53545 P.608.757.5598 F.608.757.5586 RockCountyAlliance.com Indicators, Trends & Observations National Level State of
Noah Williams. University of Wisconsin-Madison Center for Research On the Wisconsin Economy (CROWE) Outlook for the Wisconsin Economy
 Outlook for the Wisconsin Economy") An Noah University of Wisconsin-Madison Center for Research On the Wisconsin Economy (CROWE) CROWE: Brief Introduction Center for Research on the Wisconsin Economy (CROWE) recently established in the Department
An Noah University of Wisconsin-Madison Center for Research On the Wisconsin Economy (CROWE) CROWE: Brief Introduction Center for Research on the Wisconsin Economy (CROWE) recently established in the Department