THE SUMMER MIGRATION OF THE CISCOI LEUCICHTHYS ARTEDI (LE SUEUR), IN LAKE NIPISSING I ONTARIO
|
|
|
- Coral Ward
- 6 years ago
- Views:
Transcription


1 \llni"ersit of 1toronto Stubtes :raiological Series, 'lro. 44 I I THE SUMMER MIGRATION OF THE CISCOI LEUCICHTHYS ARTEDI (LE SUEUR), IN LAKE NIPISSING I ONTARIO By F. E. J. FRY (From the Department of Biology, University of Toronto) PUBLICATIONS OF THE ONTARIO FISHERIES RESEARCH LABORATORY, No. 55 TORONTO THE UNIVERSITY OF TORONTO 1937 PRESS


2 CONTENTS Abstract. Introduction. Acknowledgements. Description of lake Nipissing. Morphometry. Temperature conditions. Oxygen depletion in the hypolimnion. Fishes associated with the cisco in lake Nipissing. Material and methods. Description of the cisco found in lake Nipissing. Method of sampling. Localities sampled. Treatment of samples :. Scale reading. The reliability of gill net catches. Vertical distribution from May to October. In trod uction catches catches. Causal agents of the summer migration. Horizontal distribution. Summer distribution in other lakes. The relation of age to vertical distribution. Distribution of yearlings and fingerlings. The relation of sex to vertical distribution. Bottom samples. Vertical samples at station 4. Changes in sex ratios in catches at station 3. Early catches in shallow water. Ann ua I diff I erences 10.. migratory activity... Feeding activity. In trod uction Feeding in shallow water. Feedi deep water. Comparison of the feeding activities in the three size groups. PAGE


3 The relation of the summer migration to growth. Introduction. Seasonal growth. General growth curve of the population Relation between feeding activity in the hypolimnion and rate of growth. Relation of the summer migration to Lee's phenomenon. A possible relation between the summer migration and the development of the germ cells. Summary. Discussion. Bibliography. Appendix 1 Distribution of fish in oblique catches. Appendix 2 Statistical procedures. PAGE TABLES PAGE Percentage of the area of lake Nipissing below certain depths Summary of certain characters of lake ipissing ciscoes, expressed in thousandths of the standard length Yardage of nets used in standard strings set on bottom Number of ciscoes taken in comparable fishing effort under similar circumstances Relation of light to the capture of ciscoesby gill nets 20 Vertical distribution of ciscoes taken in Numbers of ciscoes taken in oblique series at station 3, Ciscoes taken in oblique series at station 4, Size composition of catches of ciscoes taken in oblique series at station 4 " 88 Age differences in the rate of asphyxiation of Mexican sword tails subjected to carbon dioxide Sex ratios at station Annual differences in the migration of the ciscoes to the hypolimnion Comparison of feeding activity in the hypolimnion in different size groups of ciscoes taken July 23-26, Growth of various age groups of lake Nipissing ciscoes during the season of open water The average size in mm. attained by different age groups of lake Nipissing ciscoes during the years 1931, 1932, 1933, and The percentage of feeding and non-feeding fish in the oblique series at station 4, July 23-26, Grouped according to age Average lengths in mm. of feeding and non-feeding fish in different age groups, taken at station 4, July 23-26,


4 PAGE 18. Calculated and observed lengths of ciscoes caught on bottom at station 4 in the years 1932, 1933, and 1934,.,, Comparison of calculated lengths at the first nnulus in ciscoes of the same year classes captured In deep and shallow water in Scale diameters in shallow and deep water catches, Condition of the ovaries in three samples of ciscoes taken at the spawning season in lake Ontario in FIGURES PAGE 1. Map of lake ipissing showing depth contours at 15 foot intervals Oxygen depletion at 150 feet during the summers of the years inclusive. After Corkill Diagram showing method of setting nets obliquely Diagram showing localities sampled by net settings Map of the area of lake Nipissing fishedin Sketch map of the region at the head of the French river Vertical distribution of ciscoes taken in oblique series in Numbers of ciscoes taken in gill nets plotted in relation to season, depth, and temperature. Temperatures from Corkill Numbers of ciscoes taken in surface nets in 1932 and Seasonal changes in the horizontal distribution of ciscoes in Jake ipissing Changes in age composition in catches taken at station 3, Changes in length composition in catches of ciscoes taken on the bottom at station 4, Seasonal changes in the length and age composition in ciscoes taken on the bottom, station 4 and vicinity, 1933 and Seasonal changes in vertical distribution in ciscoes of different lengths at station 3, Seasonal changes in vertical distribution in ciscoes of different lengths at station 4, Changes in length composition in vertical samples of ciscoes taken at station 4, Vertical distri bution of zero- and one-group ciscoes in August Changes in length and sex composition in catches of ciscoes taken at station 4,


, IN LAKE NIPISSING, ONTARIO ABSTRACT In lake Nipissing there is a general migration")


5 PAGE Changes in the relative numbers of males and females in ciscoes longer than 20 em. taken III oblique series at station 4, Changes in length and sex composition in catches of ciscoestaken in oblique series at station 4, , 50 Vertical distribution of ciscoes with and without stomach contents at station 4, Probable temperature experience of certain groups of ciscoes in Growth of various age groups of lake Nipissing ciscoes Scales of two ciscoes of the 1933 year class illustrating the summer check. X 20.ca :. :, 64 Average length attained by ciscoes ot different age groups captured in the hypolimnion in the years inclusive Average lengths of feeding and non-feeding ciscoes in different age groups taken at station 4, July 23-26, Rate of growth of the eggs in the ovary of the lake Nipissing cisco THE SUMMER MIGRATION OF THE CISCO, LEUCICHTHYS ARTEDI (LE SUEUR), IN LAKE NIPISSING, ONTARIO ABSTRACT In lake Nipissing there is a general migration of the cisco population from shallow to deeper water in late spring and early summer which takes the fish participating in it below the thermocline. The fish remain in the hypolimnion for some time, scattering downwards. During late August and early September they rise from the bottom and concentrate under the thermocline. Most of them pass through the thermocline and return to shallower water before the autumn turnover. The downward movement is correlated with rising temperatures in the epilimnion until the fish have passed through the thermocline. Their continued descent is probably due to random dispersion. The subsequent ascent from the bottom is correlated with a depletion of the dissolved oxygen and an increase in the carbon dioxide in solution in the bottom water. This ascent from the bottom results in a concentration of the population immediately under the thermocline. The population ultimately moves upward when the balance between the opposing effects of high epilimnial temperatures above and unfavourable concentrations of dissolved gases below is destroyed by the continued cooling of the epilimnion and further stagnation in the hypolimnion. An orderly succession of certain groups of individuals is apparent III the migration. The largest males migrate downward earliest. These are followed by the largest females and by large males and so on. The two youngest age classes are the last to move downwards and their migration is never so complete as that of the older groups. The pattern of the upward movement is more complicated. Quite large but by no means the largest fish pierce the thermocline earliest; the order of leaving subsequent to this involves fish both above and below the intermediate sized group which left first. The smallest fish leave late and the last of all to go are the largest males. This order of migration has been explained as being the result of a decrease with age of tolerance towards the factors initiating migration. Profound changes in feeding activity are correlated with the summer migration. The ciscoes apparently stop feeding just prior to migrating below the thermocline and may not begin feeding again for six weeks or longer. The length of time during which they do not feed varies with the time at which they migrate. When the fish leave the hypolimnion in late summer they again stop feeding for an undetermined length of time. The migratory and feeding activities of the individual are related to its rate of growth. Certain individuals found to be feeding in the hypolimnion in July grow more quickly than fish of the same age and sex which are not feeding there at that time. The proportion of the members of a year class which feed in the hy.polimnion in July increases as the year class becomes older. Correlated with t'sincrease in feeding activity there is a general acceleration of growth in the higher age groups. INTRODUCTION The cisco, Leucichthys artedi (Le Sueur), has been the subject of much investigation. Studies on its rate of growth and other phases of its life-history have been contributed by numerous authors, and its variation in form has also received considerable attention. The great gap in our present know- 9


6 10 SUMMER MIGRATION OF THE CISCO ledge of this species lies in the lack of precise information of its habits, and the relation that these habits bear both to the great variation in growth rate of this species in different lakes, and to its proverbial diversity of form. During the years 1929 to 1935 inclusive, when the Ontario Fisheries Research Laboratory, of the University of Toronto, had a field station on lake Nipissing, an opportunity was afforded for some work on the variation and on the movements and feeding activities of the cisco. Our attention was not directed towards a study of the migration until after a considerable amount of preliminary work had been done. When Professor J. R. Dymond first visited the station in 1930, he was struck by the great variation in form exhibited by the ciscoes in lake Nipissing. It seemed to him that this circumstance might afford a suitable opportunity for an investigation which might provide some insight into the problem of raciation in this species. During the first two seasons, ciscoes, taken in routine net settings which were being carried on as part of a general ichthyological survey of the lake, were selected without reference to their systematic characters. Professor Dymond measured various characters of these fish, commonly considered of taxonomic importance. It was found that there was a wide variation in the proportions of certain parts. For instance, the relative length of the head covered 65 per cent. of the total range of this character found by Koelz (1931) in the type races of the twenty-four subspecies recognized by him. On this basis one would expect to find at least two or three subspecies in lake Nipissing. However, in a preliminary study of the taxonomic material, no facile interpretation presented itself. Although the total range of variation was great the distribution was, on the whole, unimodal. Further, no consistent differences could be detected between samples from different localities, nor could samples from one locality be relied on to exhibit consistently the characters of one particular section of the total range of variation. From these findings it was concluded that study of the 46 1' 79")0 ;0 <0 r '1'.!l.t 2.5 :! <!\... '"


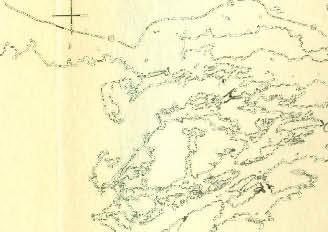
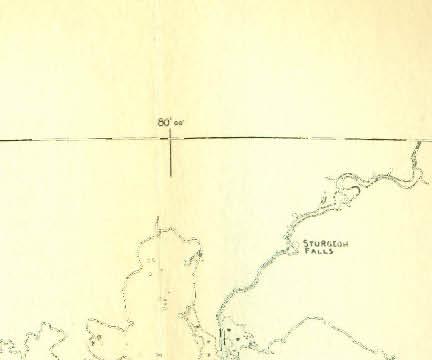
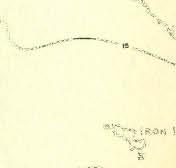
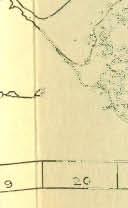
7 j " 4 '.' MIL e N ==I:==;:==l::===i:;:C:=.;::::;:r::::::::14::::::::=-fO 15 foot intervals. 9. depth contours at FIGURE 1.-Map 0 flake Nipissing showing

eal( 0")


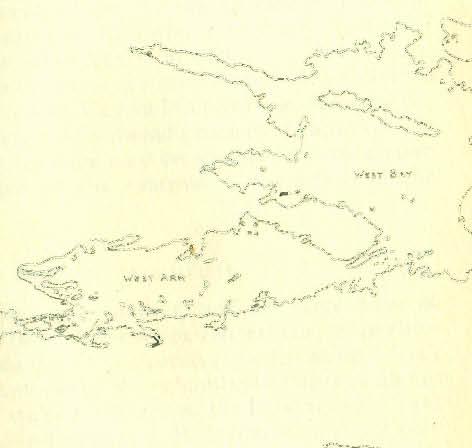


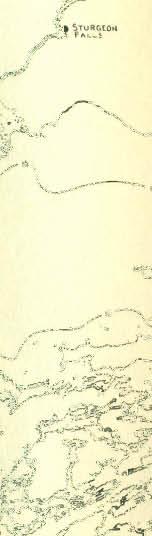

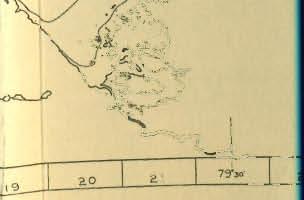
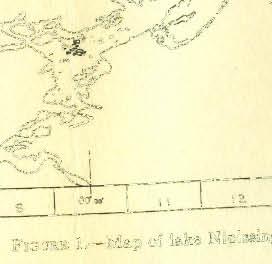

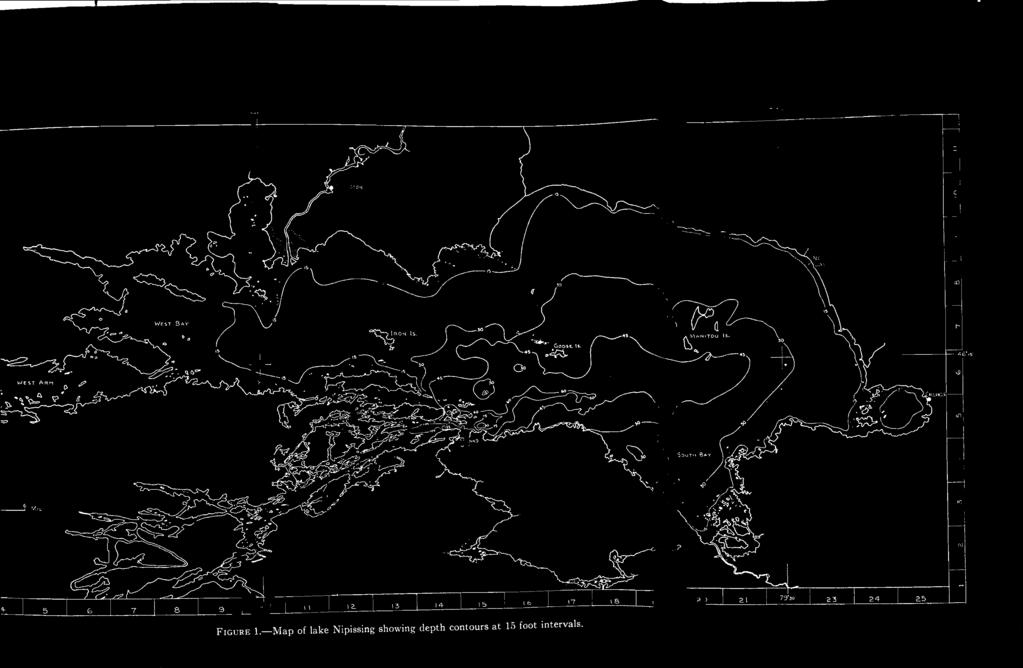
8 80'00' 7'5>. lio 46,,' ')eal( 0 t 2.,., MII..t. PI!.lP"RlO I!l'..I, U O "'Hlo... OR..A. 1'0\ &'t E 8 S La",,[.1'\. _ I 4 I, ldl---od J-"-r-\ -'2.-I 13 I 14 I:' I 1& 1 " FIGURE 1.-Map of lake Nipissing showing depth contours at 15 foot intervals.


9 SUMMER MIGRATION OF THE CISCO 11 racial problem could not be centred solely on the accumulation of proportional measurements. For this reason further work was devoted to the investigation of the ecology of the species rather than to the mere acquisition of specimens, since it was felt that a programme which would allow the systematic characters to be examined in the light of a knowledge of the habits of the population would be likely to yield a more fundamental contribution to the taxonomic problem. This, then, was made our main object of study from 1932 until the end of the investigation in The present report covers our knowledge of the activities of the population between May and October and discusses the relation of our findings to the broad problem of raciation. It is hoped that these findings may be applied later to a more critical consideration of the systematic characters of the individuals. ACKNOWLEDGEMENTS The considerable array of gear, and the large mass of material that must be worked over in a short time, render any investigation of this type a co-operative undertaking. I am very pleased to acknowledge the valuable assistance of all my colleagues and of various visitors to the Laboratory. I am especially indebted to Professor J. R. Dymond, who not only suggested the problem, but who also gave freely of his guidance and assistance, and to Mrs. Dymond for the hours she spent in recording data. To Professor W. J. K. Harkness, Director of the Laboratory, I owe my thanks for support during the past seven years. I should also like to express my pleasure in my good fortune in having so generous a colleague as Dr. R. R. Langford. During the summer of 1935, although he was occupied with a heavy programme of his own, I was able to enlist his cooperation in work which involved the examination of some 6,000 fish. The physical chemical data presented here are largely the result of investigations by Dr. G. H. W. Lucas and Dr.


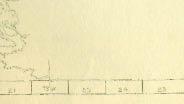
 shows the depth contours in intervals of 15 feet, and the proportions of different depth zones")
.1 TABLE I.")
.")


10 12 SUMMER MIGRATION OF THE CISCO J. M. B. Corkill, and have been taken in part from their original records, and in part from Dr. Corkill's manuscript report. Finally, I should like to acknowledge my indebtedness to Dr. R. O. Hile and Dr. John VanOosten of the United States Bureau of Fisheries, who have been kind enough to give the manuscript a very thorough and constructive criticism. DESCRIPTION OF LAKE NIPISSING Morphometry Lake Nipissing lies in the Precambrian shield, lat. 46 N. long. 79 W., at an elevation of 640 feet. The lake has an area of 345 square miles. In shape it is long and narrow; the long axis extends east and west for some 50 miles while it is on the average less than 12 miles wide. Lake Nipissing is rather shallow, the western half being almost uniformly less than 15 feet deep. The accompanying map (figure 1) shows the depth contours in intervals of 15 feet, and the proportions of different depth zones are given in table 1. It will be noted that only about one-half of one per cent. of the lake is over 75 feet deep. This deep water is all found in the vicinity of the source of the French river ([15, 5], figure 1).1 TABLE I.-Percentage of the area of lake Nipissing below certain depths. Percentage Depth Temperature Conditions Temperature records for a number of years are shown in figure 8 (p. 29). The ice leaves the lake in late April or "The co-ordinates given on the map should be noted since these will.be referred to throughout this paper in locating stations and in designating specific localities thus--([15. 5]. figure 1), the abscissa being given first. SUMMER MIGRATION OF THE CISCO 13 early May. Thermal stratification begins in May, is well established by the end of June, and persists until October. The bottom temperature in summer varied between 8 and lo e. during the years that observations were made. The maximum surface temperature was about 24 e. Oxygen Depletion in the Hypolimnion During the period of thermal stratification the oxygen depletion in the hypolimnion is marked, and at the bottom 7 "' 6- '\. '\. s S -4 J or 4 "-..'. :i :. u "'-.. b "'-,,: -...:.<>\. 2.t--... o_ x ' : -----\---.. " o JUNE AUGUST JULY SEPT. FIGURE 2.-oxygen depletion at 150 feet during the summers of the years inclusive. After Corkill. (150 feet) the dissolved oxygen drops to between one and two cc./i. in September (figure 2). Coupled with the decrease in Oxygenis an increase in carbon dioxide which reaches concentrations higher than 15 parts per million. Fishes Associated with the Cisco in Lake Nipissing The following is an annotated list of some of the species of fihtaken in the gill nets during the course of collecting the ClSCoes.
, common whitefish.")
, common sucker.")

, yellow perch.")
, yellow pike-perch.")


 measurements for lake Ontario and with those of Koelz (1929, 1931), of")

![g Males 10 10 10 10 10 10 10 10 10 9 CI) 0.0 '"....., ] Caudal peduncle..&::..&::..&::..&::..&:: 1:.f 0. 0..0. ] "0....&::..&:: :: ] '" 1J ='>- >-.](/docs-images/71/65529186/images/11-13.jpg ". 1ll_.B $ $ >- 0\"8 \"8 &:: 0 o.")


11 14 SUMMER MIGRATION OF THE CISCO Acipenser fulvescens Rafinesque, sturgeon. The sturgeon has been taken with ciscoes in early spring and late fall. Coregonus clupeaformis (Mitchill), common whitefish. In summer the whitefish occurs in association with the cisco in moderate depths, occasionally found in the hypolimnion. Catostomus commersonii (Lacepede), common sucker. The sucker is also associated with the cisco in shallow water in spring, early summer, and autumn. Esox lucius Linn., pike. Pike are taken along with ciscoes in the same seasons as are the perch and the pike-perch. At these times they feed on the ciscoes to such an extent that it is difficult to obtain good specimens in the smaller size classes, since the pike either steal them from the nets or slash them badly. Perea flavescens (Mitchill), yellow perch. Perch are found commonly with ciscoes during spring and early summer, and in the autumn. Stizostedion vitreum (Mitchill), yellow pike-perch. This species is taken abundantly with ciscoes in spring and early summer, and again in the autumn. Large pike-perch feed on fingerling ciscoes during August, just above the thermocline. In one year, 1932, a few large pike-perch were taken in the hypolimnion. Lota maculosa (Le Sueur), ling. The ling is taken frequently with the ciscoes in the hypolimnion and in the shallow water in early spring. The cisco forms a considerable portion of the summer food of the ling. This does not exhaust the list of species found in lake Nipissing. It is given merely to provide some idea of the fish associated with the cisco in this lake. MATERIAL AND METHODS Description of the Cisco Found in Lake Nipissing A summary of certain systematic characters of the lake Nipissing cisco is given in table 2. These measurements were made by Professor J. R. Dymond and have been compared SUMMER MIGRATION OF THE CISCO 15 with his measurements of the ciscoes of lake Nipigon (Dymond, 1926), lake Abitibi (Dymond and Hart, 1927), and western Canada (Dymond and Pritchard, 1930). They have also been compared with Pritchard's (1931) measurements for lake Ontario and with those of Koelz (1929, 1931), of the ciscoes of the great lakes, and of other lakes of north-eastern America. TABLE.2.-Summary of certain characters of lake Nipissing ciscoes expressed In thousandths of the standard length. ' -;i <::: '0.g Males CI) 0.0 '"....., ] Caudal peduncle..&::..&::..&::..&::..&:: 1:.f ] "0....&::..&:: :: ] '" 1J ='>- >-.. 1ll_.B $ $ >- 0"8 "8 &:: 0 o.... Jjlll III j Q Q';: & & & & & & & & & & Females & & & & & & & & & parf the subspecie of L. artei, the ipissing ciscoes comh most closely WIth L. artedi wagneri which Koelz (1931) is:ndescribed from Tomahawk lake, Wisconsin, but the Nipi i g.fish row faster and reach a much larger size. The th P ss.m ciscoes also resemble strongly the species Leucichys mpgon Koelz (cf. Dymond, 1926), differing most in hav-


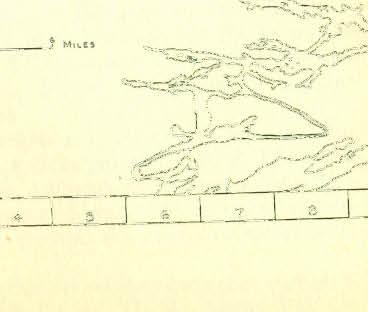
12 16 SUMMER MIGRATION OF THE CISCO ing a lower gill raker count. Despite this similaiy we prefer not to identify the Nipissing ciscoes with L. n.g?nfor the present. In view of the resemblance of the Nipissing fish to both L. artedi wagneri and L. nipigon, it is felt th.a the 'p ro?- lern of the relationship of the species artedi and mgon 1Sstill an open question. The variation of the characters of artedi from lake to lake is so great as to render it impossible at present to make satisfactory infraspecific identifications. For this reason w.eprefer to describe the Nipissing form without naming it, hoping tht this description, together with an outline of its ecology, wi.ll allow some future worker to assign it to its proper raxonormc position. Method of Sampling This study was carried out by exploring the lake with some 200 gill net settings. The mesh of the gill nets ranged in size from about % to 5 inches stretched mesh. The smallest mesh was made of milliner's net ordinarily used in trimming women's hats. This net was used succ:ssfully in takig fingerling ciscoes. Hung between two 1U inch meshed g111 nets for protection, it proved to be quite durable and was fished for three seasons. The nets were set in various ways--on bottom in the conventional manner, floated at the surface between two buoys, floated at some point intermediate between bottom and surface, or set obliquely from bottom to surfce. When setting on bottom it was customary to use a senes of 50 yard nets with mesh ranging from 1U to 5 inches. The surface and intermediate sets consisted of only one 50 yard net. In the oblique sets each stratum was fished once by a small, an intermediate, and a large meshed net. Table 3 gives particulars of the two series most commonly used in bottom fishing. Details of the oblique series are given in appendix l. TABLE 3.-Yardage of nets used in standard strings set on bottom. Stretched mesh in inches I! ! 2t 3 3! 4 4! 5 String String SUMMER MIGRATION OF THE CISCO 17,.q"CJ, \ 0,. \ I;., \ \ \, \ \, FIGURE 3.-Diagram showing method of setting nets obliquely. Localities Sampled The accompanying chart shows in black the localities where fishing was carried on. Sampling was done most intensively at stations selected to cover the range in depth found in the lake. Where the bottom was uniform over great distances, a few widely-spaced samples were taken to determine to what extent the samples at a single station were representative of the total zone. / '::!.. "0,., I» ID "- IL-.... III ri-t-r-r d-\ r-t-r-r-r-r n ' :3 4 :s ts " scale f mdgs FIGURE 4.-Diagram showing localities sampled by net settings. - J II!


13 18 SUMMER MIGRATION OF THE CISCO Treatment of Samples Ciscoes which were taken were weighed and sexed; stomach contents were preserved; and the fish were subjected to various measurements. The only measurement discussed here is the standard length in millimetres. This measurement was taken from the tip of the snout to the end of the vertebral column and was made on a wooden measuring board. Several scales, from just below the lateral line, beneath the anterior margin of the dorsal fin, were taken from each fish measured after Four scales were mounted in glycerinewaterglass." The scales thus mounted were read by the use of a Leitz projector, and a tracing of the boundaries of the annuli along the antero-posterior diameter was preserved on a filing card. The glycerine-waterglass mount has optical properties that are superior to those of glycerine-gelatine but the mount is not permanent. The medium crystallizes with age and becomes opaque, first at the edges, and progressively towards the centre of the mount. In mounts three years old considerable encroachment has already taken place. Scale Reading There is little that the present writer can add to Van- Oosten's work on the reading of cisco scales, which has been followed closely in the handling of the Nipissing material. In the present study certain "false annuli", particularly in the first two years of growth, were very marked. Evidence concerning the causes of these accessory checks will be presented later in the paper. During the investigation a chance observation which may be of some interest was made on the speed with which scales regenerate. One fish was taken which had a rather severe wound on the caudal peduncle just behind the anus. It was barely healed over and the wound still showed red through the new skin, but new scales, with two circuli laid down, were already formed. Scales from fish captured in early spring place the date of 2Six volumes of waterglass to one volume of glycerine. SUMMER MIGRATION OF THE CISCO 19 the completion of the annulus, or rather of the initiation of the new season's growth, at some time in May. The Reliability of Gill Net Catches Much of the subsequent argument is based on the assumption that there is a strong positive correlation between the numbers of fish taken by a given gill net fished for a fixed period of time, and the concentration of fish in a given locality. There would seem to be considerable evidence that such a correlation exists. Data on the number of fish taken by fishing equivalent amounts of net in the same locality, simultaneously, or on consecutive nights (table 4), show that there is a fairly good agreement between the pairs of settings. TABLE 4.-Number of ciscoes taken in comparable fishing effort under similar circumstances. Set 1 Set Evidence such as is given in table 4, while indicating that the net catches bear some relationship to the number of fish in a given locality at a certain time, does not show that the fish themselves are distributed randomly throughout a given stratum, either as individuals, or in small freely wandering schools. However, the surface catches, where a net left out for long periods was cleared daily, show that in one locality t?ere is a definite trend in the number taken, which is consistent with the belief that the numbers taken are not due to erratic movements of large schools (figure 9, p. 30)...The results of the oblique series, by their consistency, also ludlcate both that numbers taken are proportional to the numbers present, and that the population exhibits a definite movement. Since different meshes were fished in different trata on the three nights of the series, a certain amount of lterest was taken in plotting the results of the first two ;l ghts for a given mesh, and predicting the third night's catch rom these. The predictions were reasonably accurate.


14 20 SUMMER MIGRATION OF THE CISCO The correlation between catch and population need not necessarily be a linear one, and in all likelihood it is not. Gill net fishing, which requires the fish to come in contact with the net, must depend on the activity of the fish.!his activity may vary because of many factors. The analysis of stomach contents (Langford, 1938) shows, for example, that when food is scarce the fish apparently are more active in seeking it. This condition would probably increase the number of fish taken, relative to the number present. Temperature probably also influences activity, but no evidence of this is available. Further, fish apparently avoid gill nets under certain circumstances. The following example (table 5) shows that they may do so in daylight. In the daytime no small fish were taken. Medium and large fish were taken in the bottom stratum in numbers comparable to those taken at night. In the 15 to 20 foot stratum a few medium and large fish were taken and a single large fish was taken at the surface. This evidence would indicate, unless of course fish leave the locality in the daytime, that the fish avoid the nets in water down to 30 feet in the light, and even below this depth if the mesh is close, as it is in a 1 inch mesh. TABLE5.-Relation Depth of light to the capture of ciscoes by gill nets. Number taken of the lengths indicated 2Ocm. 25 cm. Feet and less em. and greater 0-15, _ night day night day 30-bottom night o day Again when some fish are enmeshed others may avoid the net. Hile (1935) has shown that in commercial fishing, much higher returns can be obtained from clearing nets at short intervals of time. Here, however, this factor has been neglected in comparing catches where the time for which the nets were fishing differs. In these cases a simple ratio based SUMMER MIGRATION OF THE CISCO 21 on the length of the fishing period has been employed to correct the inequality." Due to the selectivity of gill nets (for a review of the literature and data on L. artedi see Hile, 1936; see also Tester 1935), changes in size composition also affect the relative number of fish taken by a standard graded series of gill nets due to the difference in the efficiencyof each net for each size class. The effect of size composition has also been disregarded in the present discussion because of its complexity. VERTICAL DISTRIBUTION FROM MAY TO OCTOBER Introduction In 1934 and 1935 the summer movements of the cisco population were followed in some detail. This migration consists of a progressive movement of the population from shallower to deeper water during the months of May, June, and July. In August most of the ciscoes are concentrated in the restricted hypolimnion. In late summer they 'pass upward through the thermocline and reappear in shallow water. I934 Catches In 1934 settings were made from the beginning of May wen the lake was still largely covered with ice, until the mlddle.of September. In this fishing, bottom, surface, or intermediate, nets (see p. 16) were set at the stations whose positions are plotted on the accompanying maps (figures 5 and 6). These stations were considered to be representative of the range of depths found in the lake except for the large area of shallow water at the western end which is less than 15 feet deep. abo STATIONI.-The channel at the head of the French river. A setting in t 7 feet of water was made here on May 2; this location was chosen mainly use It was part of the small area free of ice at that time. 'ust STATION2.-About a quarter of a mile to the north and east of station 1 h bouth of the e.astern Blueberry island, is an area of water about 45 feet deep: ial e dottom here IS somewhat of the nature of a triangular terrace rising to the s on the north and sloping steeply to the deep water on the other sides. CU 3Hile (personal. communication) states: "We have found that abundance (a:ves computed WIthout any reference to fishing time are fully reliable and are SUpenor to curves computed from the 'catch per net per night'.",


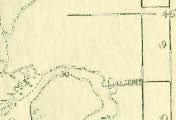
15 22 SUMMER MIGRATION OF THE CISCO STATION3.-About half way between the Blueberry and <;;ooseislands, this station was chosen as being typical of the open water of the main lake; the depth here is about 45 feet. STATION4.- This is a rather restricted area of water, one of the three known "deep holes", 150 feet deep, just where the open lake joins the source of the French river. SUMMER MIGRATION OF THE CISCO 23 TABLE 6.-Vertical distribution of ciscoes taken in Depth in feet May June July August September rfj '-... J., M CD 10 <0 """... """ M """ >. M 1'- """ >. >. cu >. >.!oil bq os os os e d, c:i. c:i. c:i. c:i. ::s ::s :3 ::s :; :; :3 :3 cu cu < -e Jl Jl rfj Jl 1'- """!oil!oil :3 :3 < < 19 8 M 0 M >.!oil os :3 ::s < Contours In feer scale LI -l.t.jt miles FIGURE5.-Map of the area of lake Nipissing fished in STATION5.-When the catch fell off at station 3, a net was set about onethird of the way from that place towards station 4 to make certain that the fish had left the shallow water.. STATION6.-East of the Blueberry islands just at the edge of the deep water where the bottom slopes suddenly from 45 to 90 feet. STATION7.-Just south of station 2 and west of station 4, in water 90 to 100 feet deep. This location was chosen because of its proximity to the thermocline which at that time was between 105 and 115 feet Thermocline <0 M >. cu os c: :3 :3 ::s c:i. Jl <0... c:i. c:i. cu rfj Jl !oil c:i. c:i < Jl Jl The 1934 catches are recorded in table 6. It may be seen that just after the break-up of the ice very few ciscoes were tak en. m. anyone catch. In late May and early June the catch m 45 foot water increased, while there were still but few


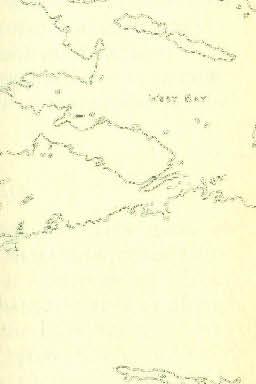
16 24 SUMMER MIGRATION OF THE CISCO fish caught in the very deep water. This concentration at 45 feet continued to increase until a peak was reached during the middle of July. After this time there was a rapid falling off in the number caught at this depth, and an increase in the o. ( I r SUMMER MIGRATION OF THE CISCO 25 the volume of the hypolimnion. At the same time the catches in shallow water had not increased greatly and consequently one would have expected a great increase in the number taken in the hypolimnion. However, the same net set 18 feet from the bottom on the following night, directly above the position of the previous night's setting, caught the equivalent of 650 fish. This great concentration was confined to the upper waters of the hypolimnion, for on the night of September 12, the net was set on bottom in a depth of from 90 to 100 feet, which was just above the thermocline, the locality being sounded and buoyed so that the position of the net could be determined rather precisely. In this location, just a few hundred yards west of the position of the previous settings in the hypolimnion, the equivalent of only 20 fish was taken.' FIGURE6.-Sketch (, I " -rrank "s,, bq)' /6 I./ ",., m,\e------oj. 1 contours In Fee t map of the region at the head of the French river. number taken in the cold water below the thermocline. The fish remained in the hypolimnion throughout August and into the beginning of September. During September the catches in shallow water increased slightly, this increase continuing and becoming most marked in the last catch, taken on September 15 just above the thermocline. The deep water catches in September show a very striking stratification of fish. A net set on the bottom on September 10 in 150 feet, gave a catch equivalent to 110 fish in string II. This number is about half that which was taken at the same place in the middle of August, in spite of the fact that the thermocline had descended from 75 to 105 feet, thus decreasing 1935 Catches It has been pointed out that the 1934 series lacked samples from water less than 45 feet deep. It was inferred that the increase in the number of fish taken at 45 feet during June and July resulted from the evacuation of the area of shallower water. In May, 1935, considerable numbers of fish were taken in West bay ([11, 6] and [12, 7], figure 1, opposite p. 10) where the water is only 15 feet deep. In this and other localities where the water is the same in depth, a cisco is a rarity in August. By the end of May, 1935, considerable information about the extent and nature of the movements of the population had been obtained, but it was largely limited to the interpretation o.fthe results from gill nets set on the bottom. True, a con- Siderable number of surface sets had been made, and also occasionally a net had been floated up from the bottom to an 4In these catches only one 50 yard net of 2X inch mesh was used and to Ichulate the equivalent to string II the number of fish captured was cmpared o t,same number caught in the same net in the catch of string II made under ConditIOnsmost closely approximating those under which the net in question ;,as lset, The figure for the population has been taken as that proportion of the ota catch of stnng II as IS represented by the ratio catch of net set catch of the same net in string II
.")

.")


17 26 SUMMER MIGRATION OF THE CISCO SUMMER MIGRATION OF THE CISCO 27 "intermediate" position, but the laboriousness of these methods made impossible an extensive vertical sampling of the water over anyone locality. In June, 1935, the problem was attacked by the use of "oblique" nets (see p. 17). A set of this type allows a vertical sample to be taken of the fish at a given locality. Series of this nature were taken at two stations, a shallow water series at station 3, and a deep water series at....2 SHALLOW WATER i I I! June13 July 10 Aug.12 Sept.22 DEEP WATER =ra=eeei I B 00 C') g,, 1_,, I, \0 o,,, I FIGURE 7.-Vertical distribution of ciscoes taken in oblique series in cote fl$h o Thermocline SCOhl f,sh station 4 (p. 22). The results of this fishing are given in tables 7 and 8, appendix 1, and are illustrated in the accompanying graph (figure 7). Since station 3 had been sampled fairly intensively in 1934, only three series were carried out here on critical dates. An early sample was taken on June 13, in which the fish were found to be concentrated in the lower fifteen feet. The next series shows quite a different picture of vertical distribution. On this date, July 10, the fish taken were distributed almost uniformly from the surface to the bottom. At this time the mayflies were emerging and the fish were feeding largely upon these at the surface. This surface feeding apparently influences their distribution. In the August 12 series no ciscoes were taken in the shallow water. For the sake of completeness, the result of a bottom set lifted on September 22, is also shown in figure 7. On this date six fish were taken in 50 yards of 2Uinch mesh. The collections resulting from deep water sampling at station 4, consisting of seven complete series and one partial one, give a more complete picture. The first fishing was done here between June 10 and 13. At this time there were few fish in this vicinity and practically all of these were taken at depths of less than 75 feet. By June 20 there had been some increase in the population, principally between 45 and 60 feet, and some fish were taken in the deeper strata. The next series, taken July 3 to 6, showed no gain in the numbers of fish taken, but there had been a further downward shift in the population. Between the sixth and the seventeenth of July there was a great influx of fish to the vicinity of station 4. The number taken on July 17 was so great that the setting of the series of nets could not be completed. While there were more fish taken in every stratum, the greatest increase was at depths of between 60 and 75 feet. A week later, July 23, fishing was resumed with shorter yardage of net and there was a further increase in the relative number of fish captured. At this time most fish were taken at depths of between 75 and 105 feet. From 105 to 150 feet the fish were almost uniformly distributed but in much greater numbers than before. The August 15 to 20 series shows a still further downward movement of he population. More fish were taken over this period than In the previous series, but this increase is probably due to a greater concentration of the fish already below the thermocline, in the lesser volumes of the bottom strata, rather than to a further ingress of fish from shallow water. The first series in September, taken from September 4 to 9,
.")


, but in these instances that temperature had just been")


18 28 SUMMER MIGRATION OF THE CISCO shows an upward shift of the population which has resulted in a distribution comparable to that found on September 10, 11, and 12,1934 (pp. 24-5). The last series of the year was taken over the period from September 18 to 21. By this time the catch had decreased considerably in the lower strata and increased in the upper layers, indicating that the migration from the hypolimnion was at this time well under way. SUMMER MIGRATION OF THE CISCO era!. The numbers taken in these series are shown in figure 9. On the same figure are plotted the temperatures at the surface and at a depth of 30 feet. The 30 foot temperature is given as perhaps a better indication of any upper limit to temperature 29 CAUSAL AGENTS OF THE SUMMER MIGRATION At no time during the six seasons were large numbers of ciscoes taken in water that had been long above 20 C. This may be seen by reference to figure 8 which summarizes the results of bottom fishing from 1929 to Twice during that period large catches were taken in water at about 20 C. (J uly 25, 1930, and July 16, 1934), but in these instances that temperature had just been reached. Further, in 1934 and 1935, when the movements were followed more closely, it was found that the fish left the shallow water quite suddenly after the temperature rose to 20 C. Within a week, the catch dropped off from 154 to 29 per unit effort, during 1934, and in 1935 the population moved into deep water with a similar suddenness. The catches taken by oblique series are not shown in figure 8; for these data, figure 7 must be consulted. Evasion of water above this apparently critical temperature will not completely explain all movements from shallow to deeper water. It would seem likely that, when temperature conditions are not unfavourable, the presence of the ciscoes at the surface is influenced by the abundance of mayfly ernergents on which they gorge themselves during June and July. The effect of mayflies on the vertical movement of ciscoes is strongly indicated by the nature of the catch of July 10, 1935, where the mode of distribution was at the surface at a time when the mayflies were emerging (figure 7). A further instance of the effects of mayfly emergence is seen in the surface series taken in 1932 and These two series represent contrasting conditions in the surface temperature and with it the temperature of the upper strata in gen- June Jull,j AU9. Sept. Auq. Sepr. May June Jul Aug. Spt. FIGURE 8.-Numbers of ciscoes taken in gill nets plotted in relation to season depth, and temperature. Temperatures from Corkill. '


 0 0 (II CIJ co,.., 0 '\" 10 r< z JUNE AUG. t FIGURE 9.")

 reported that the imagoes of the two species of")


 at the same time, had only small quantities of plankton crustacea in their stomachs.")


19 30 SUMMER MIGRATION OF THE CISCO conditions affecting the presence of the ciscoes in the surface nets, since the fish are not necessarily limited in their movements to the immediate surface layer. In 1933 the temperature at 30 feet reached 20 C. about July 10, and at this time there was also a precipitous drop in the surface catch of ciscoes. In 1932, on the other hand, the upper waters were considerably cooler in the early summer and the temperature at 30 feet did not reach 20 C. until the (J 0 (\j 0 C\J t') 0 0 (II CIJ co,.., 0 '" 10 r< z JUNE AUG. t FIGURE 9.-Numbers of ciscoes taken in surface nets in 1932 and beginning of August. In this season the catch of the surface net rose gradually to a maximum about the middle of July, and fell again by the third week of that month. No records were kept of the period of emergence in 1932, but Ide (1930) reported that the imagoes of the two species of Hexagenia, H. rigida and H. limbata occulata, which are the common ones in lake Nipissing, emerged from July 6 to 25 in 1929, in the locality where the surface net was set. SUMMER MIGTION OF THE CISCO 31 Even before their emergence, mayflies form a portion of the ciscoes' food but they seem to be taken only in late nymphal instars, presumably due to some change in the insect's activity in those stages. Fish taken in early May in West bay ([11, 6], figure 1, opposite p. 10), where the water is only 15 feet deep, were found to be feeding on mayfly nymphs in fair numbers. Fish taken in deeper water (45 feet) at the same time, had only small quantities of plankton crustacea in their stomachs. At this date the concentration of fish was the greater in 15 foot water. It seems very probable that the availability of this important article of diet governs, to a large extent! the distribution of the cisco population in the spring. Mayflies maj:' become available later in the deeper water, and the fish, If feeding on them, would tend to move from shallower to deeper water in early summer. It is perhaps only fortuitous that this early movement brings the ciscoes into the vicinity of the deep water in mid- July so that they may enter the hypolimnion when the epilimnial temperature. rises too high. As a matter of fact, there is some evidence that a few fish may be trapped in a minor depressi.on in. the west arm of the lake (figure 1, opposite p.10).!n this region there are two depressions, one fairly extensive In area [3, 5], with a depth of about 30 feet, the other somewhat deeper (45 feet) in the restricted channel in which the lake terminates to the west [1,6]. On July 16, 1930, a few fish were taken in the ten yard water at [3, 5]. On August 24,1932, a large cisco in a dying condition was taken from a gull over the deeper water at [1, 6]. This fish must have gone into this deeper wter and have been forced out by stagnation or by the scounng out of the cold water by a seiche. The following year on August 17, 1933, nets were set on bottom in this locality but no fish were caught. Once the fish have passed into cooler water they seem to be rstrained from leaving it by the sharp rising temperature gradient of the thermocline. In late summer the fish retreat before a descending thermocline, although the temperature of th T. e.epr rrnmon has dropped below the upper limit of tolerance which the fish displayed earlier in the summer.

.")


20 32 SUMMER MIGRATION OF THE CISCO In spite of the fact that the thermocline appears to be such a barrier, the fish do pierce it eventually and leave the hypolimnion some time before the fall turnover. During early September in 1934 and 1935, fish left the bottom water and were concentrated just below the thermocline. This is seen particularly clearly in the "oblique" series of September 4 to 9, 1935 (figure 7, p. 26). This upward movement is correlated with a decrease in the oxygen coupled with an increase in carbon dioxide near the bottom in the hypolimnion. The precise time at which the fish migrate from the hypolimnion would seem to be governed by a balance of forces acting on the ciscoes. Below, unfavourable concentrations of dissolved gases urge them upward. Above, a steep temperature gradient blocks their way. Their salvation lies in being able to stay within the frying-pan until the fire has died away to embers. HORIZONTAL DISTRIBUTION An idea of the horizontal distribution of the ciscoes in lake Nipissing may be inferred from a knowledge of their vertical distribution, and of the relief of the lake's basin. This inference must be drawn with reservations, for various reasons. In the first place, the fish present in a given stratum of water are not randomly distributed throughout the whole lateral extent of that stratum. On the contrary, their distribution is influenced by the relation of that stratum to the bottom. For instance, in the deep and shallow water series during the middle of June, 1935, 59 fish were taken between 30 and 45 feet in water 45 feet deep, while only 14 were taken in the same stratum at station 4, over water 150 feet deep. Conversely, later in the summer, fish were taken in the upper waters over station 4, while none was taken at the shallow water station. For these reasons no precise indication of the lateral distribution of the fish has been attempted. Figure 10 shows, in a general way, the probable areas populated by the ciscoes at different times of the year. In May and early June the fish wander over most of the lake. By July they have become SUMMER MIGRATION OF THE CISCO 33 concentrated in something like a third of the area, and are mainly in the eastern section. There are two localities in the western end where the water is of moderate depth ([3, 5] and [1,6],figure 1, opposite p.lo), where ciscoesare known to occur in July. There is also a small basin over 30 feet deep in Cal-.orly July FIGURE 1O.-Seasonal changes in the horizontal distribution of ciscoes in iake Nipissing. lender bay [25,5], at the eastern end of the lake, which has not been sampled. In August practically all the fish have descended below 60 feet. This movement results in a tremendous concentration in the region shown in black in the lower panel. The Whereabouts of the fish which withdrew in July into the more


. A secondary peak of production Occurs in May and June.")
. of one per cent.")
.")
21 34 SUMMER MIGRATION OF THE CISCO moderate depressions is problematical; it is possible that in some years at least they are destroyed by the warming of the water. SUMMER DISTRIBUTION IN OTHER LAKES Reports of the movements of L. artedi in other lakes indicate considerable diversity of behaviour. Speaking of the southern Wisconsin lakes, Cahn (1927) says: It has been said that the cisco is a bottom inhabitant and that it must be regarded as a deep water fish. During that part of the season when the oxygen conditions permit, Leucichthys artedi remains normally in deep water, spending most of its time within a metre or two of the bottom. This fact has been demonstrated again and again, year after year, by the use of gill nets set at different depths... However, with the formation of the thermocline and the accompanying increase in the area of water deficient in oxygen, the cisco is forced to leave the bottom waters of the deeper parts of the lakes and assume a position even higher in the vertical scale. As the thermocline climbs upward the cisco comes up with it and assumes a position in relation to the thermocline that may be described as directly above it. Therefore if one takes the temperature of the water at different depths and thus obtains a fairly accurate idea of the location of the thermocline, one can set gill net just at this depth and catch ciscoes all summer. This was discovered in 1916 when the writer wanted the fish for an examination of the summer food. Nets were set in the deep water where the fish were caught in abundance the previous winter, and caught nothing. After repeated failures a series of eight nets was set, one above the other. The net which was at ten metres yielded eleven ciscoes, the one at nine yielded none, and the one at eleven yielded two in the upper foot of mesh; none were caught in any other net. An analysis of the water at this time showed that the thermocline stood at eleven metres. This idea has been followed ever since and has always yielded fish. I have set forty-three nets below the thermocline in nine different lakes and have never in a single instance caught a cisco.. Koelz (1929) has collected a great number of catch records and much general information from fishermen on the great lakes. In general, the fish are taken in shallow water until June and to a certain extent in July, and in deeper water in August." They return to the shallower parts again in autumn. 5In all state of Michigan fisheries in great lakes waters, November is the month of maximum production of herring. In some waters (lake Superior, Saginaw bay) as much as per cent. of annual catch is taken in the fall fishery (October through December). A secondary peak of production Occurs in May and June. In most fisheries, the summer production of herring is relatively unimportant. The extreme condition is found in Saginaw bay, where in the two years, , the three months, July, August, and September, accounted for onlyone-half communication). of one per cent. of the total catch of herring (Hile, personal SUMMER MIGRATION OF THE CISCO 35 There is some evidence that in lake Superior the fish never leave the shallow water. Koelz correlates this with extremely low surface temperature of that lake (Max. found by him 16.3 C.). In some years good catches of ciscoes have been taken by pound net fishermen in lake Erie throughout the summer. This Koelz also attributes to cool surface waters in those particular years. It is also interesting to note that when the cisco fishery of lake Erie had declined, better catches were made by floating nets up some distance from the bottom. This concentration of ciscoes at an intermediate level would indicate a vertical distribution like that in Nipissing (figure 7, p. 26), where there is usually a greater number of fish swimming some distance up from the bottom over the deeper water than there is at bottom. Scott (1931) reported on the distribution of ciscoes in some Indiana lakes and he records the following peculiar behaviour: Early in September, usually between the first and the tenth, the "cisco".. come to the surface of Snow Lake, struggle as if in discomfort, and then disappear. They have been described by local observers as "gasping for breath". When they begin to appear a maximum is soon reached, after which the number at the surface is rapidly reduced. The maximum rarely lasts more than a day and the whole phenomenon is over in less than a week. This has been observed on Snow Lake for at least thirty years. It occurs occasionally on the third basin of James Lake. They have been examined repeatedly for parasites without success. I suspected that the disappearance of the oxygen from the hypolimnion might be the cause. He goes on to explain that he believes that these fish are trapped by an oxygen "notch" developing at the thermocline until they become asphyxiated and float up through it after they have lost control of their hydrostatic apparatus. Scott, in collaboration with Hile, found ciscoes living under very unusual temperature conditions in the epilimnion of Indian Village lake and the latter suggests (Hile, 1931) that these fish may constitute a distinct race.. Hile (1936) discusses the vertical distribution of the cisco In Trout, Muskellunge, Silver, and Clear lakes, all in the north-eastern highlands, Wisconsin. He gave particular attntion to the question of the relationship between the vertical distribution of the cisco and the temperature and the oxygen


![.. (ciscoes) were not plentiful in depths less than 9 meters and were absent in the deeper portion of the hypolimnion. [Aug. 27-29, 1930].](/docs-images/71/65529186/images/22-2.jpg ".. The results of the rather extensive fishing of the 1932 collecting season.")


 it was found that the average size of the fish taken in shallow water during May, June, and July diminished progressively in spite of the fact that this was the growing")
 the age fre- SUMMER MIGRATION OF THE CISCO 37 quency distribution was bimodal with IV-group and VIIgroup fish predominating.")
22 36 SUMMER MIGRATION OF THE CISCO concentration in the different lakes. Several extracts from Hile's report (pp. 258 et. seq.) follow:... in Trout Lake in middle and late summer there lies below the depth of 10 or 12 meters a large body of cold water with a good supply of oxygen. It is in this region that the cisco lives during this season of the year,... It is in Muskellunge Lake that the late-summer habitat shows the III:0st marked restriction to a limited stratum... (ciscoes) were not plentiful in depths less than 9 meters and were absent in the deeper portion of the hypolimnion. [Aug , 1930]... The results of the rather extensive fishing of the 1932 collecting season... give the most complete information concerning the vertical distribution of the cisco in Muskellunge Lake... as a result of.. deficiency of oxygen in the deeper strata theciscoes are forced out of the cooler strata and by reason of their preference for cool water and their need of oxygen become concentrated in that stratum of water that has the lowest temperature available and yet contains sufficient oxygen to support life.. The Silver Lake cisco agrees with the Muskellunge Lake cisco in showing a rather sharply delimited vertical distribution... Thus in late summer the Silver Lake cisco is confined to a narrow stratum in the upper part of the hypolimnion and the lower part of the thermocline. The field records of lifts of ciscoes in Clear Lake indicate that in this lake the cisco occurs in all parts of the hypolimnion from midsummer to early autumn... at this time of the year there is in Clear Lake a plentiful supply of oxygen at all depths. Apparently conditions in lake Nipissing are somewhat intermediate between those existing in lakes where there is a rapid depletion of oxygen in the hypolimnion and those existing in the great lakes. In the former lakes the whole summer migration is probably slurred over by the rapid stagnation of the hypolimnion. In the great lakes, on the other hand, the temperature of the upper strata may never rise above the limits of tolerance exhibited by this species, and the migration may never take place. THE RELATION OF AGE TO VERTICAL DISTRIBUTION In the 1934 series at station 3 (figure 5, p. 22) it was found that the average size of the fish taken in shallow water during May, June, and July diminished progressively in spite of the fact that this was the growing season. Figure 11 shows that this was due to changes in the age composition of the fish in this vicinity. In the earliest catch (May 15-17) the age fre- SUMMER MIGRATION OF THE CISCO 37 quency distribution was bimodal with IV-group and VIIgroup fish predominating. In the next catch, a month later, the older fish had largely disappeared and the curve was unimodal with the mode at group IV. The remaining panels indicate a further lowering of the average age to a minimum An:'eniug rrequency c/togromor lhe oge compositon of sha//ovy woler C'clche.s Mo y JI.6;rr az A9. Jv Jv1f Auguei FIGURE ll.-changes in age composition in catches taken at station 3, The total number of individuals in the samples analysed in this figure are given in table 6, p. 23. in August. I t will be noted that a few old fish reappeared in the August samples. Catches taken in deep water on July 14 and July 28, 1932, also showed that the larger (older) ciscoes ntered the deep water earlier than did the smaller (younger) sh (figure 12). When the ciscoes are leaving the hypolimnion it is the
.")

.")


23 38 SUMMER MIGRf\TION OF THE CISCO younger fish which leave first. Catches above and below the thermocline at the end of the summer in 1933 and 1934 illustrate this fact (figure 13). The 1934 catches were taken when the upward migration was under way and the probability is very great that the fish taken above the thermocline had but recently left the hypolimnion. The fish of the sample taken above the thermocline o,.. I/) SUMMER MIGRATION OF THE CISCO 39 at 22 and 26 ern. The lower panel shows the size composition of two catches, one at station 4 and the other at station 6 (figure 6, p. 24). These samples were taken later in the season than those of 1934 and represent the last of the upward migration. For that reason there is no difference in their size composition. These samples show a unimodal distribution representing largely the upper range of the fish taken. on July 25. The vertical series of 1935give the most connected picture of the different behaviour of fish of different ages. Since the ọ, 1933 Jul:,t25. AU!t1t 150 H Sept.tS Abo". Thermo,"" J"uly 28 o ".. ;;0 ('),.0 w E, ZỌ Sept. 16 a.low The..",oclu, ems. StQndctrd length FIGURE 12.-Changes in length composition in catches of ciscoes taken on the bottom at station 4, had a much lower average age than those of the one taken below. The 1933 figures show another aspect of the same phenomenon. The results in this year show the earlier disappearance of the smaller (younger) fish from the deep station and its immediate vicinity. The upper polygon gives the length frequency composition of a catch taken at station 4 in the middle of the summer. This curve is bimodal with peaks FIGURE 13.-Seasonal changes in the length and age composition in ciscoes taken on the bottom, station 4 and vicinity, 1933 and number of fish taken was so large (between 5,000 and 6,000 specimens) they will be discussed according to size instead of age groups. The results of the major portion of this fishing are given in tables 7 and 8. Figure 14 illustrates the vertical distribution with respect to size of the fish taken in the shallow water series at station 3 (p, 22). The fish have been grouped into three arbitrary size classes: smaller than 20 cm., from cm., and longer than 25 ern. These groups will subsequently be referred to as "small", "medium", and "large" fish.


.")


24 40 SUMMER MIGRATION OF THE CISCO In the June 13 series there were more large fish taken than either medium or small. On July 10, the number of fish taken increased, but this increase was due largely to the presence of large numbers of medium fish. In this series it will be noted that fish longer than 20 ern. have the mode of their distribution in the upper 15 feet, whereas the fish smaller than 20 ern. are concentrated more in the foot stratum. This difference in position is correlated with the feeding habits of the ciscoes at this date, the larger fish feeding on emergent mayflies, the smaller on plankton. SUMMER MIGRATION OF THE CISCO 41 face and 15 feet, but they were in water cooler than 15 C. The catch taken from July 3 to 6 shows about the same distribution of sizes except that the large fish had dispersed downward to the bottom. By July 17 there was a tremendous increase in the number of the fish taken in the region of the thermocline. Practically all these fish were longer than 20 em, and more than half of O r------,--, : FI$h>25c",, July 10 o 1 FIGURE 14.-Seasonal changes in vertical distribution in ciscoes of different lengths at station 3, No ciscoes of any size were taken in the August series, due probably to the exceptionally high temperature of the epilimnion in this season (figure 8, p. 29). The data for the ciscoes taken in the deep water series of ets are illustrate in figure 5, which is based on data given 111 table 8, appendix 1. Medium and large fish caught in the smallest mesh have been omitted. An estimated distribution is shown for July 17, based on the results of an incomplete series of net settings. The few fish taken over the deep water in June were mostly longer than 26 em. These large fish were not concentrated below the thermocline, which at that date was between sur- o thermocline ';-9 Sepremba, FIGURE 15.-Seasonal changes in vertical distribution in ciscoes of different lengths at station 4, them were over 25 em. in length. 0 small fish were taken in the fine mesh in the bottom 30 feet. In the series of July 23 to 26 there was a further increase in number of large fish taken but it would seem likely that this increase was the consequence of those large fish already below the thermocline on July 17 becoming more concentrated in the lower strata, rather than to a further influx of ciscoes of this size range. On 18-21


.")


25 42 SUMMER MIGRATION OF THE CISCO SUMMER MIGRATION OF THE CISCO 43 the other hand, the medium fish showed a marked increase in numbers in the region just below where the thermocline had been on July 19,which must have been due to a further immigration. It will also be seen that considerable numbers of small fish had migrated to the deeper water. It is probable that most of the population had migrated to the hypolimnion by July 26. The distribution of the fish taken in the August 15 to 20 series seems to indicate a gradual downward dispersion of the group already below the thermocline on the earlier date. There was a larger catch of smaller fish but this was due to the replacement of the lyz inch mesh by a net of 2 inch mesh, which was more efficient in taking the II-group.. It has been pointed out that when the series of September 4 to 9 was taken, the fish had migrated up from the lower 30 feet (p. 27). This is noticeable in all size classes, but is more complete in the group larger than 25 ern. Further, the number of large fish captured was sufficiently below the numbers taken on July 23 to 26 and August 15 to 20 to suggest that already some had left the hypolimnion. The final series at station 4 was taken from September 18 to 21. By this time the thermocline had descended to 120 feet, which left an extremely small hypolimnion. The nets caught very few small fish and only about one-fifth of these were below the thermocline. The catch of medium fish also dropped greatly, but there was still a considerable number of large fish. More than half of the large fish were taken above the thermocline but judging from their stomach contents they had only recently left the hypolimnion (Langford, 1938). In figure 15, in which the fish are massed into three large divisions. there is an apparent anomaly in the behaviour of the large fish. This figure shows that although the proportion of large fish decreased in the September 4 to 9 series, it rose again in the series of September 18 to 21. If these changes in numbers were due to migration, this must mean that a certain section of the group called large fish migrated early, while another remained in the hypolimnion until last of all. Figure 16 supports this view. This graph is constructed from table 9, which gives the length frequency distribution of the medium and large fish taken in the last four series at station 4. The object of the graph is to compare the changes in size composition taking place in these catches. The number of each length class taken in the July 23 to 26 series has been taken as unity, the whole catch being thus represented.by a rectangle of unit height erected over the July 24 date hne: The ratios of the number of fish in each size class taken dunng the August 15 to 20 series, to the number in the same size class of the July 23 to 26 catch, have been calculated. These ratios have been plotted over the August 16 date line. Similar ratios have been calculated comparing the September 4 to 9 catch with the August 15 to 20 series, taking the August series as unity in this case, and plotted at September 6. Finally, the ratios between the September 18 to 21 series and that of September 4 to 9 have been worked out and plotted at September 19. Where the ratio in figure 16 rises above unity an increase in catch is indicated; where it drops below, a decrease. Since the results of gill net settings represent concentration, an increase in catch is due to a further restriction of the range of the section of the population in question. In this case such an increase is due to a concentration brought about by, first, fish rising from the bottom and being concentrated under the thermocline, and secondly, by the descending thermocline forcing them down into the very small volume of water over 120 feet deep (note vertical distribution on September 4 to 9 and 18 to 21, figure 15, p. 41). A decrease in catch, on the other hand, is indicative of an increase in range, and may be considered to show a migration from the restricted hypolimnion to the extensive epilimnion. In the graph it will be seen that as early as the middle of August there is a decrease in the catch of ciscoes from 25.0 to 28.9 ern. long, and that the largest fish have become more concentrated. This concentration is just below the thermocline. By the beginning of September more fish had disappeared over the size range from which fish had disappeared in the August catch, and in addition to these, some of the


, and it is possible that ciscoes may also behave in this manner.")
.")


26 44 SUMMER MIGRATION OF THE CISCO largest fish had gone, and there had also been a loss in the 24.5 ern. group. It will be noted further that at this time the smaller size classes were beginning to concentrate below the thermocline. By September 18, practically all fish below 25 em. had migrated and most of those from 25 to 27 cm., leaving only the largest remaining in any numbers. Apparently the fish migrate out in the order in which they come in, except for those that come in first of all. In this SEPT.6 SEPT. 19 FIGURE16.-Changes in length composition in vertical samples of ciscoes taken at station 4, For explanation see text, p. 43. group the very largest ciscoes predominate. It is quite natural that these particular fish should remain in the hypolimnion, since even as late as September 18, the temperature of the epilimnion was probably higher than when the fish had left it in the spring. This order of migration with respect to age can be considered to be the result of a decreasing tolerance with increase in age towards the factors effecting migration. Older fish are SUMMER MIGRATION OF THE CISCO 45 more sensitive to high temperatures and to unfavourable concentrations of dissolved gases. The balance between these factors decides the time of the return to the epilimnion; the largest fish remain longest in an uncomfortable hypolimnion since movement upward brings them into a temperature undesirably high. A change with respect to age in the ability of certain fish to withstand high temperatures has been shown (Huntsman and Sparks, 1924), and it is possible that ciscoes may also behave in this manner. A similarity drift in sensitivity towards low oxygen and high carbon dioxide is not so clear (Wells, 1913; Gutsell, 1929). Wells found, when fish of different ages were exposed to conditions where the concentration of oxygen was low and that of carbon dioxide was high, that small fish succumbed earlier than large fish. Gutsell's experiments in which the concentration of oxygen was not so low gave conflicting results. There is a 'possibility that the reaction of the fish towards low concentrations of oxygen may differ from their reaction towards high carbon dioxide. A difference in sensitivity to carbon dioxide correlated with age, and possibly sex, was found in a single experiment performed with Mexican sword tails Xiphophorus helleri. The results of this experiment are given in table 10. Three fish TABLE 1O.-Age differences in the rate of asphyxiation of Mexican sword tails subjected to carbon dioxide. Order of asphyxiation Size Sex 1 large male 2 large male 3 small? 4 large female 5 small? 6 small? about one month old were placed together with three other fish just approaching maturity and carbon dioxide bubbled through the water in which they were placed. Five of these sh became asphyxiated in the order given in the table-the sixth, a small one, was still conscious when the experiment was discontinued. The results of this experiment differ from those of Shelford and Allee (1913), who make the general

 illustrates our knowledge of the August distribution of the")


27 46 SUMMER MIGRATION OF THE CIsco statement that the young were more easily affected by the various stimuli employed than were the adults of the same species. Among these stimuli were high concentrations of carbon dioxide. In the specificinstance they describe (p. 258) they attribute this difference in part to the large fish having too great a momentum to exhibit the reaction. DISTRIBUTION OF YEARLINGS A D FINGERLINGS The accompanying graph (figure 17) illustrates our knowledge of the August distribution of the O-group and I-group. 1= Ish of lhe Year YeO,.'lng,5 o Auq ,,; "' 8. 1Ji34 0 A?1.6t V 0 iii 0 N 0.,.. Au<Jr9''l9aa.. A...q e :5 T -"" Scale bl...,j0 lsh o Thermocline FIGURE 17.-Vertical distribution of zero- and one-group ciscoes in August. Ciscoes of the O-group were fished for in August in 1933, 1934, and 1935, and were found in the region of the thermocline. The vertical distribution of the I-group fish has been given for 1935, the year in which the oblique catches were made. A special series in which 50 yard units of lyz inch mesh were used, was set for these yearlings between August 27 and August 30. Fishing was confined to strata below sixty feet. These fish were also in the vicinity of the thermocline, but somewhat lower than the fingerlings. one was taken in water below 105 feet. Figure 17 may be cornparedjwith SUMMER MIGRATION OF THE CISCO 47 figure 15 where the distribution of fish below 20 ern. is shown; the majority of these fish belong to group II. The fingerlings are perhaps more consistent in remaining above or near the thermocline. In some seasons, 1934 for instance, numbers of year old fish have been taken on or near bottom in the hypolimnion. THE RELATION OF SEX TO VERTICAL DISTRIBUTION Bottom Samples A consideration of the sex ratios in various catches makes it seem probable that males respond more positively than do females to the agents bringing about the summer migration. For instance, in 1931 two catches, taken by the same graded series of nets, were lifted from the deep water at station 4 on July 14 and August 13 respectively. In the earlier catch the ratio of males to females was 65 to 25, while in the setting of August 13, 75 males and 83 females were taken. It would seem apparent that the migration up to July 14 had consisted largely of males, while there had been an influx of females after this date. Bearing in mind the fact that fishes of different sizes migrate at different times, it will be evident that there is a possibility that the change in sex ratio may have been due to a change in size composition. This, however, is not true. The length composition curves of the two sexes in each catch, given in the accompanying figure (figure 18) show that the increase in the number of females occurred generally over the whole size range. A parenthetical remark might be inserted here to the effect that these two catches do not strictly record the progress of events in one definite stratum. It happened, since the net was set up the steep side of the "deep hole", that the nets with larer mesh were in water as shallow as sixty feet on July 14. ThIS accounts for the absence of large fish in the catch on this date. Apparently the age of the individual determines its response to a greater degree than does its sex, for the change in


.")


J (Ij 0:' 0 0, '\" I/) <B T1 (\l C\I..! 2' \" 2' a...: e,.")

28 48 SUMMER MIGRATION OF THE CISCO sex ratio is not so simple a trend as the change in size composition. In the two catches at station 4, taken on J uly 14 and July 28, 1932, there was, if anything, a decrease In the proportion of females. On July 14, 55 males and 63 females were taken; on July 28, 335 males and 331 females..t the same time there was a great change in the size composition of the catches. In the earlier sample large fish predominated, while in the later there were great numbers of smaller fish (figure 12, p. 38). Thus, while it may be probable that large males were the first to migrate to deep water, it is evident that the large females must have followed them some time before the smaller fish descended. 1, l ] July 14 FIGURE ls.-changes in length and sex composition in catches of ciscoes taken at station 4, Just as the very large fish which were the first to enter the hypolimnion were the last to leave it, so does the proportion of male fish increase again in the late samples taken below and in the vicinity of the thermocline. In 1933 the midsummer sample taken on July 30 at station 4 contained 238 males and 279 females. Catches made in this vicinity on October 1 and 2 consisted of 77 males and 79 females. These differences are statistically significant, the difference between the percentages being 2.6±.05. ' Similar conditions were found in the 1934 samples. In the catches above and below the thermocline taken on September 15 and 16 the ratio was 36 males to 33 females, while females predominated in the August catch. SUMMER MIGRATION OF THE CISCO 49 Vertical Samples at Station 4 The composition of the samples taken in the oblique series illustrates the behaviour of the sexes exhibited in the isolated cases discussed above, in a manner that allows of a connected treatment of the changes from spring to fall. Tables 8 and 9 give the numbers of each sex taken in the different series, first with respect to depth, and secondly with respect to size. The trend in the percentage of males and females in all the fish longer than 20 cm. taken at station 4, is illustrated in figure 19. o III o -: <, 1\ <, V I \ \ II \ i'- I"- <0 '"' C)J (Ij 0:' 0 0, '" I/) <B T1 (\l C\I..! 2' " 2' a...: e,... i" (f) '"J,»..,, <{ (f), August.. Sept. b y FIGURE 19.-Changes in the relative numbers of males and females in ciscoes longer than 20 em. taken in oblique series at station 4, In the first sample taken June 10 to 13 there were more females than males. The percentage of males increased steadily until July 17. After this date there was a sudden increase in the proportion of females which was followed by a further gradual increase, the peak being found in the series of August 15 to 20. Following this there was a slight falling off In the proportion of females by September 4 to 9, and after this date there was a very sharp decrease between that series and the final one taken over the period September 18 to 21. o -e o II)


! & A. d \"\"it!.q ()) I c =... onc:entl\"<llion c:l.: a. ; -...; doc.. os. c1'. I/).c...CI4l if =- '\I\" _c <II: --- ---- &<= ==- =7' d UJ.")


, that on this date there was an enormous increase in numbers of large and medium fish.")


29 50 SUMMER MIGRATION OF THE CIsco In an attempt to clarify this rather complex change in sex ratio, figure 20 has been prepared. This diagram is an attempt to illustrate the changes in the numbers of each sex in different size classes. It is merely an extension of the principle employed in constructing figure 16 (see p. 43 for details). The left panel shows the influx of fish to station 4 in June and July. The number of each sex in each length class in the June 10 to 13 series has been taken as unity. In the upper diagram f : :r-.---'--r---',nc,.ea$e2.... ""'.CI&.(f d.creo.6'. 9. I/)! & A. d ""it!.q ()) I c =... onc:entl"<llion c:l.: a. ; -...; doc.. os. c1'. I/).c...CI4l if =- '\I" _c <II: &<= ==- =7' d UJ.cr ct. 9 d e e..eo 9 T FIGURE20.-Changes in length and sex composition in catches of ciscoes taken in oblique series at station 4,1935. For explanation see text, p. 50. the catch of June 20 to 23 has been compared with the earlier series. It will be seen that while roughly twice as many males between 23 and 26 ern. were taken as on the previous date, there was practically no increase in the number of females in this size range. On the other hand, in the larger sizes there was a greater increase of females than of males. Between June 23 and July 3 there was a general decrease in the number of female fish of all sizes except the largest. The number of males had increased in the central length classes. The de- SUMMER MIGRATION OF THE CISCO 51 creases noted are probably due to the cooling of the epilimnion that happened to occur between these dates, causing the fish above the thermocline to scatter. The increase in males would indicate that still more fish of this sex had moved below the thermocline. The incomplete series of July 17 could not be included in this graph but it will be remembered from figure 15, and previous discussion (p. 41), that on this date there was an enormous increase in numbers of large and medium fish. Among these fish there was a high percentage of males (table 8). By July 23 there had been a further increase in the medium fish which must have been for the most part females. The migration out from the hypolimnion is illustrated in the right-hand panel. Here the July 23 to 26 series has been taken as unity. The August 15 to 20 sample shows a decrease in the males in some of the upper, but not the largest, size classes. By September 4 to 9 there had been a general loss in the size classes as low as 23.5 em. The two lower graphs show a concentration which is more decided in the case of the males. In the last series males predominate. In summing up it would seem that a consideration of the sex ratios of the various series makes possible this further description of the migration. The largest male ciscoesmigrate to deep water earliest and are followed by smaller males and the largest females. In their turn the smaller ciscoes migrate in, according to their size and sex with the smallest females being the last, or the least likely, to migrate. In leaving the hypolimnion the last to leave are those male fish which entered earliest. Changes in Sex Ratios in Catches at Station 3 This is the station in water of medium depth (45 feet) where the ciscoes accumulate before descending below the thermocline. The changes in numbers at this station have been discussed on pages 23 et seq. Table 11 gives the number of each sex taken in 1934 and The catches in the middle of July show a predominance of


![SUMMER MIGRATION OF THE CISCO 53 Early Catches in Shallow Water In 1935 four samples were taken by gill nets in water 15 feet deep in West bay ([11, 6],](/docs-images/71/65529186/images/30-7.jpg "figure 1, opposite p. 10), over the period from May 15 to May 31. In these, 129females and 120 males were taken.")


30 52 SUMMER MIGR1\.TION OF THE CISCO males in both years. This would seem to indicate that the fish are partly limited in their movements by teperature conditions before they descend below the therm.ochne. hat is, while all fish taken in the epilimnion may stllbe eedm?, even at the surface, some may be more restricted in their movements than others due to their inability to stay as long in the upper warmer w'ater. Femles which.are apparetly less sensitive than males, may still be moving over wider areas. Males while able to feed even in the surface waers, may be more restricted in that they must descend occasionally to cooler water. TABLE n.-sex ratios at station June 23 July 17 Date... May - 0' 9 0' 9 0' 9 Small Medium Large TotaL Date May ' 9 Small... 3 Medium Large 1_3_1_8 _ Total July 24 August 0' 9 0' The earlier movement of the older fish towards deep water is perhaps indicated by the fact that females predominate in the large fish taken in July in shallow water, while males are in the majority among the medium fish. The actual percentage of females is 59 per cent. of the large fish and 44 per cent. of the medium; the difference between these two percentages is 15 ±6 per cent., which is statistically significant. The July 24, 1934, sample, taken after most of the fish had left shallow water, shows a preponderance of females, but the sample is too small for the sex ratio of 10 males to 18 females to be accepted as trustworthy. SUMMER MIGRATION OF THE CISCO 53 Early Catches in Shallow Water In 1935 four samples were taken by gill nets in water 15 feet deep in West bay ([11, 6], figure 1, opposite p. 10), over the period from May 15 to May 31. In these, 129females and 120 males were taken. ANNUAL DIFFERENCES IN MIGRATORY ACTIVITY As may be expected, there are differences in the dates when the population moves in different years. Evidence for these annual fluctuations has appeared at various times during the previous discussion. In this section it is. brought together in an orderly manner. The accompanying table (table 12) summarizes the differences found in the several years. TABLE 12.-Annual differences in the migration of the ciscoes to the hypolimnion. Average July temperature Rank Year Migratory activity 0-30 feet 21.1 C Fish left shallow water between July 16 and Fish left shallow water by July 9. Fish left surface suddenly July 10. Large migration to deep water between July 17 and 24. Fish still in shallow water on July 25. Fair numbers still at surface at the end of July. Many ciscoes still in foot water on July 30. Least oygen depletion it;! hypolimnion. Records Inadequate but migration probably very incomplete. Since it seems probable that temperature is the major agent in bringing about this migration, the years have been arranged in order of the average temperature of the upper 30 feet of water for the month of July. There are only sufficient data for the discussion of the downward movement. In four of the seven years the ciscoes had vacated the shallowwater by about the middle of July. In the other three they were still present, at least in fair numbers, by the end of that month. These differences in the time of migration are


 will be referred to here as occasion requires.")
 It seemed evident that these fish had not been feeding for some time before capture.")


31 54 SUMMER MIGRATION OF THE CISCO correlated closely with the average temperature in the shallow water. The correlation, however, is not absolute; it would seem that if the temperature reaches a certain maximum, migration takes place. Below that temperature migration is incomplete or delayed. FEEDING ACTIVITY Introduction In 1935 the alimentary tracts of all fish captured in the oblique series were examined and the contents of the stomachs analysed. This somewhat extensive task was accomplished through the co-operation of Dr. R. R. Langford, who was engaged in an investigation of the plankton of the lake. Dr. Langford is reporting the results of the stomach analysis, and his paper (Langford, 1938) will be referred to here as occasion requires. In working over the material, it was noticed that the fish sometimes had their alimentary tracts completely empty, even of parasites. (The pyloric caecae were not examined.) It seemed evident that these fish had not been feeding for some time before capture. Fish "empty throughout" were recorded as such, and it appeared that whenever there were many fish without food in the stomach, the majority of these had the intestine also empty, except in the early spring when the fish were not feeding very heavily." Feeding in Shallow Water In the early spring little food was found in the individual stomachs and there was a fairly high percentage of empty stomachs. As the season advanced more food was found per stomch and the number of ei?pty stomachs dropped. In July practically all the fish taken in shallow water contained food. At thi.s tim, whe.n taken at night, they were found gorged to repletion WIth winged mayflies. The few individuals whose stomachs were empty had apparently ceased feeding. With the appearance of these non-feeding fish in the catches the number of fish taken in shallow water dropped. '.GForfuller discussion of the relation of the volume of stomach contents to feeding see Langford (1938). SUMMER MIGRATION OF THE CISCO 55 Feeding in Deep Water There is a close connection between the migration to the hypolimnion and the presence of fish which are "empty throughout" in the catches. Whenever an increase was found in the numbers of fish taken in the hypolimnion during the downward migration, that increase was correlated with an increase in the number of fish captured in which the alimentary tracts were completely empty of food. In the previous section it was pointed out that in July a few such non-feeding fish were found in the shallow water catches at station 3, and it was suggested that the fish stopped feeding just before migrating. Confirmation of this belief was found in the July 17 series of station 4, in which a sudden increase occurred in numbers of fish taken below 45 feet. In this series there were large numbers of non-feeding fish in the nets just above the thermocline. This sample was apparently taken from the population just as it was descending to the hypolimnion. In order to illustrate this relation between feeding activity and the downward migration and to show further features occurring later in the summer, figure 21 has been prepared. In this graph the vertical distribution of the fish taken at station 4 is shown. Samples taken in each 15 foot stratum have been grouped into two classes: fish whose stomachs contained at least a trace of food-fish with "full stomachs", and fish whose stomachs were empty-fish with "empty stomachs". The latter fish were in the main "empty throughout", and there is little error in considering this group as a whole to be non-feeding fish. In the graph, fish with "full stomachs" are indicated in black, and those with "empty stomachs" by a white rectangle. Since there are differences in the rate of migration of fish of different sizes, the ciscoes taken have been grouped into the " sma 11"", me di ium ", an d "1 arge " groups used previously (p.?9). The feeding activity of these groups will be dealt with In the order in which the groups migrate to the hypolimnion. It should be noted that in order to show up the small catches of June and early July the first three series are plotted on three times the scale used for the later samples. (See appendix 1.)
 LL I o 'I 1/1 (a) Large Fish.")


32 56 SUMMER MIGRATION OF THE CISCO SUMMER MIGRATION OF THE CISCO 57 w z :; u o It W Ị... o 'i o N V :x: II) LL I o 'I 1/1 (a) Large Fish. The large fish are the earliest to arrive in any numbers in the vicinity of station 4. In the first series, taken June 10to 13,most of the large fishwere found in depths of less than 105 feet. At this date the thermocline was not as yet established. The fish were probably all feeding, for no fish "empty throughout" were noted and the few fish which had empty stomachs had in all likelihood digested, before the net was lifted, the food that had been in their stomachs when captured. By June 20 when the next series of nets was set, there had been a considerable increase in the numbers of large fish in this locality. This increase equalled in numbers the nonfeeding fish in the sample. Between June 23 and July 3 the surface waters coled and there was apparently no further migration to deeper water. Ciscoes were taken in the July 3 to 6 series in about the same numbers as in the previous one. This time, however, most of the fish had stomach contents which would suggest that those fish which were not feeding about June 20 had begun to do so by July 3. Coincident with the large increase in catch on July 17, there was a corresponding increase in the number of fish "empty throughout". It was in this catch that the majority of the non-feeding fish were just above the thermocline. In the July 23 to 26 series the majority of the fish were just below where the thermocline had been on July 19. In this catch a difference can be seen in the vertical distribution of feeding and non-feeding fish. Fish with stomach contents were found most abundantly close to the bottom; empty fish were taken in the greatest numbers in the upper hypolimnion. In the August 15 to 20 series, feeding fish were still found in the greatest numbers at the bottom, but the non-feeding fish had scattered downward until they were fairly evenly distributed throughout the hypolimnion. Two changes will be noticed in the early September series. A decrease in the proportion of non-feeding fish will be seen which means, presumably, that some individuals previously not feeding had started to feed. There had also been an upward shift in the population, which had resulted in the


 Small Fish.")

33 58 SUMMER MIGRATION OF THE CISCO SUMMER MIGRATION OF THE CISCO 59 lowest 15 feet being vacated by all except a few non-feeding fish. It is difficult to decide whether there is a difference in the upward movement of the feeding and non-feeding groups, since the matter is complicated by the fact that already there had been a migration of some large fish from the hypolimnion (p. 43). By the time that the last series was taken, September 18 to 21, many fish had left the hypolimnion. In this series feeding fish were found only in the vicinity of the thermocline, and those taken above the thermocline contained food which must have been gathered in the hypolimnion. Empty fish were taken at all depths. Among these there must have been both fish which had not been feeding in the hypolimnion and fish which, while they had been feeding in the hypolimnion, had on leaving it stopped feeding. The length of the period during which ciscoes do not feed after returning to the epilimnion in the fall has not been determined. (b) Medium Fish. The feeding activity of the medium fish shows the same characteristics as were pointed out in the case of the large fish, but they differ in a degree corresponding to the difference in migration. Few medium sized fish were taken at station 4 during June and early July. The first time that they were taken in any numbers was on July 17, and in this series a large number of non-feeding fish were taken above the thermocline as in the case of the large fish. Between July 17 and 24 there was a further increase in the numbers of medium fish and there was again a corresponding increase in the number of non-feeding fish. The non-feeding and feeding groups in the medium class show the same vertical distribution as that found for the large fish on this date. In August the medium fish also behave in the same manner as the large fish. In September there is again the upward shift of both feeding and non-feeding fish, and the increase in the feeding group. In the "medium" group very little migration to the epilimnion had taken place by September 4, and it can be seen that the feeding section of the population had shifted from the bottom to a greater degree than had the non-feeding group. By the time that the September 18 to 21 series was taken, most of the medium fish had left the hypolimnion and they, like the large fish, do not feed immediately upon entering the epilimnion, since again the feeding fish were all found below or near the thermocline. (c) Small Fish. In the data for the small fish there may be seen the same cessation of feeding before entering the hypolimnion, the same resumption of feeding in September, the same upward movement of feeding relative to nonfeeding fish, and the same second lull in feeding activity on returning to the epilimnion, that have been described in the two larger size groups. Comparison of the Feeding Activities in the Three Size Groups It has been stated that the difference in feeding activity shown in the three groups is one of degree. The largest fish enter earliest and more individuals of this group feed in the hypolimnion. This can be seen when the proportions of feeding and non-feeding groups, taken in the July 23 to 26 series, are compared. TABLE 13.-Comparison of feeding activity in the hypolimnion in different size groups of ciscoes taken, July 23-26,1935. Percentage of group with Size group full stomachs Small Medium Large This correlation of feeding activity with time of migration can even be found within one group. It has already been pointed out that due to weather conditions at the end of June, migration did not proceed steadily, but practically stopped for a week or ten days after some of the largest fish had descended to the hypolimnion. This group of the large fish apparently resumed feeding within that length of time.


 but fast throughout August, and perhaps throughout")

.")


34 60 SUMMER MIGRATION OF THE CISCO Large fish migrating later took much longer than this to begin feeding in the hypolimnion; those migrating after July 17 probably do not feed again until September. Not only is the extent to which fish feed affected by the time of migration but the nature of the diet is also influenced. Fish migrating early feed almost entirely on copepods of two species and on Mysis relicta during the summer months. Due to the peculiar behaviour of Diaptomus oregonensis, a species in which the adults breed in the extensive epilimnion of lake Nipissing while the young, after considerable growth, descend in numbers to the hypolimnion, those fish which feed in the hypolimnion are able to obtain a plentiful supply of food. Late migrants, on the other hand, spend July in the epilimnion and feed well on the emerging mayflies at night and to some extent on daphnia during the day (Langford, 1938) but fast throughout August, and perhaps throughout September too. The differences in vertical distribution of feeding and non-feeding fish observed in the small and medium classes in the September 4 to 9 series lend additional support to the hypothesis that the ciscoes which are most sensitive to high temperatures are also most sensitive to unfavourable concentrations of dissolved gases (p. 45). THE RELATION OF THE SUMMER MIGRATION TO GROWTH Introduction The population is by no means homogeneous with respect to its migratory habits and feeding activities. This heterogeneity is due to the different response exhibited by fish of different age and sex or of different constitution. We have already seen that all individuals in the population do not share alike in the food present in the lake or even in one locality. The temperature experiences of the various groups also differ to a marked degree. Those fish which migrate below the thermocline experience during the time the lake is free of.1,,, i!, L / SUMMER MIGRATION OF THE CISCO 61 ice, two periods in which they are in warm water separated by an interval during which they are in quite cold water. The relative proportions of these warm and cold water experiences vary with the date at which the fish migrate. The accompanying graph (figure 22) illustrates the probable temperature experiences of certain groups during It is of necessity rather complicated by the crossing of lines because the temperature experiences of the groups are rather involved. The number of dots which break each line indicate the order in which certain groups entered the hypolimnion. ---, I - - L:- --- i "-, - L\ i - ' \ I j U '. '\ \ 1 i'\ / '. \ : : j?s,;l-.,,..:..-"..' L ".._"0 - '",\\ f::::. -.., ',-,-- --l June. Sept."'b. Jul:t A"uJvaf FIGURE 22.-Probable temperature experience of certain groups of ciscoes in The temperature experience of each group may be traced by following the appropriate line. For instance, fish entering deep water early in June are indicated by the line broken by a single dot. These fish spend May in water warming from 4 e. to about 12 e. In June they descend to water at 8 e. and they remain in water at this temperature during July. In August they may move up into the upper hypolimnion, where the temperature is about lo e. In September, due to the descent of the thermocline, they are again forced into water at a temperature of 8 e. and they were still there when investigation ceased for the season. Probably they return to the epilimnion in October, when the temperature has dropped


 245 ( 24) Sept. 30-0ct. 2 141 ( 1) 202 (15) 230 ( 25) Nov.")
 July 16-17 141 ( 6) 190 (11) 216 ( 45) 235 ( 13) July 24-Aug.7 140 ( 1) 193 (16) 222 ( 13) Aug. 7-9 141 (191) Aug. 13-18 195 ( 9) 221 ( 61) 238 (167) Sept.")
 Sept. 27 78 ( 6) Aug. 25 64 (13) Aug. 7 69 (1) Aug. 26 65 ( 5) Aug. 9 70 (1) Aug. 13 68 (1) 1934 Aug. 22 69 (3) Aug. 31 73 (1) July 23 55 ( 6 July 26 56?")
 SUMMER MIGRATION OF THE CISCO 63 that these groups spend, during the whole year, about the same length of time in warm water with the difference that the.")

.S.p. o observed cokuloted (Tobie '18) E o o '\" J FI ge d,n 9s,,--Ir-'...Z' - - <' - - - - :-, -- 111_1---'4 FIGURE 23.")
35 62 SUMMER MIGRATION OF THE CISCO to 12 e. or thereabouts. This group of fish consists in the main of the largest ciscoes, but also contains progressively fewer of the smaller size classes. The largest ciscoes spend the least time in water above g0e. The warm water experiences of the other groups vary with the time of their migration both in and out of the hypolimnion. The smaller fish being the last to migrate downwards stay longest in warm water in the spring, but they are quite late in returning to the epilimnion in the autumn. On the other hand, some individuals of the size classes of 25 to 27 ems. migrate moderately early and leave the hypolimnion first of all. These two groups are indicated by lines broken by four and three dots respectively. It is possible TABLE 14.-Growth of various age groups of lake Nipissing ciscoes during the season of open water. Standard length in mm I II III IV June ( 42) 190 (10) 220 ( 4) 260 ( 2) July (14) 224 (113) 243 ( 29) July 20-Aug ( 24) 200 (48) 225 (183) 246 ( 39) Aug ( 13) 245 ( 24) Sept. 30-0ct ( 1) 202 (15) 230 ( 25) Nov ( 8) 237 ( 22) 249 ( 12) 1934 May ( 7) 234 ( 22) May ( 2 May 28-June ( ( 2) 230 ( 40) June ( 4) 185 ( 7) 209 ( 25) 236 ( 59) July ( 6) 190 (11) 216 ( 45) 235 ( 13) July 24-Aug ( 1) 193 (16) 222 ( 13) Aug (191) Aug ( 9) 221 ( 61) 238 (167) Sept ( 3) 196 ( 3) 223 ( 17) UO ( 31) O-Group Aug (17) July (4) Aug ( 10) Aug (14) July (1) Aug (14) Aug (1) Sept ( 6) Aug (13) Aug (1) Aug ( 5) Aug (1) Aug (1) 1934 Aug (3) Aug (1) July ( 6 July 26 56?100 Aug ) Sept ( 1) SUMMER MIGRATION OF THE CISCO 63 that these groups spend, during the whole year, about the same length of time in warm water with the difference that the. group of smaller fish stay in the epilimnion longer in the spnng, while the larger fish return to it earlier in the late summer. Some individuals never descend below the thermocline' the possible temperature experience of the hardiest of these is indicated by the broken line. Among this group are the fingerlings f34 E. u r"t 1m --- III OJ -em h.-- 0/ 1-.r' r OJ t-!!/ 0 t>»: 0 / j/ = c.j I,/,t> i> 9'» '<r- Moy Jun.Jul. Aug. Sep.Oct. Nov. May J",. July AuC).S.p. o observed cokuloted (Tobie '18) E o o '" J FI ge d,n 9s,,--Ir-'...Z' - - <' :-, _1---'4 FIGURE 23.-Growth of various age groups of lake Nipissing ciscoes. Seasonal Growth :I reoa 3,..., <. - b?' July AU9'"'S t Septe""Mr Figure 2 illustrates the rate of growth of the age groups o to IV dunng 1933 and This graph is plotted from the data in table 14. In all the. age groups shown the greatest amount of growth taks place m May, June, and July. This growth is made dun?-g the spring period in the epilimnion, when the fish are feedm?"well.7 Growth slackens when the fish stop feeding and mlgrat to the hypolimnion. The fingerling group, which does not migrate, also suffers a depression in growth during August..The reason for this is not clear but it may be connected With the fact that they occupy at this time the 'See also Rile (1936), pp


, p.219. C'I:> 0>... C'I-...,...; C'I:> 0>.")

,-\"!")


36 64 SUMMER MIGRATION OF THE CISCO SUMMER MIGRATION OF THE CISCO 65 marginal territory of the thermocline. In the fall, growth is recommenced in the age groups 0, I, II, and III. In winter there is no detectable growth. The mid-summer depression in growth is reflected in false annuli laid down in the scales. These checks show most clearly in the fingerling stage by virtue of the broad band subsequently laid down during autumn growth. 8 In figure 24 two scales are shown, taken from two fish in the 1933 year class. The left scale taken FIGURE 24.-Scales of two ciscoes of the 1933 year class illustrating the summer check. X 20 ca. from a fingerling captured during September, 1933, shows the narrow circuli laid down in August. The right scale was taken from a fish of the same year class captured in 1934; within the first annulus and outside of the "August band" is a region of broad circuli laid down in the fall growth. In the higher age groups the variation in individual growth rates becomes so great that our samples are inadequate for showing the growing season. 8See also Hile (1936), p.219. C'I:> 0>... C'I-...,...; C'I:> 0>... E ṣ.,.,..<::.... boo c ';:: :::l "C Ul 'u eo c: 'in tn '0. Z J.j '0 Ul 0. :::l o.... :.0..,.0 "C., c: ' os e e,ṣ, 'in '" Jl..o"C...c: os...., o > -e c: os >< C'I "<I' ;; : C'I:> ui ọ... 1 gc'i:> 8oot:::',-",-,,G C'lC'I:>C'I<O "<I' oot--<ot-- t-- C'IC'IC'IC'I C'I ;; c;'8cq'0),-"!:3,,-,, "<I'C'lC'lO C'I <0 <0 <0 <0 <0 C'IC'IC'IC'I C'I t--c'lc'i:> ee C'I<O"<I'lQ lqlqlqlq "<I' lq C'IC'IC'IC'I C'I '-001""""'4 :;i't:::'s'g. C'I:> C'I:><O C'lC'I:>C'I:>O>.,.-,-",-",-",-"... '-"'-"'-" ooot-o),... C'l:>t--lQoo C'I "<I'"<I'"<I'C'I:>"<I' "<I'"<I'"<I'C'I:>"<I' C'IC'IC'IC'I C'I C'IC'IC'IC'I C'I CQOOC;;- 1"""'tC'Ot- """""" '-"'-"'-"'-" (j)'i""""itcoo co C'lC'I:>C'I... C'I C'IC'IC'IC'I C'I S'8 1-4,-,e.... C'I:><OO>lQ C'I:> 00>0> 0 C"lC"l'l""""l,...-l C\I., 0,,", EJL..;C"i.q; os C'I:> C'I:> C'I:> C'I:> :><::E o C'I C'I:> rnrnui.....,..,.., c,c.. 00"<1' 0>"<1'00 C'lC'I:>C'I e.ee. l""""'41""""'toqol co 0"<1'0 "<I' C'l:>C'I:>"<I'C'I:> CQG'c.l '-"'-"'-''-' 0000>00 t-- oooo t-- 00 C'lC'IC'I:>C'I C'I t--c'i:>"<i',-,,,-,8'::::" C'I"<I'<Ot-- 0> ot--<o<o <0 C'l:>C'IC'IC'I C'I G;:;-C;;--;.o <0"<1',-,,-,,-,'-" 0"<1'0>00 C'I <O<OlQ<O <0 C'I::-lC'lC'l C'I oo8t:::'8 ooc'l:>c'i:> '-'.. t--"<i'"<i' lq lqlqlqlq lq C'IC'IC'IC'I C'I t::'8oo C'l:>OC'l:> '-''-''C'-' t--c'llqlq "<I' C'l:>C'I:>C'IC'IC'I C'IC'IC'IC'I C'I 00:;' e "<I'C'I 00 C'IC'I "<I' o C'I Jl.,, c: ""'., e 18 eg:s 18 ::E :E


37 66 SUMMER MIGRATION OF THE CISCO General Growth Curve of the Population Figure 25 shows the average size attained by different age groups based on samples taken during the years 1931 to The lengths given are the observed sizes of fish taken in July or August, and thus include some of the growth made during the current year. The graph was obtained by plotting the data contained in table 15. E CJ ID (1) CD C\I I fo- (!J Z Wo...JC\I 8 e Yrs; FIG,uRE 25.-Aerae length attained by ciscoes of different age groups captured In the hypolimnion In the years inclusive. Data from table 15. There seems to be a temporary acceleration in growth in about the eighth year. It is believed that this is significant, although in the higher age groups samples are small and scale reading becomes more unreliable as an index of age. However, if the curve which fits the lower age groups were produced it would tend to approach a constant value considerably below the average length of certain groups of fish, placed together by reason of a similarity in the markings on their scales. Moreover, Pritchard (1931) found a similar growth curve in the bay of Quinte population of L. artedi. SUMMER MIGRATION OF THE CISCO 67 This increase in rate of growth is correlated with the increase in the percentage of fish feeding in the hypolimnion, which is found in the older age classes. The following table, compiled from the oblique series of July 23 to 26, 1935, shows this. TABLE16.-The percentage of feeding and non-feed.ing fish in the oblique series at station 4, July 23-26,1935. Grouped according to age. Age Males I II III IV V VI VII VIII IX X Per cent. feeding Per cent. not feeding Total taken Females Per cent. feeding Per cent. not feeding Total taken Relation between Feeding Activity in the Hypolimnion and Rate of Growth Not only is there the correlation between the general growth curve and the feeding activity of the population in the hypolimnion which has been discussed in the previous section but there is such a correlation within each age group. This is shown in the following analysis of the sample taken in the July 23 to 26 oblique series at station 4. The results are tabulated in table 17 and are illustrated in figure 26. In the age groups I to VII, fish classified as feeding are larger than non-feeding fish. The extent of the differences between the groups is irregular, but this is to be expected since in anyone group the probable error of this difference is large; for this reason the great difference between the feeding and the non-feeding fish in group I is likely to be due merely to chance. In the age groups VIII and IX the feeding fish are on the average smaller than the non-feeding fish. No non-feeding fish were taken in group X. Parallel differences are found in males and females (table 17). In spite of these irregularities the average difference is significantly greater than zero. No explanation can be offered for the smaller size of the feeding fish in groups VIII and IX. It may be due to random error, although the fact that the


 'c:: :;0 bi)'\" e 4> ;a \"'a::g z :... 00 C'I B t!")


 f '4\" w(\j -I QJ 010 CIJ Q) ) <l: <0.,.")
![. Feeding o Non-FeedIng I n m N ]Z "SIT lzii :szdl IX X Aqe](/docs-images/71/65529186/images/38-17.jpg "Group FIGURE 26.")


38 68 SUMMER MIGRATION OF THE CISCO c::.9...,..., '" III -:;; c:: J.l..., '",,; 0.. ;:l e bd '"..., c:: e --- >< C'I.0... g cb C'I ;:l u-;:::;- ",,'-''-' t- t-t- C'IC'I ;;;-C(;' '-''-' -... > C'IC'I _ 0; '-''-' ;>t-... "'''' C'IC'I c;o;- e.e "' :0._ c:: C'lt- >B I.t:: \l.l 0 C'I C'I :0 -( '" '=o c:: "0 c:: '"eo c :0 J! '0 e a.s rjl.c:: r..:... f<l,., III t >;:: ",00 C'IC'I >;e -C'lt-... C'IC'I _..... '" C'I -'-''-' -00", C'IC'I t:'... e. -"' u;- -'-''-' 000 t-oo 'bi) 'c:: :;0 bi)'" e 4> ;a "'a::g z : C'I B t!?2 C'IC'I ,-,.... t-t- C'IC'I ,-, 000> t-oo C'IC'I ee... 0> ",00 C'IC'I e;:)l:o ee C'ltoo C'IC'I GCQ' t: C'IC'I C'IC'I 8 ee ee "'''' '"....n... bij :.S!Il bij-':! c:::tj c1j._ "0 ' 4>",g Z sc'i C'l00 t-t- C'IC'I.... t-t- C'IC'I o t- '" C'IC'I OO ",00 C'IC'I C'I C'IC'I... '" e!; t-oo C'IC'I t-oo >00 '" 'bi)!il.c:: QJ 00- x '1j..d:.a al '"...,"'c:: 0",0 ixlz SUMMER MIGRATION OF THE CISCO 69 relation is the same in both sexes argues against this, or to selection brought about by gill nets since 3 inch stretched mesh was the largest used, and the largest fish in these year classes may not have been taken. This difference in growth rates between feeding and nonfeeding fish, which persists through the age classes, lends force to an implication which up until the present could not have been read into the data; namely, that while age is the pre-. (JIen EN () f '4" w(\j -I QJ 010 CIJ Q) ) <l: <0.,.. Feeding o Non-FeedIng I n m N ]Z "SIT lzii :szdl IX X Aqe Group FIGURE 26.-Average lengths of feeding and non-feeding ciscoes in different age groups taken at station 4, July 23-26, dominant factor in modifying the migratory activity of an individual, and that after age, sex is next important in this respect, physiological differences in individuals of a given age and sex also play their part in deciding the response to factors bringing about migration. This would mean that not only is there a definite sequence in the migration of the population as a whole, which can be seen by the observation of such attributes of the individual as size and sex, but that within one group of individuals, all within the range of one class with respect to size (age) and sex, there is a definite sequence.


 summarizes this comparison.")

 =axlog (standard length at capture -length")


39 70 SUMMER MIGRATION OF THE CISCO SUMMER MIGRATION OF THE CISCO 71 In the younger age groups the few individuals which migrate early may be considered to be precocious since they behave like older fish in this respect. Such fish which migrate to the hypolimnion early enough to resume feeding in July, when young, will behave in the same way throughout their subsequent lives. In later years other fish of the same year class will join them in feeding in the hypolimnion, and these, too, when they have once started to feed in the hypolimnion will do so in all subsequent years. If this were not so-that is, if every year it was a matter of accident whether certain individuals of a given age group were in the feeding or the non-feeding class in the hypolimnion-then any differences in the average size reached by members of the feeding and non-feeding groups in the hypolimnion would also be due to chance, and would be as likely to be negative as positive except for a slight advantage that might be gained in the current year. In the particular sample discussed they would have been largely deprived of even this slight balance of growth in their favour, since the sample was taken just after the migration from the epilimnion was complete; thus the fish which were not feeding at the time the sample was taken had been feeding freely up until a week or two before their capture. Relation of the Summer Migration to Lee's Phenomenon In the course of testing a new method for the calculation of body lengths of fish from scale measurements (Fry MS.) samples of lake Nipissing ciscoes, taken from the bottom of the hypolimnion m late July and early August m three successive years, were used. Lengths calculated from the scales of the male fish taken in these samples were compared year class by year class. 9 The accompanying table (table 18) summarizes this comparison..9the scale formula used,,:as a':l adaptation of Huxley's formula for growth partition y=bx a The logarithrnic form of the formula was used with an allowance for the growth of the fish previous to the appearance of the scales. This formula is log (antero-posterior diameter of scale) =axlog (standard length at capture -length at scale formation).+log b. A. calculator which solves this formula for different species without the neceslty of calculating the constats, is described in a master's thesis (Fry, 1935) deposited In the hbrary of the University of Toronto. f2' 8 o O> 00 -H-H 000> 0000 Goo-;::;- t:, I'-lQ OlQC'I.-<o C'I.-<C'I t1-+1 -H -H-H-H Ol'-lQ COlQO> lq OC'l C'IC'IC'I C'lC'IC'I.-<C'l00.-<.-<.-< -H-H-H I'-lQOO 000> C'lC'I'-<.-<.-<..-< -H-H-H lql'- lqlq.-<.-<.-< toooeq e.-<o co 1' H-H-H C'I 0>0>0> ooo; et:. I'- I'-CO '-<00 -H-H-H ;:!;.-<.-<.-< ooo> et:...-< 00 C'llQlQ.-<00 -H-H-H ""'C'I < o CQ 0>... S' ẹ o -H o ee C'I... 1' H-H lqlq 00 C'IC'I ":... -H... o C'I :;;;- C'I 0>co 00 -H-H 0>00 0>0> CQ 0>... I' H-H -H.-<.-<.-< ::;It::' -;::; O> co H-H -H coo 0... co 0>


.")

, and their calculated lengths brought the average of the group lower and lower except for the length corresponding to the first annulus.")
40 72 SUMMER MIGRATION OF THE CISCO It will be seen that, no matter what the age of the fish when captured, the calculated values for the length of the fish at the formation of the first annulus, in a given year class, agree within the limits of probable error. Calculations at subsequent.annuli show Lee's phenomenon in that the calculated length at a given annulus is usually smaller when calculated from scales of old fish than it is when calculated from younger fish of the same year class. An exception to this rule is found in the groups III and IV where the calculated values in both groups agree. These discrepancies between lengths calculated from fish of different ages, but of the same year class, may be explained by the relation between migratory and feeding activity, and the rate of growth. In the first year of growth the fingerlings are all in the same locality in the region of the thermocline. Within the limits of our observations these all grow at about the same rate. In their second year certain fish migrate early to the hypolimnion and feed there. Early in their third year these return again to the hypolimnion, together with a few of their year class, which did not feed in the hypolimnion the year before. Our sampling for the scale study was confined to the bottom at 150 feet and the two-year old fish taken belonged largely to this select class, since the feeding fish are concentrated at the bottom in the middle of the summer (figure 21, p. 56). For this reason fish taken at the bottom when two years old show a high average value for the length attained at the time of the formation of the second annulus. The group from which this sample was drawn returned to the bottom of the hypolimnion in late July in subsequent years, but became more and more diluted by the addition of fish that previously had been in the non-feeding group when in the hypolimnion. These other fish grew at a slower rate (figure 26, p. 69), and their calculated lengths brought the average of the group lower and lower except for the length corresponding to the first annulus. The close agreement between III and IV fish must for the present be considered to be due to chance. SUMMER MIGRATION OF THE CISCO 73 The statement regarding the growth of the fingerling group was intentionally qualified. In Nipissing only about one-half of the five-year old fish, the greatest age of fish used in this comparison of calculated lengths, are in the feeding group, and perhaps if reliable averages could be calculated from higher age groups, Lee's phenomenon might also be detected at the first annulus. In lakes where the ciscoes live under conditions that are more severe than they are in Nipissing, this might be seen, since a differential mortality might remove the group of ciscoes in these lakes analogous to the "feeding" group present in the hypolimnion of lake Nipissing. This, of course, would shift the average much more quickly. Some evidence of differential distribution according to size of members of a year class even in the first year, can be found by comparing lengths calculated from fish captured in shallow water with those calculated from fish of the same age captured in 150 feet of water (table 19). TABLE 19.-Comparison of calculated lengths at the first annulus in ciscoes of the same year classes captured in deep and shallow water in (error given is P.E. = a M). Year class Shallow water Deep water Difference ±0.71 (27) 102±0.58 (59) 4± ±0.41 (24) 98±0.62 (22) 4±0.82 A difference may also be seen in a comparison of the actual diameters of the scales (table 20). TABLE 20.-Scale diameters in shallow and deep water catches, Annulus Shallow water Diam. mm Deep water Diam. mm A Possible Relation between the Summer Migration and the Development of the Germ Cells I t is conceivable that the length of the warm water experience in the fall may affect the rate of development of


 Not Ripe.")


41 74 SUMMER MIGRATION OF THE CISCO SUMMER MIGRATION OF THE CISCO 75 the gametes, and thus, provided that the water cools to spawning temperatures quickly enough, influence the time at which certain fish spawn, since the fish which leave the hypolimnion last may not be ripe until after the earlier migrants are already spawning. This, however, is a suggestion which must be cautiously advanced, since it has been impossible to test this hypothesis directly. It may be seen, by reference to figure 27, that the eggs in the ovaries of Nipissing ciscoes grow rapidly in the fall and may not in all Mo::{ FIGURE 27.-Rate. '. of growth of the eggs in the ovary of the lake Nipissing cisco. cases have completed growth before the water temperature has dropped to 4 C., the temperature at which ciscoes are considered to spawn (Cahn, 1927).. ince practc?-l?ifficulties prevented a study of the spawning in lake Nipissing, an attempt was made to discover a trend in size in spawning ciscoes in the eastern end of lake Ontario during November, 1934, but the results were inconclusive. Three samples were taken on November and 30, respectively, from schools near the south-western' end of Amherst island. These fish were captured in gill nets, fished commercially by Mr. S. Thompson of Pleasant Point. From his catches females were selected; these were measured and on the basis of an examination of the gonads the fish were classified in the following four categories. (a) Spent. Few or no mature ova within the ovarian membrane, ovigerous stroma contracted. (b) Partly Spent. Some eggs within the posterior part of the ovarian membrane, ovigerous stroma contracted. (c) Ripe. Ovarian membrane filled with mature eggs, ovigerous stroma contracted. (d) Not Ripe. Ovaries filled with mature eggs, ovigerous stroma expanded. Two things were found in these samples. Firstly, all fish were not spawning at the same time, for in the last catch there was still a number of unripe fish. The proportions of fish in different stages taken in the three samples are given in table 21. Secondly, the fish in the sample taken on ovember 26 had an average length which was significantly greater than that of the sample taken November 22. However, the sample of November 30 had the lowest average length of all, but this difference was not significant. The only conclusions that may be drawn from these results are that all ciscoes are not ready to spawn at the same time, and that spawning schools in the same locality may differ in their size compositions. There is no evidence either for or against a temporal succession that is correlated with size, and hence with the fall migration from the hypolimnion. TABLE 21.-Condition of the ovaries in three samples of ciscoes taken at the spawning season in lake Ontario in Number Per cent. Per cent. Per cent. Per cent. Date taken spent partly spent ripe not ripe Nov Nov Nov


42 76 SUMMER MIGRATIO OF THE CISCO SUMMARY 1. In lake Nipissing there is a general migration of the cisco population from shallow to deep water in late spring and early summer. This movement takes most of those members of the population which participate in it below the thermocline. They remain in the hypolimnion for some time, scattering downwards until evenly distributed throughout its extent. During late August and September they rise from the bottom, concentrate under the thermocline, and most of them pass through the thermocline to return to shallower water before the fall turnover. 2. The downward movement of the fish is correlated with rising temperatures in the epilimnion. Their continued descent when they have passed through the thermocline seems to be a scattering comparable to the diffusion of molecules. The subsequent ascent from the bottom in late summer is correlated with decreasing concentrations of dissolved oxygen and increasing amounts of carbon dioxide in solution in the bottom water. A consideration of the actual concentrations of these substances in light of certain experiments indicates that it is probably the increase in carbon dioxide which is the more important factor affecting this movement. The concentration of fish immediately below the thermocline at this season is considered the result of the ascending population's avoidance of the warm water of the epilimnion when suddenly subjected to it after experiencing the cool, even-ternperatured waters of the hypolimnion. The final evacuation of the hypolimnion is due to the destruction of this balance between the opposing effects on the ciscoes of the warm water above and the unfavourable concentrations of dissolved gases below. This destruction is brought about by further cooling of the epilimnion, and a further increase of the concentration of carbon dioxide and the decrease of dissolved oxygen in the hypolimnion. 3. The migration to the hypolimnion is not a simple mass movement of the whole population in which the increase of population in the hypolimnion is due to the chance descent of schools below the thermocline. It is rather an orderly sue- SUMMER MIGRATION OF THE CISCO 77 cession of certain groups of individuals which migrate in the order of their size and sex. The downward succession is, first, the largest males, followed by large males and the largest females; these in turn are followed by smaller males and large females and so on. The two youngest age groups are the last to move downwards, and their migration is never as complete as that of the older groups. The upward movement is more complicated. Quite large, but by no means the largest fish, pierce the thermocline earliest. The order of leaving, subsequent to this movement, involves fish both above and below the intermediate sized class which left first. The smallest fish leave late and the last of all to go are the largest males. 4. These movements have been explained as follows. The succession observed in the downward movement, in which the largest males go first and small females last, appears to mean that the largest males have the lowest upper temperature threshold. The fish with low upper temperature thresholds are presumed to have also a low tolerance towards high concentrations of carbon dioxide. The complex order of return to the epilimnion depends on the quantitative balance between these two intolerances. 5. The extent of migration may vary from year to year. In four of the seven years in which the observations were made, the fish left shallow water by about the middle of July. In the remaining three, migration was still incomplete by the end of that month. This fluctuation of migratory activity is correlated with the average July temperature of the water less than thirty feet deep. 6. Profound changes in the feeding activity of the population are correlated with the summer migration. Fish apparently stop feeding just prior to migrating below the thermocline and do not begin feeding again immediately. The length of time during which they do not feed varies with the time at which they migrated. Fish migrating early may begin feeding about a week after entering the hypolimnion. The last migrants may not feed for a period of six weeks or even longer.


.")
43 78 SUMMER MIGRATIO OF THE CISCO When the fish first leave the hypolimnion in the autumn they again stop feeding for an undetermied p.eriod of tie. 7. With respect to the summer miratlon te CISCO population of lake Nipissing behaves as a single speces.. 8 There is a correlation between the summer migration and the rate of growth. Most of the grot? of.the population is made during the spring period in the ephmmon, t?e greater part of the population stops growing during the midsummer period, but growth recommences in the younger age classes in the autumn. 9. The migration to the hypolimnion complicates the annual cycle of temperature experienced by the cisco. Most fish spend a spring and a fall period in quite warm water separated by a midsummer period in cool water. Different groups of the population experience these two periods in different degrees, depending upon the times at which they migrate. 10. Certain individuals found to be feeding in the hypolimnion in July grow more quickly than individuals of the same age and sex which are not feeding in the hypolimnion at this time. The proportion of the members of a year class which feed in the hypolimnion in July increases as the year class becomes older. Correlated with this increase in feeding activity there is an acceleration in growth in the higher age groups. 11. There are individual differences in the age at which ciscoes descend to the hypolimnion early enough to feed there in July. Some fish feed there in their second season, others not until later than their seventh. Evidence is presented that suggests that when once a fish has fed in the hypolimnion it always does so in subsequent years. 12. The occurrence of Lee's phenomenon in calculations of the lengths of lake Nipissing ciscoes from scale measurements, has been explained on the basis of individual differences in migratory activity and the correlation of these with the individual's rate of growth. 13. A possible relation between the summer migration and the time of spawning has been suggested. SUMMER MIGRATION OF THE CISCO 79 DISCUSSIO The broad problem, towards the solution of which this study has been intended to contribute, is the problem of raciation in ciscoes. The immediate aim has been towards the solution of the following problems. Does the behaviour of the lake Nipissing population give any indication that selection could have any effect in altering the genetic constitution of an isolated population of ciscoes? What possibilities are there of the environment moulding the body form of ciscoes? The first of these questions may be answered in the affirmative. Certain members of the population are more limited in their movements, and more especially in their feeding activities by factors in the environment. This differential reaction indicates that selection may take place, since all individuals are not afforded an equal opportunity to move and feed. In some lakes this restriction may be so severe as to bring about the death of certain individuals (Hile, 1936; Cahn, 1927). There is also considerable opportunity for the environment to exert a moulding influence. Since the thermocline divides the lake into two regions, there may be wide fluctuations in the conditions under which the ciscoes live in lake ipissing without the population being affected by selection through fatalities. Temperature conditions in the lake fluctuate annually, but the important thing is that the proportions of the summer spent by the ciscoes above and below the thermocline vary from year to year. Thus in one year they may tay in the epilimnion during the greater part of the summer; III another they may migrate to the hypolimnion early in July. Consequently slight differences in epilimnial temperatures may have a very great effect on the temperature experience of the population. These fluctuations in temperature experience may affect growth rate and spawning time and through. these, and by other means as well, the form of the ciscoes may be affected. A study of the behaviour of the ciscoes suggests, then, the possibility of both a selection and a moulding. The difficulty


 and the cisco (Leucichthys artedi) in their relations to the region. Illinois BioI. Mon.")


![Glacial and post-glacial lakes in Ontario. Univ. Toronto Studies, BioI. 21. Pub. Onto Fish. Res. Lab., 10. Corkill, ]. M. B. 1935.](/docs-images/71/65529186/images/44-10.jpg "Seasonal variations in temperature and dissolved oxygen in lake Nipissing. Ph.D. Thesis, Part I, submitted to the Dept. of BioI., Univ.")
 based on six specimens from the type locality. Univ. Toronto Studies, Biol, 31. Pub.")
 and adjacent waters. Univ. Toronto Studies, BioI. 29. Pub.")

44 80 SUMMER M[GRATION OF THE CIsco lies in assessing the relative importance of each of tese processes on the fish Different sections of the population grow under different conditions which gives rise to a situation that affords an opportunity for the environmen.t t? ct on thm in different ways, but the reactions of the mdlvluals wlch place them in these conditions may be due to their heredity. Even if a perfect correlation could.be found beteen the characters of individuals and the envlronment to wlch they are subjected it would not be evidence that the envlro?ment alone was responsiblefor these differences. The.reactlOnof the individual which resulted in bringing it or Its offsp:mg into contact with that environment, must be taken into account. The matter becomes further complicated when the genetic differences between individuals are of su.ch nature as to determine the rate at which they change their migratory activity. BIBLIOGRAPHY Bajkov, A Biologicalconditions of Manitoban lakes. Contr. Can. BioI. and Fish..s., 5: The genus Leucichthys (ciscoes or tullibees) in Manitoban waters. Contr. Can. Biol, and Fish. N.S., 7: Birge, E. A. and C. Juday The inland lakes f Wisconsin, the dissolved gases of the water and their biological significance. Wise. GeoI. and Nat. Hist. Surv. Bull., 22, Sci. Ser. 7. Madison. Cahn, A. R An ecological study of southern Wisconsin fishes. The brook silversides (Labidesthes sicculus) and the cisco (Leucichthys artedi) in their relations to the region. Illinois BioI. Mon., 11: Clemens, W. A A study of the ciscoes of lake Erie. Univ. Toronto Studies, BioI. 20. Pub. Onto Fish. Res. Lab., The limnology of lake Nipigon. Univ. Toronto Studies, Biol. 27. Pub. Onto Fish. Res. Lab., 11. SUMMER MIGRATION OF THE CISCO 81 Clemens, W. A. 1924a. The limnology of lake ipigon in Univ. Toronto Studies, BioI. 24. Pub. OntoFish. Res. Lab., b. The limnology of lake Nipigon in Univ. Toronto Studies, BioI. 25. Pub. OntoFish. Res. Lab., 22. Coleman, A. P Glacial and post-glacial lakes in Ontario. Univ. Toronto Studies, BioI. 21. Pub. Onto Fish. Res. Lab., 10. Corkill, ]. M. B Seasonal variations in temperature and dissolved oxygen in lake Nipissing. Ph.D. Thesis, Part I, submitted to the Dept. of BioI., Univ. of Toronto. Dymond, J. R The fishes of lake Nipigon. Univ. Toronto Studies, BioI. 27. Pub. OntoFish. Res. Lab., A description of Leucichthys tullibee (Richardson) based on six specimens from the type locality. Univ. Toronto Studies, Biol, 31. Pub. Onto Fish. Res. Lab., Biological and oceanographic conditions in Hudson bay. The coregonine fishes. Contr. Can. BioI. and Fish. N.S., 8: and J. L. Hart The fishes of lake Abitibi (Ontario) and adjacent waters. Univ. Toronto Studies, BioI. 29. Pub. Onto Fish. Res. Lab., 28. and A. L. Pritchard The fishes of the Canadian waters of lake Ontario. Univ. Toronto Studies, BioI. 33. Pub. OntoFish. Res. Lab., 37. and A. L. Pritchard Some ciscoes or lake herrings of western Canada. Contr. Can. Biol. and Fish. N.S., 5: and V. D. Vladykov The distribution and relationship of the salmonoid fishes of North America and North Asia. Proc. Fifth Pac. Sci. Congo Victoria and Vancouver, B.c. Fisher, R. A Statistical methods for research workers. Oliver and Boyd, London. Fry, F. E. J A new method for calculating the growth of fishes from scale measurements. M.A. Thesis submitted to the Dept. of Biol., Univ. of Toronto.


 with special reference to the utilization of the limnetic")


45 82 SUMMERMIGRATIONOF THE CISCO Hile, R. O The rate of growth of fishes of Indiana. Dept. of Conservation, state of Indiana, Indianapolis The Fisherman. Vol. 4, no. 12. Grand Haven, Mich. December, Age and growth of the cisco Leucichthys artedi (Le Sueur) in the lakes of the northeastern highlands, Wisconsin. Bull. U.s.B.F., 48: Huntsman, A. G. and M. 1. Sparks Limiting factors for marine animals. 3. Relative resistance to high temperature. Ccntr. Can. BioI. and Fish. N.S., 2: Ide, F. P Contribution to the biology of Ontario mayflies with descliptions of new species. Can. Entomologist, 62: Juday, C. and E. A. Birge Dissolved oxygen and oxygen consumed in the lake waters of northeastern Wisconsin. Trans. Wisc. Acad. Sci., Arts, Lett., 25. Kendall, W. C Peritoneal membranes, ovaries and oviducts of salmonoid fishes and their significance in fish cultural practices. Bull. U.S.B.F., 37: Koelz, W Description of a new cisco from the great lakes basin. Occ. Pap. Mus. Zool., Univ. of Mich., no Coregonid fishes of the great lakes. Bull., U.S.B.F., 43: a. Leucichthys hubbsi a new cisco, from Ives lake, Marquette county, Michigan. Occ. Pap. Mus. Zool., Univ. of Mich., no The coregonid fishes of northeastern America. Papers, Mich. Acad. Sci., Arts, Lett., 13: Langford, R. R The food of the lake Nipissing cisco, Leucichthys artedi (Le Sueur) with special reference to the utilization of the limnetic Crustacea. Univ, Toronto Studies, BioI. 46. Pub. Onto Fish. Res. Lab., 57. McKenzie, R. A Cod and water temperature. BioI. Board of Canada, Progress Reports, Atlantic BioI. Sta., no. 12, October, I r SUMMERMIGRATIONOF THE CISCO 83 Mottley, C. McC The effect of temperature on the number of scales in the Kamloops trout, Salmo kamloops. Contr. Can. BioI. and Fish. N.S., 8: Neave, F A study of the mayflies (Hexagenia) of lake Winnipeg. Contr. Can. BioI. and Fish. N.S., 7: Pearse, A. S Distribution and food of the fishes of Green lake, Wisconsin, in summer. Bull. U.S.B.F., 37: Powers, E. B. et al The relation of the respiration of fishes to the environment. Ecological Monographs, 2, October, Pritchard, A. L Taxonomic and life history studies of the ciscoes of lake Ontario. Univ. Toronto Studies, BioI. 35. Pub. Onto Fish. Res. Lab., 41. Rawson, D. S The bottom fauna of lake Simcoe and its role in the ecology of the lake. Univ. Toronto Studies, BioI. 34. Pub. Onto Fish. Res. Lab., 40. Scott, W The lakes of northeastern Indiana. Investigations of Indiana lakes, 3, publication no. 107: , Dept. of Conservation Indianapolis, Ind. Shelford, V. E. and W. C. Allee The reactions of fishes to gradients of dissolved atmospheric gases. Jour. Exp. Zoo!., 14: Smith, F Variation in the maximum depth at which fish can live during summer in a moderately deep lake with a thermocline. Bull. U.S.B.F., 41: 3-7. Tester, A. L The selectivity of herring drift nets. Bio!' Board of Canada, Progress Reports, Pacific BioI. Sta., no. 24. Tippett, L. H. C The methods of statistics. Williams and Norgate Ltd., London. Tuttle, L. and J. Satterly The theory of measurements. Longmans, Green and Co., London. Van Oosten, J Life history of the lake herring (Leucichthys artedi Le Sueur) of lake Huron as revealed by its scales with a critique of the scale method. U.S.B.F., 44: Bull.


46 84 SUMMER MIGRATION OF THE CISCO Wagner, G The cisco of Green lake, Wisconsin. Bull. Wisc. Nat. Hist. Soc., 9. Wells, Morris M The resistance of fishesto different concentrations and combinations of oxygen and carbon dioxide. Biological Bull., 25: I r APPENDIX DISTRIBUTION OF FISH IN OBLIQUE CATCHES The following tables contain the actual numbers of fish taken in the vertical samples. At station 3 each 15 foot stratum was fished by three 50 yard nets including 1%', 231(or 2;4, and 3 or 331(inch stretched mesh. At station 4 this same gang of nets was used until July 17. To make a series the gang had to be fished three times with the order of the nets changed. Since there were only nine nets and the water was 150 feet deep, the bottom 30 feet were fished by one net, making 25 yards to a 15 foot stratum here. After July 17 gangs 2 and 2-A were used. These gangs were made up of only three 50 yard nets, gang 2 consisting of 1;4, 231(,and 3 inch mesh, gang 2-A having the same mesh except that 2 inch was substituted for 1;4 inch, since the 1934 year class seemed to be very poor and it was felt that of the young fish it was better to sample the large 1933 year class. With this three net gang 15 foot strata from 90 to 150 feet were fished with quarter nets; similar strata from surface to 90 feet were fished by 1/3 of a 50 yard net. In the tables the catches are analysed into size, depth, sex, and the state of the stomach (E stomach empty, F stomach containing at least a trace of food). In comparing these catches graphically, the actual catches have been multiplied by factors. The standard taken for figures 7 and 14 is the number of fish taken per 15 foot stratum by 50 yard nets fished for twelve hours. The catches at station 3 need no correction. The catches at station 4 before July 16 require only a doubling of the number of fish taken from 120 to 150 feet. The July 16-17catch was only 1/3 of a series and the numbers plotted are an estimate of a complete series. Later catches at station 4 require the numbers taken above 90 feet to be multiplied by three, below 90 feet by four and to be increased further by a factor to 85 I


47 86 SUMMER MIGRAJ'ION OF THE CISCO bring the length of fishing up to 12 hours. In figure 21 the standard is 50 yard nets for twelve hours for the first three series. For the late series 162/3 yard nets are taken as the standard. Other minor corrections were made in preparing figures 7 and 14. Fish over 20 em. taken in the smallest mesh were omitted but they have been included in the table. TABLE 7.-Numbers of ciseoes taken in oblique series at station 3,1935. Duration Fish caught of set Gear 20 em em. 25 em. hours E F E F E F 12 Gang 1 0 o Date June 13 July Gang 1 July 10 day Gang 1 August Gang 1 o 7 0 W 2 W o o no ciseoes taken at any depth Depth feet bot bot bot. TABLE 8.-Ciseoes taken in oblique series at station 4, June 10-13, Gang 1, Set 12 hours Small Medium Large d' Q d' Q d' Q E F E F E F E F E F E F Depth feet , , Depth feet o o o June 20-23, Gang 1, Set 12 hours Small Medium d' Q d' Q E F E F E F E F o o o o o '1 0 o o Large d' Q E F E F o ,. I Depth feet " SUMMER MIGRATION OF THE CISCO 87 July 3-6, Gang 1, Set 12 hours Small 1V1edium d' Q d' Q E F E F E F E F o o o o o July 23-26, Gang 2, Set 12 hours Small Medium Depth feet d' E F E Q F if E F Q E F August 15-20, Gang 2-A, Set 8 hours Small Medium if Q d' Q E F E F E F E F o Large if Q E F E F o o July 16-17, Gang 1. Set one night only Depth Mesh Small Medium Large Not feet ins. d' Q if Q if Q exam- E F E F E F E F E F E F ined ! ! I! t t I! Depth feet Large if 9 E F E F Large if 9 E F E F o


48 88 SUMMER MIGRATION OF THE CISCO September 4-9, Gang 2-A, Set 9 hours Small Medium Depth feet r3' E F 9 E F r3' E F 9 E F Depth feet September 18-21, Gang 2-A, Set 12 hours Small Medium r3' 9 r3' 9 E F E F E F E F o o Large r3' 9 E F E F o o Large r3' 9 E F E F SUMMER MIGRATION OF THE CISCO September over September TABLE 9.-Size composition of catches of ciscoes taken in oblique series at station 4. Length class cm over over June ri' 9 E F E F o o July June ri' 9 E F E F o July July 3-6 ri' 9 E F E F o August


 where v=x-f and n =the number of")
 (d) Significance of")


 nl 'V (X_f)2 where x = the")


 The X2 Test n; N2 (InS _ 2ns)2 x2=ss N l N2")

49 SUMMER MIGRATION OF THE CISCO 91 APPENDIX II STATISTICAL PROCEDURES In the course of this investigation the practice has been to apply tests to determine the statistical significance of certain observations. The various formulae, which have been omitted from the text for the sake of brevity, are gathered together here. tj (a) Standard Deviation of the Mean (I' M.= ±. J V2 l' n(n-1) where v=x-f and n =the number of variates. (Tuttle and Satterley, 1925) (d) Significance of Means of Small Samples The significance of the difference between the average size of feeding and non-feeding fish was calculated by finding the average difference in size between these two groups in all age classes as a percentage, and calculating the significance of this difference from zero, by finding the value of t, such that t= x / n 1 (n l -1) nl 'V (X_f)2 where x = the percentage difference in length between feeding and non-feeding fish. and nt =the number of age groups compared. The significance of t may be found in Fisher's Table. For an example of this procedure, see Fisher (1928), p (b) The X2 Test n; N2 (InS _ 2ns)2 x2=ss N l N2 Ins+2ns where N, and N2 are the two totals. Ins and 2ns are the frequencies in one corresponding class in the two distributions. and S, is the summation over all groups. (Tippet, 1931, p. 72) (c) Standard Error of Sex Ratios Jp-P2 P (I' = ± 1'-'- n where P = the fraction of the whole sample that consists of individuals of one sex. (Tippet, 1931, p. 57) 90
AGE AND GROWTH OF THE WALLEYE, STIZOSTEDION VITREUM VITREUM, IN HOOVER RESERVOIR, OHIO 1-2
 4 DONALD R. URBAN AND JANE L. FORSYTH Vol. 70 AGE AND GROWTH OF THE WALLEYE, STIZOSTEDION VITREUM VITREUM, IN HOOVER RESERVOIR, OHIO - THOMAS R. TUCKER AND STEPHEN H. TAUB Ohio Cooperative Fishery Unit,
Relative Size Selectivity of Trap Nets for Eight Species of Fish'
 North American Journal of Fisheries Management 2:33-37, 1982 Copyright by the American Fisheries Society 1982 Relative Size Selectivity of Trap Nets for Eight Species of Fish' PERCY W. LAARMAN AND JAMES
THE BIOLOGY OF THE PRAWN, PALAEMON
 J. mar. bio!. Ass. U.K. (1959) 38 621-627 Printed in Great Britain 621 THE BOLOGY OF THE PRAWN PALAEMON (=LEANDER) SERRA TU S (PENNANT) BY G. R. FORSTER The Plymouth Laboratory n a recent paper Cole (1958)
Status of Sport Fishes in Gods Lake, Alberta, 2004
 Status of Sport Fishes in Gods Lake, Alberta, 2004 CONSERVATION REPORT SERIES The Alberta Conservation Association is a Delegated Administrative Organization under Alberta s Wildlife Act. CONSERVATION
Lake Monitoring Program: Lesser Slave Lake Stock Assessment
 Lake Monitoring Program: Lesser Slave Lake Stock Assessment Greg Fortier, John Tchir 1 1 Alberta Conservation Association, Bag 9000-26, Peace River, Alberta, Canada T8S 1T4 Disclaimer: This document is
SECTION 2 HYDROLOGY AND FLOW REGIMES
 SECTION 2 HYDROLOGY AND FLOW REGIMES In this section historical streamflow data from permanent USGS gaging stations will be presented and discussed to document long-term flow regime trends within the Cache-Bayou
APPENDIX 3E HYDROACOUSTIC ANALYSIS OF FISH POPULATIONS IN COPCO AND IRON GATE RESERVOIRS, CALIFORNIA NOVEMBER
 APPENDIX 3E HYDROACOUSTIC ANALYSIS OF FISH POPULATIONS IN COPCO AND IRON GATE RESERVOIRS, CALIFORNIA NOVEMBER 23 February 24 PacifiCorp Fish Resources FTR Appendix 3E.doc Hydroacoustic Analysis of Fish
Status of Northern Pike and Yellow Perch at Goosegrass Lake, Alberta, 2006
 Status of Northern Pike and Yellow Perch at Goosegrass Lake, Alberta, 2006 CONSERVATION REPORT SERIES The Alberta Conservation Association is a Delegated Administrative Organization under Alberta s Wildlife
STUDY PERFORMANCE REPORT
 STUDY PERFORMANCE REPORT State: Michigan Project No.: F-81-R-3 Study No.: 491 Title: Evaluation of lake sturgeon Acipenser fulvescens populations in the St. Clair River and Lake St. Clair Period Covered:
A Sport Fish Stock Assessment of Long Lake, Alberta, 2004
 A Sport Fish Stock Assessment of Long Lake, Alberta, 2004 CONSERVATION REPORT SERIES The Alberta Conservation Association is a Delegated Administrative Organization under Alberta s Wildlife Act. CONSERVATION
Dauphin Lake Fishery. Status of Walleye Stocks and Conservation Measures
 Dauphin Lake Fishery Status of Walleye Stocks and Conservation Measures Date: December, 21 Dauphin Lake Fishery Status of Walleye Stocks and Conservation Measures Background: Walleye stocks in Dauphin
Fall Walleye Index Netting at Jackson Lake, Alberta, 2010
 , 2010 Fisheries Management Lac La Biche Senior Fisheries Biologist(s): Dwayne Latty, Cold Lake Data Summary and Report by: Eric Hegerat, Fisheries Technician, Lac La Biche; Rebecca Skarsen, Fisheries
Crooked Lake Oakland County (T4N, R9E, Sections 3, 4, 9) Surveyed May James T. Francis
 Surveyed May James T. Francis") Michigan Department of Natural Resources Status of the Fishery Resource Report No. 2004-1, 2004 Crooked Lake Oakland County (T4N, R9E, Sections 3, 4, 9) Surveyed May 2002 James T. Francis Environment Crooked
Michigan Department of Natural Resources Status of the Fishery Resource Report No. 2004-1, 2004 Crooked Lake Oakland County (T4N, R9E, Sections 3, 4, 9) Surveyed May 2002 James T. Francis Environment Crooked
(fig. 3) must be at the same temperature as the water in this chamber CALORIMETRIC STUDIES OF THE EXTREMITIES
 must be at the same temperature as the water in this chamber CALORIMETRIC STUDIES OF THE EXTREMITIES") CALORIMETRIC STUDIES OF THE EXTREMITIES II. EXPERIMENTAL APPARATUS AND PROCEDURES' By ROY KEGERREIS (Received for publication July 1, 1926) The calorimeter used in these experiments is a modification of
CALORIMETRIC STUDIES OF THE EXTREMITIES II. EXPERIMENTAL APPARATUS AND PROCEDURES' By ROY KEGERREIS (Received for publication July 1, 1926) The calorimeter used in these experiments is a modification of
NORTHWEST SCIENCE AND INFORMATION
 Science and Information Branch NORTHWEST SCIENCE AND INFORMATION Aquatics Update 2002-1 Fall Walleye Index Netting (FWIN) and Trap Netting Summary for Niobe Lake, 2000 by T. Cano Introduction Since 1981,
Determination of the von Bertalanffy Growth Equation for the Southern New England-Middle Atlantic~ Bank and Gulf of Maine stocks of Silver Hake by
 Determination of the von Bertalanffy Growth Equation for the Southern New England-Middle Atlantic~ Bank and Gulf of Maine stocks of Silver Hake by F. P. Almeida Georges 3 National Marine Fisheries Service
12. School travel Introduction. Part III Chapter 12. School travel
 12. School travel 12.1 Introduction This chapter presents the evidence on changes in travel patterns for the journey to school in the three towns over the period of the Sustainable Travel Town project.
Comparative Survival of Pellet-Reared Muskellunge Stocked As Fingerlings In Bluegill Ponds With and Without Largemouth Bass
 1 9 2 0 Comparative Survival of Pellet-Reared Muskellunge Stocked As Fingerlings In Bluegill Ponds With and Without Largemouth Bass George B. Beyerle Fisheries Research Report No. 1920 April 23, 1984 MICHIGAN
Growth: Humans & Surf Clams
 Growth: Humans & Surf Clams East Coast MARE Materials For the leader: Projector Whiteboard to project data graph onto White paper & markers For the activity: Copy of data table Copy of map Class graphing
Hydroacoustic surveys of Otsego Lake s pelagic fish community,
 Hydroacoustic surveys of Otsego Lake s pelagic fish community, 2010 1 Holly A. Waterfield 2 and Mark Cornwell 3 INTRODUCTION Hydroacoustic surveys were conducted in May and November 2010 to estimate pelagic
Cove Point Beach Restoration: Utilization of a Spawning Habitat by Horseshoe Crabs (Limulus polyphemus)
") Cove Point Beach Restoration: Utilization of a Spawning Habitat by Horseshoe Crabs (Limulus polyphemus) Paul Bushmann, Jessica Peterson, Bethany Enyeart and Deborah Smith Anne Arundel Community College
Cove Point Beach Restoration: Utilization of a Spawning Habitat by Horseshoe Crabs (Limulus polyphemus) Paul Bushmann, Jessica Peterson, Bethany Enyeart and Deborah Smith Anne Arundel Community College
Exploring Measures of Central Tendency (mean, median and mode) Exploring range as a measure of dispersion
 Exploring range as a measure of dispersion") Unit 5 Statistical Reasoning 1 5.1 Exploring Data Goals: Exploring Measures of Central Tendency (mean, median and mode) Exploring range as a measure of dispersion Data: A set of values. A set of data can
Unit 5 Statistical Reasoning 1 5.1 Exploring Data Goals: Exploring Measures of Central Tendency (mean, median and mode) Exploring range as a measure of dispersion Data: A set of values. A set of data can
Willett Pond Fish Survey
 Willett Pond Fish Survey By: Sean Burchesky Under the guidance of Tom Palmer, Neponset River Watershed Association Summer 20 1 Willett Pond fish documentation project 9/Jul/20-24/Sep/20 The goal of this
Figure 39. Yearly Trend in Death Rates for Drowning: NSW, Year
 10.0 DROWNING 10.1 Deaths due to Drowning: The drowning death rate showed a statistically significant decrease between 199 and 1999 (Figure 39). Between 199 and 1999, 46 people died from drowning, at a
Lake information report
 Page 1 of 6 Lake information report Name: Saganaga Nearest Town: Grand Marais Primary County: Cook Survey Date: 08/08/2011 Inventory Number: 16063300 walleye stocking. Purchase a walleye stamp. Your voluntary
How to Make, Interpret and Use a Simple Plot
 How to Make, Interpret and Use a Simple Plot A few of the students in ASTR 101 have limited mathematics or science backgrounds, with the result that they are sometimes not sure about how to make plots
Lab Report Outline the Bones of the Story
 Lab Report Outline the Bones of the Story In this course, you are asked to write only the outline of a lab report. A good lab report provides a complete record of your experiment, and even in outline form
Minnesota Department of Natural Resources Fisheries Division, Lake Superior Area
 Minnesota F-9-R(P)- Study 4 Job 616 Minnesota Department of Natural Resources Fisheries Division, Lake Superior Area Coaster Brook Trout Status in Minnesota-Lake Superior Tributaries Following Regulation
The fishery for jack mackerel in the Eastern Central Pacific by European trawlers in 2008 and 2009
 Eighth International Meeting: SWG: Jack Mackerel Sub-Group SP-08-SWG-JM-01 The fishery for jack mackerel in the Eastern Central Pacific by European trawlers in 2008 and 2009 Ad Corten Corten Marine Research
During the mid-to-late 1980s
 The 2001 Yellow Perch Report by Rick Kubb During the mid-to-late 1980s the yellow perch popula tions in Lake Erie were among the highest on record. Limit catches by fishermen were extremely common during
The stock of blue whiting has been surveyed for the last three years during the spawning period using the research vessel cg. 0.
 FiskDir. Skr. Ser. HavUnders., 16: 245-257. ABUNDANCE ESTIMATES OF THE SPAWNING STOCK OF BLUE WHITING (MICR OMESISTIUS PO UTASSOU (RISSO, 1810)) IN THE AREA WEST OF THE BRITISH ISLES IN 1972-1974 By RAMON
Fall Walleye Index Netting at Sylvan Lake, Alberta, 2012
 Fall Walleye Index Netting at Sylvan Lake, Fisheries Management Red Deer Area February 28, 213 Fall Walleye Index Netting at Sylvan Lake, Fisheries Biologist(s): Jason Cooper, Kelly Dick Fisheries Management,
Age and Growth of Sauger in Pool 19 of the Mississippi River
 Proceedings of the Iowa Academy of Science Volume 75 Annual Issue Article 28 1968 Age and Growth of Sauger in Pool 19 of the Mississippi River Neil E. Carter Iowa State University Copyright Copyright 1968
Wildlife Ad Awareness & Attitudes Survey 2015
 Wildlife Ad Awareness & Attitudes Survey 2015 Contents Executive Summary 3 Key Findings: 2015 Survey 8 Comparison between 2014 and 2015 Findings 27 Methodology Appendix 41 2 Executive Summary and Key Observations
MANITOBA'S ABORIGINAL COMMUNITY: A 2001 TO 2026 POPULATION & DEMOGRAPHIC PROFILE
 MANITOBA'S ABORIGINAL COMMUNITY: A 2001 TO 2026 POPULATION & DEMOGRAPHIC PROFILE MBS 2005-4 JULY 2005 TABLE OF CONTENTS I. Executive Summary 3 II. Introduction.. 9 PAGE III. IV. Projected Aboriginal Identity
Fall Walleye Index Netting at Battle Lake, Alberta, 2012
 Fall Walleye Index Netting at Battle Lake, Fisheries Management Red Deer Area February 28, 213 Fall Walleye Index Netting at Battle Lake, Fisheries Biologist(s): Jason Cooper, Kelly Dick Fisheries Management,
Annual Pink Shrimp Review
 Annual Pink Shrimp Review Oregon Department of Fish and Wildlife ODFW Marine Region, Marine Science Dr., Bldg. #3, Newport, OR 97365 (503) 867-4741 TO: FROM: OREGON SHRIMP INDUSTRY BOB HANNAH, PINK SHRIMP
2015 Winnebago System Walleye Report
 215 Winnebago System Walleye Report Adam Nickel, Winnebago Gamefish Biologist, March 216 As winter passes in the rear view mirror, it won t be long until the spring rush of the 216 walleye run is here.
Fishery Resource Grant Program Final Report 2010
 Fishery Resource Grant Program Final Report 2010 Project title: Improving Gill net Selectivity by Altering Mesh Characteristics 2010 Name of PI: Robert Weagley Telephone: (804) 855-4112 Address: 10201
STUDY PERFORMANCE REPORT
 STUDY PERFORMANCE REPORT State: Michigan Project No.: F-53-R-14 Study No.: 486 Title: Assessment of lake trout populations in Michigan s waters of Lake Michigan. Period Covered: April 1, 1997 to March
Manual of Fisheries Survey Methods II: with periodic updates. Chapter 22: Guidelines for Sampling Warmwater Rivers with Rotenone
 Manual of Fisheries Survey Methods II: with periodic updates : Guidelines for Sampling Warmwater Rivers with Rotenone P. W. Seelbach, G. L. Towns, and D. D. Nelson Suggested citation: Seelbach, Paul W.,
3.6 Magnetic surveys. Sampling Time variations Gradiometers Processing. Sampling
 3.6 Magnetic surveys Sampling Time variations Gradiometers Processing Sampling Magnetic surveys can be taken along profiles or, more often, on a grid. The data for a grid is usually taken with fairly frequent
Cedar Lake Comprehensive Survey Report Steve Hogler and Steve Surendonk WDNR-Mishicot
 Cedar Lake- 2006 Comprehensive Survey Report Steve Hogler and Steve Surendonk WDNR-Mishicot ABSTRACT Cedar Lake is a 142 acre lake located in the southwest corner of Manitowoc County. It is a seepage lake
A REVIEW AND EVALUATION OF NATURAL MORTALITY FOR THE ASSESSMENT AND MANAGEMENT OF YELLOWFIN TUNA IN THE EASTERN PACIFIC OCEAN
 A REVIEW AND EVALUATION OF NATURAL MORTALITY FOR THE ASSESSMENT AND MANAGEMENT OF YELLOWFIN TUNA IN THE EASTERN PACIFIC OCEAN Mark N. Maunder and Alex Aires-da-Silva Outline YFT history Methods to estimate
I.CHEM.E. SYMPOSIUM SERIES NO. 97 BUOYANCY-DRIVEN NATURAL VENTILATION OP ENCLOSED SPACES
 BUOYANCY-DRIVEN NATURAL VENTILATION OP ENCLOSED SPACES M. R. Marshall* and P. L. Stewart-Darling* A simple mathematical model for the buoyancy driven ventilation of an enclosed space, using a two-pipe
FISHERIES RESEARCH BOARD OF CANADA
 FISHERIES RESEARCH BOARD OF CANADA MANUSCRIPT REPORTS OF TIlE BIOWGICAL STATIONS The Lake "'innipeg trap-net experiment with returns of tagged fish as an appendix January 4, 1953 Since thecoregonine fish
ASSESSMENT OF THE WEST COAST OF NEWFOUNDLAND (DIVISION 4R) HERRING STOCKS IN 2011
 HERRING STOCKS IN 2011") Canadian Science Advisory Secretariat Science Advisory Report 212/24 ASSESSMENT OF THE WEST COAST OF NEWFOUNDLAND (DIVISION 4R) HERRING STOCKS IN 211 Context Figure 1. Map of unit areas of NAFO Division
Canadian Science Advisory Secretariat Science Advisory Report 212/24 ASSESSMENT OF THE WEST COAST OF NEWFOUNDLAND (DIVISION 4R) HERRING STOCKS IN 211 Context Figure 1. Map of unit areas of NAFO Division
PROJECT Nº 96/005: SIZE SELECTIVITY AND RELATIVE FISHING POWER OF BALTIC COD GILL-NETS
 PROJECT Nº 96/005: SIZE SELECTIVITY AND RELATIVE FISHING POWER OF BALTIC COD GILL-NETS KEY WORDS Selectivity, fishing power, Baltic Sea, statistical model, fisheries management, cod (Gadus morhua). AUTHORS
Black Sea Bass Encounter
 Black Sea Bass Encounter Below is an adaptation of the Shark Encounter (Lawrence Hall of Science: MARE 2002) lesson plan to be about Black Sea Bass and to incorporate information learned from Dr. Jensen
SEA GRANT PROGRESS REPORT
 SEA GRANT PROGRESS REPORT Project Title: The relationship between seasonal migrations of berried female lobster Homarus americanus, egg development and larval survival. Principal Investigator: Winsor H.
Application of a New Method for Monitoring Lake Trout Abundance in Yukon: Summer Profundal Index Netting (SPIN)
") Application of a New Method for Monitoring Lake Trout Abundance in Yukon: Summer Profundal Index Netting (SPIN) Prepared by: Lars Jessup Nathan Millar November 2011 Application of a New Method for Monitoring
Application of a New Method for Monitoring Lake Trout Abundance in Yukon: Summer Profundal Index Netting (SPIN) Prepared by: Lars Jessup Nathan Millar November 2011 Application of a New Method for Monitoring
FISHERIES BLUE MOUNTAINS ADAPTATION PARTNERSHIP
 FISHERIES A warming climate, by itself, substantially affects the hydrology of watersheds in the Blue Mountains. Among the key hydrologic changes projected under all scenarios for the 2040s and beyond
SURFACE CASING SELECTION FOR COLLAPSE, BURST AND AXIAL DESIGN FACTOR LOADS EXERCISE
 SURFACE CASING SELECTION FOR COLLAPSE, BURST AND AXIAL DESIGN FACTOR LOADS EXERCISE Instructions Use the example well data from this document or the powerpoint notes handout to complete the following graphs.
Is lung capacity affected by smoking, sport, height or gender. Table of contents
 Sample project This Maths Studies project has been graded by a moderator. As you read through it, you will see comments from the moderator in boxes like this: At the end of the sample project is a summary
The Coriolis force, geostrophy, Rossby waves and the westward intensification
 Chapter 3 The Coriolis force, geostrophy, Rossby waves and the westward intensification The oceanic circulation is the result of a certain balance of forces. Geophysical Fluid Dynamics shows that a very
Gas Gathering System Modeling The Pipeline Pressure Loss Match
 PETROLEUM SOCIETY CANADIAN INSTITUTE OF MINING, METALLURGY & PETROLEUM PAPER 2005-230 Gas Gathering System Modeling The Pipeline Pressure Loss Match R.G. MCNEIL, P.ENG. Fekete Associates Inc. D.R. LILLICO,
Lye Brook Amphibian Monitoring. Update. For the Vermont Monitoring Cooperative
 Lye Brook Amphibian Monitoring Update 2010 (Covering 1995-2009) For the Vermont Monitoring Cooperative Erin Talmage and James S. Andrews Amphibian Monitoring in the Lye Brook Wilderness Region of the Green
Student Population Projections By Residence. School Year 2016/2017 Report Projections 2017/ /27. Prepared by:
 Student Population Projections By Residence School Year 2016/2017 Report Projections 2017/18 2026/27 Prepared by: Revised October 31, 2016 Los Gatos Union School District TABLE OF CONTENTS Introduction
ISSN (online) ISBN (online) July New Zealand Fisheries Assessment Report 2017/41. P.L. Horn C.P.
 ISBN (online) July New Zealand Fisheries Assessment Report 2017/41. P.L. Horn C.P.") Catch-at-age for hake (Merluccius australis) and ling (Genypterus blacodes) in the 1 16 fishing year and from two research trawl surveys in 16, with a summary of all available data sets from the New Zealand
Catch-at-age for hake (Merluccius australis) and ling (Genypterus blacodes) in the 1 16 fishing year and from two research trawl surveys in 16, with a summary of all available data sets from the New Zealand
Preliminary analysis of yellowfin tuna catch, effort, size and tagging data using an integrated age-structured model
 Preliminary analysis of yellowfin tuna catch, effort, size and tagging data using an integrated age-structured model Introduction John Hampton Secretariat of the Pacific Community Noumea, New Caledonia
STUDY PERFORMANCE REPORT
 STUDY PERFORMANCE REPORT State: Michigan Project No.: F-35-R-24 Study No.: 682 Title: Pond rearing of juvenile lake sturgeon Period Covered: April 1, 1998 to September 30, 1999 Study Objective: To determine
021 Deer Management Unit
 021 Deer Management Unit Geographic Location: Deer Management Unit (DMU) 021 is 1,464 square miles in size and is located in the central Upper Peninsula (UP). This DMU is dominated by publicly owned land
Sound scattering by hydrodynamic wakes of sea animals
 ICES Journal of Marine Science, 53: 377 381. 1996 Sound scattering by hydrodynamic wakes of sea animals Dmitry A. Selivanovsky and Alexander B. Ezersky Selivanovsky, D. A. and Ezersky, A. B. 1996. Sound
History and Status of the Oregon Dungeness Crab Fishery
 History and Status of the Oregon Dungeness Crab Fishery History and Status of the Oregon Dungeness Crab Fishery by Darrell Demory Oregon Department of Fish and Wildlife Oregon Department of Fish and Wildlife
Chapter 13 Temperature, Kinetic Theory, and the Gas Laws 497
 Chapter 13 Temperature, Kinetic Theory, and the Gas Laws 497 Figure 13.25 This photograph of Apollo 17 Commander Eugene Cernan driving the lunar rover on the Moon in 1972 looks as though it was taken at
Michigan Dept. of Natural Resources Status of the Fishery Resource Report Page 1. Weber Lake Cheboygan County, T34N, R3W, Sec.
 Michigan Dept. of Natural Resources 2012-143 Status of the Fishery Resource Report Page 1 Weber Lake Cheboygan County, T34N, R3W, Sec. 31 Neal Godby, Fisheries Biologist Environment Weber Lake is a 28.5-acre
Post impact trajectory of vehicles at rural intersections
 Post impact trajectory of vehicles at rural intersections Doecke SD., Woolley JE. and Mackenzie JR. Centre for Automotive Safety Research Abstract This report describes the path of vehicles after a collision
FISH 415 LIMNOLOGY UI Moscow
 FISH 415 LIMNOLOGY UI Moscow Sampling Equipment Purpose: - to familiarize you with limnological sampling equipment - to use some of the equipment to obtain profiles of temperature, dissolved oxygen, conductivity
Fish Survey of Arctic Lake (ID # ), Scott County, Minnesota in 2012
, Scott County, Minnesota in 2012") Snapping Turtle from Arctic Lake, September 2012 Fish Survey of Arctic Lake (ID #70-0085), Scott County, Minnesota in 2012 Survey Dates: September 18-20, 2012 MnDNR Permit Number: 18362 Prepared for: Shakopee
Snapping Turtle from Arctic Lake, September 2012 Fish Survey of Arctic Lake (ID #70-0085), Scott County, Minnesota in 2012 Survey Dates: September 18-20, 2012 MnDNR Permit Number: 18362 Prepared for: Shakopee
2014 Winnebago System Walleye Report
 1986 1988 199 1992 1994 1996 1998 2 22 24 26 28 21 212 214 Number of YOY WAE / Trawl 214 Winnebago System Walleye Report Adam Nickel, Winnebago Gamefish Biologist, 18 March 215 The spring rush of 215 will
Calculation of Trail Usage from Counter Data
 1. Introduction 1 Calculation of Trail Usage from Counter Data 1/17/17 Stephen Martin, Ph.D. Automatic counters are used on trails to measure how many people are using the trail. A fundamental question
BLACK SEA WHITING, MERLANGIUS MERLANGUS EUXINUS NORDMANN
 82 BLACK SEA WHITING, MERLANGIUS MERLANGUS EUXINUS NORDMANN The taxonomic position of the Black Sea whiting like that of a great number of Black Sea fish species is rather complicated, and is still a controversial
SOUTH PACIFIC COMMISSION. TWENTY-SECOND REGIONAL TECHNICAL MEETING ON FISHERIES (Noumea, New Caledonia, 6-10 August 1990)
") Page 1 ORIGINAL : ENGLISH SOUTH PACIFIC COMMISSION TWENTY-SECOND REGIONAL TECHNICAL MEETING ON FISHERIES (Noumea, New Caledonia, 6-10 August 1990) STOCK STATUS OF SKIPJACK TUNA IN THE WESTERN TROPICAL
Page 1 ORIGINAL : ENGLISH SOUTH PACIFIC COMMISSION TWENTY-SECOND REGIONAL TECHNICAL MEETING ON FISHERIES (Noumea, New Caledonia, 6-10 August 1990) STOCK STATUS OF SKIPJACK TUNA IN THE WESTERN TROPICAL
13. TIDES Tidal waters
 Water levels vary in tidal and non-tidal waters: sailors should be aware that the depths shown on the charts do not always represent the actual amount of water under the boat. 13.1 Tidal waters In tidal
ITARDA INFORMATION. No.128. Special feature
 ITARDA INFORMATION No.128 Special feature Special feature Accidents when four-wheel vehicles are reversing ~ Drivers must thoroughly check behind them, especially in parking lots! ~ Introduction You may
LAKE OF THE WOODS and RAINY RIVER INFORMATION. Minnesota Waters Fishing Regulation Summary
 LAKE OF THE WOODS and RAINY RIVER INFORMATION December 1, 2015 April 23, 2016 Lake of the Woods is a border water, shared with the Canadian provinces of Manitoba and Ontario. The Minnesota portion of Lake
Chapter 5: Methods and Philosophy of Statistical Process Control
 Chapter 5: Methods and Philosophy of Statistical Process Control Learning Outcomes After careful study of this chapter You should be able to: Understand chance and assignable causes of variation, Explain
Aalborg Universitet. Published in: Proceedings of Offshore Wind 2007 Conference & Exhibition. Publication date: 2007
 Aalborg Universitet Design Loads on Platforms on Offshore wind Turbine Foundations with Respect to Vertical Wave Run-up Damsgaard, Mathilde L.; Gravesen, Helge; Andersen, Thomas Lykke Published in: Proceedings
Discussion on the Selection of the Recommended Fish Passage Design Discharge
 Discussion on the Selection of the Recommended Fish Passage Design Discharge Introduction The provision of fish passage is a requirement for most proposed culvert and bridge installations in Alberta, depending
Evaluating the Influence of R3 Treatments on Fishing License Sales in Pennsylvania
 Evaluating the Influence of R3 Treatments on Fishing License Sales in Pennsylvania Prepared for the: Pennsylvania Fish and Boat Commission Produced by: PO Box 6435 Fernandina Beach, FL 32035 Tel (904)
High-Rise Fireground Field Experiments Results
 High-Rise Fireground Field Experiments Results These graphs show average times for each critical task by crew size. Percentage calculations for all the charts were based on the overall time from detection
Section 6. The Surface Circulation of the Ocean. What Do You See? Think About It. Investigate. Learning Outcomes
 Chapter 5 Winds, Oceans, Weather, and Climate Section 6 The Surface Circulation of the Ocean What Do You See? Learning Outcomes In this section, you will Understand the general paths of surface ocean currents.
MEASURING VOLUME & MASS
 MEASURING VOLUME & MASS In this laboratory you will have the opportunity to apply your measuring skills in gathering data, processing it, and interpreting the results. For this experiment you will: 1)
LAKE DIANE Hillsdale County (T8-9S, R3W, Sections 34, 3, 4) Surveyed May Jeffrey J. Braunscheidel
 Surveyed May Jeffrey J. Braunscheidel") Michigan Department of Natural Resources Status of the Fishery Resource Report No. 2003-4, 2003 LAKE DIANE Hillsdale County (T8-9S, R3W, Sections 34, 3, 4) Surveyed May 2001 Jeffrey J. Braunscheidel Environment
Michigan Department of Natural Resources Status of the Fishery Resource Report No. 2003-4, 2003 LAKE DIANE Hillsdale County (T8-9S, R3W, Sections 34, 3, 4) Surveyed May 2001 Jeffrey J. Braunscheidel Environment
DIURNAL VARIATIONS IN THE AMOUNT OF DIS- SOLVED OXYGEN, ALKALINITY, AND FREE AMMONIA IN CERTAIN FISH PONDS AT FAIRPORT, (IOWA).
.") DIURNAL VARIATIONS IN THE AMOUNT OF DIS- SOLVED OXYGEN, ALKALINITY, AND FREE AMMONIA IN CERTAIN FISH PONDS AT FAIRPORT, (IOWA). A. H. WlEBE, U. S. Bureau of Fisheries, Fairport, Iowa.* INTRODUCTION. Some
DIURNAL VARIATIONS IN THE AMOUNT OF DIS- SOLVED OXYGEN, ALKALINITY, AND FREE AMMONIA IN CERTAIN FISH PONDS AT FAIRPORT, (IOWA). A. H. WlEBE, U. S. Bureau of Fisheries, Fairport, Iowa.* INTRODUCTION. Some
Fall Walleye Index Netting at Blackett Lake, Alberta, 2010
 , 2010 Fisheries Management Lac La Biche Senior Fisheries Biologist(s): Dwayne Latty, Cold Lake Data Summary and Report by: Eric Hegerat, Fisheries Technician, Lac La Biche; Rebecca Skarsen, Fisheries
SC China s Annual report Part II: The Squid Jigging Fishery Gang Li, Xinjun Chen and Bilin Liu
 3 rd Meeting of the Scientific Committee Port Vila, Vanuatu 28 September - 3 October 215 SC-3-9 China s Annual report Part II: The Squid Jigging Fishery Gang Li, Xinjun Chen and Bilin Liu National Report
Know Your River Conwy Salmon & Sea Trout Catchment Summary
 Know Your River Conwy Salmon & Sea Trout Catchment Summary Introduction This report describes the status of the salmon and sea trout populations in the Conwy catchment. Bringing together data from rod
ELECTRO-FISHING REPORT 2016 UPPER TWEED
 ELECTRO-FISHING REPORT 2016 UPPER TWEED The electro-fishing programme carried out each summer by The Tweed Foundation is part of our management plan, which details the information that is required to manage
Section 1. Global Wind Patterns and Weather. What Do You See? Think About It. Investigate. Learning Outcomes
 Chapter 5 Winds, Oceans, Weather, and Climate Section 1 Global Wind Patterns and Weather What Do You See? Learning Outcomes In this section, you will Determine the effects of Earth s rotation and the uneven
Chapter 8: Reservoir Mechanics
 PTRT 1472: Petroleum Data Management II Chapter 8: Reservoir Mechanics - Reservoir drives Types of Natural Gas Reservoir Fluids Natural gas is petroleum in a gaseous state, so it is always accompanied
1999 On-Board Sacramento Regional Transit District Survey
 SACOG-00-009 1999 On-Board Sacramento Regional Transit District Survey June 2000 Sacramento Area Council of Governments 1999 On-Board Sacramento Regional Transit District Survey June 2000 Table of Contents
Michigan Department of Natural Resources Status of the Fishery Resource Report Page 1
 Michigan Department of Natural Resources 2007-33 Status of the Fishery Resource Report Page 1 Grand Sable Lake Alger County, T49N, R14W, Sec. Many Lake Superior watershed, last year surveyed 2004 James
Domestic Energy Fact File (2006): Owner occupied, Local authority, Private rented and Registered social landlord homes
: Owner occupied, Local authority, Private rented and Registered social landlord homes") Domestic Energy Fact File (2006): Owner occupied, Local authority, Private rented and Registered social landlord homes Domestic Energy Fact File (2006): Owner occupied, Local authority, Private rented
Domestic Energy Fact File (2006): Owner occupied, Local authority, Private rented and Registered social landlord homes Domestic Energy Fact File (2006): Owner occupied, Local authority, Private rented
Traveling Waves vs. Standing Waves
 The Physics Classroom» Physics Tutorial» Waves» Traveling Waves vs. Standing Waves Waves - Lesson 4 - Standing Waves Traveling Waves vs. Standing Waves Traveling Waves vs. Standing Waves Formation of Standing
DOW# West Twin Lake
 DOW# 69-0696 West Twin Lake West Twin Lake has a surface area of 120.4 acres and is located on the east side of St. Louis County Road 31, south of Highway 2. West Twin Lake has a maximum depth of 18 feet
Lecture 2: Sampling gear. Ichthyology 3
 Lecture 2: Sampling gear Ichthyology 3 Total samples Total samples Draining Gives a total sample but this is often not practical. Kariega estuary study on salt marshes. Explosives Extremely effective sampling
GREGOIRE LAKE FALL WALLEYE INDEX NETTING SURVEY, Fisheries Management Waterways-Lac La Biche Area
 GREGOIRE LAKE FALL WALLEYE INDEX NETTING SURVEY, 22 Fisheries Management Waterways-Lac La Biche Area February 28, 23 GREGOIRE LAKE FALL WALLEYE Fisheries Biologist: Rebecca Baldwin, Fisheries Management,
Kenai River Sockeye Escapement Goals. United Cook Inlet Drift Association
 Kenai River Sockeye Escapement Goals United Cook Inlet Drift Association 2014 Evaluating Sockeye Escapement Goals in the Kenai River Utilizing Brood Tables and Markov Tables This presentation pertains
Countermeasures against Alien Fishes (Largemouth Bass and Bluegill) in Lake Biwa
 in Lake Biwa") 79 Countermeasures against Alien Fishes (Largemouth Bass and ) in Lake Biwa Atsuhiko IDE * and Shinsuke SEKI * Abstract Lake Biwa is one of the world's most ancient lakes, with an origin going back four
79 Countermeasures against Alien Fishes (Largemouth Bass and ) in Lake Biwa Atsuhiko IDE * and Shinsuke SEKI * Abstract Lake Biwa is one of the world's most ancient lakes, with an origin going back four