Quantitative Statistical Analysis for Problem Solving And Decision Making Project
|
|
|
- Tracy Carter
- 6 years ago
- Views:
Transcription
.")
1 Providence College School of Business Faculty Publications School of Business -- Quantitative Statistical Analysis for Problem Solving And Decision Making Project Anthony Baker Providence College, Follow this and additional works at: Part of the Business Commons Baker, Anthony, "Quantitative Statistical Analysis for Problem Solving And Decision Making Project" (). School of Business Faculty Publications. Paper. This Article is brought to you for free and open access by the School of Business at It has been accepted for inclusion in School of Business Faculty Publications by an authorized administrator of For more information, please contact
2 Quantitative Statistical Analysis for Problem Solving And Decision Making Project Nov By Anthony E. Baker Johnson and Wales University MBA Program Instructor: Martin W. Sivula Ph.D. A Comparative Analysis of Government Regulations, Fishing Effort, And Outside Influences on Lobster Landings for The State of Rhode Island
3 Table of Contents Thanks and Acknowledgements Proposal Narrative Dependent Data Set - Graphics Independent Data Sets - Graphics Bivariate Data Groups Multivariate Data Sets Calculations and Surveys Summary Alternate Theories Reference List II III V VII VIII X I
4 Thanks and Acknowledgements to the following people: John H. Nagle, Supervisory Policy Analyst, Operations Group, Sustainable Fisheries Division, Northeast Regional Office, National Marine Fisheries Service who responding quickly and on his own time to my request for Federal Permit Data., Head Librarian at Johnson and Wales University reference library who tirelessly and diligently assisted me in located required rainfall and temperature data. Bob Smith, Former President of the RI Lobsterman's Association who gave me guidance on where to search and whom to speak with in my efforts to locate data. Margaret McGrath, Administrative Officer, Rhode Island Department of Environmental Management for responding quickly to my request for data on RI Lobster Licenses. Donna Prout, friend and colleague who took the time to edit and critique my work before submission. II
5 Quantative Statistical Analysis for Problem Solving Project Proposal Nov By Anthony E. Baker Johnson and Wales University MBA Program A) Background Information: The National Marine Fisheries Service (NMFS) contends that increased regulation is required to save dwindling American Lobster stocks (Homarus Americanus) in the North Atlantic Region. Members of various trade organizations contend that the stocks are at the very least stable and probably growing. That cyclical rises and falls in the total biomass is a natural function and is altered more by pollution and habitat degradation than commercial fishing. I intend to give an alternate theory through the use of research and statistical analysis as regards to harvest within the Rhode Island waters. These waters being defined as those within the Northeast and Southwest boundaries of NMFS Management Areas and 3 that are covered by both state and federal jurisdiction. B) The Stated Problem: To what extent was [IV] Lobster Production (988-98) in a given area altered by [I] Commercial Fishing Pressures, [II] Government Regulation, [III] Outside influences both natural and manmade? C) Methodology:. I will first research three sub-cases gathering data from federal and state agency sources.. This data will be collated into data sets organized over time. (988-98) 3. Each data set will have a corresponding histogram and time series plot created to display univariate relationships between data points within a data set. 4. These data sets will be compared to one another by overlaying the time series plots and using Pearson's Correlation scatter plots to determine what degree of correlation exists on a bivariate level. 5. The independent variable data sets stated in section (D) will be compared with the dependant variable data set Lobster Landings in Pounds. 6. I will then use the results of these three sub-cases as independent variables versus the dependent variable Median Lobster Production (988-98) for the objective case. 7. These data sets will be compared to one another by overlaying the time series plots and using Pearson's Correlation scatter plots to determine what degree of correlation exists on a multivariate level. 8. A descriptive data set will be created to derive the coefficients, median, mean etc. 9. I will then create a linear model using a correlation matrix and r squared to draw inferences as to what extent all of the independent variables had on affecting the Lobster Production (988-98) in the Rhode Island waters.. *Data will be entered hierarchical (chronologically) or step wise depending on the plots. III
6 D) Cases: I. Commercial Fishing Pressure Dependent Variable - Lobster Landings in Pounds () Independent Variables - Number of Federal Fishing Permits (FP) Number of Traps Fished (TF) Market Value of Catch (MV) II. Government Regulation on Commercial Fishing Dependent Variable - Lobster Landings in Pounds () Independent Variables - Number of Traps Fished (TF) State Licenses/Total Number of Fisherman (SL) Government Regulation Value Factors (GR) III. Outside Influences both Manmade and Natural Dependent Variable - Lobster Landings in Pounds () Independent Variables - Toxic Waste Released into the Water (TW) Average Seasonal Air Temperature (AT) Average Annual Rainfall (RF) IV The Effects of Cases I,II,IIIhad on Lobster Production in RI Dependent Variable - Median Lobster Production in Pounds Independent Variables - Commercial Fishing Pressure Government Regulations Outside Influences E) Data Sources: I intend to use some of and possibly all of the following sources. It is my professional belief that these sources are the most accurate and creditable. > National Marine Fisheries Service > Environmental Protection Agency > The Northeast Fisheries Science Center > New England Fisheries Management Council > The National Climatic Data Center > The National Oceanographic and Atmospheric Administration > Rhode Department of Environmental Management > Independent Surveys I Conduct F) Criteria: For the purpose of this study I have outlined general criteria to be followed so as to be able to have set parameters as benchmarks. > All numeric data will be rounded to the nearest hundred or hundredth > All sources of data will come from (E) Data Source list > When two opposing sets of data or data points exist a mean or average will be determined and used. > Documents and interviews will be cited in accordance with APA standards IV
7 Narrative: The purpose of this project is to provide a first step in questioning the justification used for governmental intervention in the Lobster Fishing Industry. This justification being, "The decline in lobster stocks along the North Atlantic Coast". This project is NOT an exclusive scientific study. This project is NOT an exclusive socioeconomic study of the lobster industry. It does not use advanced models commonly used in either discipline. This project is a basic statistical study, which uses data provided by governmental agencies of both a scientific and economic nature and independent surveys I conducted. Using basic statistical analysis methods it compares the various data sets then draws basic logical inferences from the observations. Steps:. I will first research three sub-cases gathering data from federal and state agency sources.. This data will be collated into data sets organized over time. (988-98) 3. Each data set will have a corresponding histogram and time series plot created to display univariate relationships between data points within a data set. 4. These data sets will be compared to one another by overlaying the time series plots and using Pearson's Correlation scatter plots to determine what degree of correlation exists on a bivariate level. 5. The independent variable data sets stated in section (D) will be compared with the dependant variable data set Lobster Landings in Pounds. 6. I will then use the results of these three sub-cases as independent variables versus the dependent variable Median Lobster Production (988-98) for the objective case. 7. These data sets will be compared to one another by overlaying the time series plots and using Pearson's Correlation scatter plots to determine what degree of correlation exists on a multivariate level. 8. A descriptive data set will be created to derive the coefficients, median, mean etc. 9. I will then create a linear model using a correlation matrix and r squared to draw inferences as to what extent all of the independent variables had on affecting the Lobster Production (988-98) in the Rhode Island waters.. *Data will be entered hierarchical (chronologically) or step wise depending on the plots. Hypothesis To Be Tested: The amount of lobsters being harvested in the State of RI is too great The end result being the long-term decline in lobster stocks and in turn the overall lobsters landings. Therefore government regulations are required to control the number of lobsters harvested through measures such as permit/license limits, minimum size of lobsters legally harvested and overall fishing effort through the reduction of traps fished. V Paraphrased from statements made by federal NMFS and NOAA officials at various hearings from 996 to 999 conducted with lobster fishing trade associations.
8 Background on Hypothesis: Data is currently accumulated by federal sources and used in federal models to predict the health of lobster stocks through random sampling. These models show a decline in lobster stocks over time leading to a prediction that the trend will continue unless actions are taken. Therefore it is the position of the NMFS that regulations are required to control fishing effort. These are taking place in the form of the curtailment of new lobster license issuance, the control and decrease in the number of trapsfished,and the minimum size of lobsters allowed to be harvested. Relations and Conclusions: While it would be easy to draw conclusions from this study, the ability to show a direct causal relationship would require in depth scientific study drawing on various disciplines within the scientific community. Also, to increase the validity of this type of study it would require encompassing all the lobster producing states and the Canadian provinces as well as more detailed and in-depth data collection that time does not allow. The intent of this project is to give question to accepted governmental theories through the use of basic research and statistical analysis. If plausible alternate possibilities do exist, demonstrate possible other scenarios not considered by the governing authorities and scientific community. This in turn may bring into question the validity of the results produced by current models used by these various scientific and government organizations in order to justify the ramping up of regulations starting in 994. Assumptions: ) The sample data from agencies will be as accurate as the referring agencies deem necessary. ) Surveys will have a margin of error based on the memory and records kept by the surveyed parties. 3) Surveys will be based on % sample size of a total population. 4) The interpretations are based on my years industry experience utilizing basic accepted statistical analysis methods. This same data is used in this study. VI

9 Dependent Data - Rl Lobster Landings // In Metric Tons 988 to 998 Years Metric Tons of Lobsters,59,597 3,9 3,377 3,67,85,936 3,433 3,4 3,63 4,548 Histogram of Rl Lobster Landings 988 to 998 Time Series Plot of Rl Lobster Landings 988 to 998 Statistics gathered from the National Marine Fisheries Service Website:
10 Independent Data Years Total # State Licenses Independent Data Years Total Rainfall in Inches Independent Data Years Total Number of Permits Independent Data Years Independent Data Sets Used for Comparative Analysis Est. # of Traps Fished // Independent Data Years Metric Tons of Toxic Waste 988,646, ,76, ,3, ,438,4 99 6,383, ,673, ,5, ,49,36 996,4,44 997,7, ,75,38 Independent Data Years Independent Years Air Temperatures S' Data Market Value US $ 5,68,937 7,53,53 9,84,539,39,49,98,7 8,843,769,953, 7,84, 8,358,39,5,993,3,45 Independent Data Years Values of REG Increase
11 3 Independant Data - Rl Rate of Toxic Waste Releases in Metric Tons from 988 to 998 Years Metric Tons of Pollution,646,338 7,76,57 6,3,57 5,438,4 6,383,857 6,673,43 7,5,45 3,49,36,4,44,7,449,75,38 " ^ Histogram in Metric Tons of Toxic Waste Released from Time Series Plot in Metric tons of Toxic Waste Released from Statistic gathered from Environmental Protection Agency New England Region Website under 'Toxic Release Inventory": 3
12 4 Independent Data - Rl Annual Rain Fall in Inches from 988 thru 998 Years Inches of Rain Fall // Annual Rain Fall Per Year in Inches for the State of RI Time Series Plot of Annual Rain Fall Per Year in Inches for the State of RI Statistics gathered from the "Weather Almanac-9th Edition" and the Climatilogical National Annual Survey. The city of Providence, Ri was the measuring point. 4

13 5 Independent Data- Rl Average Seasonal Air Temperature // in Centigrade from 988 to 998 Years Air Temperature *Missing month of data Histogram Average Annual Temperature in Centigrade for Fishing Seasons Time Series Plot of Average Annual Temperature in Centigrade for Fishing Seasons Statistics gathered from the "Weather Alamanac-9th Edition" and the Climatiligical National Annual Survey. The city of Providence, Rl was the measuring point. 5
14 6 Independent Data Active Rl Federal // Lobster Permits 988 to 998 Years Total # of Federal Permits Histogram of Active Federal Permits for Rl Home Ported Vessels from 988 thru 998 Time Series Plot of Active Federal Permits for Rl Home Ported Vessels from 988 thru 998 Data gathered from the Vessel Permit Data Base, National Marine Fisheries Service, Northeast Regional Offices

15 7 Independent Data - Annual Average Number of Traps Fished per Vessel In the State of Rl from 988 to 998 Years Traos Fishec // Data gathered from a confidential survey of Lobster Fishing Boat owner operators whose derived 5% or more of their annual income from fishing. 7
16 8 Independent Data - Market Value // of Rl Lobster Landings in US $ from Year 98S Value $ Millions 5,68,937 7,53,53 9,64,539,39,49,96,7 6,843,769,953, 7,84, 8,358,39,5.993,3,45 Histogram of Annual Market Value of Lobster Landings In US $ from Time Series Plot of Annual Market Value of Rl Lobster Landings in US $ from Dirts gathered from the National Marina Fisheries website: WWW:stnmfs.gov/webplcomm/plsql/webst.MF_LANDlNGS_ANNUAL. RESULTS 8

17 9 Independent Data - State Commercial Fishing Licenses // with Lobster Endorsements from 988 to 998 Years Total # State Licenses 6 No Record Available Histogram of State Licenses with Lobster Endorsements Active Time Series Plot of State Licenses with Lobster Endorsements Active Information gathered from the Rl Department of Environmental Management, Office of Registration and Licensing, Margaret McGrath, Administrative Officer 9

18 Independent Data-Government Regulations // on the Lobster Industry From 988 to 9989 Year Value 4 Histogram of Government Fishing Curtailment Regulations from 988 to 998 Time Series Plot of Government Fishing Curtailment Regulations from 988 to 998 Information gathered from the NMFS web site and the Ri DEM Regulations from 988 through 998. Values have been calculated for each event. *See "Government Regulation Calculation" page

19 Information Categorized into Bivariate Regression Data Groups // YR YR YR YR vs RF,59,597 3,9 3,377 3,67,85,936 3,433 3,4 3,63 4,548 vs MV,59,597 3,9 3,377 3,67,85,936 3,433 3,4 3,63 4,548 vs TW,59,597 3,9 3,377 3,67,85,936 3,433 3,4 3,63 4,548 vs GR,59,597 3,9 3,377 3,67,85,936 3,433 3,4 3,63 4,548 RF MV 5,68,937 7,53,53 9,84,539,39,49,98,7 8,843,769,953, 7,84, 8,358,39,5,993,3,45 TW,646,338 7,76,57 6,3,57 5,438,4 6,383,857 6,673,43 7,5,45 3,49,36,4,44,7,449,75,38 GR 4 YR YR YR YR vs AT,59,597 3,9 3,377 3,67,85,936 3,433 3,4 3,63 4,548 vs FP,59,597 3,9 3,377 3,67,85,936 3,433 3,4 3,63 4,548 vs TF,59,597 3,9 3,377 3,67,85,936 3,433 3,4 3,63 4,548 vs SL,59,597 3,9 3,377 3,67,85,936 3,433 3,4 3,63 4,548 AT ZS FP TF SL The above data was gathered from various sources cited on the separate Data Set Graphic Pages and on the last page.
20 Graphic Display of Comparative Analysis // for Lobster Landings VS Toxic Waste Release Time Series Plot of Lobster Landings VS Toxic Waste Release Scatter Plot Displaying Bivariate Linear Regression of Lobster Landinas VS Toxic Waste Release Number of cases used; (988 to 998) Pearson's r (Correlations Coefficient) = R-Square =.895 Test of hypothesis to determine significance of relationship: H(null): Slope = or H(null): r = (Pearson's) t = with 9 d.f. p< (A low p-value implies that the slope does not =.) FIELD N MEAN STD SEM MIN MAX SUM Lobsters Landed Toxic Waste It can be inferred from these charts and data that there is a positive affect (increase) in Lobster Landings () when compared to the reduction (decrease) of Toxic Waste (TW) released into the water. Whether it can be said that there is a direct causal relationship can only be determined when tests on the effects of the TW on lobster are conducted. *See attached list of TW. A significant relationship between the effects of Toxic Waste (TW) released into the water and the Lobster Landings () for Rl. This can be inferred from a nearly normal distribution.
21 3 Graphic Display of Comparative Analysis // for Lobster Landings VS Market Value Time Series Plot Correlating Lobster Landings VS Market value for Scatter Plot Displaying Bivariate Linear Regression of Lobster Landings VS Market Value for Number of cases used: (988 to 998) Pearson's r (Correlations Coefficient) =.53 R-Square =.89 Test of hypothesis to determine significance of relationship: H(null): Slope = or H(null): r = (Pearson's) t = with 9 d.f. p=.93 FIELD N MEAN STD SEM MIN MAX SUM Lobster Landed , Market Value It can be inferred from these charts and data that there is a parallel affect until 995 in Lobster Landings () when compared to the Market Value (MV). From this point on there is a inverse relationship between and MV probably due to supply vs demand basic economic variables of increased production and decreased demand equals the MV No significant relationship between variables can be inferred when comparing the effects of Market Value (MV) and the Lobster Landings (). This can be inferred from this less than normal distribution. 3
22 4 Graphic Display of Comparative Analysis // for Lobster Landings VS Federal Permits Time Series Plot Correlating Lobster Landings vs. Federal Permits Active for Scatter Plot Displaying Bivariate Linear Regression of Lobster Landings vs. Federal Permits Active for Number of cases used: Pearson's r (Correlations Coefficient) =.3873 R-Square =.5 Test of hypothesis to determine significance of relationship: H(null): Slope = or H(null): r = (Pearson's) t =.6 with 9 d.f. p=.39 FIELD N MEAN STO SEM MIN MAX SUM FP , It cannot be inferred from this data or charts that there is correlating affect between Lobsters Landed () when compared to the Number of Federal Permits Active (FP). While in the year 99 there was a factor of 9. increase in the number of FP there was only a factor of.6 increase in. The distribution is not normal so no correlation can be exists in this relationship. No significant relationship exists between the effects of the number of Federal Permits (FP) Active and the numbers of Lobsters Landed (). This can be inferred from the far less than normal distribution. 4
23 5 Graphic Display of Comparative Analysis // for Lobster Landings VS Average Annual Temperatures Time Series Plot Correlating Lobster Landings VS Average Air Temperature Scatter Plot Displaying Bivariate Linear Regression of Lobster Landings VS Average Air Temperature Number of cases used: Pearson's r (Correlations Coefficient) = R-Square =.56 Test of hypothesis to determine significance of relationship: H(null): Slope = or H(null): r = (Pearson's) t = with 9 d.f. p =.639 FIELD N MEAN STD SEM MIN MAX SUM AT It cannot be inferred from these charts and data that there is any correlation between Lobster Landings () when compared to the Average Annual Temperatures (AT) during the fishing season. It can be inferred that there is no affect on by AT. Water temperature may have an affect but data on mean ocean temperatures was unavailable to me at the time of this project. No significant relationship exists between the effects of Fishing Season Average Annual Temperatures (AT) and Lobster Landings () for Rl. This distribution is not normal. 5
24 6 Grapthic Display of Comparative Analysis // for Lobster Landings VS Traps Fished per Vessel Time Series Plot Correlating Lobster Landings VS Traps Fished in the State of Rl Scatter Plot Displaying Bivariate Linear Regression of Lobster Landings VS Traps Fished in the State of Rl Number of cases used: Pearson's r (Correlations Coefficient) =.786 R-Square =.64 Test of hypothesis to determine significance of relationship: H(null): Slope = or H(null): r = (Pearson's) t = with 9 d.f. p = 4 (A low p-value implies that the slope does not =.) FIELD N MEAN STD SEM MIN MAX SUM TF It cannot be inferred from these charts and data that there is any correlation between Lobster Landings () when compared to the Number of Traps Fished per Vessel. While there is a general trend in the increase of, it does not correlate with a specific upward trend in TF. In Years 9,93, 94 there was a marked decrease in with a steady increase in TF. Years 9,9, 95,96 were level while there was still a steady upward trend in TF. This would infer that has no affect on. No significant relationship exists between the effects of the Number of Traps Fished per Vessel (TF) and Lobster Landings () for Rl. This distribution is not normal. 6
25 7 Grapthic Display of Comparative Analysis // for Lobster Landings VS Average Annual Rain Fall Time Series Plot Correlating Lobster Landings VS Annual Rain Fall for the State of Rl Scatter Plot Displaying Bivariate Linear Regression of Lobster Landings VS Rain Fall for the State of Rl Number of cases used: Pearson's r (Correlations Coefficient) =.47 R-Square =.7 Test of hypothesis to determine significance of relationship: H(null): Slope = or H(null): r = (Pearson's) t = with 9 d.f. p =.666 FIELD N MEAN STD SEM MIN MAX SUM RF It can be inferred from these charts and data that there is a parallel affect in Lobster Landings () when compared to the Average Annual Rain Fall (RF). The relationship displays an increase in when there is an increase in the RF and a decrease in when there is a decrease in RF. This maybe due to the rise or fall in water salinity produced by the influx of fresh water into the bay and sound. Lobsters require a salinity of to in order to inhabit an area. A significant relationship exists between the effects of Rain Fall (RF) and the Lobster Landings (). This can be demonstrated from the nearly normal distribution. 7
 =.4 R-Square =.")
26 8 Graphic Display of Comparative Analysis for Lobster Landings VS Government Regulations // Graphic Display of Comparative Analysis for Lobster Landings VS Government Regulation Scatter Plot Displaying Bivariate Linear Regression of Lobster Landings VS Government Regulation Number of cases used: Pearson's r (Correlations Coefficient) =.4 R-Square =.458 Test of hypothesis to determine significance of relationship: H(null): Slope = or H(null): r = (Pearson's) t = with 9 d.f. p =.57 - FIELD N MEAN 5TD SEM MIN MAX SUM GR It cannot be inferred from these charts and data that there is any correlation between Lobster Landings () when compared to the effective value of Government Regulation on fishing effort The shows that while there may be a dramatic increase in fishing curtailment regulations there has no correlating decrease in the amount of lobsters landed that corresponds to these measures. No significant relationship between the effects of Government Regulations (GR) on Fishing and Lobster Landings () exists. This can be inferred from the erratic patterns of GR and the steady upward trend of.8
 =.73 R-Square =.")
27 9 Graphic Display of Comparative Analysis // for Lobster landings VS State Licenses Time Series Plot Correlating Lobster Landings VS Total Number of Commercial Lobster Fisherman Scatter Plot Displaying Bivariate Linear Regression of Lobster Landings VS Total Number of Commercial Lobster Fisherman Number of cases used: Pearson's r (Correlations Coefficient) =.73 R-Square =.586 Test of hypothesis to determine significance of relationship: H(null): Slope = or H(null): r = (Pearson's) t = with 9 d.f. p=.4 (A low p-value implies that the slope does not =.) FIELD N MEAN STD SEM MIN MAX SUM 3C SL 75E It can be inferred from this data that there is a parallel correlation in Lobster Landings () when compared to the Total Number of State Licenses Issued [w/lobster endorsements] (SL) for six years from 993 (6) to 998 () when there is an increase in the SL and a increase in. While for fours years from 989 () to 99 (5) there is a inverse correlation between and SL. No data was available for 988. Federal permits require state licenses but not the reverse. A significant relationship exists variables from 993 forward. After the dramatic increase in State Licenses and in 993 Lobsters Landed have a parallel correlation. This is a nearly normal distribution of variables after thispoint9
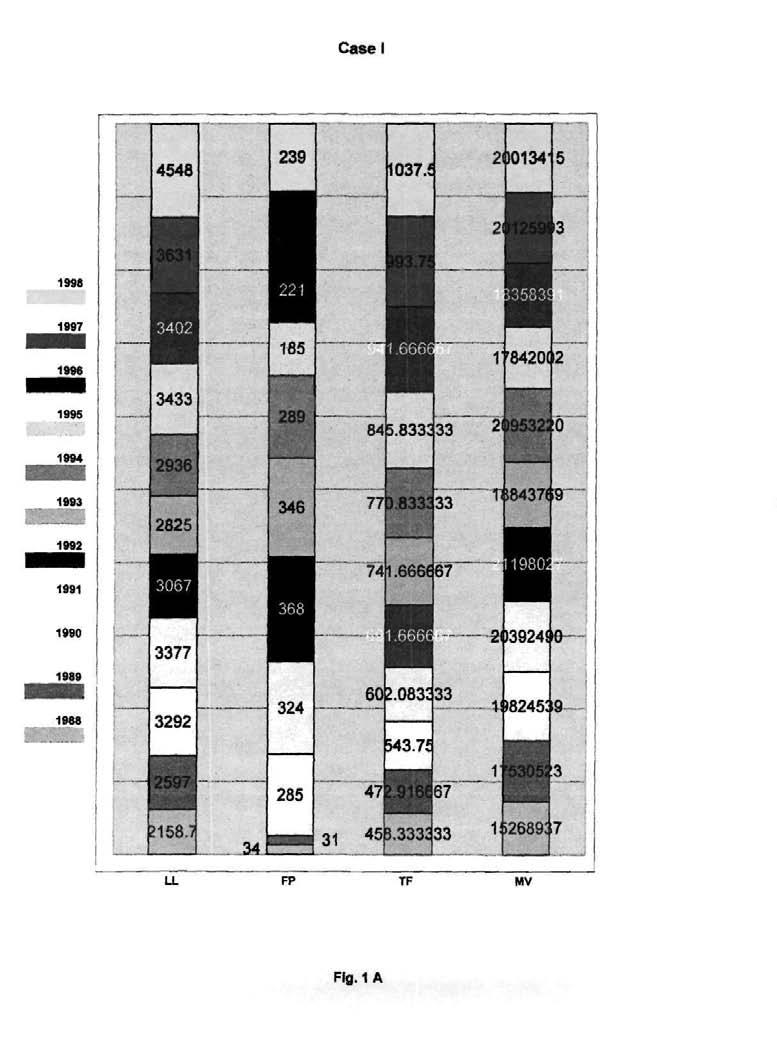
28 Multivariate Data Sets Used for // Multiple Regression and Correlation Matrix Case l Years Fishing Effort Dependent Data Metric Tons of Lobsters,59,597 3,9 3,377 3,67,85,936 3,433 3,4 3,63 4,548 \Independent Data Federal Permits Traps Fished Value $ Millions 5,68,937 7,53,53 9,84,539,39,49,98,7 8,843,769,953, 7,84, 8,358,39,5,993,3,45 Case II Years Fishing Effort Regulations Dependent Data Metric Tons of Lobsters,59,597 3,9 3,377 3,67,85,936 3,433 3,4 3,63 4,548 Independent Data Traps Fished State Licenses Government Rea's Case IIl Years Outside Influences Dependent Data Metric Tons of Lobsters,59,597 3,9 3,377 3,67,85,936 3,433 3,4 3,63 4,548 Independent Data Toxic Waste,646,338 7,76,57 6,3,57 5,438,4 6,383,857 6,673,43 7,5,45 3,49,36,4,44,7,449,75,38 Rain Fall Air Temperature Case IV Comparison of Factors for Cases, II, III Dependent Data \lndependent Data Median Fishina Effort 3,6 + Factor -Factors - Government Rea's.5+ Factors.5-Factors Outside Influences + Factor - Factors -
29
30 Case I WINKS 4.6 Linear Regression and CorreJ.ation November 5. C :\WINKS\LOBl.DBF Dependent variable is, 3 independent variables, < :ases Variable Coefficient St. Error t-value p( tail) Intercept FP -.6 TF, MV 578 R-Square = Analysis of Variance to Test Adjusted R-Square =.5556 Regression Relation Source Sum of Sqs df Mean Sq F p-value Regression Error Total A low p-value suggests that the dependent variable may be linearly related to i ndependent variable(s). Fig. B
31 Case I WINKS 4. 6 Matrix of Correlation Coefficients November 5, C:\WINKS\LOBl.DBF FP TF MV FP. 387 TF. 783 MV.53 (.39) ( 4) (.93) [ ] [ ] t HI (.3) () [ ] [ ]. 384 [.44) [ ] Key: Correlat (p-value [count] ion ) Fig c
32 Case I WINKS 4.6 November 5, Descri ptive Statistics, Summary C:\WINKS\LOBl.DBF Statis itics from database C :\WINKS\LOBl.DBF Number of record s= FIELD YEARS N 988. MEAN STD SEM MIN MAX SUM FP TF MV FIELD YEARS N MEAN STD SEM MIN MAX SUM FP TF MV ,,, FIELD YEARS N 99. MEAN STD SEM MIN MAX SUM FP TF MV FIELD YEARS N 99. MEAN STD SEM MIN MAX SUM FP TF MV FIELD YEARS N 9 9. MEAN STD SEM MIN MAX SUM f FP TF MV FIELD YEARS N 993. MEAN STD SEM MIN MAX SUM FP TF MV FIELD YEARS N 994. MEAN STD SEM MIN MAX SUM Fig. D
33 FP TF MV FIELD YEARS = N 995. MEAN STD SEM MIN MAX SUM FP TF MV FIELD YEARS = N 996. MEAN STD SEM MIN MAX SUM FP TF MV , FIELD YEARS N 997. MEAN STD SEM MIN MAX SUM FP TF MV , FIELD YEARS ~ N 998. MEAN STD SEM MIN MAX SUM FP TF MV , Fig. D
34 Bar Chart: C:\WINKS\LBCASE.DBF Fig. A
35 ",ase II Linear Regression and Corre lation C:\WINKS\LOBCASE.DBF Dependent variable is, 3 independent variabl< S, cases Variable Coefficient St. Error t--value p( tail) Intercept TF SL GR : L R-Square =,6658 Adjusted R-Square =.56 - Analysis of Variance to Test Regression Relation Source Sum of Sqs df Mean Sq F p-value Regression Error Total A low p-value suggests that, may be linearly related to the dependent variable independent variable(s) Fig. B
36 Case III WINKS 4.6 Linear Regression and Correl ation November 5, C :\WINKS\LOB3.DBF Dependent variable is, 3 independent variables, cases. Variable Coefficient St. Error t-value p( tail) Intercept TW -5 RF AT R-Square =.87 Analysis of Variance to Test Adjusted R-Square =.858 Regression Relation. 85 <, Source Sum of Sqs df Mean Sq F p-value Regression Error Total A low p-value suggests that the dependent variable may be linearly related to independent variable(s). Fig. 3 C
37 Case III WINKS 4.6 November 5, Matrix of Correla tion Coefficients C:\WINKS\LOB3.DBF i hi TW TW RF ( D.) (.666) [ ] [ ].6 (.757) [ ] AT -.6 (.639) [ ].9 (.386) [ U] RF,76 (.64) [ ]. AT ~ Key: Correlat ion [p-value ) [count] Fig. 3 D
38 Case III WINKS 4.6 November 5, Descri ptive Statistics, Summary C:\WINKS\LOB3.DBF Statis tics from database C:\WINKS\LOB3.DBF Number of records FIELD YEAR = N MEAN STD SEM MIN MAX SUM TW RF AT ,4,.,, FIELD YEAR = N MEAN STD SEM MIN MAX SUM TW RF AT " 7, ,, ,3 i FIELD YEAR = 9 9, N MEAN STD SEM MIN MAX SUM TW RF AT 39, ,78 65,4,,.,, FIELD YEAR = 9 9. N MEAN STD SEM MIN MAX SUM TW RF AT C.OO ,,,..., , , FIELD YEAR = 9 9, N NEAN STD SEM MIN MAX SUM TW RF AT ,,,., , FIELD YEAR = N MEAN STD SEM MIN MAX SUM TW RF AT ,6 66.,.,,, , FIELD YEAR = N MEAN STD SEM MIN MAX SUM FTP. 3 F.
39 TO RF AT FIELD YEAR = 995. N MEAN STD SEM MIN MAX SUM TW RF AT , FIELD YEAR = 996. N MEAN STD SEM MIN MAX SUM TW RF AT FIELD YEAR = 997. N MEAN STD SEM MIN MAX SUM TW RF AT FIELD YEAR = 998. N MEAN STD SEM MIN MAX SUM TW RF AT Fig. 3 E
40 Line Chart: C:\WINKS\LBCASE4.DBF Fig. 4 A
41 Case IV /5/ This chart reveals the effect each case has on the base line of Lobsters Landed (). It can be infered from this chart and the data that was used to construct it that government regulations to have the least effect on the amount of Lobsters Landed () and that Outside Influences (I) has the greatest effect on Lobsters Landed (). Fig. 4 B
42 Case IV WINKS 4.6 November 5, Descriptive Statistics, Summary C:\WINKS\LOBCASE4.DBF Statistics from database C:\WINKS\LOBCASE4.DBF Number of records=, FIELD N MEAN STD SEM MIN MAX SUM ' BASE_LINE FE GR OI Fig. 4 C
43 Temprature and Rainfall Data Comparisons and Calculations /5/ for NWS Averages MAY JUNE JULY 58 Average Temprature 67 Average Temprature 73 Average Temprature 3.6 Total Rainfall.9 Total Rainfall 3. Total Rainfall AUG. SEP. OCT. 7 Average Temprature 63 Average Temprature 53 Average Temprature 3.9 Total Rainfall 3.5 Total Rainfall 3.6 Total Rainfall Data / missingfieldfor Temprature, missingfieldsfor Rainfall MAY JUNE JULY 58.4 Average Temprature 68.3 Average Temprature 7.95 Average Temprature 3.4 Total Rainfall.8 Total Rainfall 3.7 Total Rainfall AUG. SEP. OCT. 7.9 Average Temprature Average Temprature 53.4 Average Temprature 3.9 Total Rainfall 3.7 Total Rainfall 3.76 Total Rainfall Average Temprature Data from the National Weather Almanac May June July August Monthly Averages N/R th Edition September Total Rain Fall Da a from the National Weather Almanac - 9th Edition May June July August September Monthly Averages N/R 3.4 C N/R October October Annual Average Annual Average All Data was gathered from the "Weather Alamanac - 9th Edition", the "Climatolicical National Annual Survey" and the National Weather Service Website " for the city of Providence.

44 3 Trap Survey Data for Fishing Season 988 thru 998 // Pt Judith/Snug Harbor Year/Boat Average Newport/Jamestown/Tiverton Year/Boat Average Warwick/East Greenwich/Wickford Year/Boat C C C C C Average Average Number of Traps Fished Each Year Data was gathered from survey conducted of 4 lobster fishing boat owners operators who derived at least 5% of their annual income from fishing. 3
45 4 Value Calculations for «* / Government Regulation Implementation Min Lobster Size Increase Iniatitive Incremental Increase / Values Year Total Value=per Size Value lobster size increase Trap Reduction Iniatitive Traps per vessel allowed / Values Year Number Value D D Total Value = per traps reduced License Moratorium Chronology Per Year / Values Year Total Number Value 6 Value = per year of moratorium Min Escape Vent S ize Increase Incremental Increases / Values Year Total Size Value Value= per escape vent size increase Permit Moratorium Per Year / Values Year Total k/alue a per year of moratorium Chronology Value 5 5 Values per Year Summations Per Year / Values Year Total Number Value 4 5 Value = Annual totals per category 4

46 Summary: The data collected was categorized into three studies, univariate over time, bivariate over time, and multivariate over time. Comparisons of this data were made using various accepted statistical analysis techniques. In most cases data was entered in a chronological manner because the hypothesis is based on a trend over time. In the final case data was entered using forced entry using my background in the industry to make judgments on what order to be used. Measures are made quantitatively using standard unit of measures or assigned values after calculation when standard measures weren't appropriate. When ever possible, alternate explanations for plausible causal relationships have been rendered using known and established information. When no alternate explanation is apparent in depth scientific studies are called for. Documentation: All sources have been referenced in the last page of this study using the APA format. Data used was gathered from sources three major areas are generally accepted as reliable. ) 5% of the data gathered was either used by and/or provided by several governing agencies and the scientific community in the form of printed or electronic media available to the general public. ) 5% of the data gathered was from "Official Requests for Information" to appropriate agencies under the Freedom of Information Act. 3) 5% of the lata was gathered through the use of face-to-face or telephonic interviews and surveys taken by the author. Comparisons: Univariate - Data points for an eleven-year period starting in 988 and ending in 998 were organized and graphically displayed using histograms and time series plots. Each data point was compared to the next chronologically using one calendar year summations. This was done in order to determine any significant trends from one year to the next. Bivariate - Various independent data sets were compared to the dependent data set (lobster landings in metric tons). The data was graphically displayed using time series plots and scatter plots. Each data set was compared to the next chronologically using the eleven-year time line. Linear regression, Pearson's correlation, comparison of the basic descriptive statistical data, and any observed correlations in the graphs were used to determine if any significant correlation could be inferred from these data sets. Multivariate Analysis: Taking the results from the Univariate comparisons three cases were formed. They were fishing effort (FE), government regulations (GR), outside influences (OI). Each one of these cases compare three independent variables related to the particular case with dependent variable of lobsters landed (). A forth case was created comparing the three studies between themselves as independent variables versus the dependent variable median lobster landings. Values were calculated and assigned to each bivariate comparison. The data was then graphically displayed so as to compare all the variables over time. This was done using various graphing techniques such as base line charts, time
47 series plots, line charts and bar charts. Statistical summaries by chronological group, correlation matrixes, and multivariate were used as the descriptive statistical data. Quantification: Significant Relationship Inferences - Significance was inferred by the observation of data points over time havng or not having a parallel or inverse relationship. That is to say was there a proportionate increase or decrease of the independent data point as compared to the dependent data at the same point in time. Significant Relationship Quantification - So as to be able to quantify resulting observation a three level scale was used. If three or less continuous independent data points did not correlate than it was inferred that no significant relationship existed. If 4 to 7 independent data points correlated then it was inferred that a moderate significance existed. If 8 or more existed then it was inferred that a strong relationship existed. Assigning Value - For Case IV if a moderate significance was inferred a +.5 value was given. If a strong relationship is inferred it was given a value of +. If no significant relationship was inferred it was given a value of -. These values were used to display the existing relationships between cases I, n, and HI, as compared to a baseline of on a baseline chart. Cause and Effect: Due to the factors of time ( weeks) and resources (no funding) not all possible studies on every possible scenario were conducted. While no absolute causal relationship can be established (this would require a in depth scientific study) there are significant relationships, which can be inferred with a high degree of certainty. The results are so obvious as to bring in to question the validity of positions held by the scientific and government community. The three cases presented where there is enough of a significant relationship to infer that it is highly likely to be a causal relationship are Toxic Waste Releases (TW), Rain Fall (FR) and Traps Fished (TF). VII

48 Alternate Theories: Scientific studies utilizing experiments that would determine to what extent the effects of TW taking each component listed could be conducted. Combinations of elements and amounts of each one could be established by use of computer simulations then actual experiments could be conducted by introducing these elements at various rates into the observed, closed test environments to determine the effect on the test animals. A similar study could be done with salinity/sediment levels in a water table although basic data currently exists concerning these effects thereby addressing the RF correlation. In regards to traps fished, the position that fishing effort is a root cause to an eventual stock decline and possible collapse (as taken by the government and scientific community) is an assumption that could be quantified and verified (or dismissed) through studies on the following possible scenarios. ) That all marine life is cyclical in nature because of there required coexistence in the ecosystem. The decline in predators fish due to ground fish over fishing, decrease in toxic waste released into the water due to the "Clean Water Act" and the change in salinity/water temperature due to the "Green House Effect" has actually increased the lobster stocks over time. ) That by decreasing the number of traps fished the results will only increase the number of lobsters caught per trap. Their by increasing the return on effort (ROE) from the current average of pound per pot per haul seasonally. 3) That there are so manyfisherman,fishingso many traps, the amount of bait in the water (in fact an artificial condition) has created an environment where lobsters have a man made habitat where juveniles under legal harvest size have additional advantages towards survival. Food and shelter that would otherwise not be present in the ecosystem is placed by the fisherman, there by assisting sub legal size lobsters to live and breed safely until reaching harvestable size. These are the most popular contentions held by thefishingcommunity. Scientific studies could be easily conducted and statistical models constructed to quantify or dismiss these contentions. They are directly related to the TF case. There are currently studies in existence, underway or recently funded that may address these possibilities. Two of which are: Study to Predict Lobster Catch Funded - The Maine/New Hampshire Sea Grant Program was recently awarded funding from National Sea Grant for a three-year project called "Developing Indices Necessary for Predicting Commercial Catches of the American Lobster". The three year project, researchers will develop and test techniques to predict lobster landings at study sites in coastal waters of Long Island Sound, Rhode Island, New Hampshire, and Maine. "The Fate of Bait" - Dr. Robert Steneck of the University of Maine conducted an experiment with graduate students where lobsters were observed crawling into and out of the forward chambers of lobster traps to feed on redfish, herring, and other baitfishor VIII
49 stealing pieces of bait through the slats of the traps. They were even observed crawling into empty traps. Dr. Robert Steneck concluded that, "Baited lobster traps may actually be the largest aquaculture effort in the world." 3 Shortly after all the traps were removed from thefishinggrounds, the lobsters left the area, too. Information gathered from the "The Fate of Bait" study and from the University of Maine's Lobster Institute shows there are various scientific explanations. One of which is that contention #3 may be a large factor. "Research has found that lobsters have definite opinions as to the type of ocean bottom they prefer. Given the option of settling down on mud, sand, gravel, or cobble (small stones), they all gravitated to the cobble bottom where they could hide from predators in the spaces between the rocks and still catch falling food. "Adolescent" lobsters (a few years old to market size) prefer areas with larger boulders. Adult lobsters don't seem to care-they'll go anywhere and sometimes migrate long distances. They also have fewer predators today." 4 Dr. Steneck also did an observed study where he created what he defined as a "lobster condo" by taking sections of PVC pipe, attaching them together and placing the "condo" on the sea bottom in areas historically inhabited by lobsters. His observations show that it was, "quickly inhabited by sub legal juvenile lobsters". 5 It would seem that the scientific community has enough evidence in the form of studies conducted by long time reputable members of there community to warrant a full study into these three possible explanations provided by the opposing fishing industry. This would in turn lay to rest logical opposition as it can currently be assessed or give credence and confirmation to questions raised by thefishingcommunity. IX 3 Quoted from the "Fate of Bait" study conducted by Dr. Robert Steneck of the University of Maine 4 Quoted from "A lobsters life cycle" University Maine Lobster Institute, web address 5 Quoted from the "Fate of Bait" study conducted by Dr. Robert Steneck of the University of Maine and "A lobsters life cycle" University Maine Lobster Institute, web address http ://octopus.gma. org/lobsters/society. html
50 References: National Marine Fisheries Service. Annual Landings Results North Atlantic Lobster 988 through 998. Retrieved October, from the World Wide Web: Environmental Protection Agency. New England Region Toxic Waste Release Inventory 988 through 998. Retrieved October, from the World Wide Web: epa.gov/region /steward/emerplan/toxic. html National Weather Service. (999). Weather Almanac (9 th ed.) Washington, DC: United States Printing Office National Climate Data Center. (). Climatilogical National Annual Survey -999 Washington, DC: United States Printing Office Official request for information under the "Freedom of Information Act" Received 6 October from John Nagel, Supervisory Policy Analyst, Operations Group, Sustainable Fisheries Division, Northeast Regional Office, National Marine Fisheries Service Official request for nformation under the "Freedom of Information Act" Received 3 October frommargaret McGrath, Administrative Officer, Rhode Island Department of Environmental Management Office of Licenses and Registration. Rhode Island Fisheries Regulations published and implemented from 988 through 998 Federal Fisheries Regulations published and implemented from 988 through 998 X
51 Lobster Management Areas Page of THE BASICS Home Contact Us About Us Links Pictures INFORMATION Tha Lobster Fishery Map of Mgt Areas Glossary Lobster Length-Weight Mortality Rates AnnuaL Landings Overfishing Defined Fishery Bioeconomics Catch & Effort FILES TO DOWNLOAD Lobster Business Models Fish Mgt. Slide Show KEY CONCEPTS Recruit Overfishing Growth.Overfishing Fishing Mortality Conservation Payoff Targets vs Thresholds Sitemap Hits OwnersSuite

52 The Official Definition of 3verfishing Explained Page of THE BASICS Home Contact Us About Us Links Pictures INFORMATION TheLobster Fishery Map of Mgt Areas Glossary Lobster Length-Weipht Mortality Rates Annua.andings Overflshing Defined Fishery Bioeconomics Catch & Effort FILES TO DOWNLOAD Lobster Business Modals Fish Mgt. Slide Show KEY CONCEPTS Recruit Overfishing Growth Overfishing Fishing Mortattty Conservation Payoff Targets vs Thresholds Owners Suite The "Definition of Overfishing" for the Lobster Resource "The American lobster resource is overfished when it is harvested at a rate that results in egg production from the resource, on an egg-per-recruit basis, that is less than % of the level produced by an unfished population." (Atlantic States Marine Fisheries Commission Amendment #3 to the Interstate Fishery Management Plan for Lobster) This official definition of overfishing can also be explained as follows: The average female lobster should be allowed to live long enough to produce at least % of the eggs that she would produce if she were allowed to live her natural life. While it may seem impossible to judge the egg production from an unfished population, considering that the lobster population has been heavily fished for over years, it should be considerably easier to calculate the egg production from a female that lived a natural life span. If we know how often a female produces eggs, how many eggs she produces each time, and how many years she is likely to live, we can calculate how many eggs she would produce over her life time.
Chapter 12 Practice Test
 Chapter 12 Practice Test 1. Which of the following is not one of the conditions that must be satisfied in order to perform inference about the slope of a least-squares regression line? (a) For each value
NOAA s Role in Chesapeake Bay
 NOAA s Role in Chesapeake Bay NOAA Chesapeake Bay Office Mission To understand, predict and explain changes in the Chesapeake Bay ecosystem, and to coordinate efforts to conserve and manage coastal and
SCIENTIFIC COMMITTEE SEVENTH REGULAR SESSION August 2011 Pohnpei, Federated States of Micronesia
 SCIENTIFIC COMMITTEE SEVENTH REGULAR SESSION 9-17 August 2011 Pohnpei, Federated States of Micronesia CPUE of skipjack for the Japanese offshore pole and line using GPS and catch data WCPFC-SC7-2011/SA-WP-09
Biological Review of the 2014 Texas Closure
 Biological Review of the 2014 Texas Closure Report to the Gulf of Mexico Fishery Management Council by James M. Nance, Ph.D. Southeast Fisheries Science Center Galveston Laboratory January 2015 Introduction
West Coast Rock Lobster. Description of sector. History of the fishery: Catch history
 West Coast Rock Lobster Description of sector History of the fishery: The commercial harvesting of West Coast rock lobster commenced in the late 1800s, and peaked in the early 1950s, yielding an annual
Section I: Multiple Choice Select the best answer for each problem.
 Inference for Linear Regression Review Section I: Multiple Choice Select the best answer for each problem. 1. Which of the following is NOT one of the conditions that must be satisfied in order to perform
SOCIETAL GOALS TO DETERMINE ECOSYSTEM HEALTH: A FISHERIES CASE STUDY IN GALVESTON BAY SYSTEM, TEXAS
 SOCIETAL GOALS TO DETERMINE ECOSYSTEM HEALTH: A FISHERIES CASE STUDY IN GALVESTON BAY SYSTEM, TEXAS Anthony S. Pait, NOAA, National Centers for Coastal Ocean Science Thomas P. O Connor, David R. Whitall,
Youngs Creek Hydroelectric Project
 Youngs Creek Hydroelectric Project (FERC No. 10359) Resident Trout Monitoring Plan Annual Report 2014 Survey Prepared by: Everett, WA November 2014 Final This document has been prepared for the District.
Presentation on Municipal Solid Waste (MSW) Interstate Flow in the Northeast in 2014 November 13, 2017
 Interstate Flow in the Northeast in 2014 November 13, 2017") Presentation on Municipal Solid Waste (MSW) Interstate Flow in the Northeast in 2014 November 13, 2017 Prepared by the NEWMOA Solid Waste Metrics Workgroup State environmental agencies in the Northeast
Presentation on Municipal Solid Waste (MSW) Interstate Flow in the Northeast in 2014 November 13, 2017 Prepared by the NEWMOA Solid Waste Metrics Workgroup State environmental agencies in the Northeast
2001 REVIEW OF THE ATLANTIC STATES MARINE FISHERIES COMMISSION FISHERY MANAGEMENT PLAN FOR WEAKFISH (Cynoscion regalis)
") 2001 REVIEW OF THE ATLANTIC STATES MARINE FISHERIES COMMISSION FISHERY MANAGEMENT PLAN FOR WEAKFISH (Cynoscion regalis) Plan Review Team Rick Cole, DE Louis Daniel, NC Charles Lesser, DE Rob O Reilly,
2001 REVIEW OF THE ATLANTIC STATES MARINE FISHERIES COMMISSION FISHERY MANAGEMENT PLAN FOR WEAKFISH (Cynoscion regalis) Plan Review Team Rick Cole, DE Louis Daniel, NC Charles Lesser, DE Rob O Reilly,
ASMFC Stock Assessment Overview: American Lobster
 Introduction The 215 benchmark stock assessment for lobster is the most comprehensive evaluation of stock status to date. It differs from previous stock assessments in that it combines the Gulf of Maine
JOB 3: LOBSTER FISHERY DATA COLLECTION FINAL REPORT
 JOB 3: LOBSTER FISHERY DATA COLLECTION FINAL REPORT ABSTRACT Starting in 2006, all individuals who purchased lobster harvest licenses were required to report catch and effort data either by trip-level
July 9, SINTEF Fisheries and Aquaculture 1
 Exploring the influence of climate, competition and aquaculture on the dynamics of Fraser River sockeye salmon and the economics of their fisheries Yajie Liu, SINTEF Fisheries and Aquaculture, Norway Brendan
Justification for Rainbow Trout stocking reduction in Lake Taneycomo. Shane Bush Fisheries Management Biologist Missouri Department of Conservation
 Justification for Rainbow Trout stocking reduction in Lake Taneycomo Shane Bush Fisheries Management Biologist Missouri Department of Conservation December 14, 2017 Lake Taneycomo was formed by the construction
PACIFIC BLUEFIN TUNA STOCK ASSESSMENT
 PACIFIC BLUEFIN TUNA STOCK ASSESSMENT SUMMARY 19-21 December 2012 Webinar PACIFIC BLUEFIN TUNA STOCK ASSESSMENT SUMMARY 1. Stock Identification and Distribution Pacific bluefin tuna (Thunnus orientalis)
Gulf of Maine Research Institute Responsibly Harvested Seafood from the Gulf of Maine Region Report on Atlantic Sea Scallops (Inshore Canada)
") Gulf of Maine Research Institute Responsibly Harvested Seafood from the Gulf of Maine Region Report on Atlantic Sea Scallops (Inshore Canada) The fishery is managed by a competent authority and has a management
Gulf of Maine Research Institute Responsibly Harvested Seafood from the Gulf of Maine Region Report on Atlantic Sea Scallops (Inshore Canada) The fishery is managed by a competent authority and has a management
ASMFC Stock Assessment Overview: Red Drum
 Purpose The purpose of this document is to improve the understanding and transparency of the Commission s stock assessment process and results. It is the first of several that will be developed throughout
F I N D I N G K A T A H D I N :
 F I N D I N G K A T A H D I N : An Online Exploration of Maine s Past LOBSTER ROLL!* Lesson 7.3 Objective: Students will collect data by playing a game that illustrates the delicate ecological balance
Draft Discussion Document. May 27, 2016
 Draft Discussion Document May 27, 2016 Action to consider modifications to the sub-acl of GB haddock allocated to the Atlantic herring fishery and associated accountability measures AP/ CMTE Input 1. Review
Draft Addendum IV for Public Comment. American Eel Management Board August 2014
 Draft Addendum IV for Public Comment American Eel Management Board August 2014 Current Management The Board initiated the development of Draft Addendum III in response to the Stock Assessment in August
Monitoring the length structure of commercial landings of albacore tuna during the fishing year
 SCTB15 Working Paper ALB-5 Monitoring the length structure of commercial landings of albacore tuna during the 2001 2002 fishing year Linda Griggs National Institute of Water and Atmospheric Research Ltd.
What s UP in the. Pacific Ocean? Learning Objectives
 What s UP in the Learning Objectives Pacific Ocean? In this module, you will follow a bluefin tuna on a spectacular migratory journey up and down the West Coast of North America and back and forth across
CALIFORNIA DEPARTMENT OF FISH AND WILDLIFE RECOMMENDATIONS ON ADDITIONAL WINTER-RUN PROTECTIONS IN 2016 OCEAN FISHERIES
 Agenda Item E.1 CDFW Supplemental Report April 216 CALIFORNIA DEPARTMENT OF FISH AND WILDLIFE RECOMMENDATIONS ON ADDITIONAL WINTER-RUN PROTECTIONS IN 216 OCEAN FISHERIES In April 215, CDFW recommended
Update on the 2017 Atlantic Menhaden Fishing Season
 Update on the 2017 Atlantic Menhaden Fishing Season Sustainable Fisheries Branch NMFS Beaufort Laboratory Beaufort, NC GSMFC Spring Meeting Panama City, FL March 13, 2018 2017 Landings for Reduction One
Growth: Humans & Surf Clams
 Growth: Humans & Surf Clams East Coast MARE Materials For the leader: Projector Whiteboard to project data graph onto White paper & markers For the activity: Copy of data table Copy of map Class graphing
FISHERIES MANAGEMENT UNDER SPECIES ALTERNATION: CASE OF THE PACIFIC PURSE SEINER OFF JAPAN
 FISHERIES MANAGEMENT UNDER SPECIES ALTERNATION: CASE OF THE PACIFIC PURSE SEINER OFF JAPAN Mitsutaku Makino, Fisheries Research Agency, Japan, mmakino@affrc.go.jp Takumi Mitani, Fisheries Research Agency,
A. SOUTHERN NEW ENGLAND / MID-ATLANTIC (SNE/MA) WINTER FLOUNDER ASSESSMENT SUMMARY FOR 2011
 WINTER FLOUNDER ASSESSMENT SUMMARY FOR 2011") A. SOUTHERN NEW ENGLAND / MID-ATLANTIC (SNE/MA) WINTER FLOUNDER ASSESSMENT SUMMARY FOR 2011 State of Stock: In 2010 the SNE/MA winter flounder stock was overfished but overfishing was not occurring. The
A. SOUTHERN NEW ENGLAND / MID-ATLANTIC (SNE/MA) WINTER FLOUNDER ASSESSMENT SUMMARY FOR 2011 State of Stock: In 2010 the SNE/MA winter flounder stock was overfished but overfishing was not occurring. The
INFLUENCE OF ENVIRONMENTAL PARAMETERS ON FISHERY
 Chapter 5 INFLUENCE OF ENVIRONMENTAL PARAMETERS ON FISHERY 5. Introduction Environmental factors contribute to the population dynamics and abundance of marine fishery. The relationships between weather,
Running head: DATA ANALYSIS AND INTERPRETATION 1
 Running head: DATA ANALYSIS AND INTERPRETATION 1 Data Analysis and Interpretation Final Project Vernon Tilly Jr. University of Central Oklahoma DATA ANALYSIS AND INTERPRETATION 2 Owners of the various
Haddock (Melanogrammus aeglefinus) in divisions 7.b k (southern Celtic Seas and English Channel)
 in divisions 7.b k (southern Celtic Seas and English Channel)") ICES Advice on fishing opportunities, catch, and effort Celtic Seas, Greater North Sea, and Oceanic Northeast Atlantic ecoregions Published 29 June 2018 https://doi.org/10.17895/ices.pub.4453 Haddock (Melanogrammus
ICES Advice on fishing opportunities, catch, and effort Celtic Seas, Greater North Sea, and Oceanic Northeast Atlantic ecoregions Published 29 June 2018 https://doi.org/10.17895/ices.pub.4453 Haddock (Melanogrammus
8th Grade. Data.
 1 8th Grade Data 2015 11 20 www.njctl.org 2 Table of Contents click on the topic to go to that section Two Variable Data Line of Best Fit Determining the Prediction Equation Two Way Table Glossary Teacher
Standardized catch rates of U.S. blueline tilefish (Caulolatilus microps) from commercial logbook longline data
 from commercial logbook longline data") Standardized catch rates of U.S. blueline tilefish (Caulolatilus microps) from commercial logbook longline data Sustainable Fisheries Branch, National Marine Fisheries Service, Southeast Fisheries Science
Standardized catch rates of U.S. blueline tilefish (Caulolatilus microps) from commercial logbook longline data Sustainable Fisheries Branch, National Marine Fisheries Service, Southeast Fisheries Science
CALIFORNIA DEPARTMENT OF FISH AND WILDLIFE UPDATE ON LANDINGS OF TUNA, SWORDFISH AND OTHER PELAGICS
 Agenda Item H.2.c Supplemental CDFW Report 1 November 217 CALIFORNIA DEPARTMENT OF FISH AND WILDLIFE UPDATE ON LANDINGS OF TUNA, SWORDFISH AND OTHER PELAGICS CDFW Summary of HMS Landings Data Improvement
Announcements. Lecture 19: Inference for SLR & Transformations. Online quiz 7 - commonly missed questions
 Announcements Announcements Lecture 19: Inference for SLR & Statistics 101 Mine Çetinkaya-Rundel April 3, 2012 HW 7 due Thursday. Correlation guessing game - ends on April 12 at noon. Winner will be announced
June NMFS Address 11, 2014 (NOAA): Council Address. Dover, DE 19901
: Council Address. Dover, DE 19901") BLACK SEA BASS SEASON OPENING FRAMEWORK ADJUSTMENT Discussion Document and Background June 2014 Mid-Atlantic Fishery Management Council in cooperation with the National Marine Fisheriess Service (NMFS)
BLACK SEA BASS SEASON OPENING FRAMEWORK ADJUSTMENT Discussion Document and Background June 2014 Mid-Atlantic Fishery Management Council in cooperation with the National Marine Fisheriess Service (NMFS)
Blue cod 5 (BCO5) pot mesh size review
 pot mesh size review") Blue cod 5 (BCO5) pot mesh size review Discussion Document MPI Discussion Paper No: 2017/01 Prepared for public consultation by the Ministry for Primary Industries ISBN No: 978-1-77665-454-3 (o) ISSN No:
Blue cod 5 (BCO5) pot mesh size review Discussion Document MPI Discussion Paper No: 2017/01 Prepared for public consultation by the Ministry for Primary Industries ISBN No: 978-1-77665-454-3 (o) ISSN No:
Atlantic Striped Bass Draft Addendum V. Atlantic Striped Bass Board May 9, 2017
 Atlantic Striped Bass Draft Addendum V Atlantic Striped Bass Board May 9, 2017 Timeline May 2017: Consider Approval of Draft Addendum V for Public Comment May July 2017: Public Comment period August 2017:
Economic Value of Celebrity Endorsements:
 Economic Value of Celebrity Endorsements: Tiger Woods Impact on Sales of Nike Golf Balls September 27, 2012 On Line Appendix The Golf Equipments Golf Bags Golf bags are designed to transport the golf clubs
Pitching Performance and Age
 Pitching Performance and Age By: Jaime Craig, Avery Heilbron, Kasey Kirschner, Luke Rector, Will Kunin Introduction April 13, 2016 Many of the oldest players and players with the most longevity of the
AGENCY: National Marine Fisheries Service (NMFS), National Oceanic and Atmospheric
, National Oceanic and Atmospheric") This document is scheduled to be published in the Federal Register on 05/30/2013 and available online at http://federalregister.gov/a/2013-12869, and on FDsys.gov BILLING CODE 3510-22-P DEPARTMENT OF COMMERCE
This document is scheduled to be published in the Federal Register on 05/30/2013 and available online at http://federalregister.gov/a/2013-12869, and on FDsys.gov BILLING CODE 3510-22-P DEPARTMENT OF COMMERCE
Brian Cheuvront, Ph.D. SAFMC Deputy Executive Director for Management
 Brian Cheuvront, Ph.D. SAFMC Deputy Executive Director for Management
Fisheries Off West Coast States; Coastal Pelagic Species Fisheries; Annual. AGENCY: National Marine Fisheries Service (NMFS), National Oceanic and
, National Oceanic and") This document is scheduled to be published in the Federal Register on 06/25/2018 and available online at https://federalregister.gov/d/2018-13583, and on FDsys.gov BILLING CODE: 3510-22-P DEPARTMENT OF
This document is scheduled to be published in the Federal Register on 06/25/2018 and available online at https://federalregister.gov/d/2018-13583, and on FDsys.gov BILLING CODE: 3510-22-P DEPARTMENT OF
Challenges in communicating uncertainty of production and timing forecasts to salmon fishery managers and the public
 Challenges in communicating uncertainty of production and timing forecasts to salmon fishery managers and the public Alaska Fisheries Science Center Joseph A. Orsi and Phillip R. Mundy Auke Bay Laboratories
Presented to the ASMFC Horseshoe Crab Management Board October 17, 2017
 Horseshoe Crab Technical Committee Report Bait Use Surveys of the American Eel and Channeled Whelk Fisheries Presented to the ASMFC Horseshoe Crab Management Board October 17, 2017 Survey Goals Discover
Leif Nøttestad, Øyvind Tangen and Svein Sundby
 Possible mechanisms and explanations for the drastic decline and disappearance of Atlantic bluefin tuna in the Norwegian fisheries since the early 1960s: What went wrong and what can we do? Leif Nøttestad,
Kenai River Sockeye Escapement Goals. United Cook Inlet Drift Association
 Kenai River Sockeye Escapement Goals United Cook Inlet Drift Association 2014 Evaluating Sockeye Escapement Goals in the Kenai River Utilizing Brood Tables and Markov Tables This presentation pertains
Atlantic States Marine Fisheries Commission
 Atlantic States Marine Fisheries Commission Joint Meeting of the Summer Flounder, Scup, and Black Sea Bass and Bluefish Management Boards Draft Agenda July 6, 2016 10:00 a.m. 12:30 p.m. The times listed
Winter Steelhead Redd to Fish conversions, Spawning Ground Survey Data
 Winter Steelhead Redd to Fish conversions, Spawning Ground Survey Data Oregon Department of Fish and Wildlife (ODFW); Corvallis Research Office Oregon Adult Salmonid Inventory and Sampling Project (June
Rice Yield And Dangue Haemorrhagic Fever(DHF) Condition depend upon Climate Data
 Condition depend upon Climate Data") Rice Yield And Dangue Haemorrhagic Fever(DHF) Condition depend upon Climate Data Dr Lai Lai Aung, Assistant Director( Met Service) Dr Khaing Khaing Soe Assistant Director(Public Health) Dr Thin Nwe htwe
Rice Yield And Dangue Haemorrhagic Fever(DHF) Condition depend upon Climate Data Dr Lai Lai Aung, Assistant Director( Met Service) Dr Khaing Khaing Soe Assistant Director(Public Health) Dr Thin Nwe htwe
Recommendations for Pennsylvania's Deer Management Program and The 2010 Deer Hunting Season
 Recommendations for Pennsylvania's Deer Management Program and The 2010 Deer Hunting Season March 7, 2010 Prepared for The Pennsylvania Game Commission Board of Commissioners By John Eveland RECOMMENDATIONS
ISDS 4141 Sample Data Mining Work. Tool Used: SAS Enterprise Guide
 ISDS 4141 Sample Data Mining Work Taylor C. Veillon Tool Used: SAS Enterprise Guide You may have seen the movie, Moneyball, about the Oakland A s baseball team and general manager, Billy Beane, who focused
Using Population Models to Evaluate Management Alternatives for Gulf-strain Striped Bass
 Using Population Models to Evaluate Management Alternatives for Gulf-strain Striped Bass Alex Aspinwall Alabama Cooperative Fisheries and Wildlife Research Unit Elise Irwin U.S Geological Survey Introduction
White Paper on the Potential 2018 Experimental Wave 1 Recreational Black Sea Bass Fishery
 White Paper on the Potential 2018 Experimental Wave 1 Recreational Black Sea Bass Fishery May 2017 Brandon Muffley, Fishery Management Specialist Mid-Atlantic Fishery Management Council Background Historically,
Assessment Summary Report Gulf of Mexico Red Snapper SEDAR 7
 Assessment Summary Report Gulf of Mexico Red Snapper SEDAR 7 Stock Distribution: Red snapper are found throughout the Gulf of Mexico, the Caribbean Sea, and from the U.S. Atlantic Coast to northern South
Student Population Projections By Residence. School Year 2016/2017 Report Projections 2017/ /27. Prepared by:
 Student Population Projections By Residence School Year 2016/2017 Report Projections 2017/18 2026/27 Prepared by: Revised October 31, 2016 Los Gatos Union School District TABLE OF CONTENTS Introduction
Pitching Performance and Age
 Pitching Performance and Age Jaime Craig, Avery Heilbron, Kasey Kirschner, Luke Rector and Will Kunin Introduction April 13, 2016 Many of the oldest and most long- term players of the game are pitchers.
ASTERISK OR EXCLAMATION POINT?: Power Hitting in Major League Baseball from 1950 Through the Steroid Era. Gary Evans Stat 201B Winter, 2010
 ASTERISK OR EXCLAMATION POINT?: Power Hitting in Major League Baseball from 1950 Through the Steroid Era by Gary Evans Stat 201B Winter, 2010 Introduction: After a playerʼs strike in 1994 which resulted
Traffic Impact Study. Westlake Elementary School Westlake, Ohio. TMS Engineers, Inc. June 5, 2017
 TMS Engineers, Inc. Traffic Impact Study Westlake Elementary School Westlake, Ohio June 5, 2017 Prepared for: Westlake City Schools - Board of Education 27200 Hilliard Boulevard Westlake, OH 44145 TRAFFIC
OR DUNGENESS CRAB FISHERY:
 E 55 OR DUNGENESS CRAB FISHERY: an economic analysis of productivity and profitability David S. Liao Joe B. Stevens OREGON STATE UNIVERSITY SEA GRANT COLLEGE PROGRAM Publication no. ORESU-T-75-005 AGRICULTURAL
Minimal influence of wind and tidal height on underwater noise in Haro Strait
 Minimal influence of wind and tidal height on underwater noise in Haro Strait Introduction Scott Veirs, Beam Reach Val Veirs, Colorado College December 2, 2007 Assessing the effect of wind and currents
Gulf of Maine Research Institute Responsibly Harvested Seafood from the Gulf of Maine Region
 Gulf of Maine Research Institute Responsibly Harvested Seafood from the Gulf of Maine Region Report on Gulf of Maine and Georges Bank American Lobster The fishery is managed by a competent authority and
Novel empirical correlations for estimation of bubble point pressure, saturated viscosity and gas solubility of crude oils
 86 Pet.Sci.(29)6:86-9 DOI 1.17/s12182-9-16-x Novel empirical correlations for estimation of bubble point pressure, saturated viscosity and gas solubility of crude oils Ehsan Khamehchi 1, Fariborz Rashidi
Marine Renewables Industry Association. Marine Renewables Industry: Requirements for Oceanographic Measurements, Data Processing and Modelling
 Marine Renewables Industry Association Marine Renewables Industry: Requirements for Oceanographic Measurements, Data Processing and Modelling October 2009 Table of Contents 1. Introduction... 1 2. Measurements
Fishing mortality in relation to highest yield. Fishing mortality in relation to agreed target
 3.4 Stock summaries 3.4. Northeast Arctic cod State of the stock Spawning biomass in relation to precautionary limits Full reproductive capacity Fishing mortality in relation to precautionary limits/management
Charter Boat Fishing in Lake Michigan: 2017 Illinois Reported Harvest
 Illinois Department of Natural Resources Division of Fisheries Charter Boat Fishing in Lake Michigan: 2017 Illinois Reported Harvest Steven R. Robillard Illinois Department of Natural Resources Lake Michigan
A Combined Recruitment Index for Demersal Juvenile Cod in NAFO Divisions 3K and 3L
 NAFO Sci. Coun. Studies, 29: 23 29 A Combined Recruitment Index for Demersal Juvenile Cod in NAFO Divisions 3K and 3L David C. Schneider Ocean Sciences Centre, Memorial University St. John's, Newfoundland,
Failure Data Analysis for Aircraft Maintenance Planning
 Failure Data Analysis for Aircraft Maintenance Planning M. Tozan, A. Z. Al-Garni, A. M. Al-Garni, and A. Jamal Aerospace Engineering Department King Fahd University of Petroleum and Minerals Abstract This
August 3, Prepared by Rob Cheshire 1 & Joe O Hop 2. Center for Coastal Fisheries and Habitat Research Beaufort, NC
 SEDAR 19-DW05 Evaluation of the 1960, 1965, and 1970 U.S. Fish and Wildlife Service salt-water angling survey data for use in the stock assessment of red grouper (Southeast US Atlantic) and black grouper
SCIENTIFIC COUNCIL MEETING - JUNE Yellowtail flounder in Divisions 3LNO - an assessment update
 NOT TO BE CITED WITHOUT PRIOR REFERENCE TO THE AUTHOR(S) Northwest Atlantic Fisheries Organization Seria No,N835 NAFO SCR Doc. 8/VI/9 SCIENTIFIC COUNCIL MEETING - JUNE 198 Yellowtail flounder in Divisions
Unit 4: Inference for numerical variables Lecture 3: ANOVA
 Unit 4: Inference for numerical variables Lecture 3: ANOVA Statistics 101 Thomas Leininger June 10, 2013 Announcements Announcements Proposals due tomorrow. Will be returned to you by Wednesday. You MUST
Green crabs: invaders in the Great Marsh Featured scientist: Alyssa Novak from the Center for Coastal Studies/Boston University
 Name Green crabs: invaders in the Great Marsh Featured scientist: Alyssa Novak from the Center for Coastal Studies/Boston University Research Background: Marshes are areas along the coast that flood with
Summary of Preliminary Results of Transboundary Diagnostic Analysis, 2018
 1 Western And Central Pacific Oceanic Fisheries Management Summary of Preliminary Results of Transboundary Diagnostic Analysis, 2018 Fact sheet for the Oceanic Fisheries Management Project (OFMP2). OFMP2
Charter Boat Fishing in Lake Michigan: 2015 Illinois Reported Harvest
 Illinois Department of Natural Resources Division of Fisheries Charter Boat Fishing in Lake Michigan: 2015 Illinois Reported Harvest Steven R. Robillard Illinois Department of Natural Resources Lake Michigan
TABLE OF CONTENTS CHAPTER TITLE PAGE LIST OF TABLES LIST OF FIGURES LIST OF ABBREVIATIONS LIST OF SYMBOLS LIST OF APPENDICES
 vii TABLE OF CONTENTS CHAPTER TITLE PAGE AUTHOR S DECLARATION DEDICATION ACKNOWLEDGEMENTS ABSTRACT ABSTRAK TABLE OF CONTENTS LIST OF TABLES LIST OF FIGURES LIST OF ABBREVIATIONS LIST OF SYMBOLS LIST OF
Survey of New Jersey s Recreational Blue Crab Fishery in Delaware Bay
 Survey of New Jersey s Recreational Blue Crab Fishery in Delaware Bay By Brandon W. Muffley* New Jersey Division of Fish & Wildlife Marine Fisheries Administration & Lynette Lurig New Jersey Division of
Youngs Creek Hydroelectric Project (FERC No. P 10359)
") Youngs Creek Hydroelectric Project (FERC No. P 10359) Resident Trout Monitoring Plan Annual Report 2010 Survey and Results of Pre Project Monitoring Prepared by: September 2010 Overview The Public Utility
Youngs Creek Hydroelectric Project (FERC No. P 10359) Resident Trout Monitoring Plan Annual Report 2010 Survey and Results of Pre Project Monitoring Prepared by: September 2010 Overview The Public Utility
Science Skills Station
 Science Skills Station Objective 1. Interpret and analyze data so to determine the relationship between resource availability and carrying capacity of a population. 2. Identify biotic and abiotic factors
Official Journal of the European Union L 248/17
 22.9.2007 Official Journal of the European Union L 248/17 COUNCIL REGULATION (EC) No 1100/2007 of 18 September 2007 establishing measures for the recovery of the stock of European eel THE COUNCIL OF THE
Fisheries Off West Coast States; Coastal Pelagic Species Fisheries; Annual. AGENCY: National Marine Fisheries Service (NMFS), National Oceanic and
, National Oceanic and") This document is scheduled to be published in the Federal Register on 06/30/2017 and available online at https://federalregister.gov/d/2017-13685, and on FDsys.gov Billing Code 3510-22-P DEPARTMENT OF
This document is scheduled to be published in the Federal Register on 06/30/2017 and available online at https://federalregister.gov/d/2017-13685, and on FDsys.gov Billing Code 3510-22-P DEPARTMENT OF
Spillover Effects of Marine Environmental Regulation for Sea Turtle Protection
 Spillover Effects of Marine Environmental Regulation for Sea Turtle Protection Hing Ling Chan & Minling Pan NOAA Fisheries, Pacific Islands Fisheries Science Center U.S.A. 2015.10.23 PICES 2015, Qingdao,
2006 Economic Assessment of the Connecticut Commercial Lobster Industry Robert Pomeroy, Nancy Balcom and Emily Keiley
 2006 Economic Assessment of the Connecticut Commercial Lobster Industry Robert Pomeroy, Nancy Balcom and Emily Keiley Technical Report CTSG-10-01 Connecticut Sea Grant College Program University of Connecticut
ICES advises that when the MSY approach is applied, catches in 2019 should be no more than tonnes.
 Advice on fishing opportunities, catch, and effort Celtic Seas, Greater North Sea, and Oceanic Northeast Atlantic ecoregions Published 29 June 2018 Version 2: 4 September 2018 https://doi.org/10.17895/ices.pub.4487
ATLANTIC SALMON NEWFOUNDLAND AND LABRADOR, SALMON FISHING AREAS 1-14B. The Fisheries. Newfoundland Region Stock Status Report D2-01
 Fisheries Pêches and Oceans et Océans DFO Science Newfoundland Region Stock Status Report D2-01 ATLANTIC SALMON NEWFOUNDLAND AND LABRADOR, SALMON FISHING AREAS 1-14B Background There are 15 Atlantic salmon
Legendre et al Appendices and Supplements, p. 1
 Legendre et al. 2010 Appendices and Supplements, p. 1 Appendices and Supplement to: Legendre, P., M. De Cáceres, and D. Borcard. 2010. Community surveys through space and time: testing the space-time interaction
History and Status of the Oregon Dungeness Crab Fishery
 History and Status of the Oregon Dungeness Crab Fishery History and Status of the Oregon Dungeness Crab Fishery by Darrell Demory Oregon Department of Fish and Wildlife Oregon Department of Fish and Wildlife
Chesapeake Bay Jurisdictions White Paper on Draft Addendum IV for the Striped Bass Fishery Management Plan
 Chesapeake Bay Jurisdictions White Paper on Draft Addendum IV for the Striped Bass Fishery Management Plan Maryland Department of Natural Resources, District of Columbia s Fisheries and Wildlife Division,
Conservation Limits and Management Targets
 Conservation Limits and Management Targets Setting conservation limits The use of conservation limits (CLs) in England and Wales (E&W) has developed in line with the requirement of ICES and NASCO to set
Atlantic States Marine Fisheries Commission
 To: Atlantic States Marine Fisheries Commission American Eel Management Board From: American Eel Technical Committee RE: 15 N. Highland Street Suite A-N Arlington, VA 2221 73.842.74 73.842.741 (fax) www.asmfc.org
Black Sea Bass Encounter
 Black Sea Bass Encounter Below is an adaptation of the Shark Encounter (Lawrence Hall of Science: MARE 2002) lesson plan to be about Black Sea Bass and to incorporate information learned from Dr. Jensen
Applying Hooke s Law to Multiple Bungee Cords. Introduction
 Applying Hooke s Law to Multiple Bungee Cords Introduction Hooke s Law declares that the force exerted on a spring is proportional to the amount of stretch or compression on the spring, is always directed
Annual Pink Shrimp Review
 Annual Pink Shrimp Review Oregon Department of Fish and Wildlife ODFW Marine Region, Marine Science Dr., Bldg. #3, Newport, OR 97365 (503) 867-4741 TO: FROM: OREGON SHRIMP INDUSTRY BOB HANNAH, PINK SHRIMP
Search for the missing sea otters
 Search for the missing sea otters Objectives: Based on a real study of sea otter declines Apply your knowledge of basic concepts of population and community ecology Interpret data from graphs and tables
A Model for Tuna-Fishery Policy Analysis: Combining System Dynamics and Game Theory Approach
 A Model for Tuna-Fishery Policy Analysis: Combining System Dynamics and Game Theory Approach E. Widodo, Budianto Department of Industrial Engineering, Institut Teknologi Sepuluh Nopember, ITS, Surabaya,
12. School travel Introduction. Part III Chapter 12. School travel
 12. School travel 12.1 Introduction This chapter presents the evidence on changes in travel patterns for the journey to school in the three towns over the period of the Sustainable Travel Town project.
2000 REVIEW OF THE ATLANTIC STATES MARINE FISHERIES COMMISSION FISHERY MANAGEMENT PLAN FOR BLUEFISH (Pomatomus saltatrix)
") 2000 REVIEW OF THE ATLANTIC STATES MARINE FISHERIES COMMISSION FISHERY MANAGEMENT PLAN FOR BLUEFISH (Pomatomus saltatrix) Prepared by: Robert Beal (ASMFC) Bluefish Plan Review Team Elliot Atstupenas (USFWS)
2000 REVIEW OF THE ATLANTIC STATES MARINE FISHERIES COMMISSION FISHERY MANAGEMENT PLAN FOR BLUEFISH (Pomatomus saltatrix) Prepared by: Robert Beal (ASMFC) Bluefish Plan Review Team Elliot Atstupenas (USFWS)
Surf Clams: Latitude & Growth
 Surf Clams: Latitude & Growth East Coast MARE Materials For the leader: Projector Whiteboard to project data graph onto For the activity: Copy of data table Copy of map Computer program to graph in or
THE INTEGRATION OF THE SEA BREAM AND SEA BASS MARKET: EVIDENCE FROM GREECE AND SPAIN
 THE INTEGRATION OF THE SEA BREAM AND SEA BASS MARKET: EVIDENCE FROM GREECE AND SPAIN Lamprakis Avdelas, Managing Authority for the Operational programme for Fisheries, lamprakisa@in.gr Jordi Guillen, University
Red Snapper distribution on natural habitats and artificial structures in the northern Gulf of Mexico
 Red Snapper distribution on natural habitats and artificial structures in the northern Gulf of Mexico SEFSC Mandy Karnauskas and John Walter, NMFS SEFSC Miami Matthew Campbell and Adam Pollack, NMFS SEFSC
4.9.5 Norwegian spring-spawning herring
 4.9.5 Norwegian springspawning herring State of the stock Spawning biomass in relation to precautionary limits Acceptable Fishing mortality in relation to precautionary limits Acceptable Fishing mortality
Lesson 14: Modeling Relationships with a Line
 Exploratory Activity: Line of Best Fit Revisited 1. Use the link http://illuminations.nctm.org/activity.aspx?id=4186 to explore how the line of best fit changes depending on your data set. A. Enter any