SC WG ON THE ECOSYSTEM APPROACH TO FISHERIES MANAGEMENT DECEMBER 2011
|
|
|
- Lindsay Jackson
- 6 years ago
- Views:
Transcription
1 NOT TO BE CITED WITHOUT PRIOR REFERENCE TO THE AUTHOR(S) Northwest Atlantic Fisheries Organization Serial No. N6005 NAFO SCR Doc. 11/75 SC WG ON THE ECOSYSTEM APPROACH TO FISHERIES MANAGEMENT DECEMBER 2011 Development of Encounter Protocols and Assessment of Significant Adverse Impact by Bottom Trawling for Sponge Grounds and Sea Pen Fields in the NAFO Regulatory Area E. Kenchington 1, F. J. Murillo 2, A. Cogswell 1, C. Lirette 1 1 Department of Fisheries and Oceans, Dartmouth, Nova Scotia, Canada 2 Instituto Español de Oceanografía, Vigo, Spain Abstract We provide a scientific basis for recommending commercial encounter protocols for sponges and sea pens in the NRA. For each we provide an assessment of significant adverse impact of bottom trawling taking into account published and new data on gear efficiency and selectivity, incidental mortality and recoverability. The proportion of VMS trawls in 2010 that would be impacted by lowering the current thresholds is estimated following previously established methods. Approaches to move-on rules are also considered. Table of Contents INTRODUCTION... 2 SPONGE GROUNDS... 4 GIS-SIMULATION OF COMMERCIAL BY-CATCH (ENCOUNTER) THRESHOLDS INDICATIVE OF SPONGE GROUNDS IN THE NAFO REGULATORY AREA (NRA)... 4 ANTICIPATED IMPACT ON THE COMMERCIAL FISHERY OF USING 300 KG AND 40 KG ENCOUNTER THRESHOLDS ASSESSMENT OF SIGNIFICANT ADVERSE IMPACT OF BOTTOM-CONTACT GEAR ON SPONGES Gear Efficiency and Selectivity on Sponges Incidental Mortality Recoverability MOVE-ON RULES FOR SPONGES CONCLUSIONS SEA PEN FIELDS GIS-SIMULATION OF COMMERCIAL BY-CATCH (ENCOUNTER) THRESHOLDS INDICATIVE OF SEA PEN FIELDS IN THE NAFO REGULATORY AREA (NRA) ANTICIPATED IMPACT ON THE COMMERCIAL FISHERY OF USING A 7 KG ENCOUNTER THRESHOLD ASSESSMENT OF SIGNIFICANT ADVERSE IMPACT (SAI) OF BOTTOM-CONTACT GEAR ON SEA PENS Gear Efficiency and Selectivity on Sea Pens Incidental Mortality Recoverability MOVE-ON RULES FOR SEA PENS CONCLUSIONS REFERENCES... 48
2 2 Introduction Sea pen fields, large and small gorgonian coral stands and sponge grounds are important structure-forming taxa indicative of vulnerable marine ecosystems (VMEs) in the NAFO regulatory area (NRA) (Fuller et al. 2008). Significant concentrations of these have been identified and subsequently protected through area closures in accordance with paragraph 66 of the FAO International Guidelines for the Management of Deep-Sea Fisheries in the High Seas (FAO 2009). However significant concentrations of these taxa remain unprotected within the fishing footprint of the NRA and in deep water along the continental slopes outside of the fishing footprint. The United Nations Sustainable Fisheries Resolutions (61/105, 64/72) state that RFMOs should have an appropriate protocol in place for how fishing vessels should respond to encounters with VMEs in the course of fishing operations (FAO 2009). This involves defining what constitutes evidence of an encounter with a vulnerable marine ecosystem (UNGA 64/72, para 119 (c)). Specifically, the guidance is: 67. States and RFMO/As should have an appropriate protocol identified in advance for how fishing vessels in DSFs should respond to encounters in the course of fishing operations with a VME, including defining what constitutes evidence of an encounter. Such protocol should ensure that States require vessels flying their flag to cease DSFs fishing activities at the site and report the encounter, including the location and any available information on the type of ecosystem encountered, to the relevant RFMO/A and flag State. 68. In designing such protocols and defining what constitutes an encounter, States and RFMO/As should take into account best available information from detailed seabed surveys and mapping, other relevant information available for the site or area, and other conservation and management measures that have been adopted to protect VMEs pursuant to paragraphs 70 and 71. (FAO 2009) In 2010 NAFO set the encounter thresholds for all coral and for sponge as: For both existing and new fishing areas, an encounter with primary VME indicator species is defined as a catch per set (e.g. trawl tow, longline set, or gillnet set) of more than 60 kg of live coral and/or 800 kg of live sponge. These thresholds are set on a provisional basis and may be adjusted as experience is gained in the application of this measure (NAFO 2011a). At the 2011 Annual General Meeting, NAFO voted to reduce the sponge encounter threshold to 400 kg outside of the fishing footprint, and to 600 kg inside of the fishing footprint but outside of the closed areas (NAFO 2012). This was done in a precautionary framework without specific scientific support for the threshold levels. FC further requested of the Scientific Council: 17. Fisheries Commission requests the Scientific Council to make recommendations for encounter thresholds and move on rules for groups of VME indicators including sea pens, small gorgonian corals, large gorgonian corals, sponge grounds and any other VME indicator species that meet the FAO Guidelines for VME and SAI. Consider thresholds for 1) inside the fishing footprint and outside of the closed areas and 2) outside the fishing footprint in the NRA, and 3) for the exploratory fishing area of seamounts if applicable. This report is in response to this request of the Fisheries Commission for advice. The VME indicator taxa named above are all highly aggregating. This property was exploited in the quantitative analyses of Kenchington et al. (2010a) and Murillo et al. (2010) who were able to identify a research vessel catch level (referred to as a threshold) which corresponded to a dense aggregation of sponges and sea pens respectively. In principle, the same approach could be used to identify when a commercial vessel has encountered such an aggregation. However, progress in establishing commercial by-catch values which would constitute evidence of an encounter has been hampered by the lack of commercial by-catch data. This has been discussed previously and compensated for by the development of a GIS-based simulation model (Kenchington et al. 2010a,b, Cogswell et al. 2010, Cogswell et al. 2011) which estimates commercial catches under various management scenarios. The model constructs a biomass layer derived from the research vessel catches; uses simulated trawl start and end positions and/or VMS data (Cogswell et al. 2011) to reflect commercial fishing; and calculates the biomass removed from under each fishing line to estimate commercial by-catch.
3 3 The model was first applied in 2010 to the sponge grounds in the NRA, using simulated trawl lines with effortweighted start and end positions (NAFO 2010). The simulated trawls were not allowed to cross into the closed areas and were constrained to within the fishing footprint. That model application provided a fishery assessment framework for evaluating where large catches could still be obtained outside of the closed areas and what proportion of the catches would be affected by altering by-catch thresholds. For example, advice was given in this context: Reducing the encounter threshold for sponges from 800 kg to 50 kg would only affect 5.5% of trawls (94.5% of fishing would be unaffected) and those encounters could be avoided as catches > 50 kg are concentrated in just two areas in Flemish Pass outside of the closed areas. Based on that analysis the WGEAFM recommended that the encounter threshold for sponges fished with bottom trawl gear be reduced from 800 kg to between 30 and 50 kg per tow. However, the Scientific Council (SC) was reluctant to endorse the WGEAFM report (NAFO 2011b) and raised a number of issues regarding this approach which we have addressed here and in Cogswell et al. (2011). SC felt that the straight line, effort-weighted simulated tows used in the model were not characteristic of real fishing practices and that using the simulated lines would produce unrealistic results. This was a known issue (Kenchington et al. 2010a) however at the time there was no way to test this effect. However at the request of the FC, NAFO provided us with VMS data from 2010 (Cogswell et al. 2011). Cogswell et al. (2011) compared and contrasted model outputs using the two measures of fishing effort and show that in fact the simulated trawls produced very similar results to the VMS data over most of the by-catch range, with the former over-representing the very small catches and the latter the very large ones. SC further noted that the model did not link specific thresholds to biological or ecological criteria (NAFO 2011b). This was identified also in the WGEAFM report (NAFO 2010). The model as presented was to guide managers towards precautionary decision making and to allow them to assess the potential impact of different threshold choices on the fishing industry. Lastly, SC disagreed with the application of the model in that the model was applied to an area outside of the closed areas to protect sponges as well as within the fishing footprint. The consequences of this are that the catch biomass range is reduced and the highest catches may no longer be indicative of sponge grounds. This is further exacerbated by fishermen avoiding sponge grounds resulting in effort-weighted catches further narrowing the catch biomass range. However, as we now have confidence in the use of the simulated straight-lines used to mimic fishing effort, the model outputs can be considered valid should managers wish to evaluate fishing measures in that context. As a result of these issues, we have taken a different approach in our application of the model to address the concerns of the SC. In order to provide an ecological relevance to the threshold level we follow the same approach that we used to detect the significant concentrations or aggregations of sponges and sea pens that led to the implementation of the closed areas (Kenchington et al. 2010a,b, Cogswell et al. 2010, Murillo et al. 2010). The threshold for the identification of sponge grounds/sea pen fields was estimated by recording when the area occupied by catches greater than or equal to a threshold value, suddenly increased. This identifies the transition from the dense aggregations of these animals to the widespread occurrence of isolated individuals or small aggregations. Instead of using research vessel tows, we imposed 2000 random trawl start and end positions of commercial trawl length (13.8 nm see Cogswell et al. 2011) over the sponge/sea pen biomass layer derived from research vessel survey catch (Cogswell et al. 2011). This provides the commercial tow equivalent of the research vessel threshold catches used to identify sponge grounds and sea pen fields. Randomization of the tows (as opposed to positioning using weightings for fishing effort) is necessary in order to produce tows that fall cross the sponge grounds and sea pen fields which are to some extent avoided by the fleet. The threshold value would apply anywhere a commercial vessel encountered such habitats with similar species composition, both 1) inside the fishing footprint and outside of the closed areas and 2) outside the fishing footprint in the NRA, where these habitats occur. Having used the model to identify a commercial encounter threshold indicative of the VME feature we then apply it as we did in the 2010 WGEAFM report (NAFO 2010) to assess the impact of that threshold on the 2010 fishing activities using the 2010 VMS data provided by NAFO. Thus far we have not addressed significant adverse impacts (SAI) of fishing on the aggregations. The model outputs themselves are not influenced by gear selectivity or gear efficiency (catchability (q)) and SAI effects have no impact on the identification of aggregations using the area-occupied approach described above. This is because applying q across all areas would only proportionally change the catch values used to identify the significant aggregations. However, in order to assess immediate and cumulative impacts of encounters, gear efficiency and incidental
4 4 mortality become important factors which influence recovery. We review the literature for these issues and present new information from the NEREIDA research programme for the species in the NAFO regulatory area. NAFO uses move-on rules to mitigate encounters with small fish and bycatch of commercial species. When considering encounter thresholds for coral and sponge they also applied a move-on rule: The vessel master shall cease fishing and move away at least 2 nautical miles from the endpoint of the tow/set in the direction least likely to result in further encounters. The captain shall use his best judgment based on all available sources of information, with associated procedural directions (NAFO 2012). As for the encounter thresholds, the move away distance has not been scientifically determined. The information on sponge biomass distribution used in our model can be used to inform captains on the direction least likely to result in further encounters. We also explore various options for move-away rules which would support the conservation objective of preventing further damage to the VME. Here we present data for sponge grounds and sea pen fields that we feel provide a first scientific basis for commercial encounter protocols and move-on rules for those taxa 1) inside the fishing footprint and outside of the closed areas and 2) outside the fishing footprint in the NRA. In doing so we discuss significant adverse impacts of bottom-contact gear on these taxa and other issues related to our results. Sponge Grounds GIS-Simulation of Commercial By-catch (Encounter) Thresholds Indicative of Sponge Grounds in the NAFO Regulatory Area (NRA) Both the research vessel survey data used to estimate sponge biomass and fishing effort (by definition) fall within the fishing footprint. Consequently, we must make assumptions about sponge grounds outside of the fishing footprint in exploratory fishing areas on the slopes of the Flemish Cap and Grand Banks (seamounts are dealt with elsewhere). The assumption made is that the sponge grounds are the same or similar to the Geodia-dominated sponge grounds found in the fishing footprint and along the Canadian slope (Kenchington et al. 2010b, Fuller 2011, Murillo et al. 2012). These include aggregations of other large structure forming sponge species (ICES 2009) including glass sponges such as Asconema spp. Preliminary viewing of NEREIDA in situ imagery suggests that there may be such sponge grounds outside of the fished area, and we know that there are some unprotected sponge grounds within the NRA. This simulation uses 2000 randomly placed and oriented straight line simulation trawls of median commercial tow length (13.8 nm) (see Cogswell et al. 2011). All lines generated by this method have a random start location and a randomly chosen heading between 0 and 360 degrees, at 1 degree intervals. As well, lines were not restricted from crossing into closed areas so that the data could be collected on the appropriate thresholds for commercial vessels that encounter the sponge grounds, most of which have been protected by the closed areas (see explanation above). The extent of our analysis is limited to the footprint of the Spanish/EU research vessel 5 x 5 km cell sponge biomass surface (Cogswell et al. 2011) (Figure 1) which is used to estimate the commercial catches. We use only the Spanish/EU research vessel data for estimating the sponge biomass layer (Cogswell et al. 2011). This is because the Canadian research vessel data is restricted spatially and is derived from tows of a shorter duration than the Spanish/EU vessels (15 min vs. 30 min.). By using only the Spanish/EU data we avoid worsening spatial bias through scaling the Canadian data in order to standardize it (Cogswell et al. 2011). The simulated commercial sponge catch was calculated from the 5 x 5 km gridded Spanish/EU research vessel survey sponge biomass layer and then used to create a smoothed sponge density layer (Figure 2) interpolated using the kernel density function with a search radius of 25 km (Kenchington et al. 2010a,b). This smoothing is necessary so that equal density polygons can be drawn around the area occupied by successive weight thresholds (following Kenchington et al. (2010 a,b) and Cogswell et al. (2010)). This density layer identified hot spots in locations similar to those in the research vessel sponge density layer used to identify the closed areas (Figure 2 compares the kernel density outputs from both the simulated trawl catch and research vessel by-catch). The major difference is in the relative densities and spread of the locations (due largely to the length of simulated commercial trawls (25.6
5 5 km) compared to the research vessel trawl length (2.8 km)) and particularly so in the area south of Sackville Spur on Flemish Cap. Polygons of equal density were drawn around successive catch weights of sponge and the area occupied by each polygon was calculated. The threshold for the identification of sponge grounds was estimated by recording when the area occupied by catches greater to or equal to a threshold value, suddenly increased. This identified the transition from the dense aggregations of these animals to the widespread occurrence of isolated individuals or small aggregations. Figure 3 illustrates the relative change in area occupied by successive density polygons for 42 catch weight thresholds between 0.01 and 35,000 kg. Initially the area increases dramatically as the number of data points are small and the core of the sponge grounds are not yet established (Kenchington et al. 2010a). This initial increase in area is seen in Figures 3a and b, where the relative changes in area occupied and the actual area occupied by catches are illustrated for successive weight thresholds. The relative increase in area (Figure 3a) has its first threshold at catches greater than 10,000 kg where there is a relative increase of 1.5 times the area (the increase in area going from 35,000 to 15,000, and 15,000 to 10,000 kg are not shown but were even larger at 154 and 3 times respectively). Beyond this, the next largest change in area between successive catch thresholds occurred between catches of 3,000 and 2,000 kg (2.2 x) (Figures 3a and b). Catches of this size reflect sponge grounds dominated by the massive ball sponges of the genus Geodia. The next largest change in area occurs between 300 and 200 kg. Catches of 300 kg or more occupy an area of 24,914 km 2 while catches of 200 kg or more occupy an area 1.5 times larger (36,548 km 2 ). The locations of the simulated commercial catches greater than or equal to 300 kg are illustrated in Figure 4 in relation to the closed areas. These catches correspond to the VME sponge grounds for both Geodia- and Asconema- dominated habitats. We also examined the next threshold which is between 200 kg and 100 kg (1.4 times change in area), however this is established by only 5 points (Figure 5) which is not considered to be a robust result (Kenchington et al. 2010a). Following the procedures used previously to identify significant concentrations of sponge from research vessel trawl survey catches, the threshold of 300 kg/13.8 nm trawl taken by a commercial vessel would indicate a significant concentration of sponge and could be used as the threshold for identifying an encounter by commercial vessels. Figure 6 illustrates a typical Geodia-dominated sponge catch near this 300 kg threshold limit.
6 Figure 1. Simulated trawls (n=2000) with random start locations and orientation. Each trawl is of standard length (13.8 nm) and falls within the 5 x 5 km cell sponge biomass surface for the NRA. 6
 in the NRA estimated from simulated commercial trawls with random start locations and orientation (left) and from Spanish/EU")
7 7 Figure 2. Sponge biomass (displayed using a geometric distribution in kg/km 2 ) in the NRA estimated from simulated commercial trawls with random start locations and orientation (left) and from Spanish/EU research vessel catches (right). Note maximum density values cannot be compared between the two methods. We also examined the 40 kg sponge catch threshold identified in the analysis (Figures 3a, b). The area occupied by catches 40 kg is 63,155 km 2 while catches 30 kg occur in an area covering 80,639 km 2 (Figure 3b). This is an increase of 1.3 times. The areas identified using this threshold extend over much of the Flemish Cap (Figure 7) in comparison with the area occupied by catches 300 kg (Figure 8) and the catch composition can also differ from that of the areas occupied by catches 300 kg. Those catches are composed primarily of the Geodia-dominated sponge grounds which occur from depths of ~ 800 to 1500 m (Murillo et al. 2012). A lower threshold of 40 kg may capture non-vme sponge taxa. For example in one research vessel trawl catch of ~70 kg of sponge from the SE Grand Banks taken in shallower water the sponges are represented by the families Halichondriidae and Myxillidae (Figure 9) which are not considered to be VME indicators (ICES 2009). Conversely, in some situations the lower 40 kg threshold could be dominated by other structure-forming but lighter weight VME taxa such as Asconema spp. This is illustrated by the 63 kg catch from the NRA that is dominated by this species (Figure 10). The glass sponge Asconema spp. (Class Hexactinellida) is a lighter sponge than Geodia and similar genera, and it is recognized as a structure-forming VME indicator. The highest concentrations of this genus are captured with the 300 kg threshold (2 points in the north of Flemish Cap at about 600 m depth) but the 40 kg threshold would be more conservative for these and similar species (e.g., Thenea spp., Mycale spp., Iophon sp.) that can be abundant at lower weight thresholds (Figure 11). However, there is insufficient data to develop a threshold by sponge species or family which might be lower for these lighter weight VME sponges.
8 Relative Change in Area Modelled Commercial Trawl Sponge By-Catch Thresholds (kg/13.8 nm) Figure 3a. Relative change in area occupied between successive catch thresholds from 10,000 kg to 0.01 kg. Dark blue bars correspond to the core of the Geodia-dominated sponge grounds. Light blue bars correspond to the VME sponge grounds for both Geodia- and Asconema- dominated habitats. The red bars indicate the levels where the greatest difference in area occupied occurred between successive catch weight values (greater than 1.3 times the area of the previous threshold) Polygon Area (km 2 ) Modelled Commercial Trawl Sponge By-Catch Thresholds (kg/13.8 nm) Figure 3b. Area occupied between successive catch thresholds from 35,000 kg to kg. Dark blue bars correspond to the core of the Geodia-dominated sponge grounds. Light blue bars correspond to the VME sponge grounds for both Geodia- and Asconema- dominated habitats. The red bars indicate the levels where the greatest difference in area occupied occurred between successive catch weight values (greater than 1.3 times the area of the previous threshold).
9 9 A B Figure 4. A) Location of the simulated commercial catches in the NRA 300 kg in relation to the current closed areas in the NRA (blue polygons). B) Polygons depicting the area occupied by simulated commercial catches in the NRA 300 kg (inner green coloured polygon) and 200 kg (outer beige coloured polygon). This represents a 1.5 times increase in area.

10 10 Figure 5. Polygons depicting the area occupied by simulated commercial catches in the NRA 200 kg (inner reddish coloured polygon) and 100 kg (outer beige coloured polygon). This represents a 1.3 times increase in area. Location of the simulated commercial catches 100 kg are shown in black and 200 kg in red. Note that only a few black points extend the polygon boundaries. Figure 6. Photograph of a catch of 268 kg taken from the Tail of the Grand Banks in 2007 illustrating the numbers of sponge represented by this weight. Most sponges belong to the Geodiidae (Photo courtesy of F. J. Murillo, IEO- Vigo)
11 11 A B Figure 7. A. Location of the simulated commercial catches 40 kg are indicated in relation to the closed areas. B. Polygons depicting the area occupied by catches 40 kg (inner red coloured polygon) and 30 kg (outer beige coloured polygon). Figure 8. Area occupied by simulated commercial catches in the NRA 300 kg (inner green coloured polygon) and 40 kg (outer red coloured polygon). Locations of the simulated commercial catches used to delimit those polygons are indicated. Closed areas in blue are mostly masked by the catch polygons.


12 12 Figure 9. A catch of ~70 kg of sponge taken from the SE Grand Banks in the NRA. This catch was comprised of non-vme sponge taxa from the families Halichondriidae and Myxillidae (photo courtesy of F.J. Murillo, IEO- Vigo). Figure 10. A catch of 63 kg of sponge taken from the NRA. This catch had various sizes of large Stryphnus sp. as well as other sponge fragments and some smaller sponge taxa (photo courtesy of F. J. Murillo, IEO-Vigo).
.")
13 13 Figure 11. A catch of 99 kg of sponge taken from the NRA. This catch had various sizes of Stryphnus sp. as well as other structure forming sponges such as Mycale spp. or Iophon sp. in addition to sponge fragments and some smaller sponge taxa (photo courtesy of F. J. Murillo, IEO-Vigo). Anticipated Impact on the Commercial Fishery of Using 300 kg and 40 kg Encounter Thresholds The simulation model was run using 2000 randomly selected commercial trawls from data falling within the 95% confidence interval of the 2010 VMS data (see Cogswell et al. (2011) for description of all input layers). Fishing in 2010 was restricted to within the fishing footprint and outside of the closed areas. The model utilized the sponge biomass raster with a cell size of 5 x 5 km which is large enough to average approximately three Spanish/EU RV sponge records per cell. Table 1. The number and percent of simulated groundfish trawls catching sponge at various encounter threshold levels. The shaded cells indicate the current sponge encounter threshold inside the fishing footprint (600 kg) as well as the thresholds identified in this analysis (300 kg and 40 kg). Threshold (kg per tow) No. Filtered VMS Trawls % Filtered VMS Trawls Threshold Threshold (kg per tow) No. Filtered VMS Trawls % Filtered VMS Trawls Threshold
14 14 Figure 12. Location (red circles) of commercial trawls (black lines) expected to have caught 300 kg of sponge in 2010 (data from filtered VMS data set detailed in Cogswell et al. 2011). According to this model the current sponge encounter threshold of 600 kg of live sponge from within the fishing footprint would have been encountered only once by commercial trawlers with the 2010 fishing effort distribution (Table 1). Lowering the threshold to 300 kg or 40 kg as identified through our analyses would impact 0.65 and 3.9% of the catches respectively. Catches of 300 kg or greater are expected to come from the two locations illustrated in Figure 12 following the 2010 fishing effort pattern, although there is potential for such catches to come from other areas with a change from the 2010 effort pattern (Figure 5). In particular the area between the closed areas in Flemish Pass and Beothuk Knoll were not fished in 2010 (see Cogswell et al. 2011) and this is one area where such catches could occur. One of the advantages of our model is that it is easy to examine the model outputs to see how the results were obtained. For example, catches 400 kg come entirely from one location illustrated in Figure 13. Inspection of the biomass raster and point data (Figure 13) shows that VMS lines traverse along or near the 1200 m contour and most
 cells that VMS lines travel through are interpolated by focal statistics (Cogswell et al.")
15 15 of the large sponge catches from the Spanish/EU RV survey occur in deep water, very near or in the closed area. Two of the high value biomass (orange) cells that VMS lines travel through are interpolated by focal statistics (Cogswell et al. 2011) and represent areas where there is no data available from Spanish/EU research trawls. It is likely that commercial trawlers are fishing very near the shallow water extent of sponge concentrations. However, without Spanish/EU RV data, the likelihood of an encounter with significant concentrations is difficult to predict. This is not the case for values less than 400 kg where inspection of the trawl tracks suggest that the catches of this level are clearly feasible. Figure 13. Left: Location (red circle) of commercial trawls (black lines) where the modeled results indicate 400 kg of sponge by-catch in 2010 could have been caught. Right: Close up of the location of commercial trawls with a modeled sponge catch 400 kg with the sponge biomass raster and research vessel catches presented. This figure illustrates why the model may have overestimated those catches. Note the 0 or low sponge by-catch points near the trawls and the lack of Spanish/EU point data in high value interpolated biomass cells along the trawl tracks (red circle). Assessment of Significant Adverse Impact of Bottom-Contact Gear on Sponges We examined the potential for significant adverse impact (SAI) on sponges of fishing within the fishing footprint and outside of the closed areas in the NRA by identifying areas where fishing and sponges co-occurred. A vector grid of 12.5 km 2 cells containing the 2010 effort data in hours per grid cell was provided by the NAFO Secretariat. A spatial join tool in ArcGIS was used to add the mean simulated commercial sponge by-catch to each effort cell. A new field was added to the grid attribute table which calculated mean sponge biomass (kg) x effort (hr). This calculation highlights cells where there is a sponge - effort interaction (Figure 14). While most of the fished area shows low to moderate interaction with the sponges there are areas where fishing could be causing SAI. Interpretation of this map requires knowledge of both effort patterns and high density sponge areas as a high interaction value could be achieved through high effort/low sponge or high sponge/low effort when what we are most concerned with is high effort/high sponge. Figure 15 further refines this interaction by first highlighting in red, cells that contain simulated commercial catch values in excess of 300 kg/ 13.8 nm tow (the proposed threshold value), and then by highlighting cells with greater than 40 kg of simulated commercial by-catch. This method clearly

16 16 shows areas with potential for significant adverse impact to sponges by showing where high commercial by-catch is likely. Quantitative assessment of SAI of bottom-contact gear on sponges in the NRA requires information on gear efficiency and selectivity in order to assess the nature of removals. It also requires estimates of indirect mortality caused by the gear and on recovery trajectories. Recovery will be influenced by inherent biological properties of the species such as their ability to regenerate (wound repair) and recruit (clonally and/or sexually), growth rates, and disease resistance as well as community properties such as nearest-neighbor distances, patch size and habitat fragmentation which can be altered by the pattern of removals. Connectivity amongst the sponge grounds will also influence recovery dynamics. At present, modelling approaches which incorporate SAI are unlikely to be realistic given that so many of these parameters are not known for even well-studied species, let alone for poorly-studied temperate sponges. Figure 14. Interaction between fishing activity measured in hrs/km from the 2010 VMS fishing effort data with sponge biomass from the Spanish/EU research vessel surveys. Cell size of the grid is 12.5 km 2. Areas coloured red and yellow highlight areas where fishing could be causing significant adverse impact to sponges.
17 17 Figure 15. The interaction between the 2010 commercial fishing effort and sponge biomass is highlighted with cells with simulated commercial by-catch in excess of 300 kg in red and 40 kg in green. Grey cells represent areas where the simulated commercial by-catch values are less than 40 kg or where there was no effort. These coloured squares are areas where fishing may cause significant adverse impacts to sponge grounds. Gear Efficiency and Selectivity on Sponges Gear efficiency as used by fisheries scientists relates the true population size (biomass and/or abundance) to the capture or fishing mortality expressed as catch per unit effort (CPUE). It is sometimes referred to as catchability and is strongly related to gear selectivity. Different fishing gears have different hardware (e.g., net and mesh size, colour and configuration, rollers, doors) and consequently have different efficiencies and different selectivities. Further, the nets will fish differently under a wide range of operating conditions, such as with different trawl speeds, different tow lengths, different depths or depending on whether they are full of biomass or not. Environmental factors, such as bottom type and sea state, and for mobile species, behavioral factors such as reaction to the gear also influence both gear efficiency and selectivity. Consequently, the catchability coefficient (q) is very difficult to quantify.
18 18 For the assessment of significant adverse impacts of bottom-contact fishing on sponges, some knowledge of both gear selectivity and efficiency is necessary if conclusions are to be drawn from by-catch data (commercial or research vessel). Few studies have examined both gear efficiency and selectivity to sponges. These generally use experimental trawling to record removals and underwater video to record the true population size. Wassenberg et al. (2002) quantified the catch and damage by a light weight McKenna fish trawl on sponges and used a video camera in the trawl net to observe the effects of fishing gear on sponges. This work was done on the northwest shelf of Australia using 30 min trawl tows at depths ranging from 25 to 358 m. They showed differential removal of sponge according to sponge shape and size class, and through literature comparison, with gear type. Approximately 70% of lump sponges (the large massive sponges of their study, e.g., Xestospongia spp.), passed into the net with at least 20% of those broken into pieces. The remaining 30% passed under the net and appeared undamaged. They found that 80% of lump sponges and 100% of branched sponges less than 300 mm, and 68% of lump sponges and 80% of branched sponges between 301 and 500 mm in height, passed under the net equating to gear efficiencies of 0 to 32% for these smaller sizes. Fewer than 3% of the intermediate-sized sponges were broken up as they passed under the net. However, Moran and Stephenson (2000) report much lower gear efficiency on the general effects of a demersal otter trawl on sponges, soft corals and gorgonian corals greater than 20 cm, with less than 1% of benthos retained by the gear. Therefore it would appear that gear efficiencies may be anywhere from 1 to 70% for large sponges depending upon their shape. Capture mortality of sponges is thought to be high. Sponges hauled on deck, even if they appear undamaged, will be drained of water and are unlikely to recover if they are thrown back into the sea as air will clog their aquiferous system which is essential for feeding (ICES 2009). Sponges brought to the surface and released before hauling on deck are also unlikely to survive as sponges sinking en masse back to the bottom may end up upside-down or on the wrong type of seabed (Klitgaard and Tendal 2004). Estimating Gear Efficiency of Research Vessel Trawls on the Sackville Spur Sponge Grounds There have been no experimental studies of gear efficiency for sponges in the NRA. However, crude estimates can be made for research vessel trawls (commercial trawl sponge by-catch data is not available). In the Sackville Spur area there are data from box cores and underwater images that can be used to estimate true population density and biomass, as well as a few research vessel trawls which can be used for capture mortality (Figure 16). The NEREIDA data used for this comparison are Box Cores 72 and 73 from the RV Miguel Oliver survey (Figure 17), benthic image transects (11 and 12) from the 2009 CCGS Hudson survey and trawl by-catch from six Canadian and one Spanish/EU research vessel trawls. These data are not close to one another but all fall within the area closed to protect the sponge grounds on Sackville Spur. The Canadian and Spanish/EU depth-stratified random multispecies surveys in this area use a Campelen 1800 shrimp trawl with rockhopper foot gear (Walsh and McCallum 1997) and a Lofoten trawl (Murillo et al. 2011) respectively. Standard tow lengths differ between countries. Spanish/EU research vessels tow for 30 minutes at ~3 knots for an average standard tow length of 2.8 km (Murillo et al. 2011), while Canadian vessels tow for 15 minutes at ~3 knots for an average tow length of 1.4 km (Kenchington et al. 2010a, Cogswell et al. 2010).
 with surface sponge within the Sackville Spur closed area in relation to RV trawls (white circles - Canada, black circles - Spain) and 2009 camera transects (11,")
19 19 BC 89 BC 73 BC 72 Figure 16. Box core locations (yellow circles) with surface sponge within the Sackville Spur closed area in relation to RV trawls (white circles - Canada, black circles - Spain) and 2009 camera transects (11, 12, 18, 24 and 26). The mean of the total weight of surface Porifera for box cores 72 and 73 is 1,202g. The area represented by the box core is 0.25 m 2 (0.5 x 0.5 m) or kg of surface sponge/m 2. The swept area of a 30 min Spanish/EU research vessel Lofoten trawl is ~3.9 hectares (or 39,000 m 2 ). Therefore, the total biomass impacted by the Spanish/EU trawl in this area would be ~187,512 kg. The swept area of the Campelen trawl used by Canadian research vessels (15 min trawl) is ~2.3 hectares, or 23,391 m 2 (B. Brodie, personal communication). Using the same sponge biomass/m 2 as above, total biomass impacted by a Canadian research vessel trawls in this area would be ~112,464 kg. The mean of the Spanish research vessel trawl catches (n=4) was 3606 kg and the mean of the Canadian trawl catches (n=3) was 907 kg. This suggests that the gear efficiency is on the order of 1.9% for the Spanish/EU Lofoten gear and 0.8 % for the Canadian Campelen gear. This is a quick but not very robust method for estimating the biomass impacted by research vessel trawls. This estimation only considers the biomass from two box cores and does not account for the inherent variability associated with the patchy distribution of sponges or issues with scaling up biomass several orders of magnitude. Benthic camera transects allow for abundance estimates to be determined from larger spatial scales. Benthic camera transects 11 and 12 conducted during the 2009 CCGS Hudson mission lie between box cores 72 and 73 (Figure 16). The transect lines were clipped to only include analyzed images from water depths in excess of 1400 m (Figure 18) where the sponge grounds start (NAFO 2010). The sponge counts in each image below 1400 m (Figure 19) were recorded and then converted to a biomass value by multiplying by the average weight of sponges from box cores 72 and 73 (150 g/sponge). This value, which represents the estimated weight of sponges within the ~0.42 m 2 field of view for each image, was then divided by 0.42 as an estimate of the sponge biomass/m 2 in each image.
.")
20 20 Figure 17. Box cores 72 (A), 73 (B) gathered during the NEREIDA mission aboard the Spanish research vessel Miguel Oliver in June of The depth-selected portions of transect lines 11 and 12 were then split into intervals of 1400 m in length to approximate the distance trawled by Canadian research vessels (Kenchington et al. 2010a). The ArcGIS "Spatial Join" tool was then used to calculate the median, mean, standard deviation, minimum and maximum sponge weight/m 2 for images within each 1.4 km section of the lines (Table 2). Multiplying the mean estimated weight per analyzed image by the swept area would provide an estimate of the biomass impacted by a Canadian research vessel trawl for each interval. For Spanish/EU trawls the intervals A and B were combined into a 2.8 km line (C) and the "Spatial Join" tool was used to calculate the median, mean, standard deviation, minimum and maximum sponge weight/m 2 over the length of the line. Based on the swept area for a Spanish/EU research vessel trawl and mean estimated weight per analyzed image, an estimate of the biomass within the swept area was calculated (Table 2). Benthic images from transects 11 and 12 representing the mean, minimum and maximum sponge biomass are displayed in Figure 19. Table 2. Descriptive statistics of estimated sponge biomass for analyzed benthic images below 1400 m water depth in both transects 11 and 12. Refer to Figure 17 for position of the transects and intervals A, B and C. Transect (Interval) Image Count/ interval Median (g/m 2 ) Mean (g/m 2 ) Standard Deviation (g/m 2 ) Min (g/m 2 ) Max (g/m 2 ) Canadian Trawl Swept Area Biomass (kg) Spanish/ EU Trawl Swept Area Biomass (kg) Gear Efficiency based on Mean Biomass* (%) 11A 22 3,750 4,026 2, ,357 94, B 36 7,857 6,994 2, , , C 58 5,714 5,868 3, , , A 51 8,214 9,188 5,337 1,000 25, , B 40 13,035 13,955 7,187 1,035 31, , C 91 10,000 11,325 6,648 1,000 31, , *Mean biomass of Spanish research vessel trawls (3606 kg) and Canadian research vessel trawls (907 kg) within the Sackville Spur closed area.
.")
21 21 Figure 18. Camera transect lines 11 (blue) and 12 (red), run during CCGS Hudson mission in A and B represent 1.4 km sections on each line while C is the total line length of 2.8 km. Lines A, B and C were used to extract in situ abundance data of sponges on the Sackville Spur sponge grounds for estimation of gear efficiencies (see text for details). The box core samples estimated in situ biomass of 4,808 g of surface sponge/m 2 in the Sackville Spur area. The benthic transect lines produced mean in situ biomass estimates ranging from 4,026 13,955 g of surface sponge/m 2 (range: ,429 g surface sponge/m 2 ). For both transect lines, the mean sponge biomass increase is higher in the shallower portion of each line and there is quite a lot of variability in biomass estimates due to the patchy distribution of the sponges within the sponge grounds (Table 2). Using the trawl catch mean of 3606 kg and 907 kg to represent capture mortality for the Spanish/EU and Canadian research vessels respectively, gear efficiencies of % are estimated for the Canadian research vessels and % for the Spanish/EU, depending on depth. This compares well with the 0.8% and 1.9% gear efficiency for Canadian and Spanish/EU research vessel trawls calculated from the smaller box cores (see above). While these figures are not very robust they are consistent with each other and suggest low gear efficiency or catchability of sponges with research vessel trawl gear on the Sackville Spur sponge grounds.
 the mean (5,868 g/m 2 ), B) the minimum (714 g/ m 2 ), and C) the maximum (12,500 g/m 2 ) biomass values from transect 11.")
22 22 Figure 19. Photos representative of various sponge biomass on the Sackville Spur sponge grounds. A) the mean (5,868 g/m 2 ), B) the minimum (714 g/ m 2 ), and C) the maximum (12,500 g/m 2 ) biomass values from transect 11. D) the mean (11,325 g/m 2 ), E) the minimum (1,000 g/m 2 ), and F) maximum (31,429 g/m 2 ) biomass values from transect 12. Each image represents an approximate surface area of 0.42 m 2 (see Table 2). Incidental Mortality Incidental mortality is mortality caused by the fishing gear other than capture mortality. Sponges can be dislodged, smothered or otherwise damaged by trawl gear. Sponges which are dislodged will eventually starve as they depend on attachment and orientation to the currents to feed (ICES 2009). Sponges are also not able to clear large amounts of silt stirred up by trawling plumes over soft sediments and may smother. Damage to sponges may be repaired, depending upon the age of the sponge and the location of the injury (ICES 2009). Moran and Stephenson (2000) report on the general effects of demersal otter trawls on sponges, soft corals and gorgonian corals greater than 20 cm in height off the sea floor, with 15.5% of benthos detached. Wassenberg et al. (2002) noted much higher incidental mortality in their study of fishing impacts on sponge grounds on the northwest shelf of Australia. The large massive (lump) sponges of their study (e.g., Xestospongia spp.), greater than 500 mm, were torn from the seabed and caught by the gear or rolled under it causing severe mortality. They estimated 55% of lump and branched sponges > 500 mm were dislodged. Sainsbury et al. (1997), also working in Australia, used a heavier Frank and Bryce wing trawl gear in experimental trawling studies. They estimated that between 43 and 95% of large sponges (>150 mm high) were detached from the seabed. Freese et al. (1999) conducted experimental trawling in Alaska and found that immediately post-trawl, density of sponges in eight trawl tracks was 16% lower than the density of sponges in the eight reference transects. Together, these studies suggest high incidental mortality for large sponges through detachment (of the size range of the Geodia-dominated grounds in the NRA). Damage to sponges through interaction with the gear is also high. Van Dolah et al. (1987) found 32% damage to large (greater than 10 cm) barrel sponges (Cliona spp.) on hard substrate off southeastern Georgia following a single pass of their 40/54 roller-rigged trawl. Freese (2001), using larger and heavier gear in Alaska reported 67% damage to the large vase sponges along experimental trawl lines and only 2% in reference areas. Tilmant (1979) observed 50% of sponges damaged after experimental shrimp trawling in Biscayne Bay, Florida. Therefore, for those larger sponges that are not dislodged from the substratum by the gear, damage can be high. Recoverability There have been a few experimental studies which address recovery of large sponges after trawling. Van Dolah et al. (1987) showed a rapid recovery to a single trawl pass over hard bottom habitat off the southeastern Georgia where
23 23 sponge population densities had returned to pre-trawl levels or greater in one year or less after trawling. They also noted that damaged sponges had healed and grown during that time. Conversely, Kefalas et al. (2003) report on the impacts of commercial scallop dredging on 48 sponge species in the northeastern Mediterranean by comparing species composition and density before and one year after intense commercial fishing. All but one species had lower density one year later and there were significantly fewer species and individuals. Similarly, Freese (2001) reported that one year after experimental trawling in Alaska, underwater video observations showed a 21% reduction in density which was an increase in mortality of 5% over immediate post-trawl reductions, presumably due to mortality of damaged sponges. Freese (2001) reports that one year later visible damage to Geodia species was 59.4% and 46.7% of all sponges still showed visible damage with no signs of repair. However necrosis was only observed on basket sponges. No new colonization of sponges was apparent in any of the three trawl paths. In the shallow water coral ecosystem of the Great Barrier Reef in Australia, Pitcher et al. (2009) found a 6% decline in sponge biomass six months after one pass of a shrimp trawl. Rooper et al. (2011), also working in Alaska, used research vessel catch per unit effort (CPUE) as an index of abundance and modeled recovery rates using logistic population models to estimate growth rates. They estimated recovery of sponges from an equilibrium state to a post-trawl state of 67% mortality (drawn from Freese et al. (1999) damage estimates) would take from 13 to 36 years to achieve 80% of original biomass in the absence of further trawling. Klitgaard and Tendal (2004) suggest that the dominant sponge species in the NE Atlantic ( ostur ) are slow growing and take at least several decades to reach the sizes commonly encountered. In general, they are found in relatively constant environmental conditions that suggests they are dependant on a certain stability with respect to water mass characteristics, kinds and amount of particles in the water, and on low physical disturbance. Few small specimens were found by Klitgaard and Tendal (2004) leading them to suggest that reproduction in boreal ostur areas is infrequent making ostur vulnerable to changes in hydrographic regime (climate change) as well as direct impacts of trawling. No investigations of the sexual reproduction of Geodiids and Ancorinids from the NW Atlantic have been carried out. However, the reproduction of the cold-water Arctic sponge, Geodia barretti, has been studied in Norway (Spetland et al. 2007). This species is oviparous and dioecious and undergoes synchronous spawning once or twice a year. The onset of reproduction coincides with the spring phytoplankton bloom with gamete release in early summer, just after the phytoplankton spring bloom is over and when organic matter sedimentation following the bloom is highest. A second release of gametes is associated with the fall bloom. Sponge larvae are uniformly non-feeding and short-lived (except for rare known exceptions), generally staying only a few hours in the water column (Maldonado and Bergquist 2002) and settle in the vicinity of parental populations (Mariani et al. 2003). With such high levels of larval retention (Mariani et al. 2006) it is likely that connectivity among the sponge grounds is very low and that the patches are highly inbred and self-recruiting. Geodia is also known to produce gemmules (Burton 1949), or asexually produced buds, which are resistant to poor environmental conditions that can kill adult sponges. However, very little is known about the relative contribution of sexual and asexual reproduction in natural environments. Evidence for Recoverability of Sponges in the NRA Data are currently being analyzed to assess recoverability of sponge grounds in the NRA from a known research vessel trawl. In situ video was collected with the ROV ROPOS in 2010 from the eastern portion of the Flemish Cap as part of the NEREIDA project. Initially, two, approximately one-kilometer, parallel lines, one trawled ( m), and one not trawled ( m), were analyzed for the abundance of Porifera spp. and corals. Time constraints prevented us from analyzing the full video for the two lines, therefore, frame grabs were taken from the video footage at 20 m intervals and analyzed. The Porifera were divided into three groups: 1) Asconema foliata, 2) massive Porifera (e.g. Geodia spp.), and 3) Fan-shaped Porifera. These groups were further divided into three size-classes: < 10 cm, cm, and > 20 cm. The lasers on the ROPOS, calibrated at 10 cm apart, were used to judge the size of the sponge. Sponge outside of these groups (e.g., Euplectella sp.), corals and other large megafauna were also counted, without regard to their size. Based on preliminary results, the data from a third (untrawled) video transect line is being analyzed and previously analyzed video is being re-examined with frame grabs at 10 m intervals.
24 24 Move-on rules for Sponges There has been much debate over the usefulness of move-on rules as currently applied by RFMOs (Kenchington 2011). However, move-on rules are an essential companion to encounter thresholds, especially in new fishing areas. The objective of the rule is to move the vessel to an area where it will not encounter another VME. We provide information on the minimum and maximum depth of the Geodia-dominated sponge grounds on the continental slopes in the NRA. These data are restricted to the research vessel survey area which extends outside of the fishing footprint (Figure 1). In this area sponge grounds form a linear band following depth contours. We identified five areas with significant sponge concentrations as defined previously (NAFO 2010; research vessel trawls with catches higher than 75 kg) in the NRA Div. 3LMNO (Figure 20): on the northeast slope of the Grand Banks (1), between the Nose and the Tail of the Bank, large catches of sponges were taken in a narrow band between 700 and 1470 m depth reaching maximum values larger than 5000 kg in one trawl around 1400 m depth; on the southeastern corner of the Beothuk Knoll (2) between 1000 and 1400 m depth seven catches between 100 and 1000 kg were found in a small area of about 120 km 2 ; on the southeastern corner of the slope of Flemish Cap (3) between 950 and 1330 m depth another area with significant catches of sponges was found. In this corner 8 trawls with catches between 100 to 5000 kg were found; on the eastern slope of the Flemish Cap (4) a band from north to southeast between 1050 and 1350 m depth was found with maximum values of 3000 kg per trawl around 1250 m depth; lastly, on the north slope of the Flemish Cap and Flemish Pass (5) in one area known as Sackville Spur, fourteen significant catches of sponges were found between 1250 and 1450 m depth. In this area the maximum catch of sponges (12,000 kg) in the NRA (Divs. 3LMNO) was taken at 1420 m depth (depth calculated from multibeam bathymetery from the NEREIDA surveys). This information (Table 3) can be used to construct move on rules for each area. For the maximum depth of the sponge grounds we used the 2000 m depth contour. This is because the maximum depths noted above were always the deepest trawl locations sampled in each area. Data from video transects suggest that the sponges are found to 2000 m. Table 3. Minimum and maximum depth ranges for sponge grounds on the continental slopes of the NRA with a maximum move on distance based on average slope and a starting point of 2000 m, the maximum depth of the sponge grounds. Slope Area Shallow End of Sponge Depth Range (m) Average Slope over Depth Range of Sponge Grounds Estimated Maximum Distance to Move km (nm) 1 GB Nose & Tail (9.8) 2 Beothuk Knoll (6.2) 3 SE Flemish Cap (7.7) 4 E Flemish Cap (7.6) 5 Sackville Spur (6.6)
25 25 Figure 20. Map of all significant research vessel trawl sponge catches (> 75 kg) based on Spanish/EU and Canadian bottom trawl groundfish surveys. All areas currently closed to protect significant concentrations of corals and sponges in the Divisions 3LMNO of the NRA are indicated. The numbers 1-5 indicate the areas with large sponge catches evaluated in Table 3. The move on rule would require the vessel to move from its position to shallow water 700 m in Slope Area 1, to 1000 m in Slope Area 2, to 950 m in Slope Area 3, to 1050 m in Slope Area 4 or to 1250 m in the Sackville Spur Area 5. If one rule were to be implemented for all areas it would be: the vessel is required to move to shallower water 700. Given the average slope of the continental slope in these areas (θ) (calculated from multibeam bathymetery from the NEREIDA surveys as illustrated for the Sackville Spur Area 5 in Figure 21) and the maximum sponge depth of 2000 m, the maximum move on distance would equate to ( )/tan θ. This is the average distance from an encounter at the deepest part of the sponge grounds with a movement decision to go in the direction of shallow water. The maximum move on distance in the NRA would be 18.1 km or 9.8 nm in the shortest direction of shallower water. This would occur in Area 1 on the Nose and Tail of the Grand Bank (Figure 20).
26 26 Figure 21. Slope between 2000 m and 1250 m determined for the Sackville Spur (Area 5) sponge grounds from multibeam bathymetric data collected during the NEREIDA mission. These data were used to calculate mean slope for the area. Conclusions Structural sponge habitat is extremely vulnerable to commercial and research trawling suffering immediate declines through direct removal of sponges and further reductions in population densities of sponges due to delayed mortality. We feel confident that an encounter threshold of 300 kg is sufficient to identify Geodia-dominated sponge grounds in the fishing footprint and outside the footprint on the continental slopes. This is the dominant structureforming sponge in this area. This threshold will also identify the largest concentrations of lighter structure-forming glass sponges. At this time we are cautious about moving to a threshold of 40 kg as this will largely capture non- VME sponges and small aggregations of Geodia spp. however we recognize that this will be at the expense of some smaller aggregations of glass sponges. With more information on species composition in the near future we may be able to locate those areas and consider whether they need further protection. The literature reports a wide range of gear efficiencies for large sponges. Our data suggest that gear efficiency for both the Campelen and Lofoten trawl gear is on the order of 2%, however others report values of up to 70% for large sponges. Incidental mortality is also high with 55 to 95% of large sponges reported detached from the sea bed and 32% to 60% of attached sponges being damaged. In one case recovery occurred within a year, but generally, and in the few cold water studies recovery has not occurred within a year and is expected to take decades. Larval retention is likely high and increases the importance of maintaining sufficient densities of sponges within each sponge ground. These conclusions on the significant adverse impact of fishing on sponges would favour the 40 kg threshold as gear efficiency may be as low as 5% with high incidental mortality. However, given the uncertainties of the species composition associated with the locations where such catches occur we are reluctant to endorse this low value at this time. Reducing the threshold inside the fishing footprint from 600 kg to 300 kg would affect 0.65% of trawls following the 2010 VMS fishing effort pattern (vs. 0.3 %) while reducing it to 40 kg would only affect 3.9% of such trawls. We provide area-specific move-on rules which move effort away from known sponge grounds. Sponge grounds are localized in narrow bands along the slope of the Grand Banks and Flemish Cap and they extend to deep waters. We
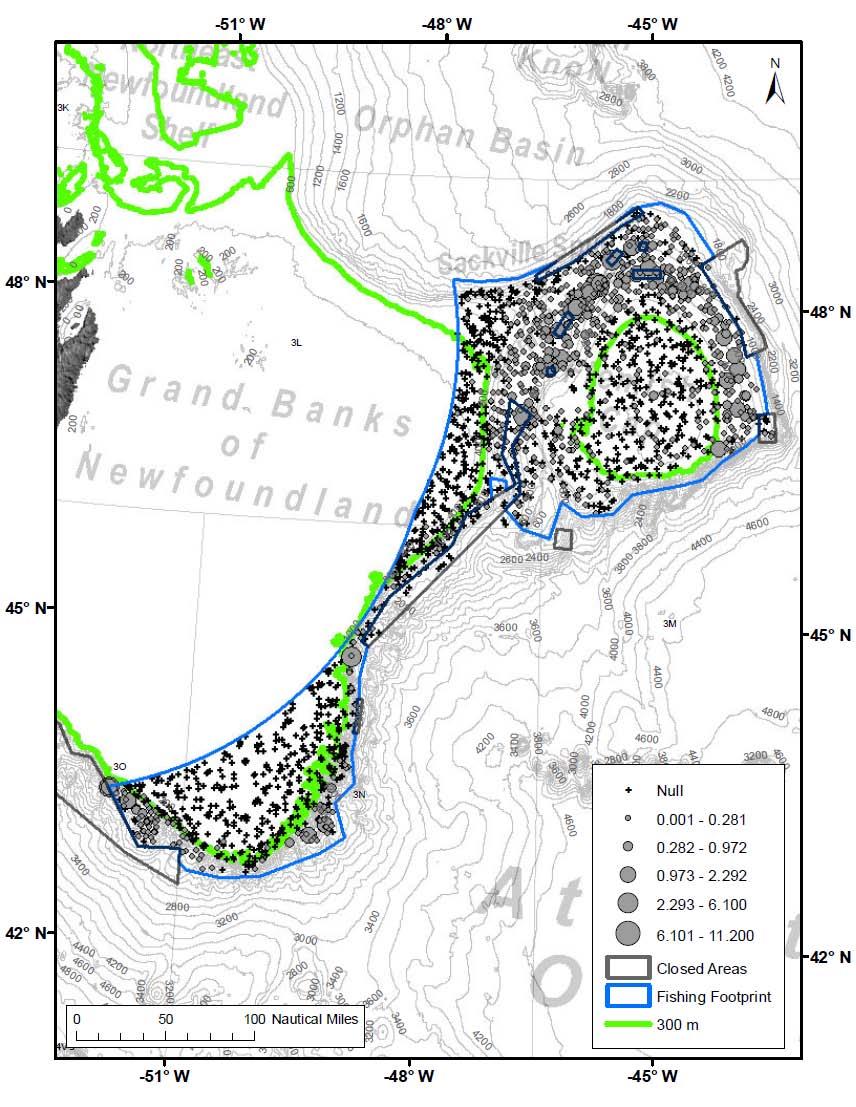
27 27 propose a move on rule that would require the vessel to move from its position to shallower areas where no sponge grounds are expected to occur. This rule would have to be applied through consideration of other VME species so as not to displace effort to other areas. Sea Pen Fields Sea pens are colonial organisms belonging to the order Pennatulacea. The generalized sea pen body plan takes the form of a rigid, erect stalk (the rachis) with one or more polyps raised into the water column, and a bulbous "root" or peduncle at its base which anchors it in the soft sediments of the sea floor (Williams 1995). All belong to the family Pennatulaceae (sea pens) with the longer species sometimes referred to also as sea whips. NAFO, following the guidelines of the FAO (FAO 2009), have identified sea pens as key structural components of soft-bottom vulnerable marine ecosystems in the Regulatory Area (Fuller et al. 2008, NAFO 2008a,b, Murillo et al. 2010). Aggregations of sea pens, known as fields, provide important structure in low-relief sand and mud habitats where there is little physical habitat complexity. These fields provide refuge for small planktonic and benthic invertebrates (Birkeland 1974), which in turn may be preyed upon by fish (Krieger 1993). They also alter water current flow, thereby retaining nutrients and entraining plankton near the sediment (Tissot et al. 2006). Sea pens fields belong to the Initial OSPAR List of Threatened and/or Declining Species and Habitats (OSPAR 2003). NAFO Scientific Council (2008a) made recommendations for closing areas to protect deep sea corals, including sea pens. An extensive database from Canada and Spain/EU of 7,279 research vessel survey trawl records from NAFO Divisions 3LMNO covering a depth range of m were used to locate key concentrations of sea pens using the cumulative catch distribution to identify aggregations (NAFO 2008a). This was followed by the application of GIS modelling (Kenchington et al. 2010a) to identify significant concentrations using kernel density analysis (Murillo et al. 2010). There is a high diversity of sea pens in Atlantic Canada and surrounds compared with other coral orders. Murillo et al. (2011) list 11 sea pen species from the NAFO Regulatory Area (NRA), and the NAFO Coral Identification Guide (Kenchington et al. 2009), which included only the more common taxa, lists 5 sea pen species and 2 other genera. However, the dominant sea pen taxa observed in the surveys are Anthoptilum grandiflorum, Halipteris finmarchica and Pennatula aculeata (Murillo et al. 2010). The first two are whip-like sea pens and the last is a smaller fleshy species; all of the common sea pens in the NRA fall into one or other of these morphologies. At present, different coral groups do not have different encounter thresholds, despite their very different morphologies and biomass. The encounter threshold of 60 kg of live coral is very high for the smaller corals such as the sea pens and it is for this reason that we have chosen to include them, along with the sponges, in this first full assessment of encounter protocols and SAI. GIS-Simulation of Commercial By-catch (Encounter) Thresholds Indicative of Sea Pen Fields in the NAFO Regulatory Area (NRA) The layers used by the model to predict commercial sea pen by-catch under varying scenarios remain largely unchanged from those used for describing the model layers to estimate commercial trawl sponge by-catch. The only exceptions are the simulated trawl lines generated for each scenario and the sea pen biomass layer used to calculate by-catch for each simulated line. The former random trawl lines drawn for the sponge by-catch analyses had to be regenerated to allow for the different spatial footprint of the sea pen biomass raster. The sea pen data set consists of 2588 records from Canadian (N=577) and Spanish/EU (N=2011) research vessel trawls from 2005 to Of these, 1,792 records represent null data points where no sea pen by-catch was observed (Figure 22). Further, of the 796 research trawls recording sea pens, 735 (~92%) were found in water depths greater than or equal to 300 m (Figure 22). That sea pen distribution is easily discernable as a horseshoe around Flemish Cap and a narrow band hugging the slope on the southeast Grand Banks and above the 3O closure (Figure 22).
28 28
29 29 Figure 22. The distribution of sea pen by-catch (grey circles - kg) and null sets (black cross) in relation to the 300 m contour (green line) and closed areas (grey polygons) in the NAFO Regulatory Area. The sea pen biomass layer created for the model scenarios described below were created in a similar manner as the sponge by-catch raster, that is with 5 x 5 km cells and using only the Spanish/EU research vessel data (Cogswell et al. 2011). Canadian data was not used in the analysis to avoid introducing spatial bias through standardization methods as discussed above. The resultant sea pen biomass layer used for the GIS modelling is illustrated in Figure 23 and referred to as the 5 x 5 km sea pen biomass surface. Figure 23. The sea pen biomass layer used to calculate simulated by-catch. As for the analysis of sponge by-catch, this simulation uses 2000 randomly placed and oriented straight line simulation trawls of standard commercial tow length (13.8 nm) (Figure 24). All lines generated by this method have
.")
30 30 a random start location and a randomly chosen heading between 0 and 360 degrees, at 1 degree intervals. Lines were not restricted from crossing into a closed area, but were limited to within the footprint of the Spanish/EU research vessel 5 x5 km grid sea pen biomass surface (Figure 24). These lines are meant to mimic the research vessel random trawl stations with commercial length trawls to reproduce the protocol for sea pen field identification established previously (Kenchington et al. 2009, Cogswell et al. 2010, Murillo et al. 2010) only using commercial trawl threshold values. This is the same model application used for identifying sponge grounds. Figure 24. Simulated trawls (n=2000) with random start locations and orientation. Each trawl is of standard length (13.8 nm) and falls within the 5 x 5 km sea pen biomass surface for the NRA. The simulated commercial sea pen by-catch was used to create a sea pen biomass layer interpolated using the kernel density algorithm with a search radius of 25 km (Figure 25) (Kenchington et al. 2010a), and polygons were drawn around the area occupied by successive weight thresholds following Kenchington et al. (2010a) and Kenchington et al. (2010b). This biomass layer identified hot spots in locations similar to those in the research vessel sea pen interpolated biomass layer used to identify the closed areas however the high density locations are more prominent in the modeled data from the simulated trawls.
 in the NRA estimated from simulated commercial trawls with random start locations and orientation (Figure 24) (left) and from Spanish/EU research vessel catches")

31 31 Figure 25. Modelled sea pen biomass (kg/km 2 ) in the NRA estimated from simulated commercial trawls with random start locations and orientation (Figure 24) (left) and from Spanish/EU research vessel catches (right). Note maximum density values cannot be compared between the two methods. Figure 26 illustrates the area occupied by the calculated density polygons for 26 catch weight thresholds between and 30 kg. In this series the largest change between successive categories occurs between 7 and 6 kg. Catches of 7 kg or more occupy an area of 5,000 km 2 while catches of 6 kg or more occupy an area 2.6 times larger (13,088 km 2 ). This threshold was established with 12 data points from the research vessel survey and so is considered to be a reliable indicator of sea pen fields (note sometimes aerial expansion can be created through only a few data points which we would not consider to be a robust estimator of the habitat area). The difference in area occupied by these catches is illustrated in Figure 26. Most of the catches 7 kg occurred outside of the current closed areas. A threshold of 7 kg equates to about 198 individuals of the short and fleshy species (based on mean individual weights of 220 P. borealis) and to about 583 of the sea whips (based on mean of individual weights of 306 Anthoptilum grandiflorum) (E. Kenchington, unpublished data). Figure 28 illustrates a mixed species catch of 388 sea pens weighing 5.7 kg taken from a research vessel trawl on Flemish Cap.
32 Polygon Area (km 2 ) Simulated Commercial Sea Pen By-catch (kg/13.8 nm) Figure 26. Area (km 2 ) occupied by tows with decreasing sea pen catch weight from 30 kg to >0 kg. The red bar indicates the levels where the greatest difference in area occupied occurs between successive catch weight values. A B Figure 27. A) Location of simulated commercial catches with 7 kg of sea pen by-catch. Locations of the closed areas in the NRA are indicated as shaded light blue areas. B) Polygons depicting the area occupied by simulated commercial sea pen catches in the NRA 7 kg (inner darker orange coloured polygon) and 6 kg (outer lighter green coloured polygon). This represents a 2.6 times increase in area between the thresholds.
, (Funiculina quadrangularis (n=8, 0.032kg), Umbellula lindahli (n=1, 0.017 kg), Distichoptilum gracile (n= 1, 0.008 kg) also present but not visible). (photo courtesy of F. J.")
33 33 Figure 28. Photograph of a 5.7 kg catch of sea pens of mixed composition taken from Flemish Cap. Halipteris finmarchica (n=15, 0.55 kg), Anthoptilum sp. (n=363, 5.11kg), (Funiculina quadrangularis (n=8, 0.032kg), Umbellula lindahli (n=1, kg), Distichoptilum gracile (n= 1, kg) also present but not visible). (photo courtesy of F. J. Murillo, IEO-Vigo). Anticipated Impact on the Commercial Fishery of Using a 7 kg Encounter Threshold The simulation model was run using 2000 randomly selected commercial trawls from data falling within the 95% confidence interval of the 2010 VMS data (see Cogswell et al for description of all input layers). Fishing in 2010 was restricted to within the fishing footprint and outside of the closed areas (Figure 29). The model utilized the sea pen biomass raster detailed above, and produced a highly skewed cumulative catch distribution as seen in the research vessel sea pen catch data (NAFO 2008a).

34 34 Figure 29. Location of 2000 randomly selected VMS trawl lines from the filtered 2010 fishing effort distribution superimposed over sea pen biomass as determined from Spanish/EU research vessel survey data.
35 35 Table 4. The number and percent of groundfish trawls catching sea pens at various encounter threshold levels. Trawl lines were randomly selected from VMS data falling within the 95% CI of the mean of that data. The shaded row indicates the proposed sea pen encounter threshold. Threshold (kg per tow) No. Filtered VMS Trawls % Filtered VMS Trawls Threshold According to this model the current sea pen encounter threshold of 60 kg of live coral would rarely if ever be caught. Reducing the encounter threshold to 7 kg would affect only 0.4 % of trawl sets fishing with the 2010 fishing effort distribution (Table 4). Following the fishing effort pattern of 2010, catches 7 kg are found in three locations (Figure 30). Two of these are on Flemish Cap and one just south of the Flemish Pass closed area. There are 8 VMS trawls, and the mean trawl length is 31 nm, with the shortest 13 and the longest 58 nm. Therefore the trawl length accounts for some of the values being so high. Figure 31 shows a close-up of 6 VMS tracks near the sea pen closed areas on Flemish Cap. Research vessel sea pen by-catch is high in adjacent unfished areas. There are two morphologies of sea pens in the NRA. One group is short and fleshy with Pennatula aculeata being the most common, and the other group is long and thin and sometimes referred to as sea whips. Anthoptilum grandiflorum and Halipteris finmarchica are the most common of the second form. Figures 32 and 33 show that most of the 2010 fishing effort above the proposed threshold of 7 kg would impact the long thin species, or sea whips.
 of commercial trawls (black lines) expected to have caught 7 kg of sea pens")
36 36 Figure 30. Location (red circles) of commercial trawls (black lines) expected to have caught 7 kg of sea pens in the NRA in 2010 (data from filtered VMS data set detailed in Cogswell et al. 2011).
 expected to have caught 7 kg of sea pens in the NRA in 2010 (data from filtered VMS data set")
37 37 Figure 31. Location of the 6 commercial trawls (black lines) expected to have caught 7 kg of sea pens in the NRA in 2010 (data from filtered VMS data set detailed in Cogswell et al. 2011). The 5 x 5 km grid sea pen biomass surface is shown along with individual research vessel catches.
 and long thin sea whips in the NRA as determined from research vessel surveys. Figure 33.")

38 38 Figure 32. Relative proportion of short fleshy sea pens (Pennatula spp.) and long thin sea whips in the NRA as determined from research vessel surveys. Figure 33. Close up of the area with greatest effort above the proposed sea pen threshold of 7 kg. The relative proportion of short fleshy sea pens (Pennatula spp.) and long thin sea whips in the NRA as determined from research vessel surveys is illustrated. Size of the circle represents the size of the catch (biomass). Location of commercial trawls (black lines) expected to have caught 7 kg of sea pens in the NRA in 2010.
39 39 Assessment of Significant Adverse Impact (SAI) of Bottom-Contact Gear on Sea Pens Murillo et al. (2011) reported Pennatulaceans in 36% of 910 research vessel survey tows in the NRA. Quantitative assessment of significant adverse impact of bottom-contact gear on sea pens in this area requires information on gear efficiency and selectivity in order to assess the nature of removals (additional comments made for sponges above apply here as well). Figure 34 highlights areas outside of the closed areas where significant interactions between fishing and sea pens may have occurred. As for the sponges, this map cannot separate out cells with high effort and low sponge from those with high sponge and low effort. Figure 35 provides a further refinement by identifying only cells where simulated commercial sea pen by-catch above 7 kg occurred in areas that were fished in Figure 34. The interaction between fishing effort and sea pen biomass is identified for each 12.5 km 2 grid. Red and orange colours signify areas of relatively high effort in areas of generally high biomass (Figure 27). Green colours signify low potential for fishing interaction with sea pens.
40 40 Figure 35. This interaction map highlights cells where fishing effort overlaps with simulated commercial by-catch in excess of 7 kg. These are areas where significant adverse impact of fishing on sea pens has the highest probability of occurring. Information on incidental damage and recovery from trawling informs the magnitude of the impact on the population. Sea pens have flexible axial rods and some species are able to re-anchor in the sediment if they are dislodged, however, mobility can be limited and species specific (Malecha and Stone 2009). The low catch threshold proposed for these species corresponds to a much higher catch in terms of numbers of individuals. As stated earlier, a threshold of 7 kg equates to about 198 individuals of the short and fleshy species and about 583 of the larger sea whips. Removals of these numbers of individuals will cause population-level impacts, possibly altering recruitment dynamics.
41 41 As well, long-term success of injured or dislodged sea pens can be relatively low. When compounded by large scale effects (i.e. population level) with low survival the result is a relatively high risk of SAI to sea pen populations, particularly with isolated communities. Gear Efficiency and Selectivity on Sea Pens Troffe et al. (2005) conducted a study of the effects of a shrimp beam trawl and prawn traps on sea whips (Halipteris willemoesi) at two bays on Clio Channel, south central coast of British Columbia, Canada. No sea whips were caught in six beam trawls despite maximum mean densities of adults of about 18 m 2 and of juveniles of about 90 m 2, determined from underwater video. For this gear and species both gear selectivity and efficiency are 0%. The authors analyzed by-catch from 600 prawn trap sets at Turnour Bay, and found about 5% had sea whips entangled in the gear. The low efficiency of beam trawls in sampling sea pens was also observed in the Celtic Sea where despite the common occurrence of Virgularia mirabilis, as seen in video footage, none were caught by experimenatl beam trawls (Doyle et al. 2011). However this is a species that is able to retract into the sediment and so this low efficiency is likely due to gear avoidance. Tuck et al. (1998) also found no changes in density of this species following experimental trawling carried out repeatedly over an 18-month period. Hixon and Tissot (2007) compared trawled and untrawled areas off Oregon, United States at 200 m. Results showed large (30-50 cm) sea pens (Stylatula spp.) accounted for 95% of all invertebrates in the untrawled site. Conversely, the trawled site showed very few sea pens present. However, this type of comparison cannot attribute cause and effect. Selectivity of sea pens by bottom-contact gear will vary based on species behavior and colony morphology (i.e. size and shape). Some sea pen species are capable of retracting within the sediment when disturbed (e.g., Protoptilum carpenteri and Virgularia mirabilis) and are believed to sense vibration in soft sediments substrates as bottomcontact gear approaches (Greathead et al. 2011). Positioning of a sea pen colony can also determine the selectivity. Small species such as Kophobelemnon spp. are positioned with the majority of the rachis (stalk) burried wihtin the sea floor with only the top portion containing the polyps exposed. This may explain the few records of Kophobelemnon observations in both the Canadian and Spanish/EU trawl survey data compared to 100s of in situ observations from camera surveys in the area. To our knowledge there have been no studies of gear selectivity on sea pens. Estimating Gear Efficiency of NAFO Research Vessel Trawls During the summer of 2011, sea pen fields in the Laurentian Channel west of the Grand Banks were sampled with an underwater video device (Campod) operated from the CCGS Hudson. This area had been identified using the kernel density GIS model as having significant concentrations of sea pens (Kenchington et al. 2010b). Three video transects (numbered CON 33, CON 34 and CON 35) were completed in the vicinity of known research vessel trawls (Figure 36). The field of view area for the Campod video is roughly 56 x 43 cm or 0.24 m 2.
 fall near Canadian research vessel tows conducted with Western IIA trawl gear, and one (CON 35) near research vessel tows conducted with a Campelen trawl, allowing")
42 42 Figure 36. Location of the two video transect lines (CON 33, CON 34) used to determine the in situ biomass of sea pens for assessment of gear efficiency. Tow transects (CON 33 and CON 34) fall near Canadian research vessel tows conducted with Western IIA trawl gear, and one (CON 35) near research vessel tows conducted with a Campelen trawl, allowing gear efficiency evaluations for these two types of gears. The on bottom length of transect CON 33 is ~1864 m for a total area analyzed covering ~447 m 2 (Figure 37). The total number of sea pens viewed was 423. This is represented by 381 Anthoptilum spp. (~90%) and 42 Pennatula spp (~10%). This proportion is applied to the predicted abundance in the swept area of the gear and converted to a biomass by using median individual weights for each species. The concentration of sea pens for the area analyzed is ~ 1 sea pen / m 2 of bottom. The comparative 2009 research vessel trawls were made with a Western IIA towed at a constant speed of 3.5 knots for approximately 30 minutes (Figure 38). The total swept area of one set is km 2 or 40,400 m 2.

 had a sea pen by-catch of 21.22 kg.")
43 43 Figure 37. Detail of video transects CON 33 and CON 34 with data records for the sea pen Anthoptillum spp. indicated in the upper figure and Pennatula spp. in the lower figure. The comparative trawls (Figure 40) had a sea pen by-catch of kg. Given the range of sea pen biomass impacted between CON 33 (572 kg) and CON 34 (259 kg), this amount of by-catch represents roughly 3.7 and 8.2% gear efficiency.
. The blue area depicts an area of interest for a MPA.")
44 44 Figure 38. Location of research vessel trawls in the vicinity of the study area. Red shaded circles distinguish trawl sets with sea pen by-catch. Light grey polygons represent areas of significant concentrations of sea pens identified in Kenchington et al. (2010b). The blue area depicts an area of interest for a MPA. The comparative tow for Western IIA gear is circled in red and is very close to the video transects CON 33 and CON 34. One transect falls within the vicinity of research vessel trawls conducted with Campelen gear (CON 35) (Figure 39). The on bottom length of transect CON 35 is ~2297 m for a total area analyzed covering ~551 m 2. The total number of sea pens viewed was 109. This is represented by 40 Anthoptilum spp. (~37%), 10 Pennatula spp. (~9%), 58 Kophobelemnon spp. (~53%) and 1 Halipteris sp. (~1%). This proportion is applied to the predicted abundance in the swept area of the gear and converted to a biomass by using mean individual weights for each species. The concentration of sea pens for the area analyzed is ~ 0.2 sea pen / m 2 of bottom. The comparative 2009 research vessel trawl was made with a Campelen trawl as part of the Canadian research vessel surveys of the area. As noted previously, the best estimate of the swept area for this gear is 23,391 m 2. This area would then hold approximately 4,678 sea pens. Given the mean weights of Anthoptilum spp. of 32 g (n = 86), Pennatula aculeata of 3.5 g (n = 30), Halipteris finmarchica sp. 15 g (n=31), and Kophobelemnon stelliferum 0.5 g (n=50) (F. J. Murillo, E. Kenchington and V. Wareham pers. comm.) from the NRA, an in situ biomass can be estimated: of the roughly 4,678 sea pens impacted by the Campelen trawl swept area, 1731 are Anthoptilum spp. representing ~ 55 kg, 2479 are Kophebelemnon spp. representing ~1.2 kg, 421 are Pennatula spp. representing 1.5 kg, and 47 are Halipteris sp. representing 0.7 kg. The total sea pen biomass that could be potentially captured in the nearby research vessel trawl, based on these density estimates on transect CON 35, would be ~ 58 kg. Of these genera, Kophebelemnon spp. are rarely caught in trawls as they are capable of retracting in the sediment. However, they contribute very little to the overall biomass and so are left in the calculations. The total sea pen by-catch from the 2007 Canadian RV comparative trawl using Campelen gear was ~3 kg. This represents a 5.2 % gear efficiency for sea pens with a Campelen trawl.
 conducted in situ experiments on the sea whip Halipteris willemoesi off Alaska.")
45 45 Figure 39. Location of CON 35 in relation to the comparative research vessel trawl done with Campelen gear. Incidental Mortality Malecha and Stone (2009) conducted in situ experiments on the sea whip Halipteris willemoesi off Alaska. They simulated trawl disturbance and observed the response of the sea whips in situ over a period of about 1 yr in order to assess delayed mortality from sublethal injuries. Colonies of H. willemoesi were distressed in three ways which mimic the impacts of trawling: dislodgement, fracture of the axial rod, and soft tissue abrasion. Fifty percent of dislodged colonies demonstrated the ability to temporarily rebury their peduncles and recover to an erect position. However after one year most were in a prone position. None of the fractured colonies were able to repair their axial rods and only one was erect at the experiment s conclusion with a broken rod. Light tissue abrasion was less lethal and all colonies were able to remain erect with this damage. Tissue losses among the dislodged and fractured sea whips increased throughout the experimental period and were attributed to predation by the nudibranch Tritonia diomedea. This predator has a strong scavenging response to sea whips lying on the seafloor. Sea whips that are damaged or dislodged colonies are likely more vulnerable to predation. Heifetz et al. (2009), using underwater video, observed 40% of sea whips and sea pens damaged in areas below 340 m off the central Aleutian Islands of Alaska that had been classified as having high-intensity trawling. This compared with only 1% damaged in other areas with little or no fishing. However, an experimental study looking at the effect of the Nephrops creel fishery in Loch Broom, Scotland found that the three sea pens present, Virgularia mirabilis,pennatula phosphorea and Funiculina quadrangularis, were able to re-anchor themselves provided the basal peduncle remained in contact with the sediment surface, and mortality rates following experimental creel disturbance were very low (Kinnear et al. 1996). Troffe et al. (2005) reported damage to sea whips entangled in prawn trap sets where 50% of the entangled colonies were damaged and often broken above the peduncle. Soft tissue abrasion along the axial rod was also noted.
46 46 Recoverability Troffe et al. (2005) found no significant difference in the density of juvenile or adult sea whips after the first pass of a beam trawl, however other comparative studies have found significantly lower sea pen density in areas of high trawling intensity (Engel and Kvitek 1998, Hixon and Tissot 2007, Adey 2007), indicating an inability to recover in the face of continued fishing pressure. Information on age and growth is often used to estimate natural mortality or total mortality, which are key components in the calculation of important population and demographic parameters, such as population growth rates and generation times. The longevity of most sea pens is unknown. Despite their importance, published age and growth studies of sea pens are still scarce. Birkeland (1974) determined that the maximum age of the fleshy sea pen, Ptilosarcus gurneyi, in Puget Sound was about 15 years with sexual maturity at 5 or 6 years. P. gurneyi is a small, shallow water (to 70 m) west coast species similar in morphology and height to the Pennatula spp. in the NAFO area. In contrast, Wilson et al. (2002), working with the much larger and deeper-living sea whip, Halipteris willemoesi (maximum height in sample 167 cm) in Alaska, estimated longevity at about 50 years. He also noted a faster growth rate for medium-sized specimens compared with small and large-sized colonies. Sea pens are gonochoric at the colony level with a sex ratio of 1:1. They typically produce large lecithotrophic eggs (Chia and Crawford 1973, Edwards and Moore 2008) which in aquaria float to the surface (Chia and Crawford 1973). They all appear to be broadcast spawners and female fecundity is high ranging from approximately 30, ,000 oocytes per colony (Chia and Crawford 1973, Tyler et al. 1995, Soong 2005, Edwards and Moore 2008), although not all oocytes are released at one time. Spawning is annual in some species such as Ptilosarcus gurneyi (Chia and Crawford 1973) and Pennatula phosphorea (Edwards and Moore 2008), although other species such as Kophobelemnon stelliferum (Rice et al. 1992) and P. aculeata (Eckelbarger et al. 1998) show no reproductive seasonality and are likely continuous spawners. Birkeland (1974) also provided data on recruitment of P. gurneyi over a three year period in cleared plots. He manually cleared an area of a sea pen bed and then sampled the recruiting cohort for 3 years to determine growth rates (age-at-length) and validate the first three annual rings. Ptilosarcus guerneyi produces free-swimming planula larvae that do not feed and settle within seven days if a suitable substratum is encountered (Chia and Crawford 1973). Movement into the plots by drifting adults was low. Recruitment of juveniles occurred annually or every few years but was described as being highly clumped, spatially unpredictable and patchy. He estimated that 10-15% of the space within the sea pen field successfully recruited each year. Discrete size groups can be observed within the boundaries of the fields reflecting these recruitment events. Recruitment patches ranged from 20 to 200 m in length following an isobath. Large interannual differences in recruitment were also observed in Renilla kollikeri, a sea pen from the coast of California (Davis and Van Blaricom 1978). Move-on rules for Sea Pens NAFO has four areas closed to bottom-contact gear to protect sea pens on Flemish Cap. Sea pen fields in the NRA are concentrated in shallower water than the sponge grounds and so it is more difficult to establish a depth-based move-on rule option. Murillo et al. (2010) identified the location of significant locations of sea pens in the NRA from research vessel data. The threshold value for identification of sea pen fields was 0.5 kg. To determine the maximum distance that a vessel would have to move (either shallower or deeper), we calculated the centroid of each polygon in ARCGIS. The feature to point tool was used to get the centroid point location for each of the 6 polygons (Figure 40) (note a 7 th polygon was too small to do this calculation with). These area-specific move-on distances range from 4 km to 20 km or 2.4 to 10.7 nm. However, this may have the consequence of forcing the vessel off the fishing grounds, as the sea pen habitat is quite extensive. More work should be done on this issue to accommodate fishing activities while protecting the sea pen fields.
. Table 5.")
47 47 Figure 40. Location of significant area polygons for sea pens as presented in Murillo et al. (2010). For each line polgon the centroid is calculated and the distance to the closest edge was determined (Table 5). Table 5. Distances from the polygon centroid to the shallow leading edge as illustrated in Figure 39. Conclusions Distance from Centroid to Leading Edge Polygon Number (Figure 41) km (nm) (6.9) (2.4) (6.6) (10.7) (9.9) (6.8) Sea pen fields have been classified as vulnerable marine ecosystems by NAFO. In this report we recommend that a 7 kg encounter threshold of sea pens be put in place. If the 2010 VMS effort pattern is followed, this change would affect less than 0.5 % of fishing trawls in the fishing footprint. Although this encounter threshold value is small, it represents 100s of individuals and is shown to represent sea pen fields through our quantitative analyses based on
The Protection of Vulnerable Marine Ecosystems in the Northwest Atlantic: NAFO Processes and Regulations
 The Protection of Vulnerable Marine Ecosystems in the Northwest Atlantic: NAFO Processes and Regulations Dr. Ricardo Federizon Senior Fisheries Commission Coordinator Northwest Atlantic Fisheries Organization
SC WG ON THE ECOSYSTEM APPROACH TO FISHERIES MANAGEMENT MAY 2008
 NOT TO BE CITED WITHOUT PRIOR REFERENCE TO THE AUTHOR(S) Northwest Atlantic Fisheries Organization Serial No. N5612 NAFO SCR Doc. 08/79 SC WG ON THE ECOSYSTEM APPROACH TO FISHERIES MANAGEMENT MAY 2008
/ Advice May 2011
 1.5.1.3/1.5.4.1 Advice May 2011 ECOREGION SUBJECT General advice Update of cold-water coral and sponge maps and the information underpinning such maps on Vulnerable Marine Habitats (including Hatton and
CMM Conservation and Management Measure for the Management of Bottom Fishing in the SPRFMO Convention Area
 CMM 03-2018 1 Conservation and Management Measure for the Management of Bottom Fishing in the SPRFMO Convention Area The Commission of the South Pacific Regional Fisheries Management Organisation; RECOGNISING
The EU experience in implementation
 UN Workshop to discuss implementation of paragraphs 80 and 83 to 87 of resolution 61/105 and paragraphs 117 and 119 to 127 of resolution 64/72 in sustainable fisheries, addressing the impacts of bottom
Year Avg. TAC Can Others Totals
 SKATE IN DIVISIONS 3L, 3N, 3O AND SUBDIVISION 3Ps Background There are 8 to 1 species of skate in the waters around Newfoundland. Of these, thorny skate (Raja radiata) is by far the most common, comprising
New information regarding the impact of fisheries on other components of the ecosystem
 ICES Advice North Atlantic Ecoregion Published 20 June 2017 DOI: 10.17895/ices.pub.3059 New information regarding the impact of fisheries on other components of the ecosystem Advice summary ICES has received
Recommendations for the meeting of the North-East Atlantic Fisheries Commission 9-13 November 2009
 Recommendations for the meeting of the North-East Atlantic Fisheries Commission 9-13 November 2009 This Annual Meeting of the NEAFC Commission is the first meeting after the 31 st of December 2008 deadline
CMM Conservation and Management Measure for the Management of New and Exploratory Fisheries in the SPRFMO Convention Area.
 CMM 13-2016 1 Conservation and Management Measure for the Management of New and Exploratory Fisheries in the SPRFMO Convention Area. The Commission of the South Pacific Regional Fisheries Management Organisation;
Odd Aksel Bergstad Institute of Marine Research Norway
 Odd Aksel Bergstad Institute of Marine Research Norway Deep-sea field scientist since 1980s Member and former chair of relevant ICES expert groups Scientific delegate to NAFO, NEAFC, SEAFO. Contributor
ASSESSMENT OF THE WEST COAST OF NEWFOUNDLAND (DIVISION 4R) HERRING STOCKS IN 2011
 HERRING STOCKS IN 2011") Canadian Science Advisory Secretariat Science Advisory Report 212/24 ASSESSMENT OF THE WEST COAST OF NEWFOUNDLAND (DIVISION 4R) HERRING STOCKS IN 211 Context Figure 1. Map of unit areas of NAFO Division
Canadian Science Advisory Secretariat Science Advisory Report 212/24 ASSESSMENT OF THE WEST COAST OF NEWFOUNDLAND (DIVISION 4R) HERRING STOCKS IN 211 Context Figure 1. Map of unit areas of NAFO Division
Spurdog (Squalus acanthias) in the Northeast Atlantic
 in the Northeast Atlantic") ICES Advice on fishing opportunities, catch, and effort Northeast Atlantic Published 11 October 2016 9.3.17 Spurdog (Squalus acanthias) in the Northeast Atlantic ICES stock advice ICES advises that when
ICES Advice on fishing opportunities, catch, and effort Northeast Atlantic Published 11 October 2016 9.3.17 Spurdog (Squalus acanthias) in the Northeast Atlantic ICES stock advice ICES advises that when
High seas: conservation and management measures to prevent significant adverse impacts on vulnerable marine ecosystems
 High seas: conservation and management measures to prevent significant adverse impacts on vulnerable marine ecosystems ABSTRACT Australia has consented to implement the interim measures adopted in 2007
CMM on Management of New and Exploratory Fisheries in the SPRFMO Convention Area
 7 th Annual Meeting of the Commission 23-27 January, The Hague, The Netherlands COMM7-Prop11 Amend CMM 13-2016 on Management of New and Exploratory Fisheries in the SPRFMO Convention Area Submitted by:
THORNY SKATE IN DIVISIONS 3L, 3N, 3O AND SUBDIVISION 3Ps
 Newfoundland and Labrador Region Stock Status Report 2003/023 stomachs of skate captured in the vicinity of commercial fisheries. THORNY SKATE IN DIVISIONS 3L, 3N, 3O AND SUBDIVISION 3Ps Background There
A Combined Recruitment Index for Demersal Juvenile Cod in NAFO Divisions 3K and 3L
 NAFO Sci. Coun. Studies, 29: 23 29 A Combined Recruitment Index for Demersal Juvenile Cod in NAFO Divisions 3K and 3L David C. Schneider Ocean Sciences Centre, Memorial University St. John's, Newfoundland,
7 th Annual Meeting of the Commission January, The Hague, The Netherlands
 7 th Annual Meeting of the Commission 23-27 January, The Hague, The Netherlands COMM7-Prop14 Create New CMM on Exploratory Fishing for Toothfish in the SPRFMO Convention Area Submitted by: EUROPEAN UNION
Advice June 2012
 2.4.1 Advice June 212 ECOREGION STOCK Iceland and East Greenland Beaked redfish (Sebastes mentella) in Subareas V, XII, and XIV and NAFO Subareas 1+2 (Deep pelagic stock > 5 m) Advice for 213 The advice
Welsh Waters Scallop Strategy 28 th May Summary of research
 Welsh Waters Scallop Strategy 28 th May 2013 Summary of research Introduction This document describes the scallop research being conducted by Bangor University s Fisheries & Conservation Science Group
SUMMARY OF PRIORITY RECOMMENDATIONS
 Proposal for a regulation to manage deep-sea fisheries in the North-East Atlantic SUMMARY OF PRIORITY RECOMMENDATIONS October 2014 The European Commission released a proposal in July 2012 (COM(2012)0371)
Can trawling effort be identified from satellite-based VMS data?
 Not to be cited without prior reference to the author International Council for the Exploration of the Seas Theme session N: Technologies for monitoring fishing activities and observing catch Can trawling
SA2 + Div. 3K Redfish
 Fisheries and Oceans Pêches et Océans Canada Canada DFO Science Stock Status Report A2-15(21) entered the fishery in 1975 and averaged about 16,5 t from 1978-1986. The steady reduction in catches from
Paper prepared by the Secretariat
 COMMISSION FOURTEENTH REGULAR SESSION Manila, Philippines 3 7 December 2017 REFERENCE DOCUMENT FOR REVIEW OF CMM 2005-03 AND FOR THE DEVELOPMENT OF HARVEST STRATEGIES UNDER CMM 2014-06 North Pacific Albacore
Three different funding sources funded different facets of the research.
 Three different funding sources funded different facets of the research. In November 2014, the research team received monies from the N.C. Marine Fisheries Commission s Conservation Fund, with matching
PACIFIC BLUEFIN TUNA STOCK ASSESSMENT
 PACIFIC BLUEFIN TUNA STOCK ASSESSMENT SUMMARY 19-21 December 2012 Webinar PACIFIC BLUEFIN TUNA STOCK ASSESSMENT SUMMARY 1. Stock Identification and Distribution Pacific bluefin tuna (Thunnus orientalis)
17-06 BFT RECOMMENDATION BY ICCAT FOR AN INTERIM CONSERVATION AND MANAGEMENT PLAN FOR WESTERN ATLANTIC BLUEFIN TUNA
 17-06 BFT RECOMMENDATION BY ICCAT FOR AN INTERIM CONSERVATION AND MANAGEMENT PLAN FOR WESTERN ATLANTIC BLUEFIN TUNA RECALLING the Recommendation by ICCAT to Establish a Rebuilding Program for Western Atlantic
NEWFOUNDLAND REGION GROUNDFISH OVERVIEW
 DFO Science Stock Status Report A2-19 (1998) NEWFOUNDLAND REGION GROUNDFISH OVERVIEW Background In Newfoundland, Science Branch of the Department of Fisheries and Oceans is responsible, either directly
VME Encounter Protocols (VME indicators, thresholds and move-on-rules)
") VME Encounter Protocols (VME indicators, thresholds and move-on-rules) Comparative study: SEAFO+NAFO+CCAMLR T. Nishida SEAFO Representative (Only for 3 days) (South East Atlantic Fisheries Organization)
VME Encounter Protocols (VME indicators, thresholds and move-on-rules) Comparative study: SEAFO+NAFO+CCAMLR T. Nishida SEAFO Representative (Only for 3 days) (South East Atlantic Fisheries Organization)
Serial No. N4859 NAFO SCR Doc. 03/41 SCIENTIFIC COUNCIL MEETING JUNE 2003
 NOT TO BE CITED WITHOUT PRIOR REFERENCE TO THE AUTHOR(S) Northwest Atlantic Fisheries Organization Serial No. N4859 NAFO SCR Doc. 03/41 SCIENTIFIC COUNCIL MEETING JUNE 2003 Results of a Greenland Halibut
CMM on the Management of Bottom Fishing in the SPRFMO Convention Area
 Amend 7 th Annual Meeting of the Commission 23-27 January, The Hague, The Netherlands COMM7-Prop03 CMM 03-2018 on the Management of Bottom Fishing in the SPRFMO Convention Area Submitted by: AUSTRALIA
Pelagic fishery for Sebastes mentella in the Irminger Sea
 3.2.6.d Pelagic fishery for Sebastes mentella in the Irminger Sea The stock structure of deep-sea redfish S. mentella in Sub-area XII, Division Va and Sub-area XIV and NAFO Div. 1F remains generally uncertain.
Fishery Report 2017: Champsocephalus gunnari South Georgia (Subarea 48.3)
") Fishery Report 2017: Champsocephalus gunnari South Georgia (Subarea 48.3) FISHERY REPORT The map above shows the management areas within the CAMLR Convention Area, the specific region related to this report
Fishery Report 2017: Champsocephalus gunnari South Georgia (Subarea 48.3) FISHERY REPORT The map above shows the management areas within the CAMLR Convention Area, the specific region related to this report
Advice October 2013
 5.4.21.3 Advice October 213 ECOREGION Celtic Sea and West of Scotland STOCK Nephrops on Porcupine Bank (FU 16) Advice for 214 ICES advises on the basis of the MSY approach that catches from FU 16 in 214
Assessment Summary Report Gulf of Mexico Red Snapper SEDAR 7
 Assessment Summary Report Gulf of Mexico Red Snapper SEDAR 7 Stock Distribution: Red snapper are found throughout the Gulf of Mexico, the Caribbean Sea, and from the U.S. Atlantic Coast to northern South
Advice October 2012
 9.4.20 Advice October 2012 ECOREGION STOCK Widely distributed and migratory stocks Portuguese dogfish (Centroscymnus coelolepis) in the Northeast Atlantic Advice for 2013 and 2014 ICES advises on the basis
ERLING SVENSEN/ WWF-CANON. [Type text] Vigo, Spain, September 2014
![ERLING SVENSEN/ WWF-CANON. [Type text] Vigo, Spain, September 2014](/thumbs/95/124399139.jpg "ERLING SVENSEN/ WWF-CANON. [Type text] Vigo, Spain, September 2014") ERLING SVENSEN/ WWF-CANON [Type text] Vigo, Spain, 22-26 September 2014 At NAFO s 2014 Annual Meeting (AM), WWF will be calling for the adoption of scientifically sound conservation and management measures
ERLING SVENSEN/ WWF-CANON [Type text] Vigo, Spain, 22-26 September 2014 At NAFO s 2014 Annual Meeting (AM), WWF will be calling for the adoption of scientifically sound conservation and management measures
Why has the cod stock recovered in the North Sea?
 Why has the cod stock recovered in the North Sea? Summary The expansion of European fisheries during the 1970s and 1980s resulted in high fishing pressure on stocks of cod, haddock, whiting and saithe
Sourced from:
 Catch Comparison trials using a 400mm Square Mesh Panel Louise Jones SFF Data Analyst Sourced from: http://www.worldfishingtoday.com/newbuildings/default.asp?nyid=621277 Summary: The 400mm SMP alone is
NAFO/ICES PANDALUS ASSESSMENT GROUP MEETING OCTOBER An overview of Norwegian investigations of the shrimp stock off East Greenland in
 NOT TO BE CITED WITHOUT PRIOR REFERENCE TO THE AUTHOR(S) Northwest Atlantic Fisheries Organization Serial No. N5595 NAFO SCR Doc. 08/063 NAFO/ICES PANDALUS ASSESSMENT GROUP MEETING OCTOBER 2008 An overview
Map Showing NAFO Management Units
 Map Showing NAFO Management Units Unique biological characteristics dark coloration on both sides compared to almost all other flatfish species left eye not fully migrated giving it an unusually wide
Haddock (Melanogrammus aeglefinus) in divisions 7.b k (southern Celtic Seas and English Channel)
 in divisions 7.b k (southern Celtic Seas and English Channel)") ICES Advice on fishing opportunities, catch, and effort Celtic Seas, Greater North Sea, and Oceanic Northeast Atlantic ecoregions Published 29 June 2018 https://doi.org/10.17895/ices.pub.4453 Haddock (Melanogrammus
ICES Advice on fishing opportunities, catch, and effort Celtic Seas, Greater North Sea, and Oceanic Northeast Atlantic ecoregions Published 29 June 2018 https://doi.org/10.17895/ices.pub.4453 Haddock (Melanogrammus
ICES WGCSE REPORT
 ICES WGCSE REPORT 2009 291 6 Irish Sea 6.1 Area overview Description of fisheries Fishing effort and vessel numbers within the Irish Sea have declined in recent years by around 28% and 15% respectively
Advice June 2014
 5.3.23 Advice June 2014 ECOREGION STOCK Celtic Sea and West of Scotland Plaice in Division VIIa (Irish Sea) Advice for 2015 Based on ICES approach to data-limited stocks, ICES advises that catches should
Protecting the Deep Sea Under International Law. Legal Options for Addressing High Seas Bottom Trawling
 Protecting the Deep Sea Under International Law Legal Options for Addressing High Seas Bottom Trawling Extract Only: Full Paper Full paper available at http://www.savethehighseas.org/publications.cfm or
92 ND MEETING DOCUMENT IATTC-92 INF-C
 INTER-AMERICAN TROPICAL TUNA COMMISSION 92 ND MEETING Mexico City, Mexico 24-28 July 2017 DOCUMENT IATTC-92 INF-C POTENTIAL EFFECTS ON TUNA STOCKS OF ALTERNATIVE MANAGEMENT SCHEMES At the request of a
ICCAT Secretariat. (10 October 2017)
") ICCAT Secretariat (10 October 2017) Bluefin tuna: Background information Managed by International Commission for the Conservation of Atlantic Tunas (ICCAT): Two stocks (mixing occurring, but extent not
ICCAT Secretariat (10 October 2017) Bluefin tuna: Background information Managed by International Commission for the Conservation of Atlantic Tunas (ICCAT): Two stocks (mixing occurring, but extent not
NAFO s Experience in addressing the impact of bottom fisheries on
 Northwest Atlantic Fisheries Organization (NAFO) NAFO s Experience in addressing the impact of bottom fisheries on VMEs UN Workshop on the implementation of UNGA Resolutions 61/105 and 64/72 15-16 September
Bottom Fishery Impact Assessment Standard
 Bottom Fishery Impact Assessment Standard Contents 1. Introduction... 3 2. Purpose of the Standard... 4 3. Area of Application... 4 4. Bottom Fishery Impact Assessment Process... 5 5. Bottom Fishing Impact
Special request, Advice June New information regarding the impact of fisheries on other components of the ecosystem
 1.5.1.2 Special request, Advice June 2013 ECOREGION SUBJECT General advice New information regarding the impact of fisheries on other components of the ecosystem Advice summary ICES advises that the following
Using the overlap of predicted cold-water coral habitat and bottom-contact fisheries to identify VMEs in British Columbia, Canada
 Using the overlap of predicted cold-water coral habitat and bottom-contact fisheries to identify VMEs in British Columbia, Canada PICES, October 29, 2010 Jessica L. Finney, IM Côté, RM Peterman, EJ Gregr
7TH ANNUAL MEETING OF THE COMMISSION
 7TH ANNUAL MEETING OF THE COMMISSION 23-27 January 2019, The Hague, The Netherlands COMM7-Prop15.1 Background document: A Proposal for a research fishing Conservation and Management Measure for SPRFMO
HADDOCK ON THE SOUTHERN SCOTIAN SHELF AND IN THE BAY OF FUNDY (DIV. 4X/5Y)
") Canadian Science Advisory Secretariat Science Advisory Report 26/47 HADDOCK ON THE SOUTHERN SCOTIAN SHELF AND IN THE BAY OF FUNDY (DIV. 4X/5Y) Context Haddock (Melanogrammus aeglefinus) are found on both
Canadian Science Advisory Secretariat Science Advisory Report 26/47 HADDOCK ON THE SOUTHERN SCOTIAN SHELF AND IN THE BAY OF FUNDY (DIV. 4X/5Y) Context Haddock (Melanogrammus aeglefinus) are found on both
Bycatch accounting and management in the Ross Sea toothfish fishery
 Bycatch accounting and management in the Ross Sea toothfish fishery Steve Parker Sophie Mormede Stuart Hanchet New Zealand Ross Sea Region 4.5 million km 2 of ocean High seas fishery Managed by CCAMLR
Trials of a Net Grid for the UK Nephrops trawl fisheries
 Trials of a Net Grid for the UK Nephrops trawl fisheries Tom Catchpole, Frank Armstrong, Stuart Masson, Dave Price, Mark O Brien & John Hingley June 2012 This work was funded by Defra Executive Summary
CCAMLR s ecosystem approach to managing Antarctic fisheries
 CCMLR s ecosystem approach to managing ntarctic fisheries ndrew Wright Eecutive Secretary CCMLR Secretariat This presentation bout CCMLR History of ntarctic fishing The role of data Institutional structure
ASSESSMENT OF SCALLOPS (PLACOPECTEN MAGELLANICUS) IN SCALLOP FISHING AREA (SFA) 29 WEST OF LONGITUDE 65 30'W
 IN SCALLOP FISHING AREA (SFA) 29 WEST OF LONGITUDE 65 30'W") Canadian Science Advisory Secretariat Science Advisory Report 2013/055 ASSESSMENT OF SCALLOPS (PLACOPECTEN MAGELLANICUS) IN SCALLOP FISHING AREA (SFA) 29 WEST OF LONGITUDE 65 30'W Figure 1. Location of
Canadian Science Advisory Secretariat Science Advisory Report 2013/055 ASSESSMENT OF SCALLOPS (PLACOPECTEN MAGELLANICUS) IN SCALLOP FISHING AREA (SFA) 29 WEST OF LONGITUDE 65 30'W Figure 1. Location of
Application of a New Method for Monitoring Lake Trout Abundance in Yukon: Summer Profundal Index Netting (SPIN)
") Application of a New Method for Monitoring Lake Trout Abundance in Yukon: Summer Profundal Index Netting (SPIN) Prepared by: Lars Jessup Nathan Millar November 2011 Application of a New Method for Monitoring
Application of a New Method for Monitoring Lake Trout Abundance in Yukon: Summer Profundal Index Netting (SPIN) Prepared by: Lars Jessup Nathan Millar November 2011 Application of a New Method for Monitoring
Ecosystem-based Science for Management of Alaskan Fisheries. Patricia A. Livingston NOAA-Fisheries Alaska Fisheries Science Center Seattle, WA, USA
 Ecosystem-based Science for Management of Alaskan Fisheries Patricia A. Livingston NOAA-Fisheries Alaska Fisheries Science Center Seattle, WA, USA Overview Background on ecosystem research and ecosystem
Sustainable deep-sea fisheries and environmental conservation: how can we balance conflicting objectives?
 Sustainable deep-sea fisheries and environmental conservation: how can we balance conflicting objectives? Malcolm Clark 1 and Matt Dunn 2 PICES annual meeting, Qingdao, China, October 2015 1: NIWA 2: now
STECF EXPERT WORKING GROUP EWG 18-09
 STECF EXPERT WORKING GROUP EWG 18-09 on a fishing effort regime for demersal fisheries in the western Mediterranean Sea 18-22 June 2018, Arona, Italy DG MARE focal point: Amanda Perez Perera Chair: Clara
Modify Federal Regulations for Swordfish Trip Limits the Deep-set Tuna Longline Fishery. Decision Support Document November 2010
 Agenda Item J.2.a Attachment 2 November 2010 Modify Federal Regulations for Trip Limits the Deep-set Tuna Longline Fishery (Action Pursuant to Modification of Routine Management Measures under the Framework
Black Sea Bass Encounter
 Black Sea Bass Encounter Below is an adaptation of the Shark Encounter (Lawrence Hall of Science: MARE 2002) lesson plan to be about Black Sea Bass and to incorporate information learned from Dr. Jensen
82 ND MEETING RESOLUTION C RESOLUTION TO MITIGATE THE IMPACT ON SEABIRDS OF FISHING FOR SPECIES COVERED BY THE IATTC
 INTER-AMERICAN TROPICAL TUNA COMMISSION 82 ND MEETING LA JOLLA, CALIFORNIA (USA) 4 8 JULY 2011 RESOLUTION C-11-02 RESOLUTION TO MITIGATE THE IMPACT ON SEABIRDS OF FISHING FOR SPECIES COVERED BY THE IATTC
Understanding shelf-break habitat for sustainable management of fisheries with spatial overlap
 Understanding shelf-break habitat for sustainable management of fisheries with spatial overlap Alan Williams Caleb Gardner Franziska Althaus Bruce Barker David Mills Final Report to the Fisheries Research
Plaice (Pleuronectes platessa) in Division 7.e (western English Channel)
 in Division 7.e (western English Channel)") Celtic Seas and Greater North Sea ecoregions Published 30 June 2016 Version 2: 15 May 2017 5.3.51 Plaice (Pleuronectes platessa) in Division 7.e (western English Channel) ICES stock advice ICES advises
Celtic Seas and Greater North Sea ecoregions Published 30 June 2016 Version 2: 15 May 2017 5.3.51 Plaice (Pleuronectes platessa) in Division 7.e (western English Channel) ICES stock advice ICES advises
Submission on summary of the Draft Convention on Biological Diversity National Report
 23 November 2018 Submission on summary of the Draft Convention on Biological Diversity National Report The New Zealand Marine Sciences Society (NZMSS) is a professional society affiliated to the Royal
3.4.3 Advice June Barents Sea and Norwegian Sea Cod in Subareas I and II (Norwegian coastal waters cod)
") 3.4.3 Advice June 2013 ECOREGION STOCK Barents Sea and Norwegian Sea Cod in Subareas I and II (Norwegian coastal waters cod) Advice for 2014 ICES advises on the basis of the Norwegian rebuilding plan,
3.4.3 Advice June 2013 ECOREGION STOCK Barents Sea and Norwegian Sea Cod in Subareas I and II (Norwegian coastal waters cod) Advice for 2014 ICES advises on the basis of the Norwegian rebuilding plan,
Fishery Report 2017: Dissostichus spp. (Subarea 48.2)
") Fishery Report 2017: Dissostichus spp. (Subarea 48.2) FISHERY REPORT The map above shows the management areas within the CAMLR Convention Area, the specific region related to this report is shaded. Throughout
Fishery Report 2017: Dissostichus spp. (Subarea 48.2) FISHERY REPORT The map above shows the management areas within the CAMLR Convention Area, the specific region related to this report is shaded. Throughout
ATLANTIC STATES MARINE FISHERIES COMMISSION. Winter Flounder Abundance and Biomass Indices from State Fishery-Independent Surveys
 ATLANTIC STATES MARINE FISHERIES COMMISSION Winter Flounder Abundance and Biomass Indices from State Fishery-Independent Surveys Technical Committee Report to the Winter Flounder Management Board February
Advice June, revised September Herring in Division IIIa and Subdivisions (Western Baltic spring spawners)
") 6.4.15 Advice June, revised September 21 ECOREGION STOCK North Sea and Baltic Herring in Division IIIa and Subdivisions 22 24 (Western Baltic spring spawners) Advice for 211 Management Objective (s) Catches
6.4.15 Advice June, revised September 21 ECOREGION STOCK North Sea and Baltic Herring in Division IIIa and Subdivisions 22 24 (Western Baltic spring spawners) Advice for 211 Management Objective (s) Catches
Summary of Research within Lamlash Bay No-Take Zone - Science report for COAST July
 Summary of Research within Lamlash Bay No-Take Zone - Science report for COAST July 2013 - *Picture of a spider crab (Macropodia spp) inside a plumose anemone. Taken within Lamlash Bay No-Take Zone by
Undulate ray (Raja undulata) in divisions 8.a b (northern and central Bay of Biscay)
 in divisions 8.a b (northern and central Bay of Biscay)") ICES Advice on fishing opportunities, catch, and effort Bay of Biscay and the Iberian Coast Ecoregion Published July 13 2018 https://doi.org/10.17895/ices.pub.4502 Undulate ray (Raja undulata) in divisions
ICES Advice on fishing opportunities, catch, and effort Bay of Biscay and the Iberian Coast Ecoregion Published July 13 2018 https://doi.org/10.17895/ices.pub.4502 Undulate ray (Raja undulata) in divisions
Evolution of Deepwater Coral Protection in the Southeast U.S
 Evolution of Deepwater Coral Protection in the Southeast U.S Tina Udouj, Florida Fish and Wildlife Conservation Commission Roger Pugliese, South Atlantic Fishery Management Council Overview Deepwater Corals
Annual Pink Shrimp Review
 Annual Pink Shrimp Review Oregon Department of Fish and Wildlife ODFW Marine Region, Marine Science Dr., Bldg. #3, Newport, OR 97365 (503) 867-4741 TO: FROM: OREGON SHRIMP INDUSTRY BOB HANNAH, PINK SHRIMP
R.P. Prabath K. JAYASINGHE National Aquatic Resources Research and Development Agency (NARA) Colombo 15 SRI LANKA
 Colombo 15 SRI LANKA") Experience and the special requirements of Sri Lanka in addressing the impacts of bottom fisheries on vulnerable marine ecosystems and the long-term sustainability of deep-sea fish stocks in particular
Experience and the special requirements of Sri Lanka in addressing the impacts of bottom fisheries on vulnerable marine ecosystems and the long-term sustainability of deep-sea fish stocks in particular
Red Sea bream in Subareas VI, VII and VIII
 Stock Annex; Red Sea bream in Subareas VI, VII and VIII Stock specific documentation of standard assessment procedures used by ICES. Stock sbr-678_sa Working Group Red Sea bream (Pagellus bogaraveo) in
Advice June Sole in Division IIIa and Subdivisions (Skagerrak, Kattegat, and the Belts)
") 6.3.26 Advice June 2014 ECOREGION STOCK North Sea Sole in Division IIIa and Subdivisions 22 24 (Skagerrak, Kattegat, and the Belts) Advice for 2015 ICES advises on the basis of the MSY approach that catches
6.3.26 Advice June 2014 ECOREGION STOCK North Sea Sole in Division IIIa and Subdivisions 22 24 (Skagerrak, Kattegat, and the Belts) Advice for 2015 ICES advises on the basis of the MSY approach that catches
TAC Reported Landings * - By-catch only
 DFO Atlantic Fisheries Stock Status Report 96/68E 4Vn 3Ps 4W 4Vs EASTERN SCOTIAN SHELF HADDOCK Background Haddock on the eastern Scotian Shelf and southern Gulf of St. Lawrence are considered as a single
Falmouth and St.Austell pspa bird bycatch analysis report year
 Natural England Commissioned Report NECR231 Falmouth and St.Austell pspa bird bycatch analysis report year 1-2014 First published 20 April 2017 www.gov.uk/natural-england Foreword Natural England commission
9.4.5 Advice September Widely distributed and migratory stocks Herring in the Northeast Atlantic (Norwegian spring-spawning herring)
") 9.4.5 Advice September 212 ECOREGION STOCK Widely distributed and migratory stocks Herring in the Northeast Atlantic (Norwegian spring-spawning herring) Advice for 213 ICES advises on the basis of the
9.4.5 Advice September 212 ECOREGION STOCK Widely distributed and migratory stocks Herring in the Northeast Atlantic (Norwegian spring-spawning herring) Advice for 213 ICES advises on the basis of the
A8-0377/
 9.1.2018 A8-0377/ 001-026 AMDMTS 001-026 by the Committee on Fisheries Report Linnéa Engström A8-0377/2017 Management, conservation and control measures applicable in the Convention Area of the South Pacific
11th Meeting of the Science Working Group. Lima, Peru, October SWG-11-12a. New Zealand SPRFMO Observer Implementation Report for 2011
 11th Meeting of the Science Working Group Lima, Peru, 15-19 October 2012 New Zealand SPRFMO Observer Implementation Report for 2011 Ministry for Primary Industries, New Zealand This report constitutes
Fisheries of the Caribbean, Gulf of Mexico, and South Atlantic; Reef Fish Fishery of Puerto Rico and the U.S. Virgin Islands;
 This document is scheduled to be published in the Federal Register on 06/11/2018 and available online at https://federalregister.gov/d/2018-12420, and on FDsys.gov BILLING CODE: 3510-22-P DEPARTMENT OF
ICES advice on fishing opportunities. ICES advises that when the MSY approach is applied, total removals in 2018 should be no more than 880 tonnes.
 ICES Advice on fishing opportunities, catch, and effort Celtic Seas and Greater North Sea ecoregions bss.27.4bc7ad-h Published 29 June 2018 Version 2: 2 July 2018 https://doi.org/10.17895/ices.pub.4472
ICES Advice on fishing opportunities, catch, and effort Celtic Seas and Greater North Sea Ecoregions Published 24 October 2017
 ICES Advice on fishing opportunities, catch, and effort Celtic Seas and Greater North Sea Ecoregions Published 24 October 2017 DOI: 10.17895/ices.pub.3334 Seabass (Dicentrarchus labrax) in divisions 4.b
STOCK STATUS OF SOUTHERN BLUEFIN TUNA
 7 th Expert Consultation on Indian Ocean Tunas, Victoria, Seychelles, 9-14 November, 1998 STOCK STATUS OF SOUTHERN BLUEFIN TUNA Tsuji, S. 1 Introduction The Commission for the Conservation of Southern
Norway lobster (Nephrops norvegicus) in Division 4.b, Functional Unit 6 (central North Sea, Farn Deeps)
 in Division 4.b, Functional Unit 6 (central North Sea, Farn Deeps)") ICES Advice on fishing opportunities, catch, and effort Greater North Sea Ecoregion Published 14 November 2018 https://doi.org/10.17895/ices.pub.4619 Norway lobster (Nephrops norvegicus) in Division 4.b,
ICES Advice on fishing opportunities, catch, and effort Greater North Sea Ecoregion Published 14 November 2018 https://doi.org/10.17895/ices.pub.4619 Norway lobster (Nephrops norvegicus) in Division 4.b,
Map Showing NAFO Management Units
 Map Showing NAFO Management Units Biology Are 6 species of seals in Atlantic Canadian waters, all of which occur in Newfoundland Two Arctic Species (Ringed, Bearded) Two temperate (Grey, Harbour) Two migratory
ECAS 3 rd Periodic Activity Report; Publishable summary
 ECAS 3 rd Periodic Activity Report; Publishable summary Grant Agreement number: 312088 Project acronym: BENTHIS Project title: Funding Scheme: Collaborative project Project coordination: IMARES, IJmuiden,
SCIENTIFIC COUNCIL MEETING - JUNE An Assessment of the Cod Stock in NAFO Division 3M. A. Vazquez
 NOT TO BE CITED WITHOUT PRIOR REFERENCE TO THE AUTHOR(S) Northwest Atlantic Fisheries Organization Serial No. N2433 NAFO SCR Doc. 94/62 SCIENTIFIC COUNCIL MEETING - JUNE 1994 An Assessment of the Cod Stock
SMOOTH HAMMERHEAD SHARK (HHS)
") SMOOTH HAMMERHEAD SHARK (HHS) (Sphyrna zygaena) HHS1 1. FISHERY SUMMARY Smooth hammerhead sharks (Sphyrna zygaena) are not currently managed under the QMS. No assigned fishing allowances exist. However,
SMOOTH HAMMERHEAD SHARK (HHS) (Sphyrna zygaena) HHS1 1. FISHERY SUMMARY Smooth hammerhead sharks (Sphyrna zygaena) are not currently managed under the QMS. No assigned fishing allowances exist. However,
REDFISH in Sub-areas I and II. Nominal catch (t) by countries in Sub-area I, Divisions IIa and IIb combined as officially reported to ICES.
 by countries in Sub-area I, Divisions IIa and IIb combined as officially reported to ICES.") .1. Redfish in Sub-areas I and II Table.1..1 REDFISH in Sub-areas I and II. Nominal catch (t) by countries in Sub-area I, Divisions IIa and IIb combined as officially reported to ICES. Year Can Den Faroe
.1. Redfish in Sub-areas I and II Table.1..1 REDFISH in Sub-areas I and II. Nominal catch (t) by countries in Sub-area I, Divisions IIa and IIb combined as officially reported to ICES. Year Can Den Faroe
SCIENTIFIC COUNCIL MEETING - JUNE Yellowtail flounder in Divisions 3LNO - an assessment update
 NOT TO BE CITED WITHOUT PRIOR REFERENCE TO THE AUTHOR(S) Northwest Atlantic Fisheries Organization Seria No,N835 NAFO SCR Doc. 8/VI/9 SCIENTIFIC COUNCIL MEETING - JUNE 198 Yellowtail flounder in Divisions
Saithe (Pollachius virens) in subareas 4 and 6, and in Division 3.a (North Sea, Rockall and West of Scotland, Skagerrak and Kattegat)
 in subareas 4 and 6, and in Division 3.a (North Sea, Rockall and West of Scotland, Skagerrak and Kattegat)") ICES Advice on fishing opportunities, catch, and effort Celtic Seas, Faroes, and Greater North Sea Ecoregions Published 30 June 2017 DOI: 10.17895/ices.pub.3206 Saithe (Pollachius virens) in subareas 4
ICES Advice on fishing opportunities, catch, and effort Celtic Seas, Faroes, and Greater North Sea Ecoregions Published 30 June 2017 DOI: 10.17895/ices.pub.3206 Saithe (Pollachius virens) in subareas 4
SCIENTIFIC COUNCIL MEETING JUNE Assessment of Demersal Redfish in NAFO Subarea 1
 NOT TO BE CITED WITHOUT PRIOR REFERENCE TO THE AUTHOR(S) Northwest Atlantic Fisheries Organization Serial No. N5126 NAFO SCR Doc. 5/4 SCIENTIFIC COUNCIL MEETING JUNE 25 Assessment of Demersal Redfish in
European Fisheries Fund Project. Sustainable Use of Fisheries Resources in Welsh Waters
 European Fisheries Fund Project Sustainable Use of Fisheries Resources in Welsh Waters Welsh Waters Scallop Strategy Industry working group meeting 1 st February 2013 Sustainable Use of Fisheries Resources
Risk Assessments in the Pacific Fisheries for BC & Yukon
 Risk Assessments in the Pacific Fisheries for BC & Yukon MARCH, 2017 CONTENTS Introduction to Risk Assessments... 2 Q&As on the Risk Assessment Process... 3 Overview of the Risk Assessment Tool... 4 Example
Draft Discussion Document. May 27, 2016
 Draft Discussion Document May 27, 2016 Action to consider modifications to the sub-acl of GB haddock allocated to the Atlantic herring fishery and associated accountability measures AP/ CMTE Input 1. Review
Norway lobster (Nephrops norvegicus) in Division 4.a, Functional Unit 7 (northern North Sea, Fladen Ground)
 in Division 4.a, Functional Unit 7 (northern North Sea, Fladen Ground)") ICES Advice on fishing opportunities, catch, and effort Greater North Sea Ecoregion Published 11 November 2016 6.3.27 (update) Norway lobster (Nephrops norvegicus) in Division 4.a, Functional Unit 7 (northern
ICES Advice on fishing opportunities, catch, and effort Greater North Sea Ecoregion Published 11 November 2016 6.3.27 (update) Norway lobster (Nephrops norvegicus) in Division 4.a, Functional Unit 7 (northern
7 th Annual Meeting of the Commission January, The Hague, The Netherlands
 7 th Annual Meeting of the Commission 23 27 January, The Hague, The Netherlands COMM7 Report ANNEX 7a CMM for the Management of Bottom Fishing in the SPRFMO Convention Area (COMM 7 Prop 03_Rev4) The Commission