SA 2. Stock assessment of bigeye tuna in the western and central Pacific Ocean. SCTB17 Working Paper
|
|
|
- Marcia Dickerson
- 6 years ago
- Views:
Transcription


1 SCTB17 Working Paper SA 2 Stock assessment of bigeye tuna in the western and central Pacific Ocean John Hampton 1, Pierre Kleiber 2, Adam Langley 1, and Kazuhiko Hiramatsu 3 1 Oceanic Fisheries Programme, Secretariat of the Pacific Community, Noumea, New Caledonia 2 Pacific Islands Fishery Science Center, National Marine Fisheries Service, Honolulu, Hawaii 3 National Research Institute of Far Seas Fisheries, Shimizu, Japan July 2004
2 Table of Contents Executive summary Introduction Background Biology Fisheries Data compilation Spatial stratification Temporal stratification Definition of fisheries Catch and effort data Length-frequency data Weight-frequency data Tagging data Model description structural assumptions, parameterisation, and priors Population dynamics Recruitment Initial population Growth Movement Natural mortality Fishery dynamics Selectivity Catchability Effort deviations Dynamics of tagged fish Tag mixing Tag reporting Observation models for the data Parameter estimation Stock assessment interpretation methods Fishery impact Yield analysis and projections Sensitivity analyses Results Fit statistics and convergence Fit diagnostics (SHBS-MEST) Model parameter estimates (SHBS-MEST) Growth i
3 6.3.2 Natural mortality Movement Selectivity Catchability Tag-reporting rates Stock assessment results Recruitment Biomass Fishing mortality Fishery impact Yield analysis Projections Discussion and conclusions Acknowledgements References Appendix A: doitall.bet...a1 Appendix B: bet.ini...b1 ii
4 Executive summary This paper presents the 2004 assessment of bigeye tuna in the western and central Pacific Ocean. The assessment uses the stock assessment model and computer software known as MULTIFAN-CL. The bigeye tuna model is age (40 age-classes) and spatially structured (5 regions) and the catch, effort, size composition and tagging data used in the model are classified by 17 fisheries and quarterly time periods from 1950 through The last 4 5 years (depending on the fishery) constitute a projection period in which the last year s fishing effort for each fishery is assumed to continue into the future. Five independent analyses are conducted to test the impact of using different methods of standardising fishing effort in the main longline fisheries, using estimated or assumed values of natural mortality-at-age, and assuming fixed or variable catchability for the main longline fisheries. The analyses conducted are: SHBS-MEST SHBS-MEST-LLq SHBS-MFIX GLM-MEST GLM-MFIX Statistical habitat-based standardised effort for LL1 LL5, M-at-age estimated, constant catchability for LL1 LL5. Statistical habitat-based standardised effort for LL1 LL5, M-at-age estimated, catchability for LL1 LL5 allowed to vary independently over time, but with the initial catchability constrained to be equal. Statistical habitat-based standardised effort for LL1 LL5, M-at-age assumed at fixed levels, constant catchability for LL1 LL5. General linear model standardised effort for LL1 LL5, M-at-age estimated, constant catchability for LL1 LL5. General linear model standardised effort for LL1 LL5, M-at-age assumed at fixed levels, constant catchability for LL1 LL5. The data used in the assessment were the same as those used last year, with the exception that pre-1965 Japanese longline size composition data became available recently and were used in the assessment, and an additional year of fishery data (2002 for longline, 2002 for Philippines and Indonesia, 2003 for purse seine) was included. The SHBS- and GLM-based analyses for which catchability in the main longline fisheries was assumed constant produced results that were broadly comparable to those of the 2003 assessment. Recruitment showed an increasing trend from the 1970s on, while biomass declined through the 1960s and 1970s after which it was relatively stable or declining slightly. The fisheries are estimated to have reduced overall biomass to around 40% of unfished levels by 2003, with impacts more severe in the equatorial region of the WCPO, particularly in the west. Yield analyses suggest that recent average fishing mortality-at-age is approximately equivalent to the fishing mortality at Maximum Sustainable Yield (MSY), although the probability distribution of F current FMSY is skewed such that the probability of the ratio being greater than 1.0 (i.e. overfishing is occurring) is , depending on assumptions regarding the stock-recruitment steepness coefficient. On the other hand, the current level of biomass is estimated to be high, around times the equilibrium biomass expected at MSY. Current biomass has remained high because of above average recruitment since about The analysis in which catchability in the main longline fisheries was allowed to vary over time produced more pessimistic results than the constant catchability models absolute levels of recruitment and biomass are lower (although the trends are similar), fishing mortality and fishery impact are higher, and recent average levels of fishing mortality are estimated to substantially exceed MSY levels ( F current FMSY =1.7). Current biomass is estimated to exceed the MSY level ( B current BMSY = 1.25) but is at a lower level than estimated by the constant longline catchability models. 1
5 At this stage, we regard the variable longline catchability model as experimental more work is required to evaluate its characteristics so that some judgments can be made regarding its use in evaluating stock status. We include it in this assessment as a sensitivity analysis to indicate the impact that structural assumptions can have on stock assessment results. On the basis of all of the results presented in the assessment, we conclude that maintenance of current levels of fishing mortality carries a high risk of overfishing. Should recruitment fall to average levels, current catch levels would result in stock reductions to near and possibly below MSY-based reference points. Reduction of juvenile fishing mortality in the equatorial regions would have significant benefits for both the bigeye tuna stock and the longline fishery. 1 Introduction This paper presents the current stock assessment of bigeye tuna (Thunnus obesus) in the western and central Pacific Ocean (WCPO, west of 150 W). The overall objectives of the assessment are to estimate population parameters, such as time series of recruitment, biomass and fishing mortality, that indicate the status of the stock and impacts of fishing. We also summarise stock status in terms of well-known reference points, such as the ratios of recent stock biomass to the biomass at maximum sustainable yield ( B current BMSY ) and recent fishing mortality to the fishing mortality at MSY ( F current FMSY ). Likelihood profiles of these ratios are used to describe their uncertainty, and the probability that they exceed overfishing benchmarks is noted. The underlying methodology used for the assessment is that commonly known as MULTIFAN-CL (Fournier et al. 1998; Hampton and Fournier 2001; Kleiber et al. 2003; which is software that implements a size-based, age- and spatiallystructured population model. Parameters of the model are estimated by maximizing an objective function consisting of both likelihood (data) and prior information components. 2 Background 2.1 Biology Bigeye tuna are distributed throughout the tropical and sub-tropical waters of the Pacific Ocean. There is little information on the extent of mixing across this wide area. Analysis of mtdna and DNA microsatellites in nearly 800 bigeye tuna failed to reveal significant evidence of widespread population subdivision in the Pacific Ocean (Grewe and Hampton 1998). While these results are not conclusive regarding the rate of mixing of bigeye tuna throughout the Pacific, they are broadly consistent with the results of SPC s tagging experiments on bigeye tuna. Bigeye tuna tagged in locations throughout the western tropical Pacific have displayed movements of up to 4,000 nautical miles (Figure 1) over periods of one to several years, indicating the potential for gene flow over a wide area; however, the large majority of tag returns were recaptured much closer to their release points. Also, recent tagging experiments in the eastern Pacific Ocean (EPO) using archival tags have so far not demonstrated long-distance migratory behaviour (Schaefer and Fuller 2002) over relatively short time scales (up to 2 years). In view of these results, stock assessments of bigeye tuna are routinely undertaken for the WCPO and EPO separately 1. Bigeye tuna are relatively fast growing, and have a maximum fork length (FL) of about 200 cm. The growth of juveniles departs from von Bertalanffy type growth with the growth rate slowing 1 Efforts also continue to develop a bigeye tuna model for the Pacific Ocean as a whole, incorporating spatial structure into the analysis to allow for the possibility of restricted movement between some areas. For the 2003 assessment (Hampton et al. 2003), the Pacific-wide model gave very similar results to both the WCPO and EPO assessments. The Pacific-wide model has not been re-run this year, but will continue to be developed as a research and possible management tool. 2
6 between about 40 and 70 cm FL (Lehodey et al. 1999). The natural mortality rate is likely to be variable with size, with the lower rates of around 0.5 yr -1 for bigeye >40 cm FL (Hampton 2000). Tag recapture data indicate that significant numbers of bigeye reach at least eight years of age. The longest period at liberty for a recaptured bigeye tuna tagged in the western Pacific at about 1 2 years of age is currently 12 years (Hampton and Williams 2004). 2.2 Fisheries Bigeye tuna are an important component of tuna fisheries throughout the Pacific Ocean and are taken by both surface gears, mostly as juveniles, and longline gear, as valuable adult fish. They are a principal target species of both the large, distant-water longliners from Japan and Korea and the smaller, fresh sashimi longliners based in several Pacific Island countries. Prices paid for both frozen and fresh product on the Japanese sashimi market are the highest of all the tropical tunas. Bigeye tuna are the cornerstone of the tropical longline fishery in the WCPO; the catch in the SPC area had a landed value in 2001 of approximately US$1 billion. Since 1980, the longline catch of bigeye tuna in the WCPO has varied between 40,000 and 82,000 t (Figure 2), with the record high catch being taken in Since about 1994, there has been a rapid increase in purse-seine catches of juvenile bigeye tuna, first in the eastern Pacific Ocean (EPO) and since 1996, to a lesser extent, in the WCPO. In the WCPO, purse-seine catches of bigeye tuna are estimated to have been less than 20,000 t per year up to 1996, mostly from sets on natural floating objects (Hampton et al. 1998). In 1997, the catch increased to 35,000 t, primarily as a result of increased used of fish aggregation devices (FADs). High purse seine catches were also recorded in 1999 (38,000 t) and 2000 (33,000 t). The total WCPO bigeye tuna catch in 2002 was a record 124,000 t. The spatial distribution of WCPO bigeye tuna catch during is shown in Figure 3. The majority of the catch is taken in equatorial areas, by both purse seine and longline, but with significant longline catch in some sub-tropical areas (east of Japan, north of Hawaii and the east coast of Australia). High catches are also presumed to be taken in the domestic artisanal fisheries of Philippines and Indonesia. These catches, along with small catches by pole-and-line vessels operating in various parts of the WCPO, have approached 20,000 t in recent years. The statistical basis for the catch estimates in Philippines and Indonesia is weak; however, we have included the best available estimates in this analysis in the interests of providing the best possible coverage of bigeye tuna catches in the WCPO. 3 Data compilation The data used in the bigeye tuna assessment consist of catch, effort, length-frequency and weight-frequency data for the fisheries defined in the analysis, and tag release-recapture data. The details of these data and their stratification are described below. 3.1 Spatial stratification The geographic area considered in the assessment is the WCPO, defined by the coordinates 40 N 35 S, 120 E 150 W. Within this overall area, a five-region spatial stratification was adopted for the assessment (Figure 3). The rationale for this stratification was to separate the tropical area, where both surface and longline fisheries occur year-round, from the higher latitudes, where the longline fisheries occur more seasonally. 3.2 Temporal stratification The time period covered by the assessment has been extended back to 1950, to cover all significant post-war tuna fishing in the WCPO. The primary time period covered by the assessment is 3
7 An additional four years (i.e. to the end of 2007) are added as a projection period. Within this period, data were compiled into quarters (Jan Mar, Apr Jun, Jul Sep, Oct Dec). 3.3 Definition of fisheries MULTIFAN-CL requires the definition of fisheries that consist of relatively homogeneous fishing units. Ideally, the fisheries so defined will have selectivity and catchability characteristics that do not vary greatly over time (although in the case of catchability, some allowance can be made for time-series variation). Seventeen fisheries have been defined for this analysis on the basis of region, gear type and, in the case of purse seine, set type (Table 1). 3.4 Catch and effort data Catch and effort data were compiled according to the fisheries defined above. Catches by the longline fisheries were expressed in numbers of fish, and catches for all other fisheries expressed in weight. This is consistent with the form in which the catch data are recorded for these fisheries. Purse seine catches of bigeye are not reliably recorded on logsheets for most fleets, and must be estimated from sampling data. The method used to derive such estimates for the purse seine fishery is that described for data set 1 in Lawson (2003). We tested alternative purse seine catch estimates in the 2003 assessment, and the assessment results were not materially affected over the range of the estimates reported in Lawson (2003). Effort data for the Philippines and Indonesian fisheries were unavailable and the relative catch was used as a proxy for effort. Alternatively, we could have defined effort for these fisheries to be missing, in which case the relative effort over time would have been determined only by the effort deviations, which have a lognormal probability distribution with constant mean and variance. We felt that it was better to have a null hypothesis of effort proportional to catch, rather than constant over time. In practice, this assumption has not been found to influence the results overly, as the variance of the catchability deviations for these fisheries is set at a high level to give the model flexibility to fit the total catch. Effort data units for purse seine fisheries are defined as days fishing and/or searching, allocated to set types based on the proportion of total sets attributed to a specified set type (log, FAD or school sets) in logbook data. For the longline fisheries, we used two estimates of effective (or standardised) effort derived in a separate study (Bigelow et al. 2004). Separate analyses were undertaken for both longline effort series. The effort series used were those estimated using a general linear model (GLM) and an unconstrained statistical habitat-based standardisation (SHBS). Timeseries of catch and catch-per-unit-effort (CPUE) for all fisheries, and CPUE constructed using the two sets of longline effort data are shown in Figure 4, Figure 5 and Figure 6, respectively. Within the model, effort for each fishery was normalised to an average of 1.0 to assist numerical stability. Some longline fisheries were grouped to share common catchability parameters in the various analyses. For such grouped fisheries, the normalisation occurred over the group rather than for the individual fisheries so as to preserve the relative levels of effort between the fisheries. Also, effort for these fisheries was divided by the relative size of the respective region. The application of these procedures allowed longline CPUE to index exploitable abundance in each region (rather than density), which in turn allowed simplifying assumptions to be made regarding the spatial and temporal constancy of catchability for the longline fisheries. 3.5 Length-frequency data Available length-frequency data for each of the defined fisheries were compiled into cm size classes (10 12 cm to cm). Each length-frequency observation consisted of the actual number of bigeye tuna measured. A graphical representation of the availability of length (and weight) samples is provided in Figure 7. The data were collected from a variety of sampling programmes, which can be summarized as follows: 4
8 Philippines: Size composition data for the Philippines domestic fisheries derived from a sampling programme conducted in the Philippines in were augmented with data from the 1980s and for 1995 for the 2002 and 2003 assessments. Additional size data have been collected in recent years, but these data have not yet been evaluated and so have not been included in the current assessment. Indonesia: Limited size data were obtained for the Indonesian domestic fisheries from the former IPTP database. Under the assumption that most of the catch is by pole-and-line gear, catches by the SPC tagging vessels operating in Indonesia in 1980 and have also been used to represent the size composition of domestic fishery catches. Therefore, the size data available for this assessment are the same as those used in previous years. Purse seine: Length-frequency samples from purse seiners have been collected from a variety of port sampling programmes since the mid-1980s. Most of the early data is sourced from the U.S. National Marine Fisheries Service (NMFS) port sampling programme for U.S. purse seiners in Pago Pago, American Samoa and an observer programme conducted for the same fleet. Since the early 1990s, port sampling and observer programmes on other purse seine fleets have provided additional data. Only data that could be classified by set type were included in the final data set. For each purse seine fishery, size samples were aggregated without weighting within temporal strata. Longline: The majority of the historical data were collected by port sampling programmes for Japanese longliners unloading in Japan and from sampling aboard Japanese research and training vessels. It is assumed that these data are representative of the sizes of longline-caught bigeye in the various model regions. Japanese data for have recently become available, and are included in the bigeye tuna assessment for the first time. In recent years, data have also been collected by OFP and national port sampling and observer programmes in the WCPO. Note that in previous years, Japanese length-frequency data had consisted of a combination of actual length measurements and weight measurements converted to length. These data are now separated and the Japanese length data consist of length-measured fish only. 3.6 Weight-frequency data Individual weight data for the Japanese longline fisheries are included in this assessment in their original form. For many other longline fleets, packing list data are available from export documentation, and these data are progressively being processed and incorporated into the assessment database. For this assessment, the available weight data (apart from those provided by Japan) originated from vessels unloading in various ports around the region from where tuna are exported, including Guam, Palau, FSM, Marshall Islands, Fiji, Papua New Guinea and eastern Australian ports. Data were compiled by 1 kg weight intervals over a range of kg. As the weights were generally gilled-and-gutted weights, the frequency intervals were adjusted by a gilled-and-gutted to whole weight conversion factor for bigeye tuna (1.1018). The time-series distribution of available weight samples is shown in Figure 7. As with length data, Japanese longline weight data for the period have been included in the assessment for the first time. 3.7 Tagging data A modest amount of tagging data was available for incorporation into the MULTIFAN-CL analysis. The data used consisted of bigeye tuna tag releases and returns from the OFP s Regional Tuna Tagging Project conducted during , and more recent releases and returns from tagging conducted in the Coral Sea by CSIRO. Tags were released using standard tuna tagging equipment and techniques by trained scientists and technicians. The tag release effort was spread throughout the tropical western Pacific, between approximately 120 E and 170 W (Kaltongga 1998; Hampton and Williams 2004). For incorporation into the MULTIFAN-CL analyses, tag releases were stratified by release region (all bigeye tuna releases occurred in regions 2, 3, 4 and 5), time period of release (quarter) and the same length classes used to stratify the length-frequency data. A total of 8,322 releases were 5
9 classified into 18 tag release groups in this way. Of the 1,082 tag returns in total, 959 could be assigned to the fisheries included in the model. Tag returns that could not be so assigned were included in the non-reported category and appropriate adjustments made to the tag-reporting rate priors and bounds. The returns from each size class of each tag release group were then classified by recapture fishery and recapture time period (quarter). Because tag returns by purse seiners were often not accompanied by information concerning the set type, tag-return data were aggregated across set types for the purse seine fisheries in each region. The population dynamics model was in turn configured to predict equivalent estimated tag recaptures by these grouped fisheries. 4 Model description structural assumptions, parameterisation, and priors The model can be considered to consist of several components, (i) the dynamics of the fish population; (ii) the fishery dynamics; (iii) the dynamics of tagged fish; (iv) observation models for the data; (v) parameter estimation procedure; and (vi) stock assessment interpretations. Detailed technical descriptions of components (i) (iv) are given in Hampton and Fournier (2001) and are not repeated here. Rather, brief descriptions of the various processes are given, including information on structural assumptions, estimated parameters, priors and other types of penalties used to constrain the parameterisation. For convenience, these descriptions are summarized in Table 2. In addition, we describe the procedures followed for estimating the parameters of the model and the way in which stock assessment conclusions are drawn using a series of reference points. 4.1 Population dynamics The model partitions the population into 5 spatial regions and 40 quarterly age-classes. The first age-class has a mean fork length of around 25 cm and is approximately three months of age according to analysis of daily structures on otoliths (Lehodey et al. 1999). The last age-class comprises a plus group in which mortality and other characteristics are assumed to be constant. For the purpose of computing the spawning biomass, we assume that bigeye tuna in age-classes 1 10 are immature, 50% of bigeye in age-classes are mature, and 100% of fish in age-classes are mature. The population is monitored in the model at quarterly time steps, extending through a time window of , with the final 4 years constituting a projection period. The main population dynamics processes are as follows: Recruitment Recruitment is the appearance of age-class 1 fish in the population. We have assumed that recruitment occurs instantaneously at the beginning of each quarter. This is a discrete approximation to continuous recruitment, but provides sufficient flexibility to allow a range of variability to be incorporated into the estimates as appropriate. The distribution of recruitment among the five model regions was estimated within the model and allowed to vary over time in a relatively unconstrained fashion. The time-series variation in spatially-aggregated recruitment was somewhat constrained by a lognormal prior. The variance of the prior was set such that recruitments of about three times and one third of the average recruitment would occur about once every 25 years on average. Spatially-aggregated recruitment was assumed to have a weak relationship with the parental biomass via a Beverton and Holt stock-recruitment relationship (SRR). The SRR was incorporated mainly so that a yield analysis could be undertaken for stock assessment purposes. We therefore opted to apply a relatively weak penalty for deviation from the SRR so that it would have only a slight effect on the recruitment and other model estimates (see Hampton and Fournier 2001, Appendix D). Typically, fisheries data are not very informative about SRR parameters and it is generally necessary to constrain the parameterisation in order to have stable model behaviour. We incorporated a beta-distributed prior on the steepness (S) of the SRR, with S defined as the ratio of the equilibrium recruitment produced by 20% of the equilibrium unexploited spawning biomass to that 6
10 produced by the equilibrium unexploited spawning biomass (Francis 1992; Maunder and Watters 2003). The prior was specified by mode = 0.9 and SD = 0.10 (a = 10, b = 2). In other words, our prior belief is that the reduction in equilibrium recruitment when the equilibrium spawning biomass is reduced to 20% of its unexploited level would be fairly small (a decline of 10%) Initial population The population age structure in the initial time period in each region was assumed to be in equilibrium and determined as a function of the average total mortality during the first 20 quarters. This assumption avoids having to treat the initial age structure, which is generally poorly determined, as independent parameters in the model. The initial age structure was applied to the initial recruitment estimates to obtain the initial populations in each region Growth The standard assumptions made concerning age and growth are (i) the lengths-at-age are normally distributed for each age-class; (ii) the mean lengths-at-age follow a von Bertalanffy growth curve; (iii) the standard deviations of length for each age-class are a log-linear function of the mean lengths-at-age; and (iv) the distribution of weight-at-age is a deterministic function of the length-atage and a specified weight-length relationship (see Table 2). As noted above, the population is partitioned into 40 quarterly age-classes. Previous analyses assuming a standard von Bertalanffy growth pattern indicated that there was substantial departure from the model, particularly for sizes up to about 80 cm. Similar observations have been made on bigeye tuna growth patterns determined from daily otolith increments and tagging data (Lehodey et al. 1999). We therefore modelled growth by allowing the mean lengths of the first eight quarterly age-classes to be independent parameters, with the remaining mean lengths following a von Bertalanffy growth curve. These deviations attract a small penalty to avoid over-fitting the size data Movement Movement was assumed to occur instantaneously at the beginning of each quarter through movement coefficients connecting regions sharing a common boundary. Note however that fish can move between non-contiguous regions in a single time step due to the implicit transition computational algorithm employed (see Hampton and Fournier 2001 for details). There are six interregional boundaries in the model with movement possible across each in both directions. Four seasonal movements were allowed, each with their own movement coefficients. Thus there is a need for = 48 movement parameters. Furthermore, age dependency is accommodated with an exponential variation of movement coefficients with age, specified by an additional 48 parameters. The seasonal pattern of movement persists from year to year with no allowance for longer-term variation in movement Natural mortality Natural mortality (M) was assumed to be age-specific, invariant over time and region and continuous through the time steps. Penalties on the first difference, second difference and deviations from the mean were applied to restrict the age-specific variability to a certain extent. Recent simulation analysis has indicated the possibility of spurious variation in M-at-age estimates (Labelle 2004). We therefore conducted a sensitivity analysis in which M-at-age was assumed at levels used in EPO bigeye stock assessments (Harley and Maunder 2003). 4.2 Fishery dynamics The interaction of the fisheries with the population occurs through fishing mortality. Fishing mortality is assumed to be a composite of several separable processes selectivity, which describes the age-specific pattern of fishing mortality; catchability, which scales fishing effort to fishing 7
11 mortality; and effort deviations, which are a random effect in the fishing effort fishing mortality relationship Selectivity In many stock assessment models, selectivity is modelled as a functional relationship with age, e.g. using a logistic curve to model monotonically increasing selectivity and various domeshaped curves to model fisheries that select neither the youngest nor oldest fish. We have preferred to model selectivity as separate age-specific coefficients (with a range of 0 1), but constraining the parameterisation with two types of smoothing penalties. First, the coefficients were smoothed according to the degree of length overlap between adjacent age-classes. This is appropriate where selectivity is thought to be a fundamentally length-based process (Fournier et al. 1998). The second type of smoothing influences the shape of the selectivity curve. Penalties based on the second and third differences were applied in order to avoid over-fitting and encourage some degree of regularity in the curves. In this assessment, selectivity is assumed to be fishery-specific and time-invariant. For the longline fisheries (which catch mainly adult bigeye) selectivity was assumed to increase with age and to remain at the maximum once attained. Selectivity coefficients for longline fisheries L2 L5 were constrained to be equal. Fishery L1 was not included in this group because the size data show a very different pattern, suggestive of different selectivity, to those of the L2 L5 group. When fishery L1 was included in the group, significant departure in model fit resulted. The coefficients for the last four age-classes, for which the mean lengths are very similar, were constrained to be equal for all fisheries Catchability Catchability was allowed to vary slowly over time (akin to a random walk) for all purse seine fisheries, the Philippines and Indonesian fisheries, the Taiwanese/Chinese longline fisheries and the Australian longline fishery, using a structural time-series approach. Random walk steps were taken every two years, and the deviations were constrained by prior distributions of mean zero and variance specified for the different fisheries according to our prior belief regarding the extent to which catchability may have changed. For the Philippines and Indonesian fisheries, no effort estimates were available. We made the prior assumption that effort for these fisheries was proportional to catch, but set the variance of the priors to be high (approximating a CV of about 0.7), thus allowing catchability changes to compensate for failure of this assumption. For the other fisheries with time-series variability in catchability, the catchability deviation priors were assigned a variance approximating a CV of Longline fisheries LL1 LL5 were grouped for the purpose of initial catchability, and timeseries variation was assumed not to occur in this group. As noted earlier, this assumption is similar to assuming that the CPUE for these fisheries indexes the exploitable abundance both among areas and over time. In one of the sensitivity analyses (SHBS-MEST-LLq), we relaxed the assumption of constant catchability for fisheries LL1 LL5 by estimating catchability deviations at two-year time intervals. The deviations are estimated independently for each fishery, but the initial catchability for these fisheries was still assumed to be common. Catchability for all fisheries apart from the Philippines and Indonesian fisheries (in which the data were based on annual estimates) was allowed to vary seasonally Effort deviations Effort deviations, constrained by prior distributions of zero mean, were used to model the random variation in the effort fishing mortality relationship. For the Philippines and Indonesian fisheries, for which reliable effort data were unavailable, we set the prior variance at a high level (approximating a CV of 0.7), to allow the effort deviations to account for short-term fluctuations in the catch caused by variation in real effort. For the purse seine fisheries and the Australian longline fishery, the variance was set at a moderate level (approximating a CV of 0.2). For the L1 L5 longline fisheries, the variance was set at a lower level (approximating a CV of 0.1) because the effort had 8
12 been standardised in prior analyses and these longline fisheries provide wide spatial coverage of the respective areas in which they occur. 4.3 Dynamics of tagged fish Tag mixing In general, the population dynamics of the tagged and untagged populations are governed by the same model structures and parameters. An obvious exception to this is recruitment, which for the tagged population is simply the release of tagged fish. Implicitly, we assume that the probability of recapturing a given tagged fish is the same as the probability of catching any given untagged fish in the same region. For this assumption to be valid, either the distribution of fishing effort must be random with respect to tagged and untagged fish and/or the tagged fish must be randomly mixed with the untagged fish. The former condition is unlikely to be met because fishing effort is almost never randomly distributed in space. The second condition is also unlikely to be met soon after release because of insufficient time for mixing to take place. Depending on the disposition of fishing effort in relation to tag release sites, the probability of capture of tagged fish soon after release may be different to that for the untagged fish. It is therefore desirable to designate one or more time periods after release as pre-mixed and compute fishing mortality for the tagged fish based on the actual recaptures, corrected for tag reporting (see below), rather than use fishing mortalities based on the general population parameters. This in effect desensitises the likelihood function to tag recaptures in the pre-mixed periods while correctly discounting the tagged population for the recaptures that occurred. We assumed that tagged bigeye mix fairly quickly with the untagged population at the region level and that this mixing process is complete by the end of the first quarter after release. Alternative assumptions of two, three or four quarters after release had little effect on the results Tag reporting In principal, tag-reporting rates can be estimated internally within the model. In practice, experience has shown that independent information on tag reporting rates for at least some fisheries tends to be required for reasonably precise estimates to be obtained. We provided reporting rate priors for all fisheries that reflect our prior opinion regarding the reporting rate and the confidence we have in that opinion. Relatively informative priors were provided for reporting rates for the Philippines and Indonesian domestic fisheries and the purse seine fisheries, as independent estimates of reporting rates for these fisheries were available from tag seeding experiments and other information (Hampton 1997). For the longline fisheries, we have no auxiliary information with which to estimate reporting rates, so relatively uninformative priors were used for those fisheries. All reporting rates were assumed to be stable over time. The proportions of tag returns rejected from the analysis because of insufficient data were incorporated into the reporting rate priors. 4.4 Observation models for the data There are four data components that contribute to the log-likelihood function the total catch data, the length-frequency data, the weight-frequency data and the tagging data. The observed total catch data are assumed to be unbiased and relatively precise, with the SD of residuals on the log scale being The probability distributions for the length-frequency proportions are assumed to be approximated by robust normal distributions, with the variance determined by the effective sample size and the observed length-frequency proportion. Effective sample size is assumed to be 0.04 times the actual sample size for non-longline fisheries and 0.05 times the actual sample size for longline fisheries, with a maximum effective sample size for all fisheries of 100. Reduction of the effective sample size recognises that (i) length-frequency samples are not truly random (because of clumping in the population with respect to size) and would have higher variance as a result; and (ii) the model does not include all possible process error, resulting in further under-estimation of variances. The 9
13 differential treatment of longline and purse seine fisheries occurs because sampling coverage of purse seine catches is generally lower than longline, and the purse seine samples tend to be clumped by wells. A similar likelihood function was used for the weight-frequency data. The only exception was that the effective sample size for the Australian longline fishery was assumed to be equal to 0.2 times the actual sample size recognising the high sampling coverage of this fishery. We recognise that the specifications for effective sample sizes used in this assessment are somewhat arbitrary. This issue has been dealt with in some assessments with respect to catch-at-age data by using iterative re-weighting to estimate the effective sample sizes for each fishery (McAllister and Ianelli 1997). Maunder and Harley (2003) have applied this method to length-frequency data in their tuna stock assessments and re-weighted the samples at the individual sample level rather than using fishery averages. In last year s assessment, we conducted a trial in which the mean effective sample size for each fishery was determined at each iteration using the method of McAllister and Ianelli (1997). The results indicated that effective sample sizes should be higher than assumed for length and weight frequency data for most longline fisheries and lower than assumed for the remaining fisheries. However, the use of the revised effective sample sizes did not materially change the results of the assessment. Nevertheless, the use of iterative re-weighting will be considered in future assessments. A log-likelihood component for the tag data was computed using a negative binomial distribution in which fishery-specific variance parameters were estimated from the data. The negative binomial is preferred over the more commonly used Poisson distribution because tagging data often exhibit more variability than can be attributed by the Poisson. We have employed a parameterisation of the variance parameters such that as they approach infinity, the negative binomial approaches the Poisson. Therefore, if the tag return data show high variability (for example, due to contagion or nonindependence of tags), then the negative binomial is able to recognise this. This should then provide a more realistic weighting of the tag return data in the overall log-likelihood and allow the variability to impact the confidence intervals of estimated parameters. A complete derivation and description of the negative binomial likelihood function for tagging data is provided in Hampton and Fournier (2001) (Appendix C). 4.5 Parameter estimation The parameters of the model were estimated by maximizing the log-likelihoods of the data plus the log of the probability density functions of the priors and smoothing penalties specified in the model. The maximization was performed by an efficient optimization using exact derivatives with respect to the model parameters. Estimation was conducted in a series of phases, the first of which used arbitrary starting values for most parameters. A bash script documenting the phased procedure is provided in Appendix A. Some parameters were assigned specified starting values consistent with available biological information. The values of these parameters are provided in the ini file (Appendix B). Details of the structure of these and other files used by MULTIFAN-CL are provided in the User s Guide (Kleiber et al. 2003). The Hessian matrix computed at the mode of the posterior distribution was used to obtain estimates of the covariance matrix, which was used in combination with the Delta method to compute approximate confidence intervals for parameters of interest. In addition, the likelihood profile method was used to generate probability distributions for the critical reference points F current FMSY and B current B MSY. Likelihood profiles were generated by undertaking model runs with either F current F MSY or B current BMSY set at various levels (by applying a penalty to the likelihood function for deviations from the target ratio) over the range of possible values. The likelihood function values resulting from these runs were then used to construct a probability distribution for each ratio. 10
14 4.6 Stock assessment interpretation methods Several ancillary analyses are conducted in order to interpret the results of the model for stock assessment purposes. The methods involved are summarized below and the details can be found in Kleiber et al. (2003). Note that, in each case, these ancillary analyses are completely integrated into the model, and therefore confidence intervals for quantities of interest are available using the Hessian- Delta approach (or likelihood profile approach in the case of yield analysis results) Fishery impact Many assessments estimate the ratio of recent to initial biomass as an index of fishery depletion. The problem with this approach is that recruitment may vary considerably throughout the time series, and if either the initial or recent biomass estimates (or both) are non-representative because of recruitment variability, then the ratio may not measure fishery depletion, but simply reflect recruitment variability. We approach this problem by computing biomass time series (at the region level) using the estimated model parameters, but assuming that fishing mortality was zero. Because both the real biomass B t and the unexploited biomass B 0t incorporate recruitment variability, their ratio at each time Bt step of the analysis can be interpreted as an index of fishery depletion. B 0t Yield analysis and projections The yield analysis consists of computing equilibrium catch (or yield) and biomass, conditional on a specified basal level of age-specific fishing mortality (F a ) for the entire model domain, a series of fishing mortality multipliers, fmult, the natural mortality-at-age (M a ), the mean weight-at-age (w a ) and the SRR parameters α and β. All of these parameters, apart from fmult, which is arbitrarily specified over a range of 0 50 in increments of 0.1, are available from the parameter estimates of the model. The maximum yield with respect to fmult can easily be determined and is equivalent to the MSY. Similarly the total and adult biomass at MSY can also be determined. The ratios of the current (or recent average) levels of fishing mortality and biomass to their respective levels at MSY are of interest as limit reference points. These ratios are also determined and their confidence intervals estimated using a likelihood profile technique, as noted above. For the standard yield analysis, the F a are determined as the average over some recent period of time. In this assessment, we use the average over the period The last year in which catch and effort data are available for all fisheries is We do not include 2002 and subsequent years in the average as fishing mortality tends to have high uncertainty for the terminal data years of the analysis. Projections to quarter 4, 2007 are incorporated into the assessment. These are constructed according to the method of Maunder et al. (2004). Essentially, the method entails the following: Data for all fisheries defined in the assessment are specified to quarter 4, 2007; Quarterly effort for the last year where data are available are repeated for each year of the projection period (i.e. from the period following that having the most recent real data to quarter 4, 2007); Catches during the projection period are defined as missing and are estimated by the model; All model parameters are estimated simultaneously for the period supported by data and for the projection period, with the exception of catchability deviations, which are set to zero for the projection period. This procedure allows the computation of population parameters for the projection period to be integrated into the overall analysis. The advantage of this is that uncertainty in projected biomass, for example, is automatically computed by the Hessian-delta method and is inclusive of uncertainty in 11
15 future recruitment (recruitment deviations are estimated) and effort effectiveness (effort deviations are estimated). 5 Sensitivity analyses Standardised effort for the longline fisheries LL1 LL5 was estimated using two alternative standardisation methods: one based on a GLM and the other on a statistical habitat-based standardisation (Bigelow et al. 2004). We did not test deterministic habitat-based standardisations (with specified habitat-preference parameters) as was the case last year, because the SHBS provided a greatly superior fit to the longline catch data than the deterministic models. The additional runs conducted for last year s assessment (one incorporating time-series expansion of fishing effort to mimic fishing power increase and the other incorporating higher purse seine catches) were not repeated this year as they were found not to have a material effect on the conclusions of the assessment. As noted earlier, recent simulation analysis has indicated the possibility of spurious variation in M-at-age estimates (Labelle 2004). The causes of this are currently being investigated, but in the meantime, it is appropriate to conduct sensitivity analysis to see if bias in M-at-age, if it exists, has any bearing on the results of the assessment. We therefore conducted parallel runs in which M-at-age was assumed at levels similar to those used in recent EPO bigeye stock assessments (Harley and Maunder 2003). The fixed M-at-age used in these runs is shown in Figure 8. WCPO bigeye tuna assessments to date have incorporated an assumption of constant catchability for the main longline fisheries (LL1 LL5) in the hope that any major time-series variation in catchability for these fisheries would have been removed by the effort standardisation procedures employed. However, it is possible, if not likely, that residual catchability variability not removed by the standardisation procedures could remain. Such variability could arise from numerous sources, including targeting effects not captured by gear configuration parameters, spatial heterogeneity in bigeye tuna abundance within model regions, changes in the distribution of fishing effort within model regions, and others. In order to assess the potential impact of the assumption of constant catchability, a sensitivity analysis was conducted in which catchability was allowed to vary over time independently for each of fisheries LL1 LL5. However, we retained the constraint that the initial catchability for these fisheries be the same, thus inferring that the longline data are somewhat informative regarding the relative abundance of bigeye tuna among model regions. In summary, the analyses carried out are: SHBS-MEST SHBS-MEST-LLq SHBS-MFIX GLM-MEST GLM-MFIX Statistical habitat-based standardised effort for LL1 LL5, M-at-age estimated, constant catchability for LL1 LL5. Statistical habitat-based standardised effort for LL1 LL5, M-at-age estimated, catchability for LL1 LL5 allowed to vary independently over time, but with the initial catchability constrained to be equal. Statistical habitat-based standardised effort for LL1 LL5, M-at-age assumed at fixed levels, constant catchability for LL1 LL5. General linear model standardised effort for LL1 LL5, M-at-age estimated, constant catchability for LL1 LL5. General linear model standardised effort for LL1 LL5, M-at-age assumed at fixed levels, constant catchability for LL1 LL5. 6 Results Results for the five analyses are presented below. In the interests of brevity, some categories of results are presented for the SHBS-MEST analysis only, which is designated the base-case analysis. However, the main stock assessment-related results are summarised for all analyses. 12
16 6.1 Fit statistics and convergence A summary of the fit statistics for the five analyses is given in Table 3. Of the constant longline catchability models, the SHBS-MEST analysis provided the best fit to the composite data and prior information (penalties). Next best was the SHBS-MFIX analysis, followed by GLM-MEST and GLM-MFIX. The GLM fits overall were substantially poorer than their SHBS counterparts, particularly in the total catch likelihood component. The SHBS-MEST-LLq (variable catchability) model provided a superior fit over the constant catchability version (SHBS-MEST) in all loglikelihood components and a significantly better fit overall according to the AIC criterion. In order to verify (to the extent possible) that our final fit to the data was not a local solution, we conducted two fits based on the SHBS analysis in which the ratio of recent fishing mortality-atage to the fishing mortality-at-age at MSY was constrained at values of 0.5 and 2. These constrained fits were subsequently unconstrained and allowed to converge to new solutions. In both cases, the fits converged close to the original best fit and provided essentially identical results. 6.2 Fit diagnostics (SHBS-MEST) We can assess the fit of the model to the four predicted data classes the total catch data, the length frequency data, the weight frequency data and the tagging data. In addition, the estimated effort deviations provide an indication of the consistency of the model with the effort data. The following observations are made concerning the various fit diagnostics: The log total catch residuals by fishery are shown in Figure 9. The magnitude of the residuals is in keeping with the model assumption (CV=0.05) and they generally show even distributions about zero. The time-aggregated fits to the length data reveal no serious lack of fit for most of the fisheries (Figure 10). Some under-estimation of larger sizes is however evident in fisheries LL4 and LL5. This may be indicative of variability in the length-weight relationship (e.g., the aggregate fit to the weight data for LL4 does not show the same lack of fit see below), or variable selectivity among fisheries LL2 LL5, which are grouped for selectivity in the model. For the weight frequency data (Figure 11), there is some minor lack of fit for some fisheries, most notably the LL1 and CH/TW LL 3 fisheries. This may result from the use of a deterministic length-weight relationship or, in the case of LL1, common selectivity assumptions. Trends in residuals for specific length and weight classes are shown in Figure 12 and Figure 13, respectively. There are some time-series trends apparent for several fisheries, e.g. negative trends in length residuals for LL3 and the CH/TW LL fisheries and negative trends in weight residuals in LL1, LL5 and CH/TW LL 3. An abrupt downwards shift in weight residuals during the 1970s is also evident in several LL fisheries. The patterns in residuals may indicate changes in size selectivity that are unaccounted for by the model. The fits of the model to the tagging data compiled by calendar time and by time at liberty are shown in Figure 14 and Figure 15, respectively. Overall, the model predicts tag attrition reasonably well. However, there is some lack of fit for individual fisheries, in particular the under-estimation of tag returns from the Australian longline fishery (see panel LL4A of Figure 16). These returns were all from releases in the north-western Coral Sea and were recaptured over a long period of time in a relatively small area around the release site (some tags were recaptured from further a field, but these were relatively few). Therefore, the observed tag returns suggest a pattern of small-scale residency (or homing) that the relatively coarse spatial scale of the model is unable to capture completely (although the fit is considerably better that it was in last year s assessment). The model fit to the other fisheries is generally good for fisheries that returned large numbers of tags. The spike in predicted returns for the Indonesia fishery, which is not matched by observations, results from the tag releases in the Philippines in The model expected some of these releases to be recaptured in the Indonesian fishery (which occurs in the same model region as the Philippines fisheries). It is possible that recaptures did occur, but were not returned 13
17 because of a political dispute regarding fishing areas. It is also possible that the predicted returns result from inaccurate total catch estimates for this fishery. The overall consistency of the model with the observed effort data can be examined in plots of effort deviations against time for each fishery (Figure 17). If the model is coherent with the effort data, we would expect an even scatter of effort deviations about zero. On the other hand, if there was an obvious trend in the effort deviations with time, this may indicate that a trend in catchability had occurred and that this had not been sufficiently captured by the model. Of particular interest are the effort deviations for the LL1 LL5 longline fisheries, which were constrained to have the same average catchability and to have no year-to-year variation in the base-case model. There are no patterns in the distributions of effort deviations for these fisheries to suggest failure of these assumptions. Nevertheless, the effects of relaxing longline catchability assumptions are explored in the SHBS-MEST-LLq sensitivity analysis. Also noteworthy is the lack of strongly positive effort deviations for the LL4 and LL5 fisheries in the early 1950s, which occurred in the yellowfin tuna assessment. In contrast to yellowfin tuna, high CPUE for the longline fisheries did not occur in the early 1950s in fact, CPUE was initially low in several regions (Figure 6) 6.3 Model parameter estimates (SHBS-MEST) Growth The estimated growth curve is shown in Figure 18. The non-von Bertalanffy growth of juvenile bigeye tuna is evident, with near-linear growth in the cm size range. This growth pattern is similar to that observed in both otolith and tagging length-increment data (Lehodey et al. 1999). Comparisons of the estimated growth curve with length increments from tagging data and daily otolith readings show some inconsistencies. Most of the tagging length- and age-at-recapture observations occur below the estimated growth curve. On the other hand, the otolith length-age observations occur slightly above the estimated curve. These inconsistencies could be related to spatial or other growth variability not included in the model. Further analysis is required to resolve this issue Natural mortality Natural mortality shows characteristic variation with size and age-class (Figure 19). There is an initial decline in natural mortality with age-class, reaching a minimum of 0.10 qtr -1, after which the rate increases to about 0.2 qtr -1 before declining again to around 0.12 qtr -1 for the oldest age classes. The estimates show a similar age-specific pattern to those obtained in last year s assessment, but the absolute values obtained here are slightly higher. The increase in natural mortality rate for the middle age-classes begins at about the size at first maturity. It is therefore possible that the increase is due to higher female mortality associated with spawning, and the subsequent decrease to lower natural mortality in an increasingly male-dominated population. However, we also recognise the possibility that the estimated age-specific pattern may be an artefact, and have undertaken sensitivity analyses using fixed natural mortality-at-age (Figure 8) to evaluate the significance of this for the assessment results Movement A representation of the estimated movement pattern is shown in Figure 20. This figure shows the regional distributions of cohorts over time, decremented for natural mortality. Movement is fairly restricted, with cohorts showing strong persistence in their regions of origin over long periods. The strongest movement occurs out of region 1 and into region 3. Note that the lack of substantial movement for some regions could be due to limited data on movement. In the model, a small penalty is placed on movement coefficients different to zero. This is done for reasons of stability, but it would tend to promote low movement rates in the absence of data that are informative about movement. An alternative model formulation would be to have high movement rates, rather than zero movement, as the null hypothesis. This is a topic for further research. 14
18 6.3.4 Selectivity Estimated selectivity coefficients are shown in Figure 21. For the longline fisheries, selectivity was constrained to be monotonically increasing with age-class. Some might be surprised at the high selectivities of older age-classes for the Philippines fisheries. Note however that the coefficients act upon the population-at-age in the region in which the fisheries occur. If the population numbers beyond age-class 10 in a region are relatively small, high selectivity coefficients may be required to explain the size data, even if relatively few large fish are represented in the samples. The Philippines fisheries do in fact catch small numbers of larger bigeye (Figure 10), but the model tends to over-estimate these catches. While it is unlikely to affect the assessment results, this issue should be further investigated Catchability Time-series changes in catchability are evident for several fisheries (Figure 22). There is evidence of increasing catchability in some, but not all of the purse seine fisheries. Catchability in the LL1-LL5 longline fisheries was assumed to be constant over time in the base-case model, with the exception of seasonal variation (not shown in Figure 22). When longline catchability time-series were estimated, the trends were upward in LL1 and LL5, and downward in LL2 and LL3. Such catchability variation might arise from several sources, including targeting effects not captured by gear configuration parameters, spatial heterogeneity in bigeye tuna abundance within model regions, changes in the distribution of fishing effort within model regions, and others. Further research is required to evaluate the estimated trends Tag-reporting rates Estimated tag-reporting rates by fishery are shown in Figure 23. The estimates for the purse seine fisheries and the Philippines and Indonesian fisheries are all near the modes of their prior distributions. The estimates for the longline fisheries are highly variable, ranging from near zero to the upper limit allowed (0.9). 6.4 Stock assessment results Recruitment The SHBS-MEST recruitment estimates (aggregated by year for ease of display) for each region and the WCPO are shown in Figure 24. The regional estimates display large interannual variability and variation on longer time scales, as well as differences among regions. For the aggregated estimates, there is decreasing trend to about 1970 and an increasing trend thereafter. This pattern is similar to that estimated in last year s assessment, although the absolute recruitment is larger in the current assessment. Approximate 95% confidence intervals are provided for the aggregate WCPO recruitment estimates. Confidence intervals are wider in the early part of the time series because of the absence of fisheries targeting small fish and lower size frequency sample sizes (Figure 7). However this effect is not as severe as in last year s assessment, presumably because of the addition of pre-1965 longline size samples to the assessment database. Note also the rapid expansion of the confidence region towards the end of the time series, and in particular as the model enters the projection phase. This is expected, as the model receives no data-based information on recruitment in this phase the point estimates and confidence region largely reflect the estimated average recruitment and the priors on the recruitment deviations. A comparison of WCPO recruitment estimates for the different analyses is provided in Figure 25. All of the series have a similar time-series pattern, but the SHBS-MEST-LLq estimates are lower in absolute terms. 15
19 6.4.2 Biomass Estimated biomass time-series for each region and for the WCPO are shown in Figure 26 for the base-case analysis. Biomass declines during the 1950s and 1960s in all regions except region 5. In region 2, biomass recovers during the 1970s and 1980s before entering a sharp decline in the 1990s. Region 5 is marked by a strong increase in biomass from the mid-1990s. Overall, biomass declines during the 1950s and early 1960s, and is stable or declines slightly thereafter. The comparison of biomass trends for the different analyses is shown in Figure 27. Similar patterns are shown in all analyses with some variation in absolute terms. For all analyses, projected biomass is estimated to fall sharply. This is largely a function of the recruitment during the projection period, which tends to default to the overall average level since there are no data to indicate otherwise Fishing mortality Average fishing mortality rates for juvenile and adult age-classes increase strongly throughout the time series in a similar fashion for all analyses, with the exception of the SHBS-MEST-LLq analysis, in which fishing mortality is substantially higher, particularly for adults (Figure 28) Fishery impact We measure fishery impact at each time step as the ratio of the estimated biomass to the biomass that would have occurred in the historical absence of fishing. This is a useful variable to monitor, as it can be computed both at the region level and for the WCPO as a whole. The two trajectories are plotted in Figure 29. Impacts are significant in all regions, with the exception of region 5. Impacts are particularly strong in regions 2 and 3, where most of the catch is taken. The biomass ratios with their approximate 95% confidence intervals are plotted in Figure 30. These figures indicate strong fishery depletion of bigeye tuna in regions 2 and 3, and moderate levels of depletion in regions 1 and 4. Depletion in region 5 is slight by comparison. For the WCPO as a whole, the ratio approaches 0.4 in recent years. The depletion trajectories are similar for the different analyses undertaken, with the exception of the SHBS-MEST-LLq analysis, in which depletion is estimated to be more severe, reaching around 0.25 in recent years (Figure 31). It is possible to ascribe the fishery impact, 1 Bt B0t, to specific fishery components in order to see which types of fishing activity have the largest impact on population biomass (Figure 32). In contrast with yellowfin tuna, the longline fishery has a significant impact on the bigeye tuna population in all model regions; it is the most significant component of overall fishery impact in all regions with the exception of region 2 and is responsible for more than half of the WCPO impact in recent years. In regions 2 and 3, the purse seine fisheries and the Indonesian and Philippines domestic fisheries also have high impact Yield analysis Symbols used in the following discussion are defined in Table 4. The yield analyses conducted in this assessment incorporate the SRR (Figure 33) into the equilibrium biomass and yield computations. The estimated steepness coefficient is 0.92, close to the prior mode of 0.9. In reality, the prior is not influential in the bigeye assessment when the prior is removed, the steepness estimate increases slightly to Equilibrium yield and total biomass as functions of multiples of the average fishing mortality-at-age are shown in Figure 34 for the SHBS-MEST analysis. Yield is maximized at fmult = 1.0 for a MSY of 60,000 t per year. This implies that the ratio F current F 2 MSY is also 2 Note that F current FMSY is a ratio of two age-specific vectors. The yield analysis results depend on the F current assumption that F MSY is a simple multiple of, i.e. that the same overall age-specific selectivity is maintained. 16
20 approximately 1.0. The equilibrium biomass at MSY is estimated at 256,000 t, approximately 37% of the equilibrium unexploited biomass. The yield and equilibrium biomass curves for the five analyses are shown in Figure 35. The analyses with constant longline catchability are consistent in identifying an fmult of about 1.0 as the level that maximises equilibrium yield. The SHBS and GLM-based analyses gave similar results, and the use of fixed natural mortality-at-age gave practically identical results to the equivalent analyses in which natural mortality-at-age was estimated. The variable longline catchability model is more pessimistic than those assuming constant catchability in the main longline fisheries, with an fmult of about 0.6. The MSY estimates for these analyses range from about 42,000 t to 60,000 t per year. These estimates of equilibrium yield are substantially less than recent catches, which have been of the order of 100, ,000 t annually. This apparent anomaly results because the equilibrium computations use equilibrium recruitment determined from the SRR fitted to all of the recruitment time series. This equilibrium recruitment is close to the average recruitment over the time series and is much lower than the estimated recruitment post When yield is computed using the average post-1990 recruitment rather than the equilibrium recruitment, we obtain a clearer picture of MSY under current recruitment conditions (Figure 36). A number of quantities of potential management interest associated with the yield analyses are provided in Table 5. In the top half of the table, absolute quantities are provided, while the bottom half of the table contains ratios of various biomass and fishing mortality measures that might be useful for stock monitoring purposes. It is useful to distinguish three different types of ratio: (i) ratios comparing a measure for a particular time period with the corresponding equilibrium measure (unshaded rows); (ii) ratios comparing two equilibrium measures (rows shaded grey); and (iii) ratios comparing two measures pertaining to the same time period (row shaded black). Several commonly used reference points, such as B current BMSY and F current FMSY fall into the first category. These ratios are usually subject to greater variability than the second category of ratios because recruitment variability is present in the numerator but not in the denominator. The range of values observed in this and other assessments suggests that the category (ii) ratios are considerably more robust than those in category (i). However, it is likely that B current BMSY and F current FMSY will continue to be used as indicators of stock status and overfishing, respectively. This being the case, we need to pay particular attention to quantifying uncertainty in these ratios. In last year s assessment, we compared likelihood profile-based estimates of the posterior probability distribution of F current FMSY with the normal approximation based on the Hessian-Delta method, and found that the normal approximation could under-estimate the probability of higher values of the ratio. We have continued the likelihood profile approach in this assessment, applying it to both F current FMSY and B current BMSY for the SHBS- MEST analysis (Figure 37). Using an approximate integration of the likelihood profile distributions, it is estimated that the probability of F current FMSY >1 is 0.67, while the probability that B current B MSY <1 is close to zero. We found that the main way in which the model responds to the different F and B ratios is by varying the SRR steepness coefficient. It is therefore useful to compute the likelihood profile in the absence of a steepness prior. As expected, this slightly increases the probability of higher F current FMSY and lower B current BMSY. Under the no steepness prior condition, the probability of F current FMSY >1 increases to 0.77; however the probability that B current B MSY <1 is remains close to zero Projections Biomass projections through 2007 have been incorporated into the current assessment. Uncertainty in projected biomass incorporates uncertainty in all model parameters as well as uncertainty in future recruitment and variability in the relationship between future fishing effort and 17
21 fishing mortality. Catchability, however, is assumed to remain constant at the pre-projection level for all fisheries. For the projections shown in Figure 26, point estimates of biomass decline steeply although uncertainty is high. The decline results because the recruitment point estimates during the projection period take values close to their long-term average, which is considerably less than the estimated recent recruitment (Figure 24). To contrast the projections under the existing fishing effort regime, we also conducted a simulation with zero effort for the purse seine, Philippines and Indonesian fisheries, i.e. those fisheries catching mainly juvenile bigeye tuna. The relative response of total biomass and total longline catch is shown in Figure 38. Biomass at the end of the projection under the zero juvenile catch regime is approximately 25% greater compared to maintaining the current fishing effort regime. Longline catch is similarly increased by reduced juvenile catches. 7 Discussion and conclusions This assessment of bigeye tuna for the WCPO applied a similar modelling approach to that used in last year s assessment, although there were a number of further refinements, notably: An additional year of data (for 2002 or 2003, depending on the fishery) was added for all fisheries and pre-1965 size composition data for the Japanese longline fishery were incorporated for the first time; Two principal effort series were considered this year; the general linear model standardized (GLM) and the statistical habitat based standardized (SHBS) effort time-series. The latter represented an overall improvement in the fit to the various sources of data and was designated as the base-case assessment; The impact of fixing the age-specific natural mortality was investigated (MEST vs MFIX); The impact of relaxing the assumptions regarding the constant catchability of the LL1 5 fisheries was investigated (SHBS-MEST-LLq); The procedure for undertaking model projections was refined and model projections were extended to 2007 under current (2003) levels of fishing effort; and The computation of a wide range of reference points potentially useful for management purposes and an assessment of precision of the key reference points. The assessment integrated catch, effort, length-frequency, weight-frequency and tagging data into a coherent analysis that is broadly consistent with other information on the biology and fisheries. The model diagnostics did not indicate any serious failure of model assumptions, although inevitably, departures from the model s assumptions were identified in several areas: Some minor systematic lack of fit in longline length and weight samples was detected in some fisheries for which both data types are available. This suggests that regional and/or time-series variation in the conversion of length-at-age to weight-at-age may be required to adequately model both types of data. However, the benefits of adding such model structure would have to be assessed against the increased model complexity and whether such a change would make a practical difference to the model results. Residuals in the observed and predicted size-frequency proportions over time suggest an underestimation of the proportion of larger bigeye early in the time-series, and an over-estimation later in the time series for some longline fisheries. This suggests the possibility of time-series changes in selectivity, which are not currently accommodated by the model, or an inability of the model to completely capture changes in the size structure of the population. These are issues that should be investigated by further research. Residuals in the tag return data for the Australian longline fishery suggested that bigeye tuna may have patterns of residency in this area that cannot be captured by the spatial resolution of this model. A model (Pacific-wide) in which greater spatial resolution was added to the Australian 18
22 longline fishery resulted in a better fit to these tag data (Hampton et al. 2003), and such a structure may be incorporated in future assessments. Approximate confidence intervals for many model parameters and other quantities of interest have been provided in the assessment. Estimated confidence intervals are impacted by priors, smoothing penalties and other constraints on the parameterisation. Also, confidence intervals are conditional on the assumed model structure being correct. For these reasons, the confidence intervals presented in the assessment should be treated as minimum levels of uncertainty. Several alternative analyses have been presented in order to assess the impact on stock assessment results of (i) using different methods of longline effort standardisation (SHBS vs GLM); (ii) assuming constant versus time-series trends in longline catchability (LLq); and (iii) using estimated (MEST) versus assumed (MFIX) natural mortality-at-age. Overall, there was little difference in assessment results between the SBHS and GLM-based analyses, nor between the MEST and MFIX analyses. However, the LLq analysis produced substantially different results lower natural mortality, higher fishing mortality, lower recruitment and lower population biomass. Consequently, this analysis produced more pessimistic stock assessment results. While the fitting criteria indicated a statistically significant improvement in fit over the constant catchability models, further analysis of the LLq model is required to judge whether or not the estimated trends in longline catchability are reasonable and therefore whether or not this model should be accorded equal (or greater) weight in the overall evaluation of stock status. Another issue requiring investigation is whether it is appropriate to set the initial catchability to be common across fisheries when some of the initial patterns in CPUE from longline fisheries are atypical of later data. In future, it may be more appropriate to set the average catchability over the entire time series to be common rather than the initial catchability. The results of the analyses may be summarised as follows: 1. Recruitment in all analyses is estimated to have increased since about It appears that the addition of pre-1965 size composition data for the longline fisheries in this assessment have helped to decrease the uncertainty in early recruitment present in last year s assessment. Recruitment estimates were insensitive to using estimated or assumed natural mortality-at-age, and were similar for the SHBS and GLM-based analyses. However, average recruitment was considerably lower for the LLq model compared to the other analyses. 2. Biomass for the WCPO is estimated to have declined to about half of its initial level by about 1970 and has been fairly stable or subject to slight decline since then. Biomass estimates are practically identical for the MEST and MFIX models and similar for the SHBS and GLM models. However the LLq model produced substantially lower biomass. 3. Fishing mortality for adult and juvenile bigeye tuna is estimated to have increased continuously since the beginning of industrial tuna fishing. Fishing mortality for adults is estimated to be higher than that for juveniles in all analyses. The estimates are comparable for all of the analyses that assume constant catchability for the LL1 LL5 fisheries, but the LLq model estimates much higher adult fishing mortality. 4. The ratios B t B t, F = 0 provide a time-series index of population depletion by the fisheries. Overall, depletion is estimated to have been rapid, particularly since the mid-1980s. Even though the estimated biomass has remained fairly stable since 1970, it appears to have been sustained only by above average recruitment. If recruitment were to return to the average level estimated in this assessment, biomass decline would be rapid, as suggested by the projections. The current level of biomass is equivalent to B current B current, F = 0 = for the constant longline catchability models and 0.26 for the LLq model. Depletion is more extreme for some individual model regions, notably region 2, where recent B t B t, F = 0 ratios are around 0.20 in the base-case model. Other regions, notably regions 4 and 5, are less depleted, with Bt B t, F = 0 ratios of around 0.7 or greater. 19
23 5. The attribution of depletion to various fisheries or groups of fisheries indicates that the longline fishery has the greatest impact throughout the model domain. The purse seine and Indonesian fisheries also have substantial impact in regions 2 and The main reference points that are useful in indicating the current status of the stock are F current F MSY and B current BMSY. The fishing mortality-based reference points for the constant longline catchability models indicate that recent fishing mortality is at about the MSY level. However, the likelihood profile estimates of uncertainty suggest that the probability that F current F MSY >1 is at least 67%. The LLq model produced a more pessimistic result, with a point estimate of F current FMSY of about 1.7. The ratio of current biomass to B MSY was substantially >1 for all analyses with high probability. In summary, the assessment suggests a high probability that current fishing mortality on bigeye tuna is above MSY levels, but that current biomass remains above the MSY level. The results are somewhat more optimistic than those of the 2003 assessment for comparable analyses, although the LLq model produced a more pessimistic result. On the basis of all of the results presented in the assessment, we conclude that maintenance of current levels of fishing mortality carries a high risk of overfishing. Should recruitment fall to average levels, current catch levels would result in stock reductions to near and possibly below MSY-based reference points. Reduction of juvenile fishing mortality in the equatorial regions would have significant benefits for both the bigeye tuna stock and the longline fishery. 8 Acknowledgements We are grateful to all fisheries agencies that have contributed data to the SPC for this assessment. We also acknowledge the assistance of Peter Williams for assistance in data compilation. 9 References Bigelow, K., Langley, A.D., and Patterson, T Relative abundance indices of the Japanese longline fishery for bigeye and yellowfin tuna in the western and central Pacific. WP SA-7, SCTB 17, Majuro, Marshall Islands, 9 18 August Fournier, D.A., Hampton, J., and Sibert, J.R MULTIFAN-CL: a length-based, age-structured model for fisheries stock assessment, with application to South Pacific albacore, Thunnus alalunga. Can. J. Fish. Aquat. Sci. 55: Francis, R.I.C.C Use of risk analysis to assess fishery management strategies: a case study using orange roughy (Hoplostethus atlanticus) on the Chatham Rise, New Zealand. Can. J. Fish. Aquat. Sci. 49: Grewe, P.M., and Hampton, J An assessment of bigeye (Thunnus obesus) population structure in the Pacific Ocean based on mitochondrial DNA and DNA microsatellite analysis. SOEST 98-05, JIMAR Contribution Hampton, J Estimates of tag-reporting and tag-shedding rates in a large-scale tuna tagging experiment in the western tropical Pacific Ocean. Fish. Bull. U.S. 95: Hampton, J Natural mortality rates in tropical tunas: size really does matter. Can. J. Fish. Aquat. Sci. 57: Hampton, J., K. Bigelow, and M. Labelle A summary of current information on the biology, fisheries and stock assessment of bigeye tuna (Thunnus obesus) in the Pacific Ocean, with recommendations for data requirements and future research. Technical Report No. 36, (Oceanic Fisheries Programme Secretariat of the Pacific Community, Noumea, New Caledonia) 46 pp. 20
24 Hampton, J., and Fournier, D.A A spatially-disaggregated, length-based, age-structured population model of yellowfin tuna (Thunnus albacares) in the western and central Pacific Ocean. Mar. Freshw. Res. 52: Hampton, J., Kleiber, P., Takeuchi, Y., Kurota, H., and Maunder, M Stock assessment of bigeye tuna in the western and central Pacific Ocean, with comparisons to the entire Pacific Ocean. WP BET-1, SCTB 16, Mooloolaba, Australia, 9 16 July Hampton, J., and Williams, P A description of tag-recapture data for bigeye tuna in the western and central Pacific Ocean. SCRS 2004/058. Col. Vol. Sci. Pap. ICCAT, 57(2). In press. Harley, S. J., and Maunder, M. N Status of bigeye tuna in the eastern Pacific Ocean. IATTC Stock Ass. Rep. 4. Kaltongga, B Regional Tuna Tagging Project: data summary. Technical Report No. 35, (Oceanic Fisheries Programme, Secretariat of the Pacific Community, Noumea, New Caledonia.) 70 pp. Kleiber, P., Hampton, J., and Fournier, D.A MULTIFAN-CL Users Guide. Labelle, M Testing the accuracy of MULTIFAN-CL assessments of the western and central Pacific Ocean yellowfin tuna (Thunnus albacares) fisheries. Fish. Res. Submitted. Lawson, T Analysis of the proportion of bigeye in yellowfin plus bigeye caught by purse seiners in the western and central pacific ocean, based on observer data. WP SWG-6, SCTB 16, Mooloolaba, Australia, 9 16 July Lehodey, P., Hampton, J., and B. Leroy Preliminary results on age and growth of bigeye tuna (Thunnus obesus) from the western and central Pacific Ocean as indicated by daily growth increments and tagging data. Working Paper BET-2, SCTB 12, Papeete, French Polynesia, June Maunder, M.N., and Harley, S.J Methodological improvements to the EPO tuna stock assessments. WP MWG-3, SCTB 16, Mooloolaba, Australia, 9 16 July Maunder, M.N., Harley, S.J., and Hampton, J Including parameter uncertainty in forward projections of computationally intensive statistical population dynamic models. Can. J. Fish. Aquat. Sci. Submitted. Maunder, M. N., and Watters, G. M A-SCALA: An age-structured statistical catch-at-length analysis for assessing tuna stocks in the eastern Pacific Ocean. IATTC Bul. 22: In press. McAllister, M.K, and Ianelli, J.N Bayesian stock assessment using catch-at-age data and the sampling importance resampling algorithm. Can. J. Fish. Aquat. Sci. 54: Schaefer, K.M., and Fuller, D.W Movements, behavior, and habitat selection of bigeye tuna (Thunnus obesus) in the eastern equatorial Pacific, ascertained through archival tags. Fish. Bull. 100:
25 Table 1. Definition of fisheries for the MULTIFAN-CL analysis of yellowfin tuna. Fishery Nationality Gear Region LL 1 All Longline 1 LL 2 All excl. Taiwan & China Longline 2 CH/TW LL 2 Taiwan and China Longline 2 LL 3 All excl. Taiwan & China Longline 3 CH/TW LL 3 Taiwan and China Longline 3 LL 4 All excl. Australia Longline 4 AU LL Australia Longline 4 LL 5 All Longline 5 PS/LOG 2 All Purse seine, log sets 2 PS/FAD 2 All Purse seine, FAD sets 2 PS/SCH 2 All Purse seine, school sets 2 PS/LOG 3 All Purse seine, log sets 3 PS/FAD 3 All Purse seine, FAD sets 3 PS/SCH 3 All Purse seine, school sets 3 PH RN Philippines Ringnet 2 PH HL Philippines Handline 2 ID Indonesia Various 2 22
26 Table 2. Main structural assumptions of the yellowfin tuna analysis, and details of estimated parameters, priors and bounds. Note that the number of estimated parameters shown is substantially greater than the effective number of parameters in a statistical sense because of the effects of priors, bounds and smoothing penalties. Category Observation model for total catch data Observation model for lengthfrequency data Observation model for weightfrequency data Assumptions Observation errors small, equivalent to a residual SD on the log scale of Normal probability distribution of frequencies with variance determined by effective sample size and observed frequency. Effective sample size assumed to be 0.04 times actual sample size for non-longline fisheries and 0.1 times for longline fisheries with a maximum effective sample size of 100. Normal probability distribution of frequencies, variance determined by effective sample size and observed frequency. Effective sample size assumed to be equal to the actual sample size for the Australian longline fishery, and 0.1 times the actual sample size for other longline fisheries with a maximum effective sample size of 100. Estimated parameters (ln = log transformed parameter) None None None No. Prior Bounds µ σ Low High na na na na na na na na na na na na na na na Observation model for tagging data Tag reporting Tag mixing Recruitment Tag numbers in a stratum have negative binomial probability distribution, with estimated variance parameters for fishery groups. Purse seine reporting rates constrained to be equal. PH RN and PH HL rates constrained to be equal. All reporting rates constant over time. Tags assumed to be randomly mixed at the model region level from the quarter following the quarter of release. Occurs as discrete events at the start of each quarter. Spatiallyaggregated recruitment is weakly related to spawning biomass in the prior quarter via a Beverton-Holt SRR (beta prior for steepness with mode at 0.9 and SD of 0.10).The spatial distribution of recruitment in each quarter is allowed to vary with a small penalty on deviations from the average spatial distribution. Variance parameters LL 1 LL5, CH/TW LL fisheries AU LL fishery PS fisheries PH, ID fisheries None Average spatially aggregated recruitment (ln) Spatially aggregated recruitment deviations (ln) Average spatial distribution of recruitment Time series deviations from average spatial distribution (ln) na na na na na SRR
27 Initial population Age and growth Selectivity A function of the initial recruitment and equilibrium age structure in each region, which is in turn assumed to arise from the total mortality estimated for and movement rates. 40 quarterly age-classes, with the last representing a plus group. Juvenile age-classes 1-8 have independent mean lengths constrained by a small penalty for deviation from the von Bertalanffy growth curve; adult age-class mean lengths constrained by VB curve. SD of length-atage are log-linearly related to the mean length-at-age. Mean weights ( W j ) computed internally by estimating the distribution of weight-atage from the distribution of length-at-age and applying the weightlength relationship W = al (a= , b=3.0 independently b estimated from available length-weight data). Constant over time. Various smoothing penalties applied. Coefficients for the last 4 age-classes are constrained to be equal. Longline selectivities are non-decreasing with increasing age. Longline fisheries L2-L5 share selectivity parameters. Initial recruitment scaling (ln) Mean length age class Mean length age class von Bertalanffy K Independent mean lengths Length-at-age SD Dependency on mean length (ln) Selectivity coefficients Catchability Fishing effort Natural mortality Movement Constant over years and among regions for longline fisheries (effort data are scaled to reflect different region sizes). Seasonal variation for all fisheries apart from Philippines and Indonesian fisheries. Nonlongline fisheries and the Australian and Taiwanese/Chinese longline fisheries have structural time-series variation, with random steps (catchability deviations) taken every 2 years. Variability of effort deviations constrained by a prior distributions. SD inversely proportional to the square root of normalised effort. Age-dependent but constant over time and among regions. Smoothing penalties constrain the age-dependency. Average catchability coefficients (ln) Seasonality amplitude (ln) Seasonality phase Catchability deviations PH/ID (ln) Catchability deviations other (ln) Effort deviations LL 1 LL5 (ln) Effort deviations PH, ID (ln) Effort deviations other (ln) Average natural mortality (ln) Age-specific deviations (ln) Age-dependent and varies by quarter but constant among years. Agedependency Movement coefficients for each coefficient (2 per region boundary) is log-linear. Age-dependent component (ln)
28 Table 3. Details of objective function components for the five analyses using alternative longline effort series (SHBS, GLM) with either estimated (MEST) or fixed (MFIX) natural mortality-at-age. SHBS-MEST-LLq refers to an analysis incorporating time-series variability in catchability for longline fisheries LL1 LL5. Objective function component SHBS- MEST SHBS- MEST-LLq SHBS- MFIX GLM- MEST GLM- MFIX Total catch log-likelihood Length frequency loglikelihood Weight frequency loglikelihood -298, , , , , , , , , , Tag log-likelihood 1, , , , , Penalties 3, , , , , Total function value -612, , , , , Maximum gradient at termination
29 Table 4. Description of symbols used in the yield analysis. Symbol Description F current Average fishing mortality-at-age for F Fishing mortality-at-age producing the maximum sustainable yield (MSY) MSY Y Equilibrium yield at F F current current Y F MSY (or MSY) Equilibrium yield at F MSY, or maximum sustainable yield B Equilibrium unexploited total biomass 0 B Equilibrium total biomass at F F current current B Equilibrium total biomass at MSY MSY S B Equilibrium unexploited adult biomass 0 S B Equilibrium adult biomass at Fcurrent Fcurrent S B MSY Equilibrium adult biomass at MSY B current Average current ( ) total biomass SB current Average current ( ) adult biomass B Average current ( ) total biomass in the absence of fishing. current, F =0 26
30 Table 5. Estimates of management quantities for the four analyses using alternative longline effort series. The highlighted rows are ratios of comparable quantities at the same point in time (black shading) and ratios of comparable equilibrium quantities (gray shading). Management quantity Y F current Y F MSY (or MSY) Units SHBS- MEST SHBS- MEST- LLq SHBS- MFIX GLM- MEST GLM- MFIX t per quarter 15,700 10,640 15,120 14,060 14,110 t per quarter 15,701 11,745 15,124 14,129 14,129 B 0 t 693, , , , ,800 B F current t 255, , , , ,800 B MSY t 255, , , , ,500 S B t 474, , , , ,900 0 S B Fcurrent t 130,200 49, , , ,800 S B MSY t 130,200 98, , ,700 96,120 B current t 447, , , , ,968 SB current t 238, , , , ,149 B current, F =0 t 1,036, ,986 1,078,780 1,117,729 1,105,349 B current B B current B Fcurrent B current B MSY B current B current, F = SB current SB SBcurrent SB Fcurrent SBcurrent SB MSY B B F current SBF current SB B B MSY SB MSY SB F current F MSY BF current B MSY SBF SB current MSY MSY YF current 27
31 120E 130E 140E 150E 160E 170E W 160W 150W 140W 130W 120W 110W 100W 90W 80W 10N 20N 30N 40N 20S 10S N 30N 20N 10N 0 10S 20S 40S 30S 30S 40S 120E 130E 140E 150E 160E 170E W 160W 150W 140W 130W 120W 110W 100W 90W 80W Figure 1. Long-distance (>1,000 nmi) movements of tagged bigeye tuna. 140, , ,000 Other Purse seine Longline Total catch (t) 80,000 60,000 40,000 20, Figure 2. WCPO bigeye tuna catch, by gear. 28
32 120E 130E 140E 150E 160E 170E W 160W 150W 140W 130W 120W 110W 100W 90W 80W 10N 20N 30N 40N 20S 10S 0 40S 30S Bigeye catch (t) ,000 15,000 3,000 Longline Purse seine Other N 30N 20N 10N 0 10S 20S 30S 40S 120E 130E 140E 150E 160E 170E W 160W 150W 140W 130W 120W 110W 100W 90W 80W Figure 3. Distribution of bigeye tuna catch, The spatial stratification used in the WCPO MULTIFAN-CL model is shown. 29
33 Figure 4. Annual catches, by fishery. Circles are observed and the lines are model predictions. Units are catch number in thousands for the longline fisheries and thousand metric tonnes for all other fisheries. The vertical dotted lines indicate the point at which population projections are made with assumed levels of effort. 30
34 Figure 5. Catch-per-unit-effort (CPUE) by fishery. Units are catch number per stathbs-standardised effort (fisheries LL1 LL5), catch number per 100 nominal hooks (AU LL, CH/TW LL) and catch (t) per day fished/searched (all PS fisheries). Note that CPUE for PH RN, PH HL and ID are arbitrary and not based on data (see discussion on catchability and effort deviation constraints for these fisheries). 31
35 Figure 6. Catch-per-unit-effort (CPUE) for the longline fisheries LL1 LL5 standardised using two different methodologies. glm = general linear model; shbs = statistical habitat-based standardisation. 32
36 Figure 7. Number of fish size measurements by year for each fishery. The upper black bars represent length measurements and the lower grey bars represent weight measurements. The sample size corresponding to the maximum bar length for each fishery is given on the righthand side. The extent of the horizontal lines indicates the period over which each fishery occurred. 33
37 0.25 Natural mortality rate (per quarter) Age class (quarters) Figure 8. Natural mortality-at-age used in the MFIX runs. The estimates are those used in IATTC bigeye tuna assessments in 2003 and earlier (Harley and Maunder 2003). 34
38 Figure 9. Residuals of ln (total catch) for each fishery (SHBS-MEST model). The dark line represents a lowess smoothed fit to the residuals. 35
39 Figure 10. Observed (histograms) and predicted (line) length frequencies (in cm) for each fishery aggregated over time (SHBS-MEST model). 36
 and")
 for each")
40 Figure 11. Observed (histograms) and predicted (line) weight frequencies (in kg) for each fishery aggregated over time (SHBS-MEST model). 37
41 Figure 12. Residuals (observed predicted) of the aggregated proportion of fish in the larger length classes from sampled and predicted catches by fishery and sample period (SHBS-MEST model). The aggregated length range is cm for all the longline fisheries and cm for all other fisheries. The line represents a lowess smoothed fit to the data. 38
42 Figure 13. Residuals (observed predicted) of the aggregated proportion of fish in the larger weight classes (35-70 kg) from sampled and predicted catches by fishery and sample period (SHBS-MEST model). The line represents a lowess smoothed fit to the data. 39
43 Figure 14. Number of tag returns by recapture period (quarter) (SHBS-MEST model). Figure 15. Number of tag returns by periods at liberty (quarters) (SHBS-MEST model). 40
44 Figure 16. Number of tag returns by recapture period (quarter) for the various fisheries (or groups of fisheries) defined in the model (SHBS-MEST model). 41
45 Figure 17. Effort deviations by time period for each fishery (SHBS-MEST model). The vertical dotted lines indicate the point at which population projections are made with assumed levels of effort. 42
 and empirical age determination from otolith readings (bottom figure).")
46 Figure 18. Estimated mean lengths-at-age (heavy line) and the variability of length-at-age (shaded area represents ± 2 SD) (SHBS-MEST model). Age is in quarters and length is in cm (top figure). For comparison, length at age estimates are presented from tag release and recapture data (middle figure) and empirical age determination from otolith readings (bottom figure). The tagging data is presented as a linear growth vector (depicted as an arrow) from length at release to length at recovery. Only fish at liberty for at least 150 days are included. Age at release is assumed from the estimated growth function. 43

47 Figure 19. Estimated natural mortality rate by age class (SHBS-MEST model). The shaded area represents ± 2 SD. 44
48 Region 1 recruits Region 5 Region 4 Region 3 Region 2 Region Region 2 recruits Percentage of cohort Region 3 recruits Region 4 recruits Region 5 recruits Age-class (quarters) Figure 20. Regional distribution over time of simulated cohorts of 100 fish originating in each region (SHBS- MEST model). The cohorts have been decremented by age-specific natural mortality at each time step. 45

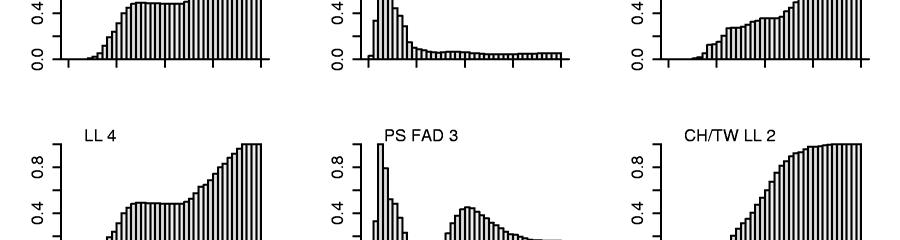
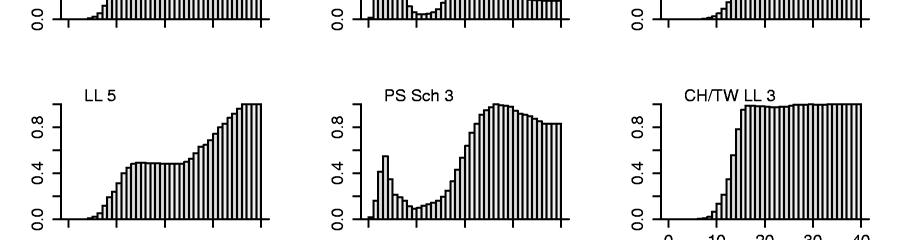
49 Figure 21. Selectivity coefficients, by fishery (SHBS-MEST model). 46
50 Figure 22. Average annual catchability time series, by fishery (SHBS-MEST model). The red dashed lines in LL1 LL5 are the catchability time series estimated for the SHBS-MEST-LLq model. 47


51 Figure 23. Estimated tag-reporting rates by fishery (black circles) (SHBS-MEST model). The white diamonds indicate the modes of the priors for each reporting rate and the grey bars (truncated at zero and 0.9, which were the bounds of the parameter estimates) indicate a range of ±1 prior SD. 48

52 Figure 24. Estimated annual recruitment (millions) by region and for the WCPO (SHBS-MEST model). The shaded area for the WCPO indicates the approximate 95% confidence intervals. The dotted vertical line delineates data-supported model estimates from projections. The vertical dotted lines indicate the point at which population projections are made with assumed levels of effort. 49

53 Figure 25. Estimated annual recruitment for the WCPO obtained from the separate analyses using different standardised effort for the LL1-LL5 longline fisheries. The vertical dotted line indicates the point at which population projections are made with assumed levels of effort. 50
54 Figure 26. Estimated annual average total biomass (thousand t) by region and for the WCPO (SHBS-MEST model). The shaded areas indicate the approximate 95% confidence intervals. The vertical dotted lines indicate the point at which population projections are made with assumed levels of effort. 51
55 Figure 27. Estimated annual average total biomass (million t) for the WCPO obtained from the separate analyses. The vertical dotted line indicates the point at which population projections are made with assumed levels of effort. 52
56 Figure 28. Estimated annual average juvenile and adult fishing mortality for the WCPO obtained from the separate analyses. 53
57 Figure 29. Comparison of the estimated biomass trajectories (lower heavy lines) with biomass trajectories that would have occurred in the absence of fishing (upper dashed lines) for each region and for the WCPO (SHBS-MEST model). Y-axis units are million t. 54
58 Figure 30. Ratios of exploited to unexploited total biomass (B t /B 0,t ) for each region and the WCPO (SHBS-MEST model). The shaded areas indicate the approximate 95% confidence intervals. The vertical dotted line indicates the point at which population projections are made with assumed levels of effort. 55
59 Figure 31. Ratios of exploited to unexploited total biomass (B t /B 0,t ) for the WCPO obtained from the separate analyses. The vertical dotted line indicates the point at which population projections are made with assumed levels of effort. 56


60 Figure 32. Estimates of reduction in total biomass due to fishing (fishery impact = 1-B t /B 0,t ) by region and for the WCPO attributed to various fishery groups (SHBS-MEST model). LL = all longline fisheries; ID = Indonesian domestic fishery; PH = Philippines domestic fisheries; PS FAD = purse seine FAD sets; PS non-fad = purse seine log and school sets. 57

61 Figure 33. Estimated relationship between equilibrium recruitment and equilibrium spawning biomass (SHBS-MEST model). The grey area indicates the 95% confidence region. Estimated recruitmentspawning biomass points are plotted as open circles. 58

62 Figure 34. Yield, equilibrium biomass and equilibrium spawning biomass as a function of fishing mortality multiplier (fmult) (SHBS-MEST model). The shaded areas represent approximate 95% confidence intervals. 59
YFT 1. Stock assessment of yellowfin tuna in the western and central Pacific Ocean. SCTB16 Working Paper. John Hampton 1 and Pierre Kleiber 2
 SCTB16 Working Paper YFT 1 Stock assessment of yellowfin tuna in the western and central Pacific Ocean John Hampton 1 and Pierre Kleiber 2 1 Oceanic Fisheries Programme, Secretariat of the Pacific Community,
SCIENTIFIC COMMITTEE SIXTH REGULAR SESSION August 2010 Nuku alofa, Tonga
 SCIENTIFIC COMMITTEE SIXTH REGULAR SESSION 10-19 August 2010 Nuku alofa, Tonga STOCK ASSESSMENT OF BIGEYE TUNA IN THE WESTERN AND CENTRAL PACIFIC OCEAN WCPFC-SC6-2010/SA-WP-04 Shelton Harley 1, Simon Hoyle
Preliminary analysis of yellowfin tuna catch, effort, size and tagging data using an integrated age-structured model
 Preliminary analysis of yellowfin tuna catch, effort, size and tagging data using an integrated age-structured model Introduction John Hampton Secretariat of the Pacific Community Noumea, New Caledonia
Stock assessment of yellowfin tuna in the western and central Pacific Ocean
 SCTB15 Working Paper YFT-1 Stock assessment of yellowfin tuna in the western and central Pacific Ocean John Hampton Oceanic Fisheries Programme Secretariat of the Pacific Community Noumea, New Caledonia
Stock assessment of skipjack tuna in the western and central Pacific Ocean
 WCPFC SC1 SA WP 4 1st Meeting of the Scientific Committee of the Western and Central Pacific Fisheries Commission WCPFC SC1 Noumea, New Caledonia 8 19 August 2005 Stock assessment of skipjack tuna in the
An update of the application of the A-SCALA method to bigeye tuna in the western and central Pacific Ocean
 SCTB15 Working Paper BET-6 An update of the application of the A-SCALA method to bigeye tuna in the western and central Pacific Ocean Chi-Lu Sun 1, Mark Maunder, George Watters, and Su-Zan Yeh 1 1 Institute
An update of the 2015 Indian Ocean Yellowfin Tuna stock assessment for 2016
 IOTC-2016-WPTT18-27 Received: 14 October 2016 An update of the 2015 Indian Ocean Yellowfin Tuna stock assessment for 2016 Adam Langley, IOTC Consultant 1. Introduction A stock assessment of the Indian
SCIENTIFIC COMMITTEE EIGHTH REGULAR SESSION August 2012 Busan, Republic of Korea
 SCIENTIFIC COMMITTEE EIGHTH REGULAR SESSION 7-15 August 2012 Busan, Republic of Korea STOCK ASSESSMENT OF ALBACORE TUNA IN THE SOUTH PACIFIC OCEAN WCPFC-SC8-2012/SA-WP-04-REV1 1 Simon HoyleF F, John Hampton,
SCIENTIFIC COMMITTEE SEVENTH REGULAR SESSION August 2011 Pohnpei, Federated States of Micronesia
 SCIENTIFIC COMMITTEE SEVENTH REGULAR SESSION 9-17 August 2011 Pohnpei, Federated States of Micronesia STOCK ASSESSMENT OF SKIPJACK TUNA IN THE WESTERN AND CENTRAL PACIFIC OCEAN WCPFC-SC7-2011/SA-WP-04
SCIENTIFIC COMMITTEE FIFTH REGULAR SESSION August 2009 Port Vila, Vanuatu
 SCIENTIFIC COMMITTEE FIFTH REGULAR SESSION 10-21 August 2009 Port Vila, Vanuatu STOCK ASSESSMENT OF ALBACORE TUNA IN THE SOUTH PACIFIC OCEAN WCPFC-SC5-2009/SA-WP-6 Simon Hoyle 1 and Nick Davies 1 1 Oceanic
SCIENTIFIC COMMITTEE TWELFTH REGULAR SESSION. Bali, Indonesia 3-11 August 2016
 SCIENTIFIC COMMITTEE TWELFTH REGULAR SESSION Bali, Indonesia 3-11 August 216 Relative impacts of FAD and free-school purse seine fishing on skipjack tuna stock status, incorporating non-linear purse seine
SOUTH PACIFIC COMMISSION. TWENTY-SECOND REGIONAL TECHNICAL MEETING ON FISHERIES (Noumea, New Caledonia, 6-10 August 1990)
") Page 1 ORIGINAL : ENGLISH SOUTH PACIFIC COMMISSION TWENTY-SECOND REGIONAL TECHNICAL MEETING ON FISHERIES (Noumea, New Caledonia, 6-10 August 1990) STOCK STATUS OF SKIPJACK TUNA IN THE WESTERN TROPICAL
Page 1 ORIGINAL : ENGLISH SOUTH PACIFIC COMMISSION TWENTY-SECOND REGIONAL TECHNICAL MEETING ON FISHERIES (Noumea, New Caledonia, 6-10 August 1990) STOCK STATUS OF SKIPJACK TUNA IN THE WESTERN TROPICAL
YELLOWFIN TUNA (YFN) (Thunnus albacares)
 (Thunnus albacares)") 1003 YELLOWFIN TUNA (YFN) (Thunnus albacares) 1. FISHERY SUMMARY Yellowfin tuna were introduced into the QMS on 1 October 2004 under a single QMA, YFN 1, with allowances, TACC, and TAC in Table 1. Table
1003 YELLOWFIN TUNA (YFN) (Thunnus albacares) 1. FISHERY SUMMARY Yellowfin tuna were introduced into the QMS on 1 October 2004 under a single QMA, YFN 1, with allowances, TACC, and TAC in Table 1. Table
Stock assessment of skipjack tuna in the western and central Pacific Ocean. John Hampton
 SCTB5 Working Paper SKJ Stock assessment of skipjack tuna in the western and central Pacific Ocean John Hampton Oceanic Fisheries Programme Secretariat of the Pacific Community Noumea, New Caledonia Background.
PACIFIC BLUEFIN TUNA STOCK ASSESSMENT
 PACIFIC BLUEFIN TUNA STOCK ASSESSMENT SUMMARY 19-21 December 2012 Webinar PACIFIC BLUEFIN TUNA STOCK ASSESSMENT SUMMARY 1. Stock Identification and Distribution Pacific bluefin tuna (Thunnus orientalis)
A REVIEW AND EVALUATION OF NATURAL MORTALITY FOR THE ASSESSMENT AND MANAGEMENT OF YELLOWFIN TUNA IN THE EASTERN PACIFIC OCEAN
 A REVIEW AND EVALUATION OF NATURAL MORTALITY FOR THE ASSESSMENT AND MANAGEMENT OF YELLOWFIN TUNA IN THE EASTERN PACIFIC OCEAN Mark N. Maunder and Alex Aires-da-Silva Outline YFT history Methods to estimate
STOCK ASSESSMENT OF YELLOWFIN TUNA IN THE EASTERN PACIFIC OCEAN UPDATE OF 2011 STOCK ASSESSMENT. January 1975 December 2011
 STOCK ASSESSMENT OF YELLOWFIN TUNA IN THE EASTERN PACIFIC OCEAN UPDATE OF 2011 STOCK ASSESSMENT January 1975 December 2011 Outline Stock assessment (base case model) Methodology (Stock Synthesis) Fishery
Status of yellowfin tuna in the eastern Pacific Ocean in 2001 and outlook for 2002
 SCTB15 Working Paper YFT-3 Status of yellowfin tuna in the eastern Pacific Ocean in 2001 and outlook for 2002 Mark N. Maunder Inter-American Tropical Tuna Commission (IATTC) La Jolla, California, USA STATUS
Estimates of large-scale purse seine and longline fishing capacity in the western and central Pacific based on stock assessments of target species
 Methodological Workshop On The Management Of Tuna Fishing Capacity: Stock Status, Data Envelopment Analysis, Industry Surveys and Management Options La Jolla, CA, USA, 8 12 May 2006 Document P10/A7 Estimates
WORKING GROUP TO REVIEW STOCK ASSESSMENTS 8 TH MEETING. DOCUMENT SAR-8-09a STATUS OF BIGEYE TUNA IN THE EASTERN PACIFIC OCEAN
 INTER-AMERICAN TROPICAL TUNA COMMISSION WORKING GROUP TO REVIEW STOCK ASSESSMENTS 8 TH MEETING LA JOLLA, CALIFORNIA (USA) 7- MAY 7 DOCUMENT SAR-8-9a STATUS OF BIGEYE TUNA IN THE EASTERN PACIFIC OCEAN Alexandre
STOCK STATUS OF SOUTHERN BLUEFIN TUNA
 7 th Expert Consultation on Indian Ocean Tunas, Victoria, Seychelles, 9-14 November, 1998 STOCK STATUS OF SOUTHERN BLUEFIN TUNA Tsuji, S. 1 Introduction The Commission for the Conservation of Southern
SCIENTIFIC COMMITTEE TWELFTH REGULAR SESSION Bali, Indonesia 3 11 August 2016
 SCIENTIFIC COMMITTEE TWELFTH REGULAR SESSION Bali, Indonesia 3 11 August 2016 Stock assessment of skipjack tuna in the western and central Pacific Ocean WCPFC-SC12-2016/SA-WP-04 S. McKechnie 1, J Hampton
Monitoring the length structure of commercial landings of albacore tuna during the fishing year
 SCTB15 Working Paper ALB-5 Monitoring the length structure of commercial landings of albacore tuna during the 2001 2002 fishing year Linda Griggs National Institute of Water and Atmospheric Research Ltd.
2017 North Pacific Albacore Stock Assessment
 2017 North Pacific Albacore Stock Assessment 13 th Regular Session of the Northern Committee August 28-September 1, 2017 Busan, Republic of Korea ISC-Albacore Working Group 2017 North Pacific Albacore
Managing Pacific Tuna stocks under strong fishing pressure and Climate Change impact
 3rd PICES/ICES/IOC Symposium on Effects of Climate Change on the World s Oceans Mar 23-27, 2015, Santos City, Brazil Managing Pacific Tuna stocks under strong fishing pressure and Climate Change impact
Report on Biology, Stock Status and Management of Southern Bluefin Tuna: 2017
 Attachment 11 Report on Biology, Stock Status and Management of Southern Bluefin Tuna: 2017 The CCSBT Extended Scientific Committee (ESC) updated the stock assessment and conducted a review of fisheries
Figure 1. Total western central Pacific Ocean (WCPO) tuna catch by species (SKJ; skipjack, YFT; yellowfin, BET; bigeye tuna, ALB; albacore)
 tuna catch by species (SKJ; skipjack, YFT; yellowfin, BET; bigeye tuna, ALB; albacore)") The tuna fisheries in the Pacific Ocean have economical importance for the majority of Pacific countries. The 1999 Pacific tuna catch (2,380,271 mt) represented 67% of the provisional estimate of world
The tuna fisheries in the Pacific Ocean have economical importance for the majority of Pacific countries. The 1999 Pacific tuna catch (2,380,271 mt) represented 67% of the provisional estimate of world
INTER-AMERICAN TROPICAL TUNA COMMISSION SCIENTIFIC ADVISORY COMMITTEE FOURTH MEETING. La Jolla, California (USA) 29 April - 3 May 2013
 29 April - 3 May 2013") INTER-AMERICAN TROPICAL TUNA COMMISSION SCIENTIFIC ADVISORY COMMITTEE FOURTH MEETING La Jolla, California (USA) 29 April - 3 May 2013 DOCUMENT SAC-04-04c INDICES OF RELATIVE ABUNDANCE OF YELLOWFIN TUNA
INTER-AMERICAN TROPICAL TUNA COMMISSION SCIENTIFIC ADVISORY COMMITTEE FOURTH MEETING La Jolla, California (USA) 29 April - 3 May 2013 DOCUMENT SAC-04-04c INDICES OF RELATIVE ABUNDANCE OF YELLOWFIN TUNA
WORKING GROUP ON STOCK ASSESSMENTS 5 TH MEETING DOCUMENT SAR-5-08 TARGET SIZE FOR THE TUNA FLEET IN THE EASTERN PACIFIC OCEAN
 INTER-AMERICAN TROPICAL TUNA COMMISSION COMISIÓN INTERAMERICANA DEL ATÚN TROPICAL WORKING GROUP ON STOCK ASSESSMENTS 5 TH MEETING LA JOLLA, CALIFORNIA (USA) 11-13 MAY 2004 DOCUMENT SAR-5-08 TARGET SIZE
Preliminary results of SEPODYM application to albacore. in the Pacific Ocean. Patrick Lehodey
 SCTB15 Working Paper ALB-6 Preliminary results of SEPODYM application to albacore in the Pacific Ocean Patrick Lehodey Oceanic Fisheries Programme Secretariat of the Pacific Community Noumea, New Caledonia
YELLOWFIN TUNA (YFN)
") YELLOWFIN TUNA (YFN) (Thunnus albacares) 1. FISHERY SUMMARY Yellowfin tuna were introduced into the QMS on 1 October 2004 under a single QMA, YFN 1, with allowances, TACC, and TAC in Table 1. Table 1:
YELLOWFIN TUNA (YFN) (Thunnus albacares) 1. FISHERY SUMMARY Yellowfin tuna were introduced into the QMS on 1 October 2004 under a single QMA, YFN 1, with allowances, TACC, and TAC in Table 1. Table 1:
SCTB17 Working Paper SWG 5
 SCTB17 Working Paper SWG 5 AVAILABILITY OF OBSERVER DATA FOR ESTIMATING CATCHES OF NON-TARGET SPECIES BY LONGLINERS IN THE WESTERN AND CENTRAL PACIFIC OCEAN, WITH CATCH ESTIMATES FOR OFFSHORE FLEETS IN
WCPFC SC1 ST WP 4. Tim Lawson and Peter Williams. Oceanic Fisheries Programme Secretariat of the Pacific Community Noumea, New Caledonia
 WCPFC SC1 ST WP 4 1st Meeting of the Scientific Committee of the Western and Central Pacific Fisheries Commission WCPFC SC1 Noumea, New Caledonia 8 19 August 2005 COMPARISON OF THE SPECIES COMPOSITION
92 ND MEETING DOCUMENT IATTC-92 INF-C
 INTER-AMERICAN TROPICAL TUNA COMMISSION 92 ND MEETING Mexico City, Mexico 24-28 July 2017 DOCUMENT IATTC-92 INF-C POTENTIAL EFFECTS ON TUNA STOCKS OF ALTERNATIVE MANAGEMENT SCHEMES At the request of a
Indian Ocean Tuna Commission (IOTC) Stock assessment of Indian Ocean bigeye tuna using integrated
 Stock assessment of Indian Ocean bigeye tuna using integrated") Working paper for 19 th Session of the Working Party on Tropical Tunas (WPTT19) Indian Ocean Tuna Commission (IOTC) Victoria, Seychelles 17-22 October 2017 Stock assessment of Indian Ocean bigeye tuna
Working paper for 19 th Session of the Working Party on Tropical Tunas (WPTT19) Indian Ocean Tuna Commission (IOTC) Victoria, Seychelles 17-22 October 2017 Stock assessment of Indian Ocean bigeye tuna
ISC Pacific Bluefin tuna Stock Assessment 2016
 ISC Pacific Bluefin tuna Stock Assessment 2016 Completed in 2016-Feb. 29 th to 2016-Apr. 12 th at La Jolla, USA ISC Pacific Bluefin tuna Working Group 2016/5/10 San Diego Marriott La Jolla -IATTC SAC 07-
STOCK ASSESSMENT OF ALBACORE TUNA IN THE NORTH PACIFIC OCEAN IN 2011
 STOCK ASSESSMENT OF ALBACORE TUNA IN THE NORTH PACIFIC OCEAN IN 2011 Report of the ISC-Albacore Working Group Stock Assessment Workshop 3rd Science Advisory Committee Meeting Inter-American Tropical Tuna
Albacore Tuna, South Pacific, Troll, Pole and Line
 Albacore Tuna, South Pacific, Troll, Pole and Line Content last updated 8th Mar 2016 Stock: South Pacific Albacore Tuna, South Pacific, Troll, Pole and Line Management: Inter-American Tropical Tuna Commission
Impact of Industrial Tuna Fisheries on Fish Stocks and the Ecosystem of the Pacific Ocean
 Impact of Industrial Tuna Fisheries on Fish Stocks and the Ecosystem of the Pacific Ocean www.soest.hawaii.edu/pfrp/large_pelagics/large_pelagic_predators John Sibert John Hampton Pelagic Fisheries Research
OVERVIEW OF THE WESTERN AND CENTRAL PACIFIC OCEAN TUNA FISHERIES, Antony D. Lewis and Peter G. Williams
 i SCTB15 Working Paper GEN 1 OVERVIEW OF THE WESTERN AND CENTRAL PACIFIC OCEAN TUNA FISHERIES, 21 Antony D. Lewis and Peter G. Williams Oceanic Fisheries Programme (OFP) Secretariat of the Pacific Community
Paper prepared by the Secretariat
 COMMISSION FOURTEENTH REGULAR SESSION Manila, Philippines 3 7 December 2017 REFERENCE DOCUMENT FOR REVIEW OF CMM 2005-03 AND FOR THE DEVELOPMENT OF HARVEST STRATEGIES UNDER CMM 2014-06 North Pacific Albacore
COORDINATING WORKING PARTY ON FISHERY STATISTICS. Nineteenth Session. Noumea, New Caledonia, July 2001 AGENCY REPORT.
 June 2001 CWP/19/SPC E COORDINATING WORKING PARTY ON FISHERY STATISTICS Nineteenth Session Noumea, New Caledonia, 10-13 July 2001 AGENCY REPORT Author: SPC W0000 3 AGENCY PROGRAMMES IN FISHERY STATISTICS:
WORKING GROUP ON STOCK ASSESSMENTS 5 TH MEETING DOCUMENT SAR-5-05 SKJ
 INTER-AMERICAN TROPICAL TUNA COMMISSION COMISIÓN INTERAMERICANA DEL ATÚN TROPICAL WORKING GROUP ON STOCK ASSESSMENTS 5 TH MEETING LA JOLLA, CALIFORNIA (USA) 11-13 MAY 24 DOCUMENT SAR-5-5 SKJ STATUS OF
Update on Blue Marlin Stock Assessment. Secretariat of the Pacific Community, Noumea, New Caledonia
 SCTB15 Working Paper BBRG-10 Update on Blue Marlin Stock Assessment Pierre Kleiber 1, John Hampton 2, Michael G. Hinton 3, and Yuji Uozimi 4 1 National Marine Fisheries Service, Honolulu Laboratory, Hawaii,
Overview of tuna fisheries in the Western and Central Pacific Ocean, including economic conditions 2015 (WCPFC-SC /GN WP-1)
") Overview of tuna fisheries in the Western and Central Pacific Ocean, including economic conditions 2015 (WCPFC-SC12-2016/GN WP-1) Peter Williams1 and Peter Terawasi2 Co-presented by Dr Chris Reid Twelfth
Overview of tuna fisheries in the Western and Central Pacific Ocean, including economic conditions 2015 (WCPFC-SC12-2016/GN WP-1) Peter Williams1 and Peter Terawasi2 Co-presented by Dr Chris Reid Twelfth
SCIENTIFIC COMMITTEE SECOND REGULAR SESSION August 2006 Manila, Philippines
 SCIENTIFIC COMMITTEE SECOND REGULAR SESSION 7-18 August 2006 Manila, Philippines MEASUREMENT-POINTS EXAMINATION OF CIRCLE HOOKS FOR PELAGIC LONGLINE FISHERY TO EVALUATE EFFECTS OF HOOK DESIGN WCPFC-SC2-2006/EB
SCIENTIFIC COMMITTEE TENTH REGULAR SESSION. Majuro, Republic of the Marshall Islands 6-14 August 2014
 SCIENTIFIC COMMITTEE TENTH REGULAR SESSION Majuro, Republic of the Marshall Islands 6-14 August 214 OVERVIEW OF SIZE DATA FOR BIGEYE TUNA CAUGHT BY JAPANESE LONGLINE FISHERY IN THE PACIFIC OCEAN WCPFC-SC1-214/
Research Priorities of the SPC Oceanic Fisheries Programme. John Hampton Oceanic Fisheries Programme Secretariat of the Pacific Community
 Research Priorities of the SPC Oceanic Fisheries Programme John Hampton Oceanic Fisheries Programme Secretariat of the Pacific Community Outline Tuna fishery and stocks OFP Strategic Plan 2006-2008 Research
Assessment Summary Report Gulf of Mexico Red Snapper SEDAR 7
 Assessment Summary Report Gulf of Mexico Red Snapper SEDAR 7 Stock Distribution: Red snapper are found throughout the Gulf of Mexico, the Caribbean Sea, and from the U.S. Atlantic Coast to northern South
Proposal for biomass and fishing mortality limit reference points based on reductions in recruitment. Mark N. Maunder and Richard B.
 Proposal for biomass and fishing mortality limit reference points based on reductions in recruitment Mark N. Maunder and Richard B. Deriso IATTC Limit Reference Points: Background Triggering an LRP should
NINTH MEETING DOCUMENT SAC-09-16
 INTER-AMERICAN TROPICAL TUNA COMMISSION SCIENTIFIC ADVISORY COMMITTEE NINTH MEETING La Jolla, California (USA) 14-18 May 2018 DOCUMENT SAC-09-16 STOCK STATUS INDICATORS FOR BIGEYE TUNA Mark N. Maunder,
SCIENTIFIC COMMITTEE NINTH REGULAR SESSION. Pohnpei, Federated States of Micronesia 6-14 August 2013
 SCIENTIFIC COMMITTEE NINTH REGULAR SESSION Pohnpei, Federated States of Micronesia 6-14 August 2013 REPORT OF THE PACIFIC TUNA TAGGING PROGRAMME STEERING COMMITTEE WCPFC-SC9-2013/RP-PTTP-02 PTTP Steering
Pacific Blue Marlin Stock Assessment Update in ISC Billfish Working Group
 Pacific Blue Marlin Stock Assessment Update in 2016 ISC Billfish Working Group Overview Overview of the 2013 Pacific Blue Marlin Stock Assessment 2016 Assessment Data and Model Blue Marlin Life History
SCTB16 Working Paper SWG 6
 SCTB16 Working Paper SWG 6 ANALYSIS OF THE PROPORTION OF BIGEYE IN YELLOWFIN PLUS BIGEYE CAUGHT BY PURSE SEINERS IN THE WESTERN AND CENTRAL PACIFIC OCEAN, BASED ON OBSERVER DATA Tim Lawson Oceanic Fisheries
Tuna [211] 86587_p211_220.indd 86587_p211_220.indd /30/04 12/30/04 4:53:37 4:53:37 PM PM
![Tuna [211] 86587_p211_220.indd 86587_p211_220.indd /30/04 12/30/04 4:53:37 4:53:37 PM PM](/thumbs/85/92584906.jpg "Tuna [211] 86587_p211_220.indd 86587_p211_220.indd /30/04 12/30/04 4:53:37 4:53:37 PM PM") Tuna [] highlights Ocean and Climate Changes The catches of Pacific bluefin tuna and North Pacific albacore tuna have fluctuated considerably from year to year, but no upward or downward trends are apparent
Tuna [] highlights Ocean and Climate Changes The catches of Pacific bluefin tuna and North Pacific albacore tuna have fluctuated considerably from year to year, but no upward or downward trends are apparent
REVISION OF THE WPTT PROGRAM OF WORK
 REVISION OF THE WPTT PROGRAM OF WORK IOTC 2016 WPTT18 08 Rev 1 PREPARED BY: IOTC SECRETARIAT 1, 3 OCTOBER 2016 PURPOSE To ensure that the participants at the 18 th Working Party on Tropical Tunas (WPTT18)
Predicting skipjack tuna dynamics and effects of climate change using SEAPODYM with fishing and tagging data
 Predicting skipjack tuna dynamics and effects of climate change using SEAPODYM with fishing and tagging data Working Doc.: WCPFC-SC12-2016/EB WP01 Inna Senina 1 Patrick Lehodey 1 Beatriz Calmettes 1 Simon
Longline CPUE indices for bigeye and yellowfin in the Pacific Ocean using GLM and statistical habitat standardisation methods.
 WCPFC SC1 SA WP 8 1st Meeting of the Scientific Committee of the Western and Central Pacific Fisheries Commission WCPFC SC1 Noumea, New Caledonia 8 19 August 2005 Longline CPUE indices for bigeye and yellowfin
ANALYSIS OF LONGLINE CATCH PER VESSEL IN THE WESTERN AND CENTRAL PACIFIC OCEAN
 ANALYSIS OF LONGLINE CATCH PER VESSEL IN THE WESTERN AND CENTRAL PACIFIC OCEAN Tim. Lawson Oceanic Fisheries Programme Internal Report No. 40 Oceanic Fisheries Programme Secretariat of the Pacific Community
SCIENTIFIC COMMITTEE THIRD REGULAR SESSION August 2007 Honolulu, United States of America
 SCIENTIFIC COMMITTEE THIRD REGULAR SESSION 13-24 August 2007 Honolulu, United States of America ANNUAL REPORT PART 1 INFORMATION ON FISHERIES, RESEARCH, AND STATISTICS WCPFC-SC3-AR PART 1/WP-15 REPUBLIC
A Combined Recruitment Index for Demersal Juvenile Cod in NAFO Divisions 3K and 3L
 NAFO Sci. Coun. Studies, 29: 23 29 A Combined Recruitment Index for Demersal Juvenile Cod in NAFO Divisions 3K and 3L David C. Schneider Ocean Sciences Centre, Memorial University St. John's, Newfoundland,
Taiwan Tuna Fisheries in the Western Pacific Ocean
 NATIONAL TUNA FISHERY REPORT Taiwan Tuna Fisheries in the Western Pacific Ocean Background paper presented in the tenth meeting of the standing committee on Tuna and Billfish (Nadi, 16-18 June, 1997) Fisheries
ISC 1 Billfish Working Group
 SCIENTIFIC COMMITTEE TWELFTH REGULAR SESSION Bali, Indonesia 3-11 August 2016 Stock Assessment Update for Blue Marlin (Makaira nigricans) in the Pacific Ocean through 2014 WCPFC-SC12-2016/ SA WP-12 ISC
YELLOWFIN TUNA - TECHNICAL SYNOPSIS OF FISHERIES AND RESOURCE STATUS IN THE WESTERN-CENTRAL PACIFIC OCEAN
 YELLOWFIN TUNA - TECHNICAL SYNOPSIS OF FISHERIES AND RESOURCE STATUS IN THE WESTERN-CENTRAL PACIFIC OCEAN I. DATE OF SYNOPSIS: JULY 2001 II. DESCRIPTION OF FISHERIES (INCLUDING RECENT DEVELOPMENTS) The
Yellowfin Tuna, Indian Ocean, Troll/ pole and line
 Yellowfin Tuna, Indian Ocean, Troll/ pole and line Yellowfin Tuna, Indian Ocean, Troll/ pole and line Content last updated 7th Mar 2017 Stock: Indian Ocean Management: Indian Ocean Tuna Commission Overview
Draft. Hiroki Yokoi, Yasuko Semba, Keisuke Satoh, Tom Nishida
 Draft Standardization of catch rate for blue marlin (Makaira mazara) exploited by the Japanese tuna longline fisheries in the Indian Ocean from 1971 to 2015 Hiroki Yokoi, Yasuko Semba, Keisuke Satoh, Tom
Updated and revised standardized catch rate of blue sharks caught by the Taiwanese longline fishery in the Indian Ocean
 Updated and revised standardized catch rate of blue sharks caught by the Taiwanese longline fishery in the Indian Ocean Wen-Pei Tsai 1,3 and Kwang-Ming Liu 2 1 Department of Fisheries Production and Management,
ESTIMATES OF WESTERN AND CENTRAL PACIFIC OCEAN BIGEYE TUNA CATCH AND POPULATION PARAMETERS. John Hampton, Antony Lewis and Peter Williams
 U)Pl ESTIMATES OF WESTERN AND CENTRAL PACIFIC OCEAN BIGEYE TUNA CATCH AND POPULATION PARAMETERS John Hampton, Antony Lewis and Peter Williams Oceanic Fisheries Programme South Pacific Commission Noumea,
SCIENTIFIC COMMITTEE THIRTEENTH REGULAR SESSION. Rarotonga, Cook Islands 9-17 August 2017
 SCIENTIFIC COMMITTEE THIRTEENTH REGULAR SESSION Rarotonga, Cook Islands 9-17 August 2017 Updating indicators of effort creep in the WCPO purse seine fishery WCPFC-SC13-2017/MI-IP-04 Graham Pilling 1, the
Indian Ocean Tuna Commission (IOTC) Victoria, Seychelles, 5-10 November Stock assessment of Indian Ocean bigeye tuna (Thunnus obesus) using
 Victoria, Seychelles, 5-10 November Stock assessment of Indian Ocean bigeye tuna (Thunnus obesus) using") Working paper for the 18 th Session of the Working Party on Tropical Tunas Indian Ocean Tuna Commission (IOTC) Victoria, Seychelles, 5-10 November 2016 Stock assessment of Indian Ocean bigeye tuna (Thunnus
Working paper for the 18 th Session of the Working Party on Tropical Tunas Indian Ocean Tuna Commission (IOTC) Victoria, Seychelles, 5-10 November 2016 Stock assessment of Indian Ocean bigeye tuna (Thunnus
Draft. Tom Nishida and Hiroki Yokoi. National Research Institute of Far Seas Fisheries, Fisheries Research Agency, Shimizu, Shizuoka, Japan ABSTRACT
 IOTC 26 WPB4 26 Draft Stock assessments of blue marlin (makaira nigricans) in the Indian Ocean using A Stock-Production Model Incorporating Covariates (ASPIC) (95-25) Tom Nishida and Hiroki Yokoi National
ISSN (online) ISBN (online) July New Zealand Fisheries Assessment Report 2017/41. P.L. Horn C.P.
 ISBN (online) July New Zealand Fisheries Assessment Report 2017/41. P.L. Horn C.P.") Catch-at-age for hake (Merluccius australis) and ling (Genypterus blacodes) in the 1 16 fishing year and from two research trawl surveys in 16, with a summary of all available data sets from the New Zealand
Catch-at-age for hake (Merluccius australis) and ling (Genypterus blacodes) in the 1 16 fishing year and from two research trawl surveys in 16, with a summary of all available data sets from the New Zealand
17-06 BFT RECOMMENDATION BY ICCAT FOR AN INTERIM CONSERVATION AND MANAGEMENT PLAN FOR WESTERN ATLANTIC BLUEFIN TUNA
 17-06 BFT RECOMMENDATION BY ICCAT FOR AN INTERIM CONSERVATION AND MANAGEMENT PLAN FOR WESTERN ATLANTIC BLUEFIN TUNA RECALLING the Recommendation by ICCAT to Establish a Rebuilding Program for Western Atlantic
WORKING GROUP ON STOCK ASSESSMENTS 5 TH MEETING DOCUMENT SAR-5-05 BET A
 INTER-AMERICAN TROPICAL TUNA COMMISSION COMISIÓN INTERAMERICANA DEL ATÚN TROPICAL WORKING GROUP ON STOCK ASSESSMENTS 5 TH MEETING LA JOLLA, CALIFORNIA (USA) 11-13 MAY 2004 DOCUMENT SAR-5-05 BET A POSSIBLE
Yellowfin tuna catch opportunities in Cape Verde coping with uncertainties of local CPUEs
 Yellowfin tuna catch opportunities in Cape Verde coping with uncertainties of local CPUEs Foto Péricles Silva Ivanice Monteiro, Heino Fock and Péricles silva Lanzarote, April,19th 2018 Introdution Yellowfin
Standardized CPUE of Indian Albacore caught by Taiwanese longliners from 1980 to 2014 with simultaneous nominal CPUE portion from observer data
 Received: 4 July 2016 Standardized CPUE of Indian Albacore caught by Taiwanese longliners from 1980 to 2014 with simultaneous nominal CPUE portion from observer data Yin Chang1, Liang-Kang Lee2 and Shean-Ya
Year Avg. TAC Can Others Totals
 SKATE IN DIVISIONS 3L, 3N, 3O AND SUBDIVISION 3Ps Background There are 8 to 1 species of skate in the waters around Newfoundland. Of these, thorny skate (Raja radiata) is by far the most common, comprising
PARTIES TO THE PALAU ARRANGEMENT. 21 st ANNUAL MEETING 31 March 1 April 2016 Tarawa, Kiribati. PA21/WP.2: Purse Seine VDS TAE for
 PARTIES TO THE PALAU ARRANGEMENT 21 st ANNUAL MEETING 31 March 1 April 2016 Tarawa, Kiribati : Purse Seine VDS TAE for 2017-18 TAE Setting 1. Article 12.2 of the VDS Scheme text sets out the issues to
9.4.5 Advice September Widely distributed and migratory stocks Herring in the Northeast Atlantic (Norwegian spring-spawning herring)
") 9.4.5 Advice September 212 ECOREGION STOCK Widely distributed and migratory stocks Herring in the Northeast Atlantic (Norwegian spring-spawning herring) Advice for 213 ICES advises on the basis of the
9.4.5 Advice September 212 ECOREGION STOCK Widely distributed and migratory stocks Herring in the Northeast Atlantic (Norwegian spring-spawning herring) Advice for 213 ICES advises on the basis of the
SCTB16 Working Paper FTWG 5
 0 SCTB16 Working Paper FTWG 5 Fishery-related attributes associated with FAD and log fishing practices conducted by the U.S. purse seine fleet in the central-western Pacific Ocean, 1997 2002. Al Coan Jr.
TECHNICAL AND COMPLIANCE COMMITTEE NINTH REGULAR SESSION. 26 September 1 October 2013 Pohnpei, Federated States of Micronesia
 TECHNICAL AND COMPLIANCE COMMITTEE NINTH REGULAR SESSION 26 September 1 October 2013 Pohnpei, Federated States of Micronesia A PROPOSAL FOR CLEARER GUIDELINES TO SATISFY THE REQUIRED LEVEL OF ROP LONGLINE
Standardized catch rates of U.S. blueline tilefish (Caulolatilus microps) from commercial logbook longline data
 from commercial logbook longline data") Standardized catch rates of U.S. blueline tilefish (Caulolatilus microps) from commercial logbook longline data Sustainable Fisheries Branch, National Marine Fisheries Service, Southeast Fisheries Science
Standardized catch rates of U.S. blueline tilefish (Caulolatilus microps) from commercial logbook longline data Sustainable Fisheries Branch, National Marine Fisheries Service, Southeast Fisheries Science
CPUE standardization of black marlin (Makaira indica) caught by Taiwanese large scale longline fishery in the Indian Ocean
 caught by Taiwanese large scale longline fishery in the Indian Ocean") CPUE standardization of black marlin (Makaira indica) caught by Taiwanese large scale longline fishery in the Indian Ocean Sheng-Ping Wang Department of Environmental Biology and Fisheries Science, National
CPUE standardization of black marlin (Makaira indica) caught by Taiwanese large scale longline fishery in the Indian Ocean Sheng-Ping Wang Department of Environmental Biology and Fisheries Science, National
8.9 SWO-ATL ATLANTIC SWORDFISH
 EXECUTIVE SUMMARY SWO-ATL 8.9 SWO-ATL ATLANTIC SWORDFISH The status of the North and swordfish stocks was assessed in 2017, by means of applying statistical modelling to the available data up to 2015.
STANDARDIZED CATCH RATE OF SAILFISH (Istiophorus platypterus) CAUGHT BY BRAZILIAN LONGLINERS IN THE ATLANTIC OCEAN ( )
 CAUGHT BY BRAZILIAN LONGLINERS IN THE ATLANTIC OCEAN ( )") SCRS/2008/079 STANDARDIZED CATCH RATE OF SAILFISH (Istiophorus platypterus) CAUGHT BY BRAZILIAN LONGLINERS IN THE ATLANTIC OCEAN (1986-2006) Catarina Wor 12 ; Bruno L. Mourato 1,3 ; Humberto G. Hazin 1
SCRS/2008/079 STANDARDIZED CATCH RATE OF SAILFISH (Istiophorus platypterus) CAUGHT BY BRAZILIAN LONGLINERS IN THE ATLANTIC OCEAN (1986-2006) Catarina Wor 12 ; Bruno L. Mourato 1,3 ; Humberto G. Hazin 1
YELLOWFIN TUNA (Thunnus albacares)
") WETJENS DIMMLICH / W FACTSHEET APRIL 2015 WF SFI Smart Fishing Initiative (SFI): species overview YELLOWFIN TUNA (Thunnus albacares) Region: Indian Ocean IOTC status 2014: not subject to overfishing [1]
WETJENS DIMMLICH / W FACTSHEET APRIL 2015 WF SFI Smart Fishing Initiative (SFI): species overview YELLOWFIN TUNA (Thunnus albacares) Region: Indian Ocean IOTC status 2014: not subject to overfishing [1]
A PRELIMINARY STOCK ASSESSMENT FOR NORTHERN ALBACORE USING THE FULLY INTEGRATED STOCK ASSESSMENT MODEL, MULTIFAN-CL
 SCRS/2013/058 Collect. Vol. Sci. Pap. ICCAT, 70(3): 1094-1107 (2014) A PRELIMINARY STOCK ASSESSMENT FOR NORTHERN ALBACORE USING THE FULLY INTEGRATED STOCK ASSESSMENT MODEL, MULTIFAN-CL Gorka Merino 1,
Changes in Abundance and Spatial Distribution of Southern Bluefin Tuna
 Changes in Abundance and Spatial Distribution of Southern Bluefin Tuna Tom Polacheck April 2008 Acknowledgements Paige Eveson Dale Kolody Marinelle Basson Bill Hearn John Gunn Sophie Bestley Alistair Hobday
THE WESTERN AND CENTRAL PACIFIC TUNA FISHERY:
 THE WESTERN AND CENTRAL PACIFIC TUNA FISHERY: 2013 OVERVIEW AND STATUS OF STOCKS Shelton Harley, Peter Williams, Simon Nicol and John Hampton Secretariat of the Pacific Community Oceanic Fisheries Programme
SCIENTIFIC COMMITTEE EIGHTH REGULAR SESSION August 2012 Busan, Republic of Korea
 SCIENTIFIC COMMITTEE EIGHTH REGULAR SESSION - August Busan, Republic of Korea Report on Project : Collection and Evaluation of Purse-Seine Species Composition Data WCPFC SC / ST WP Timothy Lawson, Ferral
Quang C. Huynh SEDAR46-RW-01
 Estimating total mortality rates and calculating overfishing limits from length observations for six U.S. Caribbean stocks Quang C. Huynh SEDAR46-RW-01 14 January 2016 This information is distributed solely
Information Paper for SAN (CI-4) Identifying the Spatial Stock Structure of Tropical Pacific Tuna Stocks
 Identifying the Spatial Stock Structure of Tropical Pacific Tuna Stocks") Current knowledge, key uncertainties and future research directions for defining the stock structure of skipjack, yellowfin, bigeye and South Pacific albacore tunas in the Pacific Ocean Information Paper
Current knowledge, key uncertainties and future research directions for defining the stock structure of skipjack, yellowfin, bigeye and South Pacific albacore tunas in the Pacific Ocean Information Paper
Some Biological Parameters of Bigeye and Yellowfin Tunas Distributed in Surrounding Waters of Taiwan
 SCTB15 Working Paper RG-1 Some Biological Parameters of Bigeye and Yellowfin Tunas Distributed in Surrounding Waters of Taiwan Shyh-Bin Wang 1, Feng-Chen Chang 1, Shui-Hei Wang 1, and Chin-Lau Kuo 2 1
PROPOSAL IATTC-92 B-4 REVISED SUBMITTED BY BELIZE, GUATEMALA, NICARAGUA, COSTA RICA AND PANAMA
 INTER-AMERICAN TROPICAL TUNA COMMISSION 92 ND MEETING Mexico City, Mexico 24-28 July 2017 PROPOSAL IATTC-92 B-4 REVISED SUBMITTED BY BELIZE, GUATEMALA, NICARAGUA, COSTA RICA AND PANAMA COMPENDIUM OF CONSERVATION
GLMM standardisation of the commercial abalone CPUE for Zones A-D over the period
 GLMM standardisation of the commercial abalone for Zones A-D over the period 1980 2015 Anabela Brandão and Doug S. Butterworth Marine Resource Assessment & Management Group (MARAM) Department of Mathematics
REVIEW OF BIGEYE TUNA CATCH INCLUDING FISH SIZE BY JAPANESE LONGLINE FISHERY IN THE ATLANTIC OCEAN
 1. Introduction Longline is the only tuna-fishing gear deployed by Japan at present in the Atlantic Ocean. Other two types of fishery, baitboat and purse seine fisheries, stopped fishing in the Atlantic
SWG-11-JM-10. F Limit Reference Points about Preventing Recruitment Overfishing and its Uncertainty
 11th Meeting of the Science Working Group Lima, Peru, 1-19 October 01 F Limit Reference Points about Preventing Recruitment Overfishing and its Uncertainty One of the purposes of reference points (RPs)
Updated abundance indicators for New Zealand blue, porbeagle and shortfin mako sharks
 CCSBT-ERS/1703/14 (Rev.1) (Agenda Item 5.2.1) Updated abundance indicators for New Zealand blue, porbeagle and shortfin mako sharks New Zealand Paper presented to the 12th Meeting of the Ecologically Related
Advice May Herring in Subdivisions and 32 (excluding Gulf of Riga herring)
") 8.3.10 Advice May 2014 ECOREGION STOCK Baltic Sea Herring in Subdivisions 25 29 and 32 (excluding Gulf of Riga herring) Advice for 2015 ICES advises on the basis of the MSY approach that catches in 2015
8.3.10 Advice May 2014 ECOREGION STOCK Baltic Sea Herring in Subdivisions 25 29 and 32 (excluding Gulf of Riga herring) Advice for 2015 ICES advises on the basis of the MSY approach that catches in 2015
ICCAT Secretariat. (10 October 2017)
") ICCAT Secretariat (10 October 2017) Bluefin tuna: Background information Managed by International Commission for the Conservation of Atlantic Tunas (ICCAT): Two stocks (mixing occurring, but extent not
ICCAT Secretariat (10 October 2017) Bluefin tuna: Background information Managed by International Commission for the Conservation of Atlantic Tunas (ICCAT): Two stocks (mixing occurring, but extent not