Subsistence Harvests of Pacific Halibut in Alaska, 2010
|
|
|
- Marybeth Hensley
- 6 years ago
- Views:
Transcription

1 Technical Paper No. 367 Subsistence Harvests of Pacific Halibut in Alaska, 2010 by James A. Fall and David Koster January 2012 Alaska Department of Fish and Game Division of Subsistence
2 Symbols and Abbreviations The following symbols and abbreviations, and others approved for the Système International d'unités (SI), are used without definition in the reports by the Division of Subsistence. All others, including deviations from definitions listed below, are noted in the text at first mention, as well as in the titles or footnotes of tables, and in figure or figure captions. Weights and measures (metric) centimeter deciliter gram hectare kilogram kilometer liter meter milliliter millimeter cm dl g ha kg km L m ml mm Weights and measures (English) cubic feet per second ft 3 /s foot ft gallon gal inch in mile mi nautical mile nmi ounce oz pound lb quart qt yard yd Time and temperature day d degrees Celsius C degrees Fahrenheit F degrees kelvin K hour h minute min second s Physics and chemistry all atomic symbols alternating current AC ampere A calorie cal direct current DC hertz Hz horsepower hp hydrogen ion activity (negative log of) ph parts per million ppm parts per thousand ppt, volts V watts W General all commonly-accepted abbreviations; e.g., Mr., Mrs., AM, PM, etc. all commonly-accepted professional titles; e.g., Dr., Ph.D., R.N., etc. Alaska Administrative Code AAC Alaska Department of Fish and Game ADF&G compass directions: east E north N south S west W copyright corporate suffixes: Company Co. Corporation Corp. Incorporated Inc. Limited Ltd. District of Columbia D.C. et alii (and others) et al. et cetera (and so forth) etc. exempli gratia (for example) e.g. Federal Information Code FIC id est (that is) i.e. latitude or longitude lat. or long. monetary symbols (U.S.) $, months (tables and figures): first three letters (Jan,...,Dec) registered trademark trademark United States (adjective) U.S. United States of America (noun) USA U.S.C. United States Code U.S. state use two-letter abbreviations (e.g., AK, WA) Measures (fisheries) fork length mideye-to-fork mideye-to-tail-fork standard length total length FL MEF METF SL TL Mathematics, statistics all standard mathematical signs, symbols and abbreviations alternate hypothesis H A approximately ~ base of natural logarithm e catch per unit effort CPUE coefficient of variation CV common test statistics (F, t, 2, etc.) confidence interval CI correlation coefficient (multiple) R correlation coefficient (simple) r covariance cov degree (angular) degrees of freedom df expected value E greater than > greater than or equal to harvest per unit effort HPUE less than < less than or equal to logarithm (natural) ln logarithm (base 10) log logarithm (specify base) log 2, etc. mean x minute (angular) ' not significant NS null hypothesis H O percent % plus or minus ± population size N probability P sample size n second (angular) " standard deviation σ or s standard error (of the mean) s x type I error probability P a type II error probability P b variance σ 2 or s 2
3 TECHNICAL PAPER NO. 367 SUBSISTENCE HARVESTS OF PACIFIC HALIBUT IN ALASKA, 2010 by James A. Fall, Alaska Department of Fish and Game, Division of Subsistence, Anchorage and David Koster Alaska Department of Fish and Game, Division of Subsistence, Anchorage Alaska Department of Fish and Game Division of Subsistence 333 Raspberry Road, Anchorage, Alaska, 99518, USA January 2012 Development and publication of this manuscript were partially financed by the U.S. Department of Commerce, National Oceanic and Atmospheric Administration, National Marine Fisheries Service, under award NA07NMF
4 The Division of Subsistence Technical Paper series was established in 1979 and represents the most complete collection of information about customary and traditional uses of fish and wildlife resources in Alaska. The papers cover all regions of the state. Some papers were written in response to specific fish and game management issues. Others provide detailed, basic information on the subsistence uses of particular communities which pertain to a large of scientific and policy questions. Technical Paper series reports are available through the Alaska Resources Library and Information Services (ARLIS), the Alaska State Library and on the Internet: This publication has undergone editorial and professional review. James A. Fall and David Koster, Alaska Department of Fish and Game, Division of Subsistence, 333 Raspberry Road, Anchorage, Alaska, 99518, USA This document should be cited as: Fall, J.A. and D. Koster Subsistence harvests of Pacific halibut in Alaska, Alaska Department of Fish and Game Division of Subsistence, Technical Paper No. 367, Anchorage. The Alaska Department of Fish and Game (ADF&G) administers all programs and activities free from discrimination based on race, color, national origin, age, sex, religion, marital status, pregnancy, parenthood, or disability. The department administers all programs and activities in compliance with Title VI of the Civil Rights Act of 1964, Section 504 of the Rehabilitation Act of 1973, Title II of the Americans with Disabilities Act (ADA) of 1990, the Age Discrimination Act of 1975, and Title IX of the Education Amendments of If you believe you have been discriminated against in any program, activity, or facility please write: ADF&G ADA Coordinator, P.O. Box , Juneau AK U.S. Fish and Wildlife Service, 4040 N. Fairfax Drive, Suite 300 Webb, Arlington VA Office of Equal Opportunity, U.S. Department of the Interior, Washington DC The department s ADA Coordinator can be reached via phone at the following s: (VOICE) , (Statewide Telecommunication Device for the Deaf) , (Juneau TDD) , or (FAX) For information on alternative formats and questions on this publication, please contact: ADF&G, Division of Subsistence, Website:
5 TABLE OF CONTENTS Page LIST OF TABLES... ii LIST OF FIGURES... iii LIST OF APPENDICES... iv ACKNOWLEDGEMENTS... v ABSTRACT... vi EXECUTIVE SUMMARY... vii CHAPTER 1: BACKGROUND AND METHODS... 1 Background... 1 Project Objectives... 2 Data Collection Methods... 2 Public Outreach... 2 Postal Household Survey... 2 Community Visits and In-Person... 4 Sample Achievement... 4 Data Analysis... 5 Data Entry... 5 Analysis: Development of Harvest Estimates... 5 Products... 8 CHAPTER 2: FINDINGS... 9 Subsistence Halibut Harvests In Number of Subsistence Halibut Fishers... 9 Alaska Subsistence Halibut Harvests in 2010 by SHARC Type and IPHC Regulatory Area Alaska Subsistence Halibut Harvests in 2010 by Harvest Location Subsistence Halibut Harvests by Place of Residence Subsistence Harvests by Gear Type Number of Hooks Fished with Setline Gear Number of Subsistence Halibut Fishing Trips Sport Harvests of Halibut by SHARC Holders Average Net Weights of Subsistence- and Sport-Caught Halibut Rockfish Harvests Lingcod Harvests CHAPTER 3: DISCUSSION Comparisons With Other Harvest Estimates Community Case Studies i
6 Sitka (Regulatory Area 2C) Petersburg (Regulatory Area 2C) Cordova (Regulatory Area 3A) Port Graham (Regulatory Area 3A) Kodiak City and Road System (Regulatory Area 3A) Sand Point (Regulatory Area 3B) Unalaska Dutch Harbor (Regulatory Area 4A) Toksook Bay (Regulatory Area 4E) Tununak (Regulatory Area 4E) Comparisons With Nonsubsistence Harvests In CHAPTER 4: CONCLUSIONS AND RECOMMENDATIONS Summary And Conclusions SHARC Expiration and Renewal Patterns, Recommendations REFERENCES CITED TABLES AND FIGURES APPENDICES Table LIST OF TABLES Page 1. Population of rural communities eligible to participate in the Alaska subsistence halibut fishery, 2000 and Project chronology, 2010 study year Sample achievement subsistence harvests of halibut, 2010, by SHARC type and regulatory area Age of Subsistence Halibut Registration Certificate holders by SHARC type, harvests of halibut in s of fish and pounds net (dressed, head-off) weight by regulatory area and subarea, Alaska subsistence halibut harvests from by geographic area fished Number of hooks usually fished, setline (stationary) gear, Alaska halibut subsistence fishery, Average net weight of subsistence and sport harvested halibut, 2010, by regulatory area fished harvests of lingcod and rockfish by regulatory area and subarea harvests of halibut by gear type and participation subsistence and sport fisheries, selected Alaska communities, 2003 through harvests of halibut for home use, Sitka Number of SHARCs issued, estimated of subsistence halibut fishers, and estimated harvests by SHARC category, Sitka, harvests of halibut for home use, Petersburg harvests of halibut for home use, Cordova harvests of halibut for home use, Port Graham harvests of halibut for home use, Kodiak road system. a Halibut removals in Alaska by regulatory area, Comparison of selected SHARC survey results, Percentage of SHARCs that expired, by SHARC type ii
7 Figure LIST OF FIGURES Page 1. Regulatory areas for the Pacific halibut fishery Number of surveys and return rates for subsistence halibut surveys, by SHARC type, SHARC survey return rates, communities with more than 100 SHARCs issued and tribes with more than 70 SHARCs issued, Return rate by place of residence, Number of survey responses by response category, Number of SHARCs issued and estimated of subsistence halibut fishers by SHARC type, Age of subsistence halibut registration certificate holders by SHARC type, of Alaska subsistence halibut fishers, by regulatory area of tribe or rural community of subsistence halibut fishers by place of residence, , communities with 50 or more fishers in subsistence halibut harvests, pounds net weight, by regulatory area of tribe and rural community, Alaska subsistence halibut harvests in pounds net weight by SHARC type, Percentage of tribal subsistence halibut harvest by tribe, Percentage of rural community subsistence halibut harvest by community, Percentage of subsistence halibut harvest by regulatory area fished, Alaska subsistence halibut harvests by geographic area, Percentage of Alaska subsistence halibut harvest by geographic area, subsistence halibut harvests, pounds net weight, by regulatory area fished, Change in Alaska subsistence halibut harvests from 2009 through 2010 by regulatory area fished Change in Alaska subsistence halibut harvests in 2010 compared to recent 7-year average ( ) by regulatory area fished Average subsistence harvest of halibut per fisher in Alaska, 2010, by regulatory area, in pounds net weight Average subsistence harvest of halibut per fisher in Alaska, 2010, by regulatory area, in of fish Alaska subsistence halibut harvests by place of residence, Percentage of subsistence halibut harvest by gear type by regulatory area, Number of hooks usually fished, percentage of fishers using setline (stationary) gear, Alaska subsistence halibut fishery, Average of subsistence fishing trips for halibut by regulatory area and SHARC type, Number of subsistence fishing trips for halibut, Average of halibut harvested per subsistence fishing trip by regulatory area and SHARC type, incidental harvests of rockfish in the Alaska subsistence halibut fishery, of fish, by regulatory area fished, Percentage of incidental harvest of rockfish by regulatory area fished, incidental harvests of lingcod in the Alaska subsistence halibut fishery, of fish, by regulatory area fished, Percentage of incidental harvest of lingcod by regulatory area fished, harvests of halibut for home use, Port Graham Halibut removals, Alaska, Halibut removals in Alaska by regulatory area and removal category, Percentage of SHARC holders, and SHARC holders who fished for halibut, who did not renew their SHARC, by SHARC type, through Percentage of SHARCs that were not renewed by survey response type and SHARC type, through iii
8 Appendix LIST OF APPENDICES Page A. List of eligible tribes and rural communities, 2003 (from Federal Register) B. Letter sent to tribes about the project C. Survey instrument D. Set of frequently asked questions and responses E. Results from surveys F. Project findings summary iv
9 ACKNOWLEDGEMENTS First and foremost, we thank the thousands of individuals who took the time to voluntarily respond to the mailed survey form or to be interviewed. This report would not be possible without their cooperation. Sally Bibb of the National Marine Fisheries Service (NMFS facilitated the grant that funded this project and also provided other project support). We also thank the staffs of the NMFS Restricted Access Management (RAM) program and the Information Services Division, who initially implemented and currently administer the Subsistence Halibut Registration Certificate (SHARC) program and helped provide information to the public about the research. We gratefully acknowledge the input and support of the Alaska Native Subsistence Halibut Working Group. We also thank the many tribal governments that granted approvals for the survey projects, and the local research assistants who helped with these projects. We especially thank the Sitka Tribe of Alaska (Dan Williams, Heather Woody, and Jeff Feldpausch) and the Hydaburg Cooperative Association (Anthony Christianson, Christine Tolson, Joey Adams, Raven Mooney, Tessa Mooney, Mona Peratrovich, Selina Tolson, and Ben Young) for assisting with survey administration in their communities. Matt Kookesh (Admiralty Island Adventures) organized the survey administration in Angoon and Ketchikan; Christel Silva in Angoon and Rose Johnson in Ketchikan helped complete the surveys. In addition to the coauthor of this report, other Alaska Department of Fish and Game (ADF&G) Division of Subsistence staff who assisted with research, data management, and report preparation included Malla Kukkonen, Margaret Cunningham, Maegan Smith, Hollie Wynne, Rebecca Fink, Davin Holen, Lauren Sill, Lisa Olson, Garrett Zimpelman, and Lisa Ka aihue, as well as Lesley Cook with the Division of Wildlife Conservation. Ana Lewis, Michaela Silva, and Jennifer Bond provided project administrative support. Heather Gilroy and Gregg Williams (staff to the International Pacific Halibut Commission) provided background information for this report. Several of the above mentioned ADF&G staff also offered comments and suggestions on the preliminary draft. v
10 ABSTRACT This report describes the results of the eighth annual project to estimate the subsistence harvest of Pacific halibut Hippoglossus stenolepis in Alaska since the National Marine Fisheries Service adopted rules governing subsistence halibut fishing in Data were collected through a voluntary survey mailed to all holders of Subsistence Halibut Registration Certificates (SHARCs). The survey response rate was 61% (6,670 surveyed of 10,953 SHARC holders). An estimated 4,991 individuals participated in the subsistence fishery for halibut in 2010, compared to 5,296 in 2009; 5,303 in 2008; 5,933 in 2007; 5,909 in 2006; 5,621 in 2005; 5,984 in 2004; and 4,942 in The estimated harvest in 2010 was 43,332 halibut, comprising 797,560 lb (net weight; ±3.4%), the lowest totals for the 8 years of the project. This compares to a high of 55,875 fish (1,178,222 lb, ± 3.0%) in 2005 and a previous low of 43,926 fish (1,041,330 lb, ±3.9%) in Of the total subsistence halibut harvested in 2010, 77% were harvested with setline gear and 23% with hand-operated gear. As in , the largest portion of the Alaska subsistence halibut harvest in 2010 occurred in Regulatory Area 2C (Southeast Alaska), 53%, followed by Area 3A (Southcentral Alaska), 39%. Subsistence harvests represented about 1.3% of the total halibut removals in Alaska in The harvest estimates based on the surveys for serve as a basis for understanding the overall harvest, annual variability in catch, and whether any increase in harvest may be associated with implementation of the 2003 regulations. The report recommends that monitoring of the subsistence harvest of halibut in Alaska be continued. Key words: Pacific halibut, Hippoglossus stenolepis, subsistence harvests, Alaska, rockfish, Sebastes, lingcod, Ophiodon elongatus. vi
11 EXECUTIVE SUMMARY This report presents findings of a project designed to estimate the subsistence harvest of Pacific halibut Hippoglossus stenolepis in Alaska in The Alaska Department of Fish and Game (ADF&G) Division of Subsistence conducted the project under National Oceanic and Atmospheric Administration (NOAA) award NA07NMF from the U.S. Department of Commerce, NOAA National Marine Fisheries Service (NMFS). In May 2003, NMFS published federal regulations implementing a subsistence halibut fishery in Alaska for qualified individuals who are residents of 118 rural communities or members of 123 Alaska Native tribes with traditional uses of halibut. The year 2010 was the eighth in which subsistence halibut fishing took place under these regulations. Subsistence fishers are required to obtain a Subsistence Halibut Registration Certificate (SHARC) from NMFS before fishing. During 2010, 10,953 individuals held SHARCs, compared to a high of 15,047 at the end of 2007 and a previous low of 11,565 at the end of 2008 (Table 19). The of valid SHARCs in 2010 was 17% below the previous 7-year average. Harvest information was collected by means of a postal (mailed) survey. The one-page survey form was mailed to all SHARC holders in early 2011, with one follow-up mailing. Household visits supplemented the mailings in 4 communities in Southeast Alaska. In total, 6,670 surveys were, a response rate of 61%. Participation in the survey was voluntary. According to the project findings, an estimated 4,991 individuals participated in the subsistence halibut fishery in 2010, compared to an estimated high of 5,984 in 2004 and a low of 4,942 in 2003 (Table 19). The estimated harvest in 2010 was 43,332 halibut (±7.8%) comprising 797,560 lb (net weight; ±3.4%), the lowest totals for the 8 years of the project. ( Net weight is 75% of round or live weight; the estimated harvest was 1,139,371 lb round weight.) This compares to an estimated high of 55,875 fish (±3.0%) comprising 1,178,222 lb (±3.0%) in 2005 and a previous low of 43,926 halibut comprising 1,041,330 lb (±3.9%) in 2003 (Table 19). As measured in pounds, the 2010 harvest was about 7% lower than the estimated harvest in 2009, and 24% lower than the previous 7-year average from Of the total subsistence halibut harvest in 2010, 610,992 lb (77%) were harvested with setline (stationary) gear (i.e., longlines, or skates ) and 186,567 lb (23%) were harvested with hand-operated gear (i.e., rod and reel or handline). This was similar to the harvest by gear type in Of those subsistence fishers using setline gear in 2010, the most (40%) usually fished with 30 hooks, the maximum allowed by regulation in all areas except areas 4C, 4D, and 4E, where regulations establish no hook limit. Subsistence fishers also harvested an estimated 12,851 rockfish Sebastes spp. and 2,864 lingcod Ophiodon elongatus in 2010 while fishing for halibut. This compares to estimated high harvests of 19,001 rockfish and 4,407 lingcod in 2004 and low harvests of 12,395 rockfish and 2,355 lingcod in 2005 (Table 19). Based upon fishing locations, the largest portion of the Alaska subsistence halibut harvest in 2010 occurred in Regulatory Area 2C (Southeast Alaska), 53% (424,818 lb); followed by: Area 3A (Southcentral Alaska), 39% (312,650 lb); Area 3B (Alaska Peninsula), 3% (23,009 lb); Area 4A (Eastern Aleutian Islands), 2% (14,548 lb); Area 4C (Pribilof Islands), 1% (10,859 lb); Area 4E (East Bering Sea Coast), 1% (10,055 lb); Area 4D (Central Bering Sea), less than 1% (1,171 lb); and Area 4B (Western Aleutian Islands), less than 1% (450 lb). vii
12 In as well, Area 2C and Area 3A accounted for over 85% of the subsistence halibut harvests. The proportion of the statewide subsistence halibut harvest occurring in Area 2C has ranged from an estimated high of 60% in 2003 to an estimated low of 51% in 2005 and 2007 (Table 7). Correspondingly, the portion occurring in Area 3A has ranged from an estimated high of 39% in 2010 to an estimated low of 27% in 2003 (Table 7). Preliminary data from the International Pacific Halibut Commission (IPHC) combined with the findings of this project indicate that million pounds (net weight) of halibut were removed from Alaska waters in Of this total, the subsistence harvest accounted for 1.3%. Commercial harvests took 66.8% of the halibut, followed by bycatch in other commercial fisheries (15.4%), sport harvests (12.1%), and wastage in the commercial fishery (4.5%). This report describes the results of the eighth annual project to estimate the subsistence halibut harvest in Alaska since NMFS adopted rules governing subsistence halibut fishing in May The harvest estimates based on the SHARC surveys for the fishing seasons serve as a basis for understanding the overall harvest, annual variability in catch, and whether any increase in harvest may be associated with implementation of the new regulations. Demonstrating changes in the magnitude of the Alaska subsistence halibut harvest resulting from the new regulations using the results of the SHARC surveys for is problematic, however, because of the limitations of earlier harvest estimates at the statewide level. The subsistence harvest estimates for for some of the larger communities, such as Sitka, Petersburg, and Kodiak, which account for the majority of the harvest, are within the range of harvest estimates based on household surveys prior to the new regulations. The higher overall harvest estimates for compared to 2003 may be due to more thorough registration of subsistence fishers, hence better harvest documentation. The lower total harvest in net pounds in 2008, 2009, and 2010 compared to the previous 5 years appears to be the result of fewer registered SHARC holders, fewer estimated participants in the fishery, lower average harvests per fisher, and a decline in the average size of the harvested halibut over the 8 years of the study, from 23.7 pounds per fish in 2003 to 18.2 lb per fish in 2008, 19.0 lb per fish in 2009, and 18.4 lb per fish in Additional years of harvest data will be necessary to shed light on these and other factors that may shape the subsistence halibut harvest in Alaska. The report concludes that 797,560 net pounds is a sound estimate of the Alaska subsistence halibut harvest in The estimate is based upon a scientific sampling of SHARC holders and a relatively high response rate. The total estimated harvest falls below the 1.5 million net pounds estimated for the subsistence harvest when the current regulations were developed by the North Pacific Fishery Management Council (see page 16748). Although the 2010 harvest estimate was 24% below the average for the previous 7 project years, there are no certain trends in the harvest. The report recommends that monitoring of the subsistence halibut harvest in Alaska continue so that trends in the fishery in terms of participation, location of harvests, and harvest quantities can be better understood. viii
13 BACKGROUND CHAPTER 1: BACKGROUND AND METHODS The primary goal of this project was to estimate the subsistence harvests of Pacific halibut Hippoglossus stenolepis in Alaska in 2010 through a survey mailed to registered subsistence halibut fishers; the survey was supplemented by interviews in selected communities. This was the eighth year for which this research was conducted. (See Fall et al for the results for 2003, Fall et al for the results for 2004, Fall et al for the results for 2005, Fall et al for the results for 2006, Fall and Koster 2008 for the results for 2007, Fall and Koster 2010for the results for 2008, and Fall and Koster 2011 for the results for 2009.) The Division of Subsistence administered the project through a grant from NMFS (award NA07NMF ). In Alaska s coastal areas, subsistence halibut fisheries are local, noncommercial, customary and traditional food fisheries, as noted by Wolfe (2002) and described in Environmental Assessment/Regulatory Impact Review/Initial Regulatory Flexibility Analysis for a Regulatory Amendment for Defining a Halibut Subsistence Fishery Category (an EA/RIR/IRFA ) by the North Pacific Fishery Management Council (NPFMC), ADF&G, IPHC, and NMFS, August 11, 2000 (NMFS 2000; see also NPFMC 2003). The EA/RIR/IRFA summarizes information about the subsistence halibut fishery in Alaska. This background information is not repeated here but provided the basis for the NPFMC s recommendation for subsistence halibut fishing regulations in Alaska. Figure 1 illustrates International Pacific Halibut Commission (IPHC) halibut regulatory areas in Alaska. In April 2003, the National Marine Fisheries Service, Alaska Region, published federal regulations implementing a subsistence halibut fishery for qualified individuals in the waters in and off Alaska (68 FR 18145, April 15, 2003; see Current regulations state that persons eligible to subsistence halibut fish include 1) residents of rural communities with customary and traditional uses of halibut (rural); and 2) members of federally recognized Alaska Native tribes with customary and traditional uses of halibut (tribal). In total, residents of 118 rural communities and members of 123 Alaska Native tribes are eligible to participate in the fishery. 1 (See Appendix A for a list of eligible tribes and communities as they appeared in the Federal Register in 2003.) On November 4, 2009, the U.S. Department of Commerce published a final rule (74 FR 57105, November 4, 2009), effective December 4, 2009, modifying eligibility requirements for participation in the Alaska subsistence halibut fishery. The action allowed rural residents who live outside the boundaries of the specified 118 communities to participate if they live within the boundaries of rural areas defined in (g)(3). Subsistence halibut fishers are required to obtain a Subsistence Halibut Registration Certificate (SHARC) from the Restricted Access Management Program (RAM) office of NMFS prior to fishing. 2 Federal regulations (50 CFR Part (h)(4)) also authorize periodic surveys of SHARC holders in order to estimate annual subsistence harvests and related catch and effort information. The regulation states that, Responding to a subsistence halibut harvest survey will be voluntary. Table 1 provides population estimates for the eligible rural communities for 2000 based on the federal decennial census. The total population of these communities in 2000 was 82,707, of which 38,990 were 1 In December, 2004, the NPFMC adopted a recommendation to the Secretary of Commerce to add Naukati Bay to the original list of 117 eligible rural communities. Regulations implementing this change went into effect in 2008, resulting in 118 rural communities eligible for a portion of 2008 and all of Also, note that the Northern Pacific Halibut Act of 1982, under which the Alaska subsistence halibut fishery regulations are authorized, provides for fair and equitable allocations of halibut among U.S. fishers, but does not establish priorities for those allocations (see page 16747). 2 The subsistence rules were amended in 2005 by regulations published in the Federal Register at 70 FR 16742, April 1, Among other things, this amendment provides for obtaining Community Harvest Permits, Ceremonial Permits, and Educational Permits. 1
14 Alaska Natives (47%). As also shown in Table 1, estimates published by the U.S. Bureau of the Census for 2010 report a total population of 84,353 for eligible rural communities and areas, including 39,164 Alaska Natives (46%; U. S. Census Bureau 2011). In addition, the nonrural communities of Juneau and Ketchikan (excluding Saxman, whose residents are eligible) in 2010 had Alaska Native populations of 6,005 and 2,625, respectively (ADLWD 2011), most of whom were eligible to participate in the federal subsistence halibut fishery through their tribal membership. Also, an unknown of eligible tribal members lived in other nonrural communities, such as Anchorage and the Kenai Peninsula Borough. PROJECT OBJECTIVES The primary goal of the project was to estimate the subsistence harvest of halibut in Alaska in the calendar year Funding for 2010 ($103,000), as for 2009 and 2008, was reduced by about one-half compared to the first 5 years of the project. Consequently, the project plan for 2008 initially focused on estimating harvests only in regulatory areas 2C and 3A, where most of the harvests occur. However, because of lower costs of analysis and report preparation, due to the experience of conducting the survey for 5 years, and after evaluating available funds, it was decided to again produce a statewide estimate using a mailed survey to all SHARC holders. This goal was retained for 2009 and However, as in 2008 and 2009, outreach and supplemental interviewing in 2010 could occur only in a few communities in Area 2C. Therefore, the project objectives for 2010, listed below, were identical to the first 7 years of the project: 1. Produce an estimate of the subsistence harvest of halibut in Alaska in 2010 by community, tribe, gear type, and IPHC regulatory area, along with an estimate of the of individuals who subsistence fished for halibut in Produce an estimate of the harvest of halibut by SHARC holders while sport fishing in Produce an estimate of the of lingcod and rockfish taken by subsistence fishers while subsistence fishing for halibut in DATA COLLECTION METHODS Public Outreach In February 2011, the Division of Subsistence sent the report for project year 2009 (Fall and Koster 2011) to all eligible tribes, along with a short summary of the findings for 2009 and a letter informing them that the research would continue for the 2010 harvest year (Appendix B). Before 2009, the division published announcements in local newspapers about the upcoming mailing of halibut survey forms to SHARC holders. Due to rising costs and the reduced budget, these announcements were not published for the 2009 and 2010 study years. Information about the project was available on the NMFS web site for subsistence halibut fishing in Alaska ( Postal Household Survey As noted, this was the eighth year of a harvest assessment program for the subsistence halibut fishery in Alaska. Because the subsistence halibut regulations came into effect in 2003, the first years of collecting harvest data were exploratory. Subsequent project years have built upon the lessons learned in the first years of the project and have benefited from outreach efforts to improve response rates. (See recommendations in Chapter 4.) As recommended by Wolfe (2002), survey methodology was based upon a registration system for subsistence halibut fishers, which requires fishers to obtain a SHARC before fishing under federal subsistence halibut regulations. All 10,953 individuals who held a SHARC for any portion of 2010, as of December 31, 2010, were mailed a retrospective recall survey covering a 12-month harvest period: calendar year SHARCs issued to nontribal residents of eligible rural communities are valid for 2 years and tribal SHARCs are valid for 4 years, after which they must be renewed. Because of 2
15 nonrenewals, the of valid SHARCs for 2010 was down 7% from the 11,733 that were valid for With one exception, the 2010 survey instrument was virtually identical to the form used for the project years. It is based on recommendations by Wolfe (2002:Appendix A), with slight modifications, such as project year and return address. (See Appendix C in this report for a copy of the 2010 survey instrument.) Wolfe (2002:15 18) provided justification for the kinds of data to be collected, which include name and address of the fisher; halibut harvests in s and pounds round (whole) weight by gear type in 2010; of hooks usually set; and harvests of lingcod and rockfish taken while subsistence fishing for halibut. In 2003, a question addressing the water body fished (primary location) while subsistence fishing was added at the recommendation of NMFS staff. This question was retained for Another was added in 2004 to record the location of sport halibut fishing by SHARC holders. The survey was designed to reduce the potential double counting of halibut taken with rod and reel gear, which could be reported in both the subsistence survey and in the ADF&G Division of Sport Fish Statewide Harvest Survey (Wolfe 2002:19). For 2009, a new question was added about the of trips taken for subsistence halibut fishing in the study year. This question was retained for A short explanatory letter with instructions on the back for completing the survey was included in the mailings (Appendix C). The survey was designed so that it could be directly to the Division of Subsistence, postage paid. Presently under IPHC regulations, Community Development Quota (CDQ) fishers may retain halibut under 32 inches (U32; formerly called sublegal or shorts ) while commercial CDQ fishing in areas 4D and 4E only. These regulations require the CDQ organization to report this harvest to the IPHC. To avoid double counting, subsistence fishers were instructed not to include these fish on their subsistence halibut survey. During an October 2003 meeting of the Alaska Native Subsistence Halibut Working Group (ANSHWG), held before the mailed survey for the first project year, community representatives expressed concern that not all fishers would know which fish were to be included under the category rockfish for the incidental harvest question on the survey. This would have led to an overestimation of this harvest if fishers reported fish such as Pacific cod Gadus macrocephalus or various species of sculpins in response to this question. The instructions mailed with the survey provided guidance on this question. 3 Table 2 provides a chronology of key activities during the project. Table 3 provides a summary of response rates by mailing, SHARC type (rural or tribal), and place of residence. The first mailing to 10,953 SHARC holders occurred on March 16, The second mailing to 5,702 SHARC holders occurred on May 16, For the study years, a third mailing took place, usually in April or May. Due to increasing printing and mailing costs, and the previous relatively low responses to this mailing, the third mailing did not occur in 2010 or The Division of Subsistence created a dedicated address that recipients of the postal survey could use if they had questions about how to respond. Also, the RAM Program set up a toll-free telephone ( ) to provide information about the subsistence halibut program, including the harvest assessment program. Both the address and toll-free telephone appeared on the survey. A set of frequently asked questions and responses was developed by ADF&G and NMFS staff 3 The principal investigators for this project are aware that more than 30 species of rockfish inhabit Alaska waters. (See Alaska Administrative Code 5 AAC for definitions of management assemblages of rockfishes.) The goal of this project was to keep the questions about incidental harvests simple. As discussed in the recommendations section (see Chapter 4), if more precise harvest data for various rockfish are needed for particular areas, future research should be designed and funded to address these data needs. 3
16 members to guide staff responses to telephone calls and inquiries about how to fill out the survey form [Appendix D (FAQ), Appendix C (survey)]. Community Visits and In-Person Because the response rates to the postal survey vary by community and tribe, the mailings were again supplemented in selected communities with household surveys conducted by local research assistants hired through subcontracts with Alaska Native tribes. Because of the large of eligible communities and tribes, it was not possible to conduct surveys in most communities. Additionally, because of reductions in the budget, surveys for 2010 harvests, as for 2009 harvests, were limited to selected communities in Area 2C. In the 2010 project year, the interviews were administered in Sitka, Hydaburg, Angoon, and Ketchikan. Cooperative agreements with Sitka Tribe of Alaska and Hydaburg Cooperative Association supported interviewing in those communities. A contract with the firm Admiralty Island Adventures supported interviewing in Angoon and Ketchikan. In each community, the surveys were administered face-to-face or by telephone. SAMPLE ACHIEVEMENT Table 3 reports sample achievement by tribe, rural community, and community of residence. Overall, 6,670 surveys were by 10,953 SHARC holders, a response rate of 61% (Figure 2). For residents of the 118 eligible rural communities and eligible rural areas who did not register as tribal members, 4,645 of 7,047 surveys were (66%). As shown in Figure 3, in 2010 there were 11 communities with more than 100 nontribal SHARC holders, accounting in total for 85% of all nontribal SHARCs issued in rural communities. Return rates were 60% or more in 10 of these communities; the return rate for Kodiak, the rural community with the most SHARC holders, was 55%. Of the 3,906 individual tribal members who held SHARCs in 2010, 2,025 (52%) surveys. As shown in Figure 3, there were 18 tribes with more than 70 members who obtained SHARCs. Return rates for these 18 tribes varied widely, from 87% in Hydaburg (where the Hydaburg Cooperative Association conducted surveys to supplement the return of surveys by mail) to 38% for the Sun aq Tribe of Kodiak (where no directed outreach occurred). In total, these 18 tribes accounted for 71% of all tribal SHARCs. Figure 4 illustrates survey response rates by place of residence of SHARC holders for the 22 communities with 100 or more SHARC holders in These communities accounted for 84% of all SHARCs and 86% of all surveys. Response rates were 50% or higher in all but 4 of these communities. Figure 5 shows the survey return rate by response category (see also Table 3). After the first mailing, 5,188 surveys were, for a response rate of 47%. Responses to the second (final) mailing added 1,046 surveys, for a total response to the postal survey of 6,234 surveys, 57% of the 10,953 SHARC holders. In addition, surveys administered by representatives of tribal and other organizations working with ADF&G, added 436 surveys. Most of these were in Hydaburg, Sitka, Angoon, and Ketchikan. This brought the total response to 6,670 surveys, 61% of all individuals who held SHARCs in The overall response rate for the survey for 2010 increased compared to 2009, from 59% to 61%. The return rate was the highest in 2003 at 65% and the lowest in 2007 at 58% 4. The of surveys increased over the first 3 years of the project, from 7,593 in 2003, to 8,524 in 2004, and 8,565 in 2005, reflecting the larger of SHARC holders in 2004 and 2005 and the larger of staffadministered surveys in The total of surveys dropped slightly in 2006, to 8,426, but increased again to 8,682 surveys in 2007, the largest annual total for the 8 years of the project. The of surveys for 2008 dropped to 7,316, reflecting the sharp drop in the of SHARC holders in For 2009, 6,944 surveys were received, and for 2010, there were 6,670 surveys, 4 See Table 19 for sample sizes and fractions and selected project findings for the 8 project years. 4
17 the lowest total of the 8 years of the project; 2010 was also the year with the lowest of eligible SHARCs (10,953). The response rate by mail declined during the first 5 years of the project, from 62% in 2003 to 59% in 2004, 55% in 2005, 52% in 2006, and 50% in In 2008, the response rate by mail increased to 60%, the highest since the first project year, but declined to 56% for 2009 and 57% in As noted above, due to increasing costs and a decreased budget, only 2 mailings of surveys occurred for the 2009 and 2010 study years; 3 mailings had occurred in the previous 6 study years. Responses to the third mailing had dropped since the first years of the project, accounting for 10% of total returns in 2003 (1,211 surveys) and 14% in 2004 (1,970 surveys), compared to 4% in 2007 (599 surveys) and 4% in 2008 (473 surveys). Thus it is unlikely that eliminating the third mailing for 2009 and 2010 had a significant effect on return rates or harvest estimates. The of surveys as undeliverable increased from 208 in 2003 (Fall et al. 2004:45), to 617 in 2004 (Fall et al. 2005:48), 613 in 2005 (Fall et al. 2006:7), 1,194 in 2006 (Fall et al. 2007:7), and 1,700 in 2007 (Fall and Koster 2008:54); there were 817 undeliverable surveys in 2008 (Fall and Koster 2010:58), 653 in 2009 (Fall and Koster 2011:6), and 713 in 2010 (Table 3). Subtracting undeliverables from the postal survey target gives a response rate by mail of 61% in 2010, compared to 63% in 2003, 62% in 2004, 57% in 2005, 57% in 2006, 54% in 2007, 64% in 2008, and 60% in More surveys were administered in person or via telephone in 2010 (436) than in 2009 (318). Before 2009, the of staff-administered surveys had ranged from 355 surveys in 2004 to 392 in 2003, 408 in 2008, 733 in 2005, 1,089 in 2007, and 1,522 in The lack of outreach and household surveys in Area 3A, Area 3B, and Area 4 communities in 2008, 2009, and 2010 due to budget reductions accounts for the reduced of staff-administered surveys compared to DATA ANALYSIS Data Entry All surveys were reviewed for completeness prior to data entry. Responses were coded following standardized conventions used by the Division of Subsistence. Staff within the Information Management Section of the division set up database structures within Microsoft SQL Server 5 at ADF&G in Anchorage to hold the survey data. The database structures included rules, constraints, and referential integrity to insure that data were entered completely and accurately. Data entry screens were available on a secure Internet site. Daily incremental backups of the database occurred, and transaction logs were backed up hourly. Full backups of the database occurred twice weekly. This ensured that no more than one hour of data entry would be lost in the unlikely event of a catastrophic failure. Survey responses were manually entered twice, and survey forms were electronically scanned. All data were compared programmatically for inconsistent data entry. Double data entry ensured a more accurate transfer of information from the coded survey forms into the database, and is a standard Division of Subsistence practice. Data did not pass to the processing phase until inconsistencies within the twiceentered data set were eliminated. The scanned survey forms also facilitated efficient data correction and editing. Information was processed and analyzed using MS SQL programming. Initial processing included the performance of standardized logic checks of the data. Logic checks are often needed in complex data sets where rules, constraints, and referential integrity do not capture all of the possible inconsistencies that may appear. Analysis: Development of Harvest Estimates Analysis included review of raw data frequencies, cross tabulations, table generation, and estimates of population parameters. Missing information was dealt with on a case-by-case basis. The Division of 5 Product names are included for scientific completeness and do not constitute an endorsement. 5
18 Subsistence has standard practices for dealing with missing information, such as minimal value substitution or use of an average response for similarly characterized households or communities. Typically, missing data are an uncommon, randomly occurring phenomenon in household surveys conducted by the division, as was the case in this project. In general, estimates of harvests, levels of participation, and other findings were calculated based upon the application of weighted means (Cochran 1977). These calculations are standard methods for extrapolating sampled data. In this project, each tribe and rural community was a separate stratum for purposes of estimating total harvests. In most cases, the mean for SHARC surveys was applied to the total of SHARCs issued for the tribe or community to calculate the estimated harvest. (See Appendix Table E-1 for the reported harvests for each tribe and community.) The formula for standard expansion of community harvests is H H (1) t i where H hw (2) N i and Wi (Harvest weight factor per strata i) n i i i i H t = the total harvest (s of fish or pounds), H i = the total harvest, s or pounds, for tribe or community i W i = the weight factor for tribe or community i, h i = the total harvest, s or pounds, reported in surveys for tribe or community, n i = the of surveys in each tribe or community, and N i = the of SHARCs issued for tribe or community. The following instances are exceptions. First, 149 SHARCs were held by eligible tribal members living outside of Alaska. Of these, 75 postal surveys were from this group, and very few of these surveys indicated any subsistence fishing activity. Rather than assign the mean value for their tribe (which would likely result in an overestimate of the harvest), all non surveys for SHARC holders with out-of-state addresses were coded as did not fish. Second, all SHARC holders were divided into 2 categories based upon the expiration date of their SHARC. SHARCs having an expiration date falling within the project period and that were not renewed were treated as separate strata from other SHARCs for the purpose of generating harvest estimates. This was done to account for potential bias and resulting overestimation of harvests for SHARCs that were fished for only part of the year. During 2010, 1,012 rural and 159 tribal SHARCs expired and were not renewed; of those, 402 (40%) rural SHARCs and 54 (34%) tribal SHARCs participated in the survey. Third, as in 2009, for tribal and rural SHARC holders from Nanwalek, comparisons of reported harvests with estimates from previous years, plus relatively low response rates, suggested that survey responses included all harvesters. Therefore, reported harvests were used as total harvest estimates for both the Nanwalek tribe and for Nanwalek rural SHARC holders. Finally, again as in 2009, for Port Graham, one respondent reported harvests far above the mean for other respondents. This SHARC holder was treated as a separate strata so as not to overestimate harvests for the tribe. The RAM Program did not issue any community, educational, or ceremonial permits for If harvests under any of these permits had occurred, the totals would have been added to the estimates for the tribe of the permit holder because they are not reported by individuals in their response to the SHARC postal survey. (3) 6
19 It should also be noted that not every individual who obtained a SHARC as a tribal member resided in the community where his or her tribe s headquarters is located. Therefore, the sum of harvest estimates for tribal SHARC holders and rural resident SHARC holders does not necessarily equal the halibut harvest for particular communities of residence. Rather, an additional analysis was necessary to estimate harvests by community of residence that assigned tribal SHARC holders to a community based on their mailing addresses. Appendix tables E-4, E-5, and E-6 report project results by place of residence of the SHARC holders. The standard deviation (SD; or Variance [V], which is the SD squared) of the harvest was calculated with the raw, unexpanded data. The standard error (SE), or SD of the mean, was also calculated for each community or tribe. This was used to calculate the relative precision of the mean, or the likelihood an unknown value falls within a certain distance from the mean. In this project, the relative precision of the mean is shown in the tables as a confidence interval (CI), expressed as a percentage. Once the standard error was calculated, the CI was determined by multiplying the SE by a constant that reflected the level of significance desired, based on a normal distribution. The constant for 95% confidence intervals is Though there are numerous ways to express the formula below, it contains the components of a SD, V, and SE. Relative precision of the mean (CI%): % 1 1 (4) (5) Where s sample standard deviation x = reported amount harvested by individual SHARC holders x = mean harvest n total sample size N total population size tribal or community sample size ni N i t 2 tribal or community population size Student s t-statistic for alpha level (α=0.95) with n 1 degrees of freedom. Project staff explored the possibility of nonresponse bias for mail-out surveys and its effect on harvest estimates. However, it was determined that responses to the survey, including harvest levels and involvement in the fishery, were not notably different between any of the response categories (responses to the first mailing, the second mailing, and staff administered surveys; see Appendix Table E-2). 7
20 As noted above, survey respondents provided harvest estimates in pounds round (whole) weight. For ease of comparison with estimates of halibut removals in other fisheries, we have converted these estimates to pounds net (dressed, head off) weight, where 0.75 round weight = net weight. 6 Products The public review draft of this final report was completed in November 2011 and circulated for review and comments. The draft report was also posted at the Division of Subsistence website. A presentation of the project findings and recommendations occurred at the December 2011 meeting of the NPFMC in Anchorage, Alaska. In past study years, draft results were also reviewed during a meeting of the Alaska Native Subsistence Halibut Working Group (ANSHWG), but a meeting of this advisory group did not take place in December The final report was revised in consideration of comments and suggestions received from reviewers of the public review draft. In addition to the final report, a short findings summary was prepared (Appendix F). The summary was sent to tribal government representatives and other interested individuals and groups. This report was posted on the Division of Subsistence web site and the RAM website in PDF format for downloading and printing by the public. Printed copies of this report were sent to the Alaska Resources Library and Information Services as well as the Alaska State Library. 6 The factor of 0.75 for converting halibut round weight to net weight is the standard used by the International Pacific Halibut Commission and the ADF&G Division of Sport Fish. Division of Subsistence studies, as reported in the Technical Paper series and in the Community Subsistence Information System ( hereinafter referred to as CSIS, and formerly the Community Profile Database [Scott, C.L., B. Brown, G.B. Jennings, and C. Utermohle. Unpublished. Community Profile Database, 2001, for Microsoft Access Version Alaska Department of Fish and Game Division of Subsistence, Juneau. Hereinafter referred to as CPDB.]), generally use a factor of 0.72 for converting halibut round weights to net weights, based on Crapo et al. 1993:7), who reports that on average, the weight of a dressed halibut with the head removed is 72% of the round weight, with a range of 68% to 80%. In Division of Subsistence Technical Papers, net weight (dressed, head off) is usually referred to as usable weight. 8
21 SUBSISTENCE HALIBUT HARVESTS IN 2010 CHAPTER 2: FINDINGS Number of Subsistence Halibut Fishers Of the 10,953 individuals who held valid SHARCs for any portion of 2010, an estimated 4,991 (46%) participated in the subsistence halibut fishery in 2010 (Table 4, Figure 6). Of the 3,906 individuals who held SHARCs as members of an eligible tribe, an estimated 1,502 participated in the fishery (38%). Of the 7,047 individuals who held SHARCs as residents of qualifying rural communities, an estimated 3,489 (50%) participated in the subsistence fishery for halibut in The largest of estimated subsistence halibut fishers occurred in ,984 of 13,813 SHARC holders fished in the subsistence halibut fishery (43%), including 2,157 of 6,533 tribal SHARC holders (33%) and 3,827 of 7,280 rural SHARC holders (53%). The lowest estimated of subsistence halibut fishers occurred in ,942 of 11,635 SHARC holders fished in the subsistence halibut fishery (42%), including 1,836 of 5,578 tribal SHARC holders (33%) and 3,106 of 6,057 rural SHARC holders (51%; Figure 6). In , differences in the demography of tribal SHARC holders and rural SHARC holders probably accounted for some of the differences in the rate of participation in the subsistence halibut fishery between these 2 groups. As a proportion of total SHARC holders, about twice as many tribal SHARC holders were under 20 years of age compared to rural SHARC holders. This may reflect a policy on the part of some eligible tribes in the first years after the regulations were adopted to register all or most tribal members, including younger people who were less likely to participate in the subsistence fishery than adults. Despite the substantial drop in the of tribal SHARC holders in 2008, 2009, and 2010, differences in the age structure of this group compared to rural SHARC holders remained. For example, in 2007, 13% of tribal SHARC holders were younger than 20 years of age, compared to 5% of rural SHARC holders (Fall and Koster 2008:11). In 2009, 11% of tribal SHARC holders less than 20 years of age, compared to 6% of rural SHARC holders (Fall and Koster 2011:9); and in 2010, 9% of tribal SHARC holders less than 20 years of age, compared to 5% of rural SHARC holders (Table 5, Figure 7). As illustrated in Figure 8 (see also, Table 4), the largest of Alaska subsistence halibut fishers in 2010 were from tribes and rural communities in Regulatory Area 2C (Southeast Alaska), 3,020 (61%). There were 1,574 subsistence halibut fishers (32%) from tribes and communities in Regulatory Area 3A (Southcentral Alaska); 176 (4%) from Regulatory Area 3B (Alaska Peninsula) tribes and communities; 99 (2%) from Regulatory Area 4A (Eastern Aleutians) tribes and communities; and 84 (2%) from Area 4E (East Bering Sea Coast) tribes and communities. Additionally, there were 38 (1%) halibut fishers who were members of tribes and residents of communities in the 3 other regulatory areas. As also shown in Figure 8, the distribution of subsistence fishers by regulatory area in 2010 was similar to that of , except, continuing the pattern established in 2008, there was a sharp decrease in the of halibut fishers in Area 4E, from 376 in 2007 to 143 in 2008, 137 in 2009, and 84 in Compared to 2009, the estimated of halibut fishers from tribes and rural communities also dropped in 2010 in 5 other regulatory areas, most notably in Area 3A (from 1,669 fishers to 1,574, a drop of 6%). The estimated of subsistence halibut fishers in Area 2C dropped by 5% (from 3,187 in 2009 to 3,020 in 2010). In contrast, the estimated of subsistence halibut fishers rose in Area 4A, from 79 in 2009 to 99 in 2010 (a 25% increase). Alaska Native tribes with the most subsistence halibut fishers in 2010 included the Central Council of Tlingit and Haida Indians (184 subsistence halibut fishers), the Ketchikan Indian Corporation (136), the Sitka Tribe of Alaska (131), the Sun aq Tribe of Kodiak (68), the Hydaburg Cooperative Association (63), the Metlakatla Indian Community (52), the Hoonah Indian Association (51), the Wrangell Cooperative Association (42), the Angoon Community Association (42), the Agdaagux Tribe of King Cove (41), the Qagan Toyagungin Tribe of Sand Point (32), and the Eyak (30). Of the SHARC holders who registered as residents of eligible rural communities, the most subsistence fishers 9
22 lived in Kodiak (827), followed by Sitka (632), Petersburg (384), Haines (252), Cordova (211), Wrangell (197), and Craig (172). Appendix Table E-3 provides details for each tribe and community regarding participation in the subsistence fishery and subsistence halibut harvests in As noted above, not every tribal SHARC holder lives in his or her tribe s headquarters community. After assigning tribal members to a community based on their place of residence, an estimate of participation in the subsistence halibut fishery in 2010 by community can be obtained. Appendix Table E-4 provides project findings based on place of residence. Communities with 100 or more resident SHARC holders who participated in the subsistence halibut fishery in 2010 were Kodiak (900), Sitka (755), Petersburg (409), Haines (273), Wrangell (256), Craig (252), Cordova (235), and Ketchikan (198). Of the 8 Alaska communities with 100 or more subsistence halibut fishers in 2010, 5 had about the same or fewer fishers than in 2009 (±10%). The estimated of subsistence halibut fishers in Sitka, Wrangell, and Craig each decreased by about 11% (Figure 9). Hoonah had an estimated 91 subsistence halibut fishers in 2010, a drop of 17% from the estimate of 109 fishers in (See Chapter 3 for further discussion of Kodiak, Petersburg, Cordova, and Sand Point as case study communities.) Nine non-alaska-resident tribal SHARC holders subsistence fished for halibut in Alaska in 2010, compared to a high of 24 in 2005 and low of zero in 2004 and Alaska Subsistence Halibut Harvests in 2010 by SHARC Type and IPHC Regulatory Area Table 4 reports estimated Alaska subsistence halibut harvests for 2010 by SHARC type, IPHC regulatory area, and gear type. The total estimated subsistence halibut harvest in Alaska in 2010 was 43,332 fish (±8%) for 797,560 lb (net weight; ±3%). 7 As estimated in pounds net weight, 54% of the subsistence halibut harvest (430,866 lb [±5%]) was taken by fishers registered with tribes or rural communities in Regulatory Area 2C (Figure 10). (Note that because some SHARC holders may fish in a regulatory area different from the location of their tribal headquarters or rural community of registration, the area totals in Table 4 do not precisely represent harvest locations. See the section on harvests by location, below.) Fishers from Area 3A tribes and rural communities harvested 303,632 lb (±12%; 38% of the state total). Harvests totaled 23,733 lb (±1%; 3%) for communities and tribes of Regulatory Area 3B. For tribal and rural SHARC holders in Area 4A, the estimated harvest was 14,477 lb (±2%; 2% of the net harvest weight). For Regulatory Area 4E, 8 the estimated harvest for tribal and rural SHARC holders was 12,250 lb (±3%; 2% of the net harvest weight). For Regulatory Area 4C, the estimated harvest for tribal and rural SHARC holders was 10,859 lb (±10%; 1% of the net harvest weight). Tribes and communities in 4D harvested 1,270 lb (±23%; less than 1% of the net harvest weight) and those in 4B harvested 473 lb (±36%; less than 1%). The estimated subsistence harvest of 797,560 lb of halibut in 2010 represents a decrease of 7.4% compared to the estimated harvest of 861,359 lb in 2009 (Figure 11). Harvests by tribal SHARC holders decreased by 1.1% from 311,947 lb in 2009 to 308,569 lb in Tribal SHARC holders harvested 39% of the Alaska subsistence halibut harvest in 2010, compared to 36% in Subsistence halibut harvests by nontribal, rural resident SHARC holders decreased by 11.0%, from 549,412 lb in 2009 to 488,990 lb in This group accounted for 61% of the statewide subsistence halibut harvests in 2010, compared to 64% in This approximates 1,139,371 pounds round (live or whole) weight. See footnote 6 in Chapter 1 for an explanation of the factor used to convert round weight to net weight. 8 Community Development Quota (CDQ) organizations operating exclusively in areas 4D and 4E may retain U32 halibut (under 32 inches in length) from their commercial catches for home use. In 2010, a total of 9,517 lb net weight of halibut was retained by 3 organizations: Coastal Villages Regional Fund (3,924 lb), Bristol Bay Economic Development Corporation (2,155 lb), and Norton Sound Economic Development Corporation (3,438 lb; Williams 2011). The IPHC includes these fish within the personal use removal category, a category that also includes subsistence harvests (Gilroy 2005:64). See also the section in Chapter 3, Comparisons with Nonsubsistence Harvests. 10
23 Members of 64 Alaska tribes harvested subsistence halibut in In 2 others, SHARC holders fished but had no harvest. In 16 others, tribal members obtained SHARCs and surveys, but no one fished. Members of 16 other tribes held SHARCS, but no one a survey form. No one in the remaining 25 eligible tribes held a valid SHARC in All but one of these tribes was in Regulatory Area 4E (East Bering Sea Coast). As shown in Figure 12, members of the 13 tribes with harvests of 8,000 lb or more accounted for 64% of the total subsistence halibut harvest by tribal SHARC holders in These 13 tribes accounted for 58% of the tribal SHARCs (2,265 of 3,906) (Table 3). Members of the other 51 tribes with harvests accounted for about 36% of the total harvest by tribal members. Residents of 49 eligible rural communities harvested subsistence halibut in In 3 others, SHARC holders fished unsuccessfully. In 9 others, individuals obtained SHARCs but no one fished. Residents of 10 other eligible rural communities obtained SHARCs, but no one a survey form. No one in the remaining 47 eligible rural communities held a valid SHARC as a nontribal member in Most of these communities (38) were in Regulatory Area 4E (East Bering Sea Coast). 10 As shown in Figure 13, 10 rural communities with harvests of over 10,000 lb accounted for 81% of the subsistence halibut harvest by the holders of rural (nontribal) SHARCs in Residents of the other 39 communities with harvests accounted for 19% of the total harvest by rural SHARC holders. As also shown in Figure 13, rural SHARC holders from 2 communities accounted for 45% of the total harvest by this group in 2010: Kodiak (31%) and Sitka (14%). Adding Petersburg, the next highest rural community harvest at almost 9%, the top 3 rural communities accounted for 54% of the rural community (nontribal) subsistence halibut harvest in Alaska in Alaska Subsistence Halibut Harvests in 2010 by Harvest Location Survey respondents were asked to report the water body, bay, or sound [that they] usually fished for subsistence halibut in Multiple responses were permitted. In Table 6, estimated subsistence halibut harvests are reported for the 8 Alaska halibut regulatory areas and 22 subdivisions within these areas. It should be noted that regulatory area totals in Table 6 differ slightly from those reported in Table 4 because not all SHARC holders fished within the regulatory area in which their tribal headquarters or residence is located. Subsistence halibut harvests in Regulatory Area 2C (Southeast Alaska) accounted for 53% of the Alaska subsistence halibut harvest in 2010 (424,818 lb [net weight]; Figure 14, Table 6). Also, as shown in Figure 15 and Figure 16, three of the 5 geographic subareas with the largest subsistence halibut harvests in 2010 were in Area 2C: southern Southeast Alaska (254,366 lb [net weight]; 32% of the state total); the northern Southeast Alaska other than the Sitka Local Area Management Plan (LAMP) area (93,464 lb; 12%), and the Sitka LAMP area (76,988 lb; 10%). 11 Regulatory Area 3A (Southcentral Alaska) ranked second, with 39% of the state s total subsistence halibut harvest (312,650 lb [net weight]). Waters bordering the Kodiak Island road system (including Chiniak Bay) ranked second among subareas, with a subsistence halibut harvest of 103,066 lb (13% of the state total), and other Kodiak Island waters not along the road system area ( Kodiak Island Other ) ranked fourth (83,432 lb; 11%). Harvests within Cook Inlet waters of Area 3A accounted for 8% of the state total (65,809 lb; ranking sixth), those within Prince William Sound added 42,279 lb (5% of the statewide total), and the Yakutat Area added 18,064 lb 9 In this tally, Chiniak, listed separately in tables in this report, is counted as part of Kodiak, as it is for eligibility. Because some residents of eligible rural areas had mailing addresses in non-eligible communities, 3 non-eligible communities are listed as rural communities in Table 3. These were Juneau (3 SHARCs), Ketchikan (5 SHARCs), and Ward Cove (2 SHARCs). These 3 places are not included in this count of participating communities. 10 Note that residents of these communities may have obtained SHARCs as tribal members. 11 For this project, northern Southeast Alaska includes those waters of Regulatory Area 2C north of Frederick Sound, including waters surrounding Baranof Island and excluding the Sitka LAMP area. For a description of the Sitka LAMP area, see FR , April 15, 2003, (d)(1). The remaining waters of Area 2C are referred to as southern Southeast Alaska in this report. 11
24 (2%). Among regulatory areas, Area 3B (Alaska Peninsula, including the Chignik Area) ranked third with 3% of the Alaska total (23,009 lb). Area 4A (eastern Aleutian Islands) ranked fourth with 14,548 lb (2%), and Area 4C (Pribilof Islands) ranked fifth with 10,859 lb (1%). Area 4E (Bering Sea Coast) ranked sixth with 10,055 lb (1%). Most of the harvest in Area 4E came from the Yukon Kuskokwim Delta area, with a smaller amount from Norton Sound and, as in 2009, and for the second time since the harvest monitoring project began in 2003, no harvest from Bristol Bay. Area 4D (St. Lawrence Island) added 1,171 lb (<1%); and Area 4B (western Aleutian Islands) added 450 lb (<1%). Figure 17 reports estimated harvests in pounds net weight by location fished at the regulatory area level in Table 7 compares estimated subsistence halibut harvests by regulatory area and geographic area in 2010 with those estimated for and for the 7-year average from As noted previously, for the state overall, the estimated harvest in pounds decreased by about 7% in 2010 from 2009 (Figure 18). The estimated harvest in 2010 was 24% lower than average for the first 7 years of the subsistence halibut harvest monitoring program ( ; Figure 19). subsistence halibut harvests decreased in 5 of the 8 regulatory areas in 2010 compared to 2009 (Figure 17; Figure 18; Table 7). As in the first 7 years of the project, Area 2C (Southeast Alaska) accounted for the most subsistence halibut harvests in 2010 (424,818 lb; 53% of the state total); this harvest represents a decrease of 7% compared to 2009 (Table 7; Figure 17; Figure 18), but a 24% decrease compared to the 7-year average from (Figure 19). The percentage of the total statewide subsistence halibut harvest that took place in Area 2C in 2010 was 53%, similar to 2009 (53%), 2008 (52%), 2007 (51%), 2006 (52%), and 2005 (51%), but a decline compared to 57% in 2004 and 60% in Harvests increased in the 3 subareas within Area 2C in 2010 compared to 2009, with a 3% decrease in the southern Southeast Alaska subarea, an 11% decrease in the northern Southeast Alaska subarea (excluding the Sitka LAMP area), and a 14% decrease in the Sitka LAMP area. Harvests were down in all 3 Southeast subareas compared to recent 7-year averages: 15% in southern Southeast Alaska, 42% in the Sitka LAMP, and 27% in the remainder of northern Southeast Alaska. The reasons for these changes in Area 2C are likely complex and beyond the scope of this report. 12 harvests in Area 3A (Southcentral Alaska) decreased for the fifth straight year. The 2010 harvest of 312,650 lb dropped 5% from the 2009 harvest of 328,480 lb. The estimated subsistence halibut harvest in Area 3A in 2010 was 14% lower than the previous 7-year average (Figure 19). In contrast to the last 5 years, in terms of total pounds, the largest increase in estimated harvests over the first 3 years of the project took place in Area 3A, where the 2005 harvest of 429,275 lb was 6% higher than the estimate for 2004 (403,610 lb) and 50% higher than the estimate for 2003 (285,500 lb; Table 7). Area 3A accounted for 39% of the statewide subsistence halibut harvest in 2010, 38% in 2009, 38% in 2008, 36% in 2007, 34% in 2006, 36% in 2005, and 34% in 2004, compared to 27% in 2003 (Table 7). In Area 3A in 2010 compared to 2009, subsistence halibut harvests increased in the Yakutat area by 26% and in the Prince William Sound area by 25%. Decreases in harvests occurred in the waters of Kodiak Island along the road system (down 5%), the remainder of the Kodiak Island area (down 9%), and the Cook Inlet area (down 19%; Table 7). However, harvests in 2010 were lower than the previous 7-year averages in all 5 Area 3A subareas. In Area 3B (Alaska Peninsula), harvests declined from 25,492 lb in 2009 to 23,009 in 2010 (down 10%; Figure 17; Figure 18; Table 7). In Area 3B, the 2010 estimated harvest was the lowest of the 8 years of the project, 41% below the previous 7-year average, and notably below the estimates for 2005 (46,225 lb), 2006 (48,547), and 2007 (47,748 lb; Table 7; Figure 17; Figure 19). Earlier reports (e.g. Fall and Koster 2010:12) suggested that improved participation in the SHARC program in 2006, 2007, and 2008 accounted for some of the increase in the estimated harvests in Area 3B in , compared to 2003 and 2004, the first 2 years of the harvest monitoring program. However, the of SHARC holders 12 Further discussion of differences between harvest estimates for appears in Chapter 3 and Chapter 4. 12
25 for Area 3B tribes and rural communities decreased from 606 in 2008 to 309 in 2009 and 369 in 2010, a decline in program participation that may partially explain the lower harvest estimates for 2009 and 2010 (see discussion of Sand Point in Chapter 3). subsistence halibut harvests in Area 4A (Eastern Aleutians) dropped 57% from 2009 (33,499 lb) to 2010 (14,548 lb). The harvest in Area 4A in 2010 was 44% lower than the previous 7-year average (Figure 19). There are only 3 communities in Area 4A: Akutan, Nikolski, and Unalaska Dutch Harbor. Therefore, harvest estimates for individual communities strongly shape the area estimate. For example, previous reports have discussed how sampling achievement in Akutan evidently affected the area s harvest estimate (Fall and Koster 2010:13). For 2009, an increased harvest by SHARC holders living in Unalaska Dutch Harbor, from 13,710 lb in 2008 to 29,306 lb in 2009, accounted for most of the change in the regulatory area s estimate between those 2 years, but estimated harvests in that community dropped to 13,081 lb for (See below for more discussion of harvest estimates for Unalaska Dutch Harbor.) In Area 4B (Western Aleutians) there was a large decrease of 62% in the estimated subsistence harvest of halibut in 2010 (450 lb) compared to 2009 (1,175 lb; Table 7; Figure 17; Figure 18). The 2008 estimate was 147% higher than the previous 5-year average (Fall and Koster 2010:92). This increase in 2008 was likely due in part to the larger reported average size of halibut harvested in this area in 2008 (30.5 lb [net weight] per fish; see Table 9 in Fall and Koster 2010:66) compared to earlier years (19.5 lb [net weight] per fish in 2007 [Fall and Koster 2008:71]). The average weight of subsistence harvested halibut in Area 4B in 2009 was only 15.4 lb (see Table 9 in Fall and Koster 2011) and 12.6 lb in 2010 (see Table 9, below). The estimated harvest for Area 4B was 80% below the previous 7-year average (Figure 19), and lower than any other year since the program began in subsistence harvests of halibut in Area 4C (Pribilof Islands) rose 72% in 2010 to 10,859 lb, from 6,323 lb in 2009 (Figure 17, Figure 18, Table 7). The 2010 was virtually identical to the previous 7- year average (0.1% higher; Figure 19). As noted in reports for previous project years (Fall et al. 2005:15; Fall and Koster 2008:15), a high response rate to the survey, based upon follow-up household surveys and inseason data collection by the Central Bering Sea Fishermen s Association, likely produced very reliable harvest estimates for St. Paul, the largest community in Area 4C, after the first project year of However, due to funding reductions, this work did not take place for 2008, 2009, or The of valid SHARCs held by St. Paul residents dropped from 246 in 2007 to 42 in 2008, 44 in 2009, and 41 in 2010, and the response rate to the survey declined from 83% in 2007 to 45% in 2008, 34% in 2009, and 29% in However, the estimated of subsistence halibut fishers in the community remained about the same: 14 in 2007, 15 in 2008, 16 in 2009, and 19 in In Area 4D (Central Bering Sea), the subsistence halibut harvest estimate for 2010 of 1,171 lb was 82% higher than the estimate of 644 lb for However, the 2010 estimate was 78% lower than the previous 7-year average for Area 4D (Figure 17; Figure 18; Figure 19; Table 7). It is likely that this sharp drop in the harvest estimate for Area 4D since 2008 is the result of nonrenewal of SHARCs by subsistence fishers. The of SHARCs held by residents of Savoonga, the principal halibut harvesting community in Area 4D, dropped from 43 in 2007, with an estimated 15 subsistence halibut fishers, to 17 SHARC holders in 2009, with an estimated 7 subsistence halibut fishers, and to 17 SHARC holders in 2010 with 6 fishers. As in Area 4D, declining registration of subsistence halibut fishers in the SHARC program may also be a primary cause of lower harvest estimates in Area 4E (East Bering Sea Coast) over the last 3 years ( ). Although the estimated harvest of 10,055 lb in 2010 was a 15% increase from the 8,749 lb estimated for 2009, the 2010 harvest was 75% lower than the 7 year average from (Figure 17; Figure 18; Figure 19; Table 7). Lower harvest estimates for this area are likely in part attributable to the substantial drop in valid SHARCs held by tribal members and rural community residents of Area 4E, from 1,191 in 2007 to 421 in 2008, 374 in 2009, and 286 in Also, unlike , no outreach, face-to-face interviewing, or telephone calls took place in Area 4E communities in 2008, 2009, or 2010, 13
26 resulting in lower response rates in several communities compared to previous years. For example, response rates dropped in Toksook Bay from 41% (218 of 533 SHARCs) in 2007 to 32% (11 of 34 SHARCs) in 2008, 39% in 2009 (13 of 33), and 38% in 2010 (12 of 32); and in Tununak, from 64% (44 of 69 SHARCs) in 2007, to 10% (7 of 68 SHARCs) in 2008, 55% (6 of 11 SHARCs) in 2009, and 17% (3 of 11 SHARCs) in Figure 20 illustrates the average subsistence halibut harvest in pounds net weight for those SHARC holders who subsistence fished in Figure 21 illustrates the average harvest per fisher in s of halibut. For the state overall, the average subsistence halibut fisher harvested 160 lb (net weight) or about 8.7 halibut in Average harvests per fisher at the regulatory area level ranged from 46 lb (net weight) in Area 4B to 428 lb per fisher in Area 4C. Average subsistence halibut harvests were lower in 2010 than in any of the previous 7 years. In 2003, subsistence fishers on average harvested 8.9 halibut (211 lb; Fall et al. 2004:12 13): in 2004 the average harvests were 8.8 halibut and 199 lb (Fall et al. 2005:15); in 2005, the average harvests were 9.9 halibut and 210 lb (Fall et al. 2006: 17); in 2006, average harvests were 9.2 halibut and 190 lb (Fall et al. 2007:18); in 2007, the averages were 9.1 halibut and 174 net pounds harvested per fisher (Fall and Koster 2008:16); in 2008, average harvests were 9.2 halibut and 167 lb (Fall and Koster 2010:13); and in 2009, average harvests were 8.6 halibut and 163 lb (Fall and Koster 2011:14). Subsistence Halibut Harvests by Place of Residence As shown in Figure 22, there were 26 Alaska communities whose residents had combined estimated subsistence halibut harvests of approximately 7,000 lb or more (net weight) in In this figure, community totals include harvests of all SHARC holders living in the community, regardless of type of SHARC (tribal or rural) or tribal affiliation. 13 Residents of these communities accounted for 88% of the total Alaska subsistence halibut harvest in Residents of Kodiak (Kodiak includes the city of Kodiak and other portions of the Kodiak Island Borough connected to it by roads) ranked first with 21% of the total Alaska harvest, and Sitka ranked second with about 10%. With 12,824 and 8,881 residents, respectively, these 2 communities included about 26% of the population of rural communities eligible to participate in the subsistence fishery. There were 68 other Alaska communities with at least one resident who participated in the subsistence halibut fishery in The total harvest for these other communities represented about 12% of the state total. For 2010, 149 SHARC holders provided out-of-state addresses from 117 communities in 24 states, provinces, and territories. 14 Seattle was the non-alaska community with the most SHARC holders, with 5. Nine non-alaska resident SHARC holders subsistence fished for halibut in 2010, with a harvest of 20 fish and 603 lb (0.08% of the state total; see Appendix Table E-4). In 2009, 6 non-alaska residents participated in the subsistence halibut fishery, with a harvest of 22 fish and 525 lb (0.06% of the state total). In 2008, 3 non-alaska residents participated in the subsistence halibut fishery, with a harvest of 13 fish and 237 lb (0.03% of the state total). In 2007, no non-alaska resident SHARC holders participated in the Alaska subsistence halibut fishery. In 2006, 7 non-alaska resident SHARC holders subsistence fished for halibut, reporting a harvest of 72 fish and 2,346 lb (net weight; 0.2% of the state total). No non-alaska resident SHARC holders subsistence fished for halibut in In 2004, 24 non-alaska residents reported subsistence fishing for halibut in Alaska, with an estimated total harvest of 169 fish and 4,845 lb (net weight; about 0.4% of state total). In 2003, 5 non-alaska residents participated in the Alaska subsistence halibut fishery, harvesting 5 fish. 13 Note that nonrural places, such as Anchorage, Juneau, Ketchikan, and Valdez, appear in Figure 22 and in Appendix Tables E- 4, E-5, and E-6, because members of eligible Alaska Native tribes may participate in the fishery regardless of where they live, and because some eligible residents of rural areas have mailing addresses in nonrural places. 14 Note that members of eligible tribes may obtain SHARCs regardless of their place of residence. 14
27 Subsistence Harvests by Gear Type Table 6 and Figure 23 report the estimated subsistence harvests of halibut in Alaska in 2010 by gear type and regulatory area fished. In total, 610,992 lb (77%) of halibut (net weight) were harvested using setline (stationary) gear (i.e., longlines, or skates, sometimes set with a power winch attached to a vessel; the highest percentage of any of the 8 study years) and 186,567 lb (23%) were harvested using hand-operated gear (i.e., handlines or lines attached to a rod or pole). There were notable differences between regulatory areas (Table 6, Figure 23). Harvests using setline gear predominated in Area 2C (Southeast Alaska; 83% of the area s total subsistence harvest), 3A (Southcentral Alaska; 72%), Area 4A (Eastern Aleutian Islands; 53%), Area 4C (Pribilof Islands; 93% setline gear), Area 4D (Central Bering Sea; 72%), and Area 3B (Alaska Peninsula; 51%). In contrast, hand-operated gear accounted for most of the subsistence halibut harvests in Area 4B (Western Aleutian Islands; 53%) and Area 4E (East Bering Sea Coast; 69%). In 2009, 72% of the total Alaska subsistence halibut harvest was taken with setline gear and 28% with hand-operated gear (Fall and Koster 2011:15). In 2008, 74% of the total Alaska subsistence halibut harvest was taken with setline gear and 26% with hand-operated gear (Fall and Koster 2010:14). In 2007, 69% of the total Alaska subsistence halibut harvest was taken with setline gear and 31% with handoperated gear (Fall and Koster 2008:16 17). In 2006, 70% of the total Alaska subsistence halibut harvest was taken with setline gear and 30% with hand-operated gear (Fall et al. 2007:18 19). In 2005 also, 70% of the total Alaska subsistence harvest was taken with setline gear and 30% with hand-operated gear (Fall et al. 2006: 18). In 2004, 74% of the Alaska subsistence halibut harvest was taken with setline gear and 26% with hand-operated gear (Fall et al. 2005:16). In 2003, 72% was taken with setline gear and 28% with hand-operated gear (Fall et al. 2004:13). Number of Hooks Fished with Setline Gear Respondents who fished with setline (stationary) gear (longline or skate) were asked to report how many hooks they usually set. The findings by regulatory area are reported in Table 8. For the fishery overall, most setline fishers (40%) used 30 hooks, the maximum allowed by regulation in areas 2C, 3A, 3B, 4A, and 4B (there is no hook limit in areas 4C, 4D, and 4E; Figure 24). The next most frequently reported was 20 hooks, usually used by 17% of the fishers who used setline gear. Fifteen hooks (11%) ranked third, followed by 25 hooks (8%) and 10 hooks (6%). This pattern is similar to that recorded for 2009, when 37% of set line fishers used 30 or more hooks and 19% used 20 hooks (Fall and Koster 2011:15); 2008, when 42% of setline fishers used 30 or more hooks and 19% used 20 hooks (Fall and Koster 2010:14 15); 2007, when 41% of setline fishers used 30 or more hooks and 19% used 20 hooks (Fall and Koster 2008:17); 2006, when 38% of setline fishers used 30 or more hooks and 20% used 20 hooks (Fall et al. 2007:19); 2005, when 42% of setline fishers used 30 or more hooks and 20% used 20 hooks (Fall et al. 2006:18 19); 2004, when 44% of setline fishers used 30 hooks and 19% used 20 hooks (Fall et al. 2005:16), and 2003, when 43% of setline fishers used 30 hooks and 20% used 20 hooks (Fall et al. 2004:13). Thirty was the most frequently used of hooks with setline gear in 7 of the 8 regulatory areas (Table 8): 2C (Southeast Alaska), 39%; 3A (Southcentral Alaska), 43%; 3B (Alaska Peninsula), 41%; 4A (Eastern Aleutian Islands), 54%; Area 4C (Pribilof Islands), 83%; Area 4D (Central Bering Sea), 61%; and 4E (East Bering Sea Coast), 34%. In Area 4B (Western Aleutians), 45% of fishers who used setline gear used 10 hooks and 36% used 20 hooks. Number of Subsistence Halibut Fishing Trips For 2010, for the second time in the harvest survey program, respondents were asked to report the of subsistence fishing trips they took for halibut in the study year. The average of trips for subsistence halibut fishers was 4.7 (the same as in 2009 [Fall and Koster 2011:15]), with those holding tribal SHARCs averaging 5.1 trips (compared to 5.5 in 2009) and those holding rural SHARCs averaging 4.6 trips (compared to 4.5 trips in 2009). In most regulatory areas, the average subsistence fisher took 15
28 between 4 and 7 trips, with higher averages in Area 4D (average of 6.8 trips) and Area 4C (average of 7.3 trips; Figure 25). As shown in Figure 26, about 76% of fishers took 5 or fewer trips, and about 17% took between 6 and 10 trips. Six percent took between trips, and about 1% took more than 20 trips. The average of subsistence halibut harvested per fishing trip in 2010 was 1.8 (the same as in 2009), with tribal SHARC holders averaging 2.3 fish and rural SHARC holders averaging 1.6 fish. The highest average harvests per trip occurred among tribal SHARC holders in Area 4B (3.5 halibut per trip) and Area 4C (2.8 halibut per trip; Figure 27). Sport Harvests of Halibut by SHARC Holders Survey respondents were asked to report the of halibut and pounds of halibut they harvested while sport fishing during They were instructed not to include fish they considered sport caught as part of their subsistence halibut harvest. The goal of this question was to avoid double counting harvested halibut in this survey and in the statewide survey of sport fishers administered by the Division of Sport Fish of ADF&G. Answering this question required respondents to classify their hand-operated gear (i.e., hook and line and rod and reel) harvests as either subsistence or sport; these gear types are legal gear for both sport fishing and subsistence fishing. Fish reported in the survey as sport harvests are not included in the estimated subsistence harvests discussed above. If SHARC holders also received the sport fish survey for 2010, they would be expected to report only their sport caught halibut and not include any halibut they reported as subsistence harvests, even if taken with rod and reel or handheld line with two or fewer hooks. Note that the project findings do not represent the total recreational halibut harvest by residents of eligible communities and tribes in 2010, because individuals from these tribes and communities who did not obtain SHARCs could have sport fished. As shown in Table 4 and Table 6, the estimated total sport halibut harvest by holders of SHARCs in 2010 was 8,651 fish and 149,241 lb (net weight). By area fished, most of the sport halibut harvest by SHARC holders occurred in Area 3A (Southcentral Alaska; 72,244 lb; 48%) and Area 2C (Southeast Alaska; 71,364 lb; 48%; Table 6). In total, an estimated 2,297 SHARC holders (21%) reported that they sport fished for halibut in A large proportion of these fishers fished in either Area 2C (1,313; 57%) or Area 3A (887; 39%; Table 6). (See Appendix Table E-7 for estimated sport halibut harvests by tribe and nontribal rural community SHARC holders.) 15 Average Net Weights of Subsistence- and Sport-Caught Halibut Table 9 reports the average net weight of subsistence- and sport-caught halibut by SHARC holders in 2010, based upon estimates provided by survey respondents. For the state, the estimated average net weight of subsistence caught halibut was 18.4 lb and the average net weight of sport harvested halibut by SHARC holders was 17.3 lb. For the halibut reported as harvested in the SHARC program by SHARC holders in 2010, the average net weight per harvested halibut was 18.2 lb. Between regulatory areas, there was a range of average weights per halibut. The halibut harvested by the communities of Area 4D (St. Lawrence Island), averaged 31.0 lb (net weight) per fish. Halibut harvested in the subsistence fishery in Area 4C were also larger than the state average, at 21.1 lb per fish, as were the halibut harvested in the 15 The ADF&G postal survey did not investigate the criteria by which survey respondents classified their rod and reel (hook and line attached to a rod or pole) halibut harvests as subsistence or sport. However, a supplemental mailing to 1,098 SHARC holders from Kodiak and Sitka who fished for halibut in 2004 asked respondents to provide reasons for classifying their halibut harvests as sport or subsistence. For a discussion of the findings, see Fall et al. 2006:19 20, In short, the primary factor (for 69% of respondents) was the gear used to harvest the fish: respondents viewed rod and reel as sport gear and setline gear as subsistence gear. Another factor, reported by 12%, concerned the composition of the fishing group. If the SHARC holders had fished with relatives or friends who did not possess a SHARC, they classified their fishing as recreational. Harvest amounts were also a consideration: harvests of one or two halibut with a rod and reel were considered sport by some respondents, but if they harvested more than 2 fish with rod and reel in one day, they classified the harvest as subsistence. Finally, about 19% of the respondents gave reasons related to the uses of the fish or other cultural and lifestyle explanations. 16
29 subsistence fishery in 2C, at 19.7 lb per fish. In contrast, in Area 4E, halibut harvested in the subsistence fishery averaged 12.9 lb (net weight), 70% of the statewide average. The average weight of halibut declined steadily over the first 6 years of this project. In 2009, averages rose to 19.0 lb per fish in the subsistence fishery, 16.6 lb for sport-caught halibut, and 18.5 for all halibut (Fall and Koster 2011:66), compared to 2008, when the average subsistence caught halibut weighed 18.2 lb, sport harvested halibut by SHARC holders weighed 17.3 lb, and all halibut harvested by SHARC holders averaged 18.1 lb (Fall and Koster 2010:15 16). However, averages for subsistence-harvested halibut (18.4 lb) and all halibut (18.2 lb) for 2010 were down from those recorded for In 2007, the estimated average weight of halibut harvested in the subsistence fishery was 19.2 lb, the average halibut harvested by SHARC holders while sport fishing weighed 17.9 lb, and the average of all halibut harvested noncommercially was 19.0 lb (Fall et al. 2007; Fall and Koster 2008:18). In 2006, the estimated average weight of halibut harvested in the subsistence fishery was 20.8 lb, the average halibut harvested by SHARC holders while sport fishing weighed 19.9 lb, and the average of all halibut harvested noncommercially was 20.7 lb (Fall et al. 2007:20). In 2005, the estimated average weight of halibut harvested in the subsistence fishery was 21.1 lb, the average halibut taken by SHARC holders while sport fishing weighed 20.8 lb, and the average of all halibut harvested noncommercially was 21.0 lb (Fall et al. 2006:20). In 2004, the statewide average for subsistence harvested halibut was estimated at 22.8 lb, the average sport harvested halibut by SHARC holders was 20.0 lb, and the average for all halibut harvested noncommercially was 22.2 lb (Fall et al. 2005:17). In 2003, the statewide average for subsistence harvested halibut was 23.7 lb, the average sport harvested halibut by SHARC holders was 22.8 lb, and the average for all halibut harvested noncommercially was 23.5 lb (Fall et al. 2004:14). ROCKFISH HARVESTS Survey respondents were asked to estimate the of rockfish they harvested while subsistence fishing for halibut in Harvest data at the species level were not collected as part of this survey. Note that these survey results do not represent an estimate for the total subsistence rockfish harvest by SHARC holders in 2010 because they might have harvested rockfish while fishing for species other than halibut, and other fishers in the communities who did not obtain SHARCs might have harvested rockfish. The Division of Subsistence Community Subsistence Information System (CSIS) 16 includes estimates of rockfish harvests for communities in which comprehensive household surveys have been administered. It should also be noted that the label bycatch for these harvests is misleading. 17 Rockfish are used for subsistence purposes in rural communities throughout their range in Alaska (CSIS). It is highly likely that most rockfish harvested incidentally in the subsistence halibut fishery are utilized as a subsistence food. It is highly unlikely that many incidentally caught rockfish are discarded in this subsistence fishery. As shown in Table 10, the statewide estimated rockfish incidental harvest in the subsistence halibut fishery in 2010 was 12,851 fish by 1,322 fishers (12% of all SHARC holders, and 27% of all SHARC holders who subsistence fished for halibut in 2010). This is an average of about 2.6 rockfish per fisher for all subsistence halibut fishers in the SHARC program, and about 9.7 rockfish per fisher for those who had a rockfish harvest. Most of the subsistence halibut fishers who caught rockfish fished in Area 2C (Southeast Alaska; 937 fishers; 71%) and Area 3A (343 fishers; 26%). In Area 2C, about 31% of 16 Hereinafter cited as CSIS; see footnote The Magnuson-Stevens Fishery Conservation and Management Act (Section 3) defines bycatch as fish harvested in a fishery, but which are not sold or kept for personal use, and includes economic discards and regulatory discards. Such term does not include fish released alive under a recreational catch and release fishery management program. Federal regulations (50 CFR 679.2) define bycatch or bycatch species as fish caught and released while targeting another species or caught and released while targeting the same species; under 50 CFR discard means to release or return fish to the sea, whether or not such fish are brought fully on board a fishing vessel. In all cases, bycatch means to discard fish and excludes retaining fish for use. The federal definition of incidental catch or incidental species is fish caught and retained while targeting on some other species, but does not include discard of fish that were to the sea (50 CFR 679.2). 17
30 subsistence halibut fishers incidentally harvested rockfish, as did 21% in Area 3A (Southcentral Alaska). (See Appendix Table E-7 for estimated rockfish harvests by tribe and by nontribal rural community SHARC holders.) As illustrated in Figure 28 and Figure 29, most of the incidental rockfish harvest in 2010 was harvested in Area 2C: 7,688 rockfish, 60% of the statewide total. Area 3A accounted for the second highest total: 4,426 rockfish, 34% of the total. Harvests were very small by SHARC holders fishing in other regulatory areas; their combined harvest of 738 rockfish was about 6% of the statewide total. Compared to 2009, when 13,315 rockfish were harvested, the incidental rockfish harvest in the subsistence halibut fishery in 2010 was down by 4%. The 2010 estimated rockfish harvest was also lower than the estimate for 2004 (19,001 rockfish), 2006 (16,945), 2007 (15,266), and 2003 (14,870 rockfish), but higher than 2005, when the incidental rockfish harvest was 12,395. Table 10 also reports location of incidental rockfish harvests in 2010 within geographic subareas. Most of the harvest occurred in southern Southeast Alaska (3,956 rockfish), the Sitka LAMP area (2,644 rockfish), the Kodiak Island road system (1,528 rockfish), the remainder of northern Southeast Alaska (1,088 rockfish), other Kodiak Island locations (1,101 rockfish), Cook Inlet (612 rockfish), Prince William Sound (611 rockfish), and the Yakutat area (574). Incidental rockfish harvests totaled 402 fish in the eastern Aleutians east subarea, and 209 in the lower Alaska Peninsula subarea. LINGCOD HARVESTS Survey respondents were asked to estimate the of lingcod they harvested while subsistence fishing for halibut in Note that these survey results do not provide an estimate of the total subsistence lingcod harvest by SHARC holders in 2010 because they might have harvested lingcod while fishing for species other than halibut. Also, other fishers in the communities who did not hold SHARCs might have fished for or harvested lingcod, so that these incidental harvests represent only a portion of the total 2010 subsistence harvest. The Division of Subsistence Community Subsistence Information System (CSIS) includes estimates of lingcod harvests for communities in which comprehensive household surveys have been administered. It should also be noted that the label bycatch for these harvests might be misleading. 18 Lingcod are used for subsistence purposes throughout their range (CSIS). It is highly likely that most lingcod harvested incidentally in the subsistence halibut fishery are utilized as a subsistence food. It is very unlikely that many lingcod caught in this subsistence fishery are discarded. The statewide estimated incidental lingcod harvest in the subsistence halibut fishery in 2010 was 2,864 fish by 732 fishers (Table 10). This is an average of about 0.6 lingcod per fisher for all subsistence halibut fishers who participated in the SHARC program, and 3.9 lingcod per fisher for those who had a lingcod harvest. Of SHARC holders who subsistence fished for halibut in 2010, 15% harvested at least one lingcod while halibut fishing. Almost all of the subsistence halibut fishers who harvested lingcod fished in Area 2C (Southeast Alaska; 493; 67%) and Area 3A (Southcentral Alaska; 218; 30%). (See Appendix Table E-7 for estimated lingcod harvests by tribe and by nontribal rural community SHARC holders.) As illustrated in Figure 30 and Figure 31, most of the incidental lingcod were harvested in Area 2C: 1,800 lingcod, 63%. Area 3A fishing locations accounted for the second highest total: 880 lingcod, 31%. In , an estimated 3,298, 4,407, 2,355, 3,486, 3,402, 3,479, and 3,390 lingcod, respectively, were harvested in the subsistence halibut fishery. The 2010 estimated harvest represents a decrease of 16% in the incidental lingcod harvest compared to 2009, and a decrease of 16% over the previous 7-year average ( ). 18 See footnote 17 for definitions of bycatch and incidental catch. 18
31 Table 10 also reports the location of incidental lingcod harvests by geographic subarea in Most of this harvest occurred in Area 2C (Southeast Alaska): the Sitka LAMP area (920 lingcod), southern Southeast Alaska (719 lingcod), and northern Southeast Alaska waters outside the Sitka LAMP (161 lingcod). Incidental lingcod harvests totaled 260 lingcod along the Kodiak Island road system, 102 lingcod in the lower Alaska Peninsula, 242 lingcod in other Kodiak area waters, 144 in Cook Inlet, and 142 in the Yakutat area. Harvests totaled fewer than 100 lingcod in each of the other geographic subareas. 19
32 20
33 CHAPTER 3: DISCUSSION COMPARISONS WITH OTHER HARVEST ESTIMATES As discussed in the first report for the SHARC survey project (Fall et al. 2004:19 22), comparing the statewide subsistence halibut harvest estimates generated by the SHARC survey with subsistence halibut harvest estimates from projects conducted in previous years continues to be difficult. The primary reason, as noted in Chapter 1, is that the regulations that allow subsistence halibut fishing in Alaska waters using traditional gear, such as longlines with more than 2 hooks, and that removed the restrictive daily harvest limit of 2 fish, have been in place for only 8 years, since May Although the ADF&G Division of Subsistence has conducted systematic household surveys in many rural Alaska communities that have traditional uses of halibut, these studies pertain to different harvest years. In addition, there are many communities, especially in western Alaska, where such surveys have not been conducted. Also, these Division of Subsistence studies have attempted to estimate the total halibut harvest for home use by including harvests conducted under sport fishing rules and harvests removed from commercial fisheries for home use. Typically, these studies have also collected harvests by gear type, such as rod and reel or other gear. When using these data sets, therefore, it is not possible to separate the sport harvest from the subsistence harvest for past harvest years, especially in larger rural communities with a diverse population where at least a segment of the population perceives some of their halibut fishing effort as recreational (see, for example, the discussions about Sitka and Kodiak, below). Furthermore, the statewide subsistence halibut harvest estimates from the SHARC postal survey include only those subsistence harvests by individuals who obtained SHARCs. The estimates do not include total noncommercial harvests, such as those accomplished under sport fishing regulations, or halibut removed by commercial fishers for use by their households or for noncommercial sharing. 19 Thus they can be only partial estimates of the total harvest of halibut for home use by rural Alaska residents and cannot be directly compared to estimates from previous Division of Subsistence studies. The report for the first year of this project included a detailed discussion of previous efforts to develop an estimate of subsistence halibut harvests at the regional and statewide levels. The report suggested that the 2003 SHARC survey estimates were not markedly different from estimates based on Division of Subsistence household survey data as reported in the Community Subsistence Information System (CSIS). We will not repeat that full discussion here. 20 However, the report also concluded that because of the limitations associated with the previous subsistence harvest estimates at the statewide level, until a time series is developed based upon the SHARC survey results, discussion of harvest trends in the subsistence halibut fishery will remain speculative. A discussion comparing the project findings for 2010 with those for appears in Chapter Since 1995, halibut removed for personal use by commercial fishers from their commercial harvests must be weighed and accounted for within the commercial quota share program (Gregg Williams, IPHC, personal communication). 20 For example for 2000, the IPHC estimated 439,000 pounds net weight for Alaska personal use (noncommercial, nonrecreational) harvests (in Wolfe 2001). The IPHC estimate is based upon a methodology described by Trumble n.d.. The IPHC method assumed that 50% of Alaska Native rod and reel halibut harvests, as reported in ADF&G household surveys, are sport and 50% personal use, and that 75% of the non-native rod and reel harvests are sport and 25% personal use (Trumble n.d.:62). No justification for these assumptions is provided, and changing these sport-to-personal-use ratios can result in a very different estimate for the personal use halibut harvest. In a report to the Alaska Board of Fisheries in May 2001, using the same data source as the IPHC, Wolfe (2001) estimated that the subsistence halibut harvest in Alaska probably ranges between 400,000 and 1,000,000 pounds (round weight) annually, based on harvest data in the CSIS/CPDB. This is an estimated harvest of 300,000 to 750,000 pounds net weight. See Fall et al. 2004:19 21 for discussion of Wolfe s methods. In the original analysis for the subsistence halibut program, the NPFMC estimated the Alaska subsistence halibut harvest at 1.5 million pounds net weight (68 FR 18145, April 15, 2003, EA/RIR [NPFMC 2003]). 21
34 COMMUNITY CASE STUDIES Despite the limitations discussed above, it is possible to compare some communities previous noncommercial halibut harvest estimates with estimates generated from the SHARC survey, keeping in mind the different sampling methods, uncertainty in the separation of subsistence and recreational harvests, and the relative newness of the regulatory changes enacted in Prior Division of Subsistence research has suggested that such communities, presented here as case studies, can also be seen as representative of other communities of similar size and geographic location. In the following evaluation, emphasis is placed on larger communities, since, as discussed in Chapter 2, a small of large communities have accounted for most of the statewide subsistence halibut harvest, according to the SHARC surveys. A comparison of the harvest estimates for these communities helps to determine the reliability of the statewide estimate generated by the SHARC survey, as well as survey performance. Because, as noted in Chapter 1, not all tribal SHARC holders live in the community where their tribal headquarters is located, the following comparisons are based upon place of residence of the SHARC holder, in order to be consistent with earlier division studies. Table 11 reports selected project findings for in the case study communities discussed below. Appendix tables E-4, E-5, and E-6 report project results for 2010 for all communities, based upon residence of SHARC holders. Sitka (Regulatory Area 2C) Sitka had a population of 8,835 people in 2000, 2,178 of whom were Alaska Native (U. S. Census Bureau 2001). In 2010, Sitka s population was 8,881, including 2,184 Alaska Natives (Table 1; ADLWD 2011). Sitka was the second largest rural community eligible to participate in the SHARC halibut fishery in 2010, and had the second highest of SHARCs issued, at 1,635 (Table 11; about 15% of the Alaska total). Of these, 1,363 were issued to nontribal residents of Sitka, and 272 to tribal members; the latter total was down from 470 in 2007 (Fall and Koster 2008:22). Members of the Sitka Tribe of Alaska (STA) held 289 SHARCs in 2010, compared to 485 in 2007, 273 in 2008, and 288 in It is important to remember that some STA members live in communities other than Sitka and that members of other Alaska tribes live in Sitka. Because of the relatively large of SHARC holders who live there, developing a reliable subsistence halibut harvest estimate for Sitka is essential for the success of this subsistence harvest assessment program. Sitka residents response rates to the survey have also been substantial during the 8 years of the project: 75% in 2003, 72% in 2004, 68% in 2005, 69% in 2006, 68% in 2007, 71% in 2008, 67% in 2009, and 62% in The Division of Subsistence has generated 2 estimates of noncommercial halibut harvests in Sitka for years prior to the 2003 authorization of subsistence halibut fishing (Table 12). One is for the 1987 study year, in which the estimated total noncommercial halibut harvest was 193,335 lb (net weight; ±22%), or 180,982 lb if fish removed from commercial harvests are excluded. This noncommercial total includes only harvests reported by surveyed persons as taken with rod and reel; data on harvests using other methods such as longlines, which were not allowed at that time in the subsistence fishery, were not collected. An estimated 1,252 Sitka households had at least one member who fished noncommercially for halibut in For 1996, the total estimated noncommercial harvest was 165,772 lb (net weight; ±28%), and 149,244 lb with commercial removals excluded. In 1996, an estimated 943 Sitka households had at least one member who fished noncommercially for halibut. For 2010, the estimated subsistence harvest of halibut, by both tribal SHARC holders who live in Sitka (most, but not all, of whom are members of the STA) and by other residents of Sitka (1,635 SHARC holders), was 82,728 lb (net weight; 3,951 fish). This was the second highest of any community (behind Kodiak), and accounted for 10% of the statewide total subsistence halibut harvest. Of Sitka s total subsistence halibut harvest, 74,394 lb (90%) was taken with setline gear, and 8,334 lb (10%) was taken with hand-operated gear. Adding sport harvests by Sitka SHARC holders (9,257 lb) produces a noncommercial estimate of 91,985 lb (net weight). Of all SHARC holders from Sitka, an estimated 755 subsistence fished for halibut in Of these, 700 used setline gear and 218 used hand-operated gear. 22
35 Also, an estimated 228 SHARC holders from Sitka sport fished for halibut in Thus the estimated total of SHARC holders living in Sitka who fished for halibut in either the subsistence or recreational fishery in 2010 was 849 (Table 11). subsistence and sport halibut harvests by Sitka SHARC holders in 2010 were lower than estimates for any of the previous 7 study years and continued a downward trend that began in 2006 (Table 11). A total of 1,639 Sitka residents had SHARCs in 2003; 1,871 in 2004; 1,974 in 2005; 1,895 in 2006; 1,954 in 2007; 1,662 in 2008; and 1,731 in 2009, compared to 1,635 in Subsistence harvests by all Sitka SHARC holders were 174,880 lb (net weight) in 2003 compared to 166,474 lb in 2004, 146,319 lb in 2005, 163,372 lb in 2006, 142,049 lb in 2007, 109,581 lb in 2008, 97,424 lb in 2009, and 82,728 lb in 2010; the 2010 estimate was 15% lower than the estimate for 2009 and 53% lower than the estimate for A decline also occurred in the of halibut harvested: 6,621 in 2003, 6,583 in 2004, 6,062 in 2005, 6,691 in 2006, 6,304 in 2007, 5,513 in 2008, 4,834 in 2009, and 3,951 in 2010 (18% lower than 2009 and 40% lower than 2003). Adding sport harvests of halibut by SHARC holders to subsistence harvest totals results in noncommercial harvest estimates for Sitka that are similar among the first 4 years of the project: 207,288 lb for 2003, 192,303 lb in 2004, 202,232 lb for 2005, and 186,404 lb in 2006, but the total noncommercial harvests have declined annually since then, to 91,985 lb in According to the SHARC survey, fewer Sitka residents participated in the subsistence halibut fishery in 2010 (755) than any other study year, but this decline in participation (down 11% from 2009 and 8% compared to 2003) did not match the decline in harvests. There were 849 SHARC holders who participated in either the subsistence or sport fisheries for halibut in 2010, lower than any other study year: 956 in 2003, 1,026 in 2004, 987 in 2005, 1,036 in 2006, 1,010 in 2007, 932 in 2008, and 941 in In summary, this comparison suggests that the subsistence halibut harvest estimates for Sitka, based on the SHARC survey, appear reasonable. The estimates for were generally similar to those generated from previous face-to-face household surveys conducted in 1987 and However, the SHARC survey data for 2008, 2009, and 2010 show a decline in halibut harvests in Sitka compared to previous project years. A decline in the of SHARCs held by tribal members in Sitka may account, at least in part, for lower 2008, 2009, and 2010 estimated harvests, although average harvests by nontribal SHARC holders in Sitka were also lower in compared to (Table 13). For example, nontribal SHARC holders from Sitka who fished for halibut in 2010 had an average harvest of 111 lb per fisher, the lowest of the 8 project years and 28% below the previous 7-year average of 153 lb per fisher. Tribal SHARC holders from Sitka who fished in 2010 also had much lower harvests than previous years: only 105 lb per fisher, which is 54% below the previous 7-year average of 227 lb. These findings suggest that the estimates of declining harvests in Sitka are not a result of inadequate sampling or less participation in the SHARC program. Rather, the study finding show that subsistence halibut harvests in Sitka have declined from 2005 through The causes of this decline require further investigation. Petersburg (Regulatory Area 2C) In 2000, Petersburg had a population of 3,224, including 388 Alaska Natives (U. S. Census Bureau 2001); in 2010, the population had dropped to 2,948, including 390 Alaska Natives (Table 1; ADLWD 2011). Prior to the 2003 authorization of federal subsistence halibut fishing, the Division of Subsistence produced 2 estimates of noncommercial halibut harvests by Petersburg residents, based on household surveys in 1987 and 2000 (Table 14). In the 1987 project, a random sample of 49 of the 1,123 households in Petersburg was interviewed (4%), which generated a subsistence harvest estimate of 119,176 lb of halibut (net weight; ±51%); of this, 11,728 lb were estimated to have been removed from commercial 21 Following a recommendation from the first project year (Fall et al. 2004:31), data from the ADF&G Division of Sport Fish Statewide Harvest Survey (SWHS) about sport halibut harvests by Sitka residents were analyzed for additional background on halibut fishing in the community and discussed in the report for the 2004 project year (Fall et al. 2005:23-24). An updated analysis has not been prepared for this report. 23
36 harvests, resulting in a total noncommercial harvest estimate of 107,448 lb. As with Sitka, the 1987 project in Petersburg collected noncommercial harvest data only for halibut taken with rod and reel. Of the 1,123 households in Petersburg, 54% were estimated to have at least one member who fished for halibut noncommercially in 1987, which was an estimated 604 halibut fishers (CPDB). In 2000, Petersburg residents were estimated to have harvested 55,974 lb (net weight) of noncommercial halibut (±39%). Of this, 6,951 lb were estimated to have been removed from commercial harvests, for a subsistence harvest of 49,023 lb, all of which was taken with rod and reel. In 2000, it was estimated that 468 Petersburg households had at least one member who fished for halibut for home use. For 2010, the estimated subsistence harvest of halibut by Petersburg residents with SHARCs (961 SHARC holders) was 47,266 lb (net weight), very similar to the 46,766 lb harvested by 1,041 SHARC holders in 2009 and the 46,600 lb harvested by 985 SHARC holders in 2008 (Table 11). In 2007, 1,123 SHARC holders in Petersburg harvested 47,517 lb of halibut in the subsistence fishery; in 2006, 1,082 SHARC holders harvested 53,682 lb; in 2005, 1,197 SHARC holders harvested 61,372 lb; in 2004, 1,187 SHARC holders harvested 71,784 lb; and in 2003, 1,047 SHARC holders harvested 55,718 lb. Of the total 2010 subsistence halibut harvest, 33,951 lb (72%) was harvested with setline gear and 13,315 lb (28%) with hand-operated gear. This was an increased portion of the harvest taken with longlines compared to 2009, when 30,105 lb (64%) was harvested with setline gear and 16,661 lb (36%) with handoperated gear. In 2008, 67% of the subsistence halibut harvest by Petersburg residents was taken with setline gear, and 33% with hand-operated gear; in 2007, 67% with setline gear, and 33% with handoperated gear; 66% with setline gear and 34% with hand-operated gear in 2006; 72% with setline gear and 28% with hand-operated gear in 2005; and about 75% taken with setline gear and 25% with handoperated gear in both 2003 and In 2010, Petersburg SHARC holders also harvested 13,251 lb of halibut they classified as sport harvested, compared to 13,619 lb in This gives a total noncommercial halibut harvest estimate for Petersburg SHARC holders of 60,517 lb in 2010, compared to 60,385 lb in 2009, the 2 lowest totals over the 8 years of the project. In 2008, the sport harvest contributed 17,506 lb to the total noncommercial halibut harvest of 64,108 lb; 15,177 lb in 2007, for a total noncommercial halibut harvest estimate of 62,694 lb; 17,351 lb in 2006, for a total noncommercial halibut harvest estimate of 71,033 lb; 23,289 lb in 2005 for a total noncommercial harvest estimate of 84,661 lb; 26,408 lb in 2004 for a total noncommercial harvest estimate of 98,192 lb; and 19,611 lb in 2003 for a total noncommercial halibut harvest estimate of 75,329 lb (Table 11). In 2010, an estimated 409 Petersburg SHARC holders harvested halibut in the subsistence fishery (323 with setline gear and 209 with hand-operated gear). This compares to 418 fishers in 2009 (323 with setline gear and 224 with hand-operated gear); 393 fishers in 2008 (285 with setline gear and 207 with hand-operated gear); 386 fishers in 2007 (274 setline and 191 hand-operated gear); 416 fishers in 2006 (300 setline and 222 hand-operated gear); 436 fishers in 2005 (338 setline gear and 175 used handoperated gear); 482 fishers in 2004 (322 setline gear and 206 hand-operated gear); and 415 subsistence halibut fishers in 2003 (330 setline gear and 138 hand-operated gear). In 2010, an estimated 256 Petersburg SHARC holders sport fished for halibut, as did 247 in 2009, 279 in 2008, 264 in 2007, 246 in 2006, 312 in 2005, 351 in 2004, and 268 in An estimated total of 501 Petersburg SHARC holders either subsistence or sport fished for halibut in 2010, as did 513 in 2009, 515 in 2008, 516 in 2007, 529 in 2006, 569 in 2005, 617 in 2004, and 523 in 2003 (Table 11). Because some Petersburg residents without SHARCs likely sport fished for and harvested halibut, the estimates of noncommercial halibut harvests by Petersburg residents generated by the SHARC survey appear consistent with the 1987 estimate based on household interviews, although the SHARC estimate is slightly higher than the in-person estimate for 2000, the year that state regulations restricted subsistence fishing to handlines or rods and reels with no more than 2 hooks. In that year, no Petersburg households reported taking halibut for home use with any gear other than rod and reel. In 24
37 contrast, an estimated 330 used setline gear in 2003, based on the SHARC survey, and 322 did so in 2004, 338 in 2005, 300 in 2006, 274 in 2007, 285 in 2008, 323 in 2009, and 323 in 2010 (Table 11, Table 14). Cordova (Regulatory Area 3A) In 2000, Cordova had a population of 2,454 people, including 368 Alaska Natives (U. S. Census Bureau 2001); Cordova s population in 2010 was 2,239, with 344 Alaska Natives (Table 1; ADLWD 2011). Before 2003, there were 6 Division of Subsistence household surveys that estimated noncommercial halibut harvests in Cordova (Table 15). After subtracting fish removed from commercial harvests for home use, estimated noncommercial halibut harvests by Cordova residents ranged from 25,609 lb (net weight; ±33%) in 1991 to 120,221 lb (±62%) in 1988, with an average over the 6 project years of 57,285 lb. The estimated of Cordova households with at least one member fishing noncommercially for halibut ranged from 228 in 1985 to 401 in 1992, with a mean of 325 households (CSIS). SHARC survey subsistence halibut harvest estimates and participation estimates for Cordova residents for 2003 were lower than might be expected from previous research (Fall et al. 2004:24 25). In 2003, 358 residents of Cordova obtained SHARCs (Table 11). Of these, an estimated 102 subsistence fished (68 with setline gear, 40 with hand-operated gear), 144 reported that they sport fished for halibut, and 194 fished for halibut either under the new federal subsistence halibut provisions or in the sport fishery. The estimated subsistence harvest from the SHARC survey was 15,498 lb (net weight; 7,613 lb [49%] with setline gear, 7,885 lb [51%] with hand-operated gear), and there were an additional 11,534 lb estimated taken by SHARC holders while sport fishing. The total of 27,032 lb was about 47% of the average for previous project years. Based on these comparisons, the final report for 2003 suggested that the SHARC survey had underestimated the amount of halibut harvested by Cordova residents for home use, perhaps because not all subsistence fishers in Cordova obtained SHARCs in The results of the survey for 2004 also supported this conclusion (Fall et al. 2005:25 26). A total of 526 Cordova residents had obtained SHARCs by the end of 2004 (an increase of 47%; Table 11). An estimated 262 Cordova SHARC holders subsistence fished for halibut in 2004, up 157% from Of these, 174 fished with setline gear (up 156%) and 97 used hand-operated gear. The estimated subsistence halibut harvest by Cordova residents in 2004 was 40,640 lb (net weight), an increase of 163% over Sport harvests by Cordova SHARC holders (an estimated 174 of whom sport fished for halibut in 2004) added 12,149 lb to the community harvest for 2004, for a total estimate of 52,789 lb of halibut harvested noncommercially by 325 fishers. This total was an increase of 95% over 2003, and was about 92% of the average for the 6 survey years prior to 2003 (and exceeded the total for 3 of those 6 years). Given that some Cordova residents likely obtained halibut for home use exclusively in the sport fishery and without obtaining SHARCs, the SHARC survey estimate for 2004 appeared consistent with earlier estimates of subsistence halibut harvests in Cordova. Findings for Cordova for 2005 were much like those for 2004 and supported the conclusions of the 2004 final report. As shown in Table 11, 602 Cordova residents held SHARCs in 2005, continuing the growth that had occurred in 2004, but at a slower pace. Subsistence halibut harvests totaled 47,141 lb, up about 16% from 40,640 lb in In 2004, 73% of the total was harvested with setline gear, as was 74% in In 2005, 281 Cordova residents obtained SHARC cards and went subsistence fishing, compared to 262 in Cordova SHARC holders harvested 10,519 lb of halibut while sport fishing in 2005, for a total noncommercial harvest estimate of 57,660 lb. This total was similar to the estimate for 2004 (a combined total of 52,789 lb in the subsistence and sport fishery) and approximated the mean harvest of 57,285 lb estimated in the 6 harvest survey project years. The estimated subsistence halibut harvest for Cordova in 2006 was 29,027 lb, a decline from 2004 (40,640 lb) and 2005 (47,141 lb) but still about double the 2003 estimated harvest (15,498 lb; Table 11). The reasons for this decline remain uncertain. The estimated sport halibut harvest by Cordova SHARC holders in 2006 was 7,020 lb, lower than estimates in the first 3 years of the SHARC program. In total, 25
38 Cordova SHARC holders harvested an estimated 36,047 lb of noncommercial halibut in This total was substantially lower than the noncommercial estimates for 2004 (52,789 lb) and 2005 (57,660) lb, but was higher than that for 2003 (27,032 lb; Table 11). The 2006 estimate was higher than estimates generated during previous in-person survey efforts in 1985 and 1991, but lower than the average for the 6 years for which SHARC data are available (Table 14). subsistence halibut harvests by Cordova SHARC holders declined slightly in 2007 from 2006 levels, to 28,716 lb, with most of this (21,683 lb; 76%) taken with setline gear. Sport harvests of halibut by Cordova SHARC holders declined to 4,203 lb in 2007, the lowest of the 5 previous project years. The total noncommercial harvest estimate for 2007 by Cordova SHARC holders was 32,919 lb of halibut, lower than any project year except 2003 and also lower than the average for the previous 6 in-person surveys (Table 11, Table 14). For 2008, the estimated subsistence harvest of halibut in Cordova was 27,547 lb, lower than any SHARC project year since 2003 but similar to estimates for 2006 and 2007 (Table 11). Of the 2008 subsistence harvest, 81% (22,301 lb) was harvested with setline gear. Sport harvests of halibut by Cordova SHARC holders totaled 5,562 in 2008, lower than during any SHARC project year except The 2008 total noncommercial harvest of halibut by Cordova SHARC holders was 33,109 lb of halibut, which was the second lowest (after 2007) since The 2008 estimated harvest was only 58% of the annual average for pre-2003 project years, although it is higher than either 1985 or 1991 (Table 15). The estimated subsistence halibut harvest for Cordova for 2009 was 23,364 lb, the lowest since 2003 and continuing a declining trend that began in 2006 (Table 11) Of the 2009 subsistence harvest, 76% (17,766 lb) was harvested with setline gear and the remaining 24% (5,598 lb) with hand-operated gear. Sport harvests of halibut by Cordova SHARC holders in 2009 added 3,868 lb, the lowest total over the first 7 years of the project. The 2009 total noncommercial harvest of halibut by Cordova SHARC holders was 27,232 lb, the lowest since The 2009 estimated harvest was 47% of the annual average for pre-2003 project years, and higher than only 1991 (Table 15). The estimated subsistence halibut harvest for Cordova for 2010 was 28,428 lb, the highest since 2007 and reversing the declining trend that began in 2006 (Table 11) Of the 2010 subsistence harvest, 90% (25,579 lb) was harvested with setline gear and the remaining 10% (5,849 lb) with hand-operated gear. Sport harvests of halibut by Cordova SHARC holders in 2010 added 5,837 lb. The 2010 total noncommercial harvest of halibut by Cordova SHARC holders was 34,265 lb, the highest since The 2010 estimated harvest was 60% of the annual average for pre-2003 project years, and higher than only 1985 and 1991 (Table 15). Fewer Cordova residents held SHARCs in 2010 (557) than in 2009 (599), 2008 (587), 2007 (615), 2006 (607), and 2005 (602). Fewer Cordova residents reported that they participated in the subsistence halibut fishery in 2010 (235) than in any of the previous study years except 2009 (234). The estimated of Cordova SHARC holders who sport fished for halibut (106) was lower than any year from In 2010, 261 Cordova SHARC holders fished noncommercially for halibut, down from 269 in 2009, 292 in 2008, and 315 in In 2010, fewer Cordova SHARC holders participated in any noncommercial halibut fishing than in any year since the new regulations came into effect except 2003 (Table 11). Port Graham (Regulatory Area 3A) Port Graham, which is located in Lower Cook Inlet, had a population of 171 in 2000, including 151 Alaska Natives (U. S. Census Bureau 2001). Port Graham s population in 2010 was 177, with 160 Alaska Natives (Table 1; ADLWD 2011). It is presented as a case example of the smaller, predominantly Alaska Native communities in regulatory areas 3A and 3B that depend heavily on subsistence harvests of fish and wildlife resources. The division has produced estimates of subsistence halibut harvests by Port Graham residents based on household surveys for 7 project years (Table 16). Excluding 1989, the year of the Exxon Valdez oil spill, Port Graham s noncommercial halibut harvests ranged from 4,451 lb (net weight; 26
39 ±14%) in 1993 to 11,232 lb (±14%) in 1992, with a 6-year average of 7,591 lb (net weight; Figure 32). Again excluding 1989, an estimated average of 38 Port Graham households had at least one member who subsistence fished for halibut in the project years in the late 1980s and 1990s. In 2010, a total of 47 Port Graham residents held SHARCs (excluding Port Graham tribal members who do not live in Port Graham), the same total as 2009 and similar to the total of 48 SHARC holders in In 2010, an estimated 30 Port Graham residents participated in the subsistence halibut fishery, with 23 using setline gear and 18 hand-operated gear; 5 said they went sport fishing for halibut. In comparison, in 2009, an estimated 35 Port Graham residents participated in the subsistence halibut fishery, with 22 using setline gear and 31 hand-operated gear; 9 said they went sport fishing for halibut. In 2008, an estimated 30 Port Graham residents subsistence fished for halibut, with 13 using setline gear and 23 using handoperated gear. Also, 2 said they had sport fished for halibut in In 2007, of 59 SHARC holders in Port Graham, an estimated 36 subsistence fished for halibut, with 22 using setline gear and 28 using handoperated gear. Also, 4 said they sport fished for halibut in In 2006, 30 Port Graham SHARC holders subsistence fished for halibut, with 9 using setline gear and 24 using hand-operated gear. In 2005, 18 Port Graham SHARC holders subsistence fished for halibut, with 8 using setline gear and 18 using hand-operated gear. Nine Port Graham SHARC holders sport fished for halibut in In 2004, 42 Port Graham SHARC holders subsistence fished for halibut, with 15 using setline gear and 31 using handoperated gear; 11 said they sport fished for halibut. In 2003, 35 Port Graham SHARC holders subsistence fished for halibut (10 used setline gear, 28 used hand-operated gear), and 3 said they sport fished for halibut (Table 11). The findings for the SHARC surveys were thus consistent with levels of participation found in the noncommercial halibut fisheries during previous studies in Port Graham, although estimated participation was lower in 2005, according to the SHARC survey. The subsistence halibut harvest estimate for Port Graham in 2010 was 7,222 lb (Table 11). Of this, 5,011 lb (69%) were harvested with setline gear and 2,211 lb (31%) with hand-operated gear. Adding 267 lb that Port Graham SHARC holders harvested in the sport halibut fishery results in a total community noncommercial harvest estimate of 7,489 lb in Harvests in 2010 were up compared to 2009, when Port Graham SHARC holders harvested an estimated 6,426 lb of halibut in the subsistence fishery, with 1,454 lb taken with setline gear and 4,973 lb with hand-operated gear, and an additional 197 lb in the sport fishery. Harvests in 2010 were also higher than those in 2006, when Port Graham SHARC holders harvested an estimated 6,194 lb of halibut, with 2,397 lb taken with setline gear and 3,797 lb with handoperated gear. (No sport harvests were reported for 2006). Harvests in 2010 were lower than those of ,097 lb in the subsistence fishery (6,896 lb by set line, 2,200 with hand-operated gear) and 51 lb in the sport fishery; and ,493 lb in the subsistence fishery (5,347 lb by setline, 3,146 with handoperated gear) and 233 lb in the sport fishery. In the first 3 years of the SHARC program ( ), estimated subsistence halibut harvests were higher in Port Graham than in In 2005, Port Graham SHARC holders harvested an estimated 11,127 lb of halibut, with 7,938 lb taken with setline gear and 3,190 lb with hand-operated gear. In 2004, Port Graham s estimated subsistence halibut harvest was 9,181 lb (net weight) with 4,425 lb (48%) harvested with setline gear and 4,755 lb (52%) with handoperated gear. In 2003, the estimated halibut harvest was 11,454 lb (net weight), with 4,398 lb (38%) harvested with setline gear and 7,056 lb (62%) with hand-operated gear (Table 11). Total noncommercial halibut harvest estimates for Port Graham (subsistence plus sport harvests reported by SHARC holders) for were similar to the highest estimate generated prior to the SHARC survey (11,232 lb in 1992; Table 11), and they also exceeded the average of previous project years of 7,591 lb. This finding was not unexpected: Port Graham has traditionally used setlines with multiple hooks to harvest halibut as well as hand-operated gear (Stanek 1985:67 69,151). With May 2003 regulations finally consistent with traditional harvest methods, residents of Port Graham and other communities with similar traditions could fish with setline gear and hand-operated gear, and thus their 27
40 reported subsistence halibut harvests are probably similar to historical levels. 22 However, the 2006 estimate of 6,194 lb and the 2009 estimate of 6,623 lb were lower than those for , and lower than the average of the prior in-person survey estimates for The 2007 and 2008 estimates were also lower than , but above the average of the earlier survey years; the estimate for 2010 was very close to the pre-2003 annual average (Table 15). The reasons for the lower harvests in compared to are uncertain, but a decline in the community s population in the mid 2000s may be part of the explanation. Kodiak City and Road System (Regulatory Area 3A) Kodiak in this report includes the city of Kodiak (population 6,334 in 2000, including 829 Alaska Natives; population 6,130 including 848 Alaska Natives in 2010) and those portions of the Kodiak Island Borough connected to the city of Kodiak by road. This area had a population of 12,973 people in 2000, including 1,697 Alaska Natives (U. S. Census Bureau 2001). The population in 2010 was 12,824, with 983 Alaska Natives (Table 1; ADLWD 2011). This is the largest rural community eligible to participate in the Alaska subsistence halibut fishery. Based on Division of Subsistence household surveys, estimates of halibut harvests for home use are available in the CSIS for the entire Kodiak road system population for 1982 and Estimates for Kodiak city residents alone are available for 1992 and 1993, and these can be expanded to produce a total for the entire road system population (Table 17). Excluding fish removed from commercial catches for home use, noncommercial halibut harvests by Kodiak road system residents ranged from 247,283 lb (usable weight; ±30%) in 1991 to 511,254 lb (±33%) in The average for the 4 available project years was 366,682 lb; of this, 338,476 lb (92%) was taken with rod and reel, most likely consistent with sport fishing regulations. On average for the 4 project years, 1,306 Kodiak road system households had at least one member who fished for halibut for home use. Kodiak residents held 1,702 SHARCs during 2010, down slightly from 1,826 SHARCs during 2009 and 1,725 in 2008 (Table 11). In 2010, an estimated 900 Kodiak SHARC holders subsistence fished for halibut; most (747; 83%) used setline gear. This compares to an estimated 923 subsistence fishers in Kodiak in 2009, of whom 749 (81%) used setline gear; 963 in 2008, of whom 763 (79%) used setline gear; 945 in 2007, of whom 707 (75%) used setline gear; 961 in 2006, of whom 684 (71%) used setline gear; 871 in 2005, 650 of whom (75%) used setline gear; 802 in 2004, 554 (69%) of whom used setline gear; and 646 in 2003, 438 of whom (68%) used setline gear. In 2010, an estimated 539 Kodiak SHARC holders sport fished for halibut, and 1,074 fished for halibut under noncommercial rules. This compares to 2009, when 619 Kodiak SHARC holders sport fished for halibut and 1,139 were involved in noncommercial halibut fishing; 2008, when 693 Kodiak SHARC holders sport fished for halibut and 1,213 were involved in noncommercial halibut fishing; 2007, when 648 sport fished for halibut and 1,157 were involved in noncommercial halibut fishing 2006, when 562 sport fished for halibut and 1,092 were involved in noncommercial halibut fishing; 2005 when 669 sport fished for halibut and 1,116 were involved in any noncommercial halibut fishing; 2004, when 581 sport fished for halibut, and 971 fished for halibut under either subsistence or sport regulations; and 2003, when 498 sport fished for halibut, and 858 either subsistence or sport fished for halibut (Table 11). Given the likelihood that many Kodiak residents continued to fish for halibut under sport fishing regulations in without obtaining SHARCs, the estimated level of participation in the subsistence fishery based on the SHARC survey appears reasonable when compared to the earlier household survey results. 22 A cautionary note for Port Graham for 2005 concerns response rate. Only 16 of 52 SHARC holders responded to the 2005 survey (31%; Fall et al. 2006:52). Further outreach in this community was necessary to improve the response rate and build confidence in the harvest estimates. This outreach occurred in 2007 for the 2006 project year, and a response rate of 66% was achieved. 28
41 The estimated subsistence harvest of halibut in 2010 for Kodiak road system area residents was 164,092 lb (net weight), lower than the 2009 estimate of 177,769 lb, the 2008 estimate of 177,334 lb, the 193,633 lb estimated for 2007, 205,822 lb estimated for 2006, 210,828 lb estimated for 2005, and 187,214 lb for 2004, but higher than the 153,254 lb estimated for 2003 (Table 11). In 2010, Kodiak subsistence fishers harvested an estimated 127,816 lb of halibut with setline gear (78%) and 36,275 lb (22%) with handoperated gear. This compares to 130,802 lb of halibut with setline gear (74%) and 46,966 lb (26%) with hand-operated gear in 2009; 128,226 lb (72%) harvested with setline gear and 49,108 lb (28%) with handoperated gear in 2008; 135,351 lb (70%) harvested with setline gear and 58,282 lb (30%) with handoperated gear in 2007; 142,326 lb (69%) harvested with setline gear and 63,496 lb (31%) with handoperated gear in 2006; 146,781 lb (70%) harvested with setline gear and 64,047 lb (30%) with handoperated gear in 2005; 131,719 lb (70%) harvested with setline gear and 55,605 lb (30%) with handoperated gear in 2004; and 101,575 lb taken in 2003 with setline gear (66%) and 51,678 lb (34%) with hand-operated gear. In addition, Kodiak road system SHARC holders harvested an estimated 47,646 lb (net weight) of halibut in 2010 they classified as sport caught, which was below the range of harvests in other years: 64,034 lb in 2009, 72,915 lb in 2008, 68,556 lb in 2007, 64,320 lb in 2006, 82,455 lb in 2005, 73,181 lb in 2004, and 68,170 lb in In total, Kodiak SHARC holders harvested 211,738 lb (net weight) of halibut in 2010; this is lower than all previous study years: 241,803 lb of halibut in 2009, 250,249 lb in 2008, 262,189 lb in 2007, 270,142 lb in 2006, 293,283 lb in 2005, 260,395 lb in 2004, and 221,424 lb in 2003 (Table 11). Not surprisingly, the totals for all 8 years of the SHARC survey are lower than those based on household surveys for previous years (except that the 2004, 2005, 2006, 2007, and 2008 SHARC survey estimates are higher than the household survey estimate for 1991) because, as noted, many Kodiak road system residents who fish for halibut likely do not obtain SHARCs and continue to harvest halibut under sport fishing rules. Overall, the subsistence harvest estimates for Kodiak appear reasonable, but they should be further evaluated using ADF&G Division of Sport Fish Statewide Harvest Survey data and with additional years of subsistence harvest survey data. Sand Point (Regulatory Area 3B) In 2000, the population of Sand Point was 952, with an Alaska Native population of 421 U. S. Census Bureau 2001). The population in 2010 was 976 with 417 Alaska Natives (Table 1; ADLWD 2011). The only estimate of halibut harvests for home use by Sand Point residents based on Division of Subsistence household surveys prior to 2003 is for 1992 (Fall et al. 1993), at 13,981 lb (net weight). Of this, 6,240 lb were removed from commercial harvests, 6,934 lb were taken with subsistence methods (setline or jigging with a hand-held line) and 807 lb were harvested with rod and reel. The total harvest with noncommercial methods was 7,741 lb. Of the 204 permanent households in the community, 122 harvested halibut for home use; 65 used subsistence methods, 16 fished with rod and reel, and the rest obtained halibut for home use from their commercial harvests. At the end of 2003, 73 residents of Sand Point had obtained SHARCs. The estimated subsistence halibut harvest for 2003 was 4,819 lb (net weight), based on the SHARC survey. Of this, 3,409 lb were harvested with setline gear and 1,410 lb with hand-operated gear. Twenty-one Sand Point residents reported that they subsistence fished for halibut in In addition, 11 Sand Point SHARC holders reported that they harvested an estimated 410 lb of halibut while sport fishing, for a total estimated noncommercial harvest of 5,229 lb of halibut (Table 11). These are lower harvests and levels of participation than might be expected, considering the 1992 survey findings. By December 31, 2004, 351 Sand Point residents had obtained SHARCs, a very substantial increase over 2003, when 73 obtained SHARCs. The estimated total subsistence halibut harvest was 11,355 lb (net weight). Of this total, 4,360 lb were harvested with setline gear (38%) and 6,996 lb (61%) with handoperated gear. In total, an estimated 109 Sand Point SHARC holders subsistence fished for halibut in 2004, about 5 times the estimate for Also, an estimated 50 Sand Point SHARC holders sport fished 29
42 for halibut, with an estimated total harvest of 1,384 lb. In total, 121 Sand Point SHARC holders fished for halibut noncommercially in 2004 and had a total estimated harvest of 12,739 lb (net weight; Table 11). This is more than double the 2003 estimate, and similar to the total community estimate for 1992 (which included halibut removed from commercial harvests). It is likely that the higher estimate for 2004 does not indicate an increased harvest by Sand Point residents over 2003, but rather a more complete estimate due to much larger of participants in the SHARC program. A total of 321 Sand Point residents held SHARCs in The estimated subsistence harvest of halibut increased to 21,901 lb, with 12,201 lb (56%) taken with setline gear and 9,700 lb (44%) caught with hand-operated gear. One-hundred Sand Point residents subsistence fished for halibut in In addition, 23 sport fished for halibut, adding 1,281 lb for a total noncommercial halibut harvest estimate of 23,182 lb (Table 11). The increase in the total halibut harvest, especially the increase in setline harvests, suggests that Sand Point residents were increasingly participating in the opportunities provided by the federal subsistence halibut fishery. In 2006, the of Sand Point residents with SHARCs increased to 365. The estimated of SHARC holders who subsistence fished for halibut also increased, to 133 from 100 in 2005 and 109 in The estimated of Sand Point SHARC holders subsistence fishing with setlines also increased notably to 59 in 2006, compared to 35 in 2005 and 25 in The fishing with handoperated gear rose slightly to 87 in 2006, from 77 in 2005 and 74 in The estimated subsistence halibut harvest by Sand Point residents in 2006 was 20,214, similar to the estimate for 2005 of 21,901. In 2006, 37% (7,406 lb) of the subsistence halibut were harvested with setline gear and 63% (12,809 lb) with hand-operated gear. In addition, an estimated 29 Sand Point SHARC holders sport fished for halibut in 2006, with an estimated harvest of 6,300 lb, up substantially from 1,281 lb of sport harvested halibut in 2005 and 1,384 lb in As a result of the higher estimated sport harvests of halibut by Sand Point SHARC holders in 2006, the total estimated noncommercial harvest of halibut increased to 26,514 lb from 23,182 lb in 2005 and 12,739 lb in 2004 (Table 11). Subsistence halibut fishing patterns in Sand Point in 2007 were generally similar to those of During any part of 2007, 364 Sand Point residents held SHARCs, and 138 used them to subsistence fish for halibut. Of these, 49 used setline gear and 113 used hand-operated gear. The total estimated subsistence halibut harvest in 2007 was 24,615 lb, up slightly from 2006 and the highest estimate for the 5 years of the project. The subsistence harvest was about evenly split between setline gear (13,278 lb; 54%) and hand-operated gear (11,337 lb; 46%). An estimated 16 Sand Point SHARC holders also went sport fishing for halibut and they harvested an estimated 3,034 lb. In total, the noncommercial halibut harvest at Sand Point in 2007 was 27,649 lb, with 138 people involved in this harvest (Table 11). The results of the SHARC survey for Sand Point for 2008 found subsistence halibut fishing patterns similar to those of 2006 and During 2008, 342 Sand Point residents held SHARCs, and 130 subsistence fished for halibut. Of these, 71 used setline gear and 88 used hand-operated gear. The total estimated subsistence halibut harvest in 2008 was 25,013 lb, up slightly from 2007 and the highest estimate for the 6 years of the project. Setline gear accounted for 15,766 lb (63%) and hand-operated gear added 9,247 lb (37%). An estimated 19 Sand Point SHARC holders also went sport fishing for halibut and they harvested an estimated 2,195 lb. In total, the noncommercial halibut harvest estimate at Sand Point in 2008 was 27,208 lb, with 132 people involved in this harvest (Table 11). The majority of SHARCs issued to Sand Point residents expired during 2008 and were not renewed. The of active SHARCs during 2009 was 137, down 60% from the 342 active SHARCs in Correspondingly, based on survey responses, estimates of participation in the subsistence halibut fishery in Sand Point in 2009 and estimated harvests were down substantially from During 2009, an estimated 70 Sand Point residents participated in the subsistence halibut fishery, compared to 130 in In 2009, 28 Sand Point fishers used setlines, compared to 71 in 2008, and 58 used hand-operated gear, compared to 58 in The estimated subsistence halibut harvest in 2009 was 11,759 lb, 30
43 approximately half the average annual harvest from ; setline gear accounted for 3,987 lb (34%) and hand-operated gear provided 7,772 lb (66%) in An estimated 19 Sand Point SHARC holders also went sport fishing for halibut in 2009 and they harvested an estimated 2,665 lb. In total, the noncommercial halibut harvest estimate at Sand Point in 2009 was 14,424 lb, with 70 people involved in this harvest; this harvest was 55% of the annual average of the previous 4 years (Table 11). The survey findings for Sand Point for 2010 illustrated the pattern first noted for 2009 of declining estimates of harvests and participation in the subsistence halibut fishery that may be the result of lowered rates of participation in the SHARC program. In 2010, the of active SHARCs in Sand Point dropped to 130, the lowest since An estimated 61 SHARC holders participated in the subsistence fishery, 22 with setlines and 50 with hand-operated gear, again the lowest s since The estimated subsistence harvest of 7,306 lb (3,408 [47%] with setlines, and 3,898 [53%] with hand-operated gear) was the lowest estimate since 2003, and less than a third of the peak harvest estimates of Sport harvests of 1,129 lb by 18 SHARC holders produced a total noncommercial halibut harvest for Sand Point of 8,435 lb, again lower than any year but Outreach in Sand Point is likely necessary to determine if subsistence halibut harvests have declined or whether the recent lower estimates are solely the result of decreased participation in the SHARC program. Unalaska Dutch Harbor (Regulatory Area 4A) The city of Unalaska (which includes Dutch Harbor) had a population of 4,283 in 2000, including 397 Alaska Natives (U. S. Census Bureau 2001). The population in 2010 was 4,376 with 355 Alaska Natives (Table 1; ADLWD 2011). The Division of Subsistence conducted a household harvest survey in Unalaska Dutch Harbor for the 1994 data year and estimated that the total halibut harvest was 97,601 lb (net weight; 3,049 fish; ±34%), excluding 10,606 lb (331 fish) removed from commercial catches for home use. Of the 700 households in the community, an estimated 391 (56%) had at least one member who fished for halibut in Most of the noncommercial harvest, 88,142 lb (90%), was taken with rod and reel (CSIS). By the close of 2003, only 92 residents of Unalaska and Dutch Harbor had obtained SHARCs (Table 11). Notably, only 14 members of the Qawalangin Tribe of Unalaska obtained SHARCs in For the community overall as well as for the tribe, this was far fewer registrants than might have been predicted from the 1994 survey results. By the end of 2004, 131 Unalaska Dutch Harbor residents had obtained SHARCs, as had 25 Qawalangin Tribe members. In 2005, 150 community members held SHARCs, as did 31 Qawalangin Tribe members. While a notable increase over 2003, this total continued to be lower than expected. The total increased to 171 SHARC holders in 2006, including 43 Qawalangin Tribe members. During 2007, 176 Unalaska Dutch Harbor residents held SHARCs, including 46 Qawalangin Tribe members. In 2008, 173 Unalaska Dutch Harbor residents held SHARCs, as did 43 Qawalangin Tribe members. In 2009, 164 community residents held SHARCs, as did 37 Qawalangin Tribe members. In 2010, the Unalaska Dutch Harbor total was 155 SHARC holders; Qawalangin tribal members held 36 SHARCs in In 2010, an estimated 92 Unalaska Dutch Harbor SHARC holders participated in the subsistence halibut fishery, an estimated 54 sport fished, and an estimated 103 participated in either fishery. In comparison, in 2009, an estimated 76 Unalaska Dutch Harbor SHARC holders participated in the subsistence halibut fishery, an estimated 45 sport fished, and an estimated 98 participated in either fishery. In 2008, an estimated 87 Unalaska Dutch Harbor SHARC holders participated in the subsistence halibut fishery, an estimated 43 sport fished, and an estimated 101 participated in either fishery. In 2007, 83 Unalaska Dutch Harbor SHARC holders participated in the subsistence halibut fishery, 33 sport fished, and 92 participated in either fishery. In 2006, 81 Unalaska Dutch Harbor SHARC holders participated in the subsistence halibut fishery, 50 sport fished, and 101 participated in either fishery. In 2005, 88 SHARC holders participated in the subsistence halibut fishery and 28 sport fished; 97 participated in either fishery. In 2004, 81 SHARC holders subsistence fished for halibut and 34 sport fished; 93 participated in either 31
44 fishery. In 2003, 50 Unalaska Dutch Harbor SHARC holders subsistence fished for halibut, 33 sport fished, and 70 fished in either fishery (Table 11). In 2010, SHARC holders in Unalaska Dutch Harbor harvested an estimated 13,081 lb of halibut in the subsistence fishery. Of this, 7,417 lb was harvested with set lines (57%) and 5,663 lb (43%) with handoperated gear. Additionally, they harvested 2,730 lb of halibut in the sport fishery, for a total noncommercial harvest of 15,811 lb (Table 11). The 2010 harvest was down substantially (49%) from 2009, when SHARC holders in Unalaska Dutch Harbor harvested an estimated 29,306 lb of halibut in the subsistence fishery (19,204 lb with setlines [66%] and 10,102 lb with hand-operated gear [34%]). In 2009, there was an additional 1,861 lb of halibut harvested in the sport fishery, for a total noncommercial harvest of 31,167 lb (Table 11). The 2009 estimated halibut harvests by Unalaska Dutch Harbor SHARC holders increased substantially from the first 6 years of the project, while the 2010 estimate was lower than all but one prior year. For example, in 2008, SHARC holders in Unalaska Dutch Harbor harvested an estimated 13,710 lb of halibut in the subsistence fishery. Of this, 7,293 lb was harvested with setlines (53%) and 6,417 lb with hand-operated gear (47%). Additionally, they harvested 2,962 lb of halibut in the sport fishery, for a total noncommercial harvest of 16,672 lb. In 2007, the estimated subsistence halibut harvest was 13,250 lb, 9,012 lb (68%) with setline gear and 4,238 lb (32%) with hand-operated gear. The estimated sport harvest was 2,287 lb, for a total noncommercial harvest of 15,537 lb. In 2006, the estimated subsistence halibut harvest was 16,331 lb, 7,526 lb (46%) with setline gear and 8,805 lb (54%) with hand-operated gear. The estimated sport harvest was 3,768 lb for a total noncommercial harvest of 20,100 lb. In 2005, the estimated subsistence harvest was 18,108 lb (net weight), with most (9,573 lb; 53%) taken with setline gear and the balance with hand-operated gear. In addition, in 2005 Unalaska Dutch Harbor SHARC holders harvested 2,439 lb of halibut while sport fishing, for a total noncommercial halibut harvest of 20,547 lb. In 2004, the estimated subsistence harvest was 15,530 lb (net weight), with most (9,557 lb; 62%) taken with setline gear and the balance with hand-operated gear. In addition, Unalaska Dutch Harbor SHARC holders harvested 2,165 lb of halibut while sport fishing in 2004, for a total noncommercial halibut harvest of 17,695 lb. The estimated subsistence harvest for 2003 was 10,860 lb (net weight), and there was an additional 5,519 lb of halibut harvested while sport fishing, for a total noncommercial harvest of 16,379 lb. The 2009 noncommercial halibut harvest by Unalaska Dutch Harbor SHARC holders, by far the highest for the 8 study years, represents just 32% of the harvest estimate for Similarly, the 2010 estimate was 16%, the 2008 total halibut harvest was 17%, the 2007 total halibut harvest was 16%, the 2006 total halibut harvest was 21%, the 2005 total halibut harvest was 21%, the 2004 total halibut harvest was 18%, and the 2003 estimate was 17% of the 1994 estimate. There are at least 5 explanations for these differences. First, actual noncommercial halibut harvests in Unalaska may have declined since 1994, although a decline of this magnitude is probably unlikely. Second, if many fishers did not obtain a SHARC, the SHARC survey may have underestimated the subsistence halibut harvest. A third explanation is that the 1994 survey may have overestimated the halibut harvest. A fourth explanation is that many halibut fishers in Unalaska may prefer to harvest halibut under sport fishing regulations and therefore do not obtain SHARCs. A fifth possibility that may account for a decline in subsistence halibut harvests is a decline in stock abundance. The IPHC has noted a decline in abundance in Area 4A since 1994 (Gregg Williams, IPHC, personal communication, 2005). A combination of all 5 factors could be responsible for the unexpectedly low subsistence halibut harvest estimated for Unalaska from the SHARC surveys in all 8 study years. Further outreach in Unalaska is clearly appropriate, as well as additional research to better understand patterns of halibut fishing in the community. Toksook Bay (Regulatory Area 4E) Toksook Bay had a population of 532 in 2000 and 590 in 2010 (Table 1; U. S. Census Bureau 2001; ADLWD 2011). As discussed in Chapter 1, the of valid SHARCs held by Toksook Bay residents dropped from 533 (approximating the community s total population) in 2007 to 34 in 2008, 33 in 2009, and 32 in Very few SHARCs that had been obtained in 2003 and that expired at the close of
45 were renewed. The Division of Subsistence has not conducted a household harvest survey in this community. Wolfe (2002) estimated a subsistence halibut harvest of 12,600 lb (net weight, 16,800 lb round weight) for this community for 2000, based upon a 1986 per capita estimate for the neighboring community of Tununak. During SHARC project years from , Division of Subsistence staff, with the assistance of the Toksook Bay tribal government, evaluated the list of SHARC holders in the community, estimated the total of subsistence halibut fishers, and conducted interviews with likely fishers. Based on the results of this collaboration with the tribal government, it is highly likely that most community residents who subsistence fished for halibut in provided harvest data through the SHARC survey. Therefore, harvest estimates for Toksook Bay for represent the harvests reported by respondents to the survey, and are not expanded to the total of SHARC holders in the community. In , however, no outreach or interviewing occurred in Toksook Bay. Of 34 SHARC holders in 2008, 11 (32%) responded to the mailed survey, as did 13 (39%) of 33 in 2009 and 12 (38%) of 32 in Unlike , survey data were expanded to estimate 2008, 2009, and 2010 halibut harvests in Toksook Bay. The estimated harvest for Toksook Bay for 2003 was 24,500 lb (net weight) by 54 fishers (Table 11). Project staff consider this a reliable subsistence harvest estimate for the community. It should be noted that Toksook Bay is a member of the Coastal Villages Regional Fund (CVRF) CDQ organization 23. The majority of the 5,034 lb of U32 (under 32 inches in length) halibut retained for home use by members of this CDQ organization in 2003 was landed at Toksook Bay and Mekoryuk (Williams 2004:59 60). For 2004, 56 Toksook Bay SHARC holders reported a harvest of 6,596 lb of halibut, with most of this (5,737 lb) harvested with hand-operated gear (Table 11). This suggests a substantial decline in subsistence halibut harvests compared to As in 2003, a majority (69% of 7,120 lb [net weight]) of the U32 halibut retained for home use by the CVRF was landed at Toksook Bay and Mekoryuk (Williams 2005), but this cannot account for the decline in subsistence harvests. In 2005, subsistence harvests by Toksook Bay SHARC holders rebounded to 14,870 lb; adding the 98 lb of SHARC holder s sport caught halibut produces a community total of 14,968 lb (Table 11). Almost all (14,269 lb; 96%) of the subsistence harvest was taken with hand-operated gear. Sixty-one Toksook Bay residents participated in the SHARC subsistence halibut fishery in The estimated subsistence halibut harvest by Toksook Bay SHARC holders increased substantially in 2006, to 36,481 lb, all harvested with subsistence gear and most (34,149 lb; 94%) caught with handoperated gear (Table 11). In 2006, the estimated of participants in the SHARC subsistence fishery also increased, to 113 SHARC holders; the previous highest estimate was 61 subsistence halibut fishers in During interviews in the community in April 2007, SHARC fishers in Toksook Bay reported that subsistence fishing had been very productive in 2006; halibut were abundant and there was a corresponding increase in subsistence fishing effort. This may account for the large increase in the estimated harvest in Also, in 2006, over 67% of the 19,710 lb of U32 halibut retained for home use in the CVRF CDQ fishery were landed at Toksook Bay and Mekoryuk (Williams 2007). Division staff conducting interviews with SHARC holders in Toksook Bay reminded respondents to exclude CDQ U32 halibut in their subsistence estimates for the SHARC survey. In 2007, the estimated subsistence harvest in Toksook Bay dropped to 7,921 lb (from 36,481 lb in 2006), with most of this harvest (6,469 lb; 82%) taken with hand-operated gear. The estimated of participants in the subsistence fishery was 112, with most of these (100; 89%) using hand-operated gear. Also in 2007, 59% of the 11,398 lb of U32 halibut retained from home use during the Coastal Villages Regional Fund CDQ fishery were landed at Toksook Bay and Mekoryuk (Williams 2008). When conducting interviews in Toksook Bay in early 2008 about 2007 subsistence halibut harvests, Division of 23 See footnote 8 for more information about the CDQ program. 33
46 Subsistence staff encountered several subsistence fishers who did not hold SHARCs. Therefore, the 2007 estimate based on the SHARC list likely underestimates the community s total by an unknown amount. As noted above, the of valid SHARCs for Toksook Bay dropped to 34 in Based on the SHARC survey returns (11 of 34; 32%), it is likely that many active halibut fishers in the community did not renew their SHARCs and therefore were not part of the SHARC survey, resulting in underestimates of participation in the fishery and in estimated harvests. For example, based on the survey results, 9 Toksook Bay residents participated in the subsistence halibut fishery in 2008, compared to an average of 73 for the previous 5 years (range 44 to 112; Table 11). The estimated harvest was 2,143 lb in 2008, while the previous 5-year average was 18,074 lb (range 6,596 to 36,481 lb). Results for 2009 were similar to those of Only 33 SHARCs were active in Toksook Bay, again suggesting that many subsistence fishers are not participating in the program. Based on surveys (13 of 33; 39%), the estimated subsistence halibut harvest was 1,055 lb, with 789 lb (75%) taken with hand-operated gear. This harvest was less than one-half of that of 2008 and just 6% of the annual average from The estimated of subsistence halibut fishers in Toksook Bay in 2009 was 10, compared to 112 in 2007 and an average of 79 from Results for 2010 continued trends observed for 2008 and Only 32 SHARCs were active in Toksook Bay, again suggesting that many subsistence fishers are not participating in the program. Based on surveys (12 of 32; 38%), the estimated subsistence halibut harvest was 875 lb, with 560 lb (64%) taken with hand-operated gear. This harvest was less than one-half of that of 2008 and just 5% of the annual average from The estimated of subsistence halibut fishers in Toksook Bay in 2010 was 10, compared to 112 in 2007 and an average of 79 from In 2010, Toksook Bay obtained 35% of the U32 halibut retained by the Coastal Villages Regional Fund CDQ catch, about 1,373 lb (Williams 2011:64). Without renewed registrations in the SHARC program and outreach in the community, it is unlikely that the mail survey alone will provide reliable harvest estimates for the subsistence halibut fishery in Toksook Bay in the future. Tununak (Regulatory Area 4E) Tununak had a population of 325 in 2000, 315 of whom were Alaska Native (U. S. Census Bureau 2001). The population for 2010 was 327, with 314 Alaska Natives (Table 1; ADLWD 2011). The Division of Subsistence conducted a comprehensive household harvest survey in Tununak in 1986, which provides the only estimate of subsistence halibut harvests for the community prior to the adoption of the 2003 subsistence regulations. The harvest estimate for 1986 was 1,532 fish and 30,643 lb (net [dressed] weight), with a 95% confidence limit of ±26%. The harvest per capita was 93 lb (net weight; CSIS). No residents of Tununak obtained SHARCs in 2003, 24 and the Traditional Elders Council in Tununak did not approve Division of Subsistence plans to conduct interviews with potential subsistence halibut fishers for Therefore, there is no subsistence halibut harvest estimate for this community for By the close of 2004, however, 70 residents of Tununak had obtained SHARCs (Table 11). Because only 9 SHARC holders responded to the postal survey (13%), harvest estimates for Tununak for 2004 are based on a very low sample achievement. The estimated total subsistence halibut harvest was 1,954 lb (net weight) by 31 fishers, 878 lb harvested with setline gear and 1,076 lb with hand-operated gear. No Tununak SHARC holders reported sport fishing activity. The tribal government supported Division of Subsistence interviewing of subsistence halibut fishers in Tununak for the 2005 project year (Fall et al. 2006:5). Thirty-three of 70 SHARC holders were interviewed (47%). As in Toksook Bay, reported harvests were not expanded for Tununak for the One tribal member obtained a SHARC, but this person was not a resident of Tununak. 34
47 project year because most known halibut fishers were interviewed. The total subsistence harvest of halibut was 2,661 lb by 20 fishers. Most of the harvest (88%) was taken with hand-operated gear. There were no sport harvests of halibut reported in Tununak in In 2006, 70 Tununak residents held SHARCs. No interviewing took place in the community, but division staff did attempt to contact SHARC holders by telephone. Sample achievement was low (10 of 70 SHARC holders; 14%). Based on this limited sample, the estimated subsistence halibut harvest at Tununak in 2006 was 4,032 lb by 33 subsistence fishers. Almost all of this harvest (3,808 lb; 94%) was with hand-operated gear. In 2007, 69 Tununak residents held SHARCs for a part of the year. With the support of a short-term contract with the division, staff of the Tununak IRA council conducted interviews in their community in order to supplement SHARC survey data. The estimated subsistence harvest in Tununak in 2007 was 7,015 lb by 38 fishers. Most of this harvest (5,479 lb; 78%) was taken with hand-operated gear. In 2008, 68 Tununak residents held SHARCs. No outreach or supplemental interviewing took place in the community in The response rate to the mailed survey was 10% (7 of 68 SHARC holders). harvested based on this sample were by far the lowest of any project year for which data are available: 2,143 lb, all with hand-operated gear by an estimated 8 fishers. This is almost certainly a large underestimation of the subsistence harvest of halibut in Tununak in Few of the SHARCs active in 2008 in Tununak were renewed and only 11 were active in 2009; 6 (55%) responded to the survey. An estimated 7 subsistence fishers harvested 488 lb of halibut in 2009, all with hand-operated gear. Due to the very limited participation in the SHARC program and based on results from , it is highly likely that a reliable estimate of subsistence halibut harvests in Tununak was not obtained for As in 2009, only 11 SHARCs were active in Tununak in 2010; 3 (27%) responded to the survey. An estimated 9 subsistence fishers harvested 576 lb of halibut in 2010, all with hand-operated gear. Due to the very limited participation in the SHARC program and based on results from , it is highly likely that, as for 2009, a reliable estimate of subsistence halibut harvests in Tununak was not obtained for Also, compared to the results of the 1986 survey, the harvest estimates for Tununak for 2004 through 2007 appear low. The reasons for this difference are uncertain. As just noted, the low response to the mailed SHARC survey plus a lack of outreach or follow-up interviews likely resulted in a large underestimation of the 2008, 2009, and 2010 harvests. Several additional years of harvest data collection plus renewed outreach and community support will be necessary to adequately document subsistence halibut harvest trends in this community. COMPARISONS WITH NONSUBSISTENCE HARVESTS IN 2010 As reported in Table 18, the preliminary estimated total halibut removal in Alaskan waters in 2010 was 63,773,077 lb (net weight) based on data compiled by the IPHC (IPHC and Geiger 2011) Williams 2009and this project. In this total, the removal of 9,517 lb of U32 (under 32 inches in length) halibut for personal use by CDQ organizations in Areas 4D and 4E has been added to the subsistence harvest category. Commercial harvests accounted for 66.8% of halibut removals in Alaska in 2010 (Figure 33). Bycatch mortality of halibut in various other commercial fisheries ranked second, with 15.4% of the statewide removals. Sport harvests ranked third, with 12.1%. Wastage in the commercial halibut fishery added 4.5% to the total halibut removals. Finally, the subsistence fishery accounted for 1.3% of the total removals of halibut in Alaska waters in Halibut harvests by fishery in 2010 at the regulatory area level did not differ substantially from the statewide pattern (Table 18, Figure 34). In all regulatory areas, commercial harvests accounted for 56% or more of the total pounds net weight of halibut removals. In Area 2C (Southeast Alaska) and Area 3A 35
48 (Southcentral Alaska), sport fisheries took 31.6% and 16.9%, respectively, of the halibut harvest in 2010; however, sport fisheries were just 0.3% of the total harvest in Area 3B (compared to 0.2% for the subsistence harvest) and about the same as subsistence harvests in Area 4. Commercial bycatch accounted for 41.6% of halibut removals in Area 4. As a percentage of the total removal, subsistence halibut harvests were largest in Area 2C at 5.3% of the total (although they were less than 17% of the sport harvest and about 9% of the commercial harvest) and in Area 3A at 1.0%. 36
49 CHAPTER 4: CONCLUSIONS AND RECOMMENDATIONS SUMMARY AND CONCLUSIONS New federal regulations governing subsistence halibut fishing in Alaska went into effect in May The 2010 calendar year was the eighth for which a program was implemented to estimate the subsistence harvest of halibut under these regulations. By several measures, the program is a success. Of 10,953 SHARC holders, 6,670 (61%) voluntarily provided information about their subsistence halibut fishing activities in 2010 by responding to the survey. This compares to a response rate of 59% (6,944 respondents of 11,733 SHARC holders) for the 2009 project year; 63% (7,316 respondents of 11,565 SHARC holders) for the 2008 project year; 58% (8,682 respondents of 15,047 SHARC holders) for the 2007 project year; 59% (8,426 respondents of 14,206 SHARC holders) for the 2006 project year; 60% for the 2005 project year (8,565 respondents of 14,306 SHARC holders); 62% for the 2004 project year (8,524 respondents of 13,813 SHARC holders); and 65% for the 2003 project year (7,593 respondents of 11,625 SHARC holders). In 2010, the of valid SHARCs (10,953) was lower than 2009 (11,733) and 2008 (11,565), and 17% lower than the 7-year average from (Table 19). Nonrenewed SHARCs probably account for most of this decline. The largest portion of this decline in the of SHARC holders was in the tribal segment: 3,906 SHARCs in 2010 compared to 7,446 in 2007, a decline of 48%. Tribal SHARCs are valid for 4 years, so those issued in 2003, the first year of the new fishery, expired in In comparison, the of nontribal SHARC holders dropped 5% from 2007 (7,601 SHARCs) to 2008 (7,249 SHARCs), increased to 7,724 in 2009, and decreased to 7,047 in Nontribal SHARCs are valid for 2 years, so there have been several rounds of expirations and renewals since 2003, in contrast to the tribal SHARC group. The next section of the report discusses an analysis of SHARC expiration and renewal patterns and identifies some implications of these patterns for future harvest estimates. Based on the survey returns, an estimated 4,991 individuals participated in the Alaska subsistence halibut fishery in This is a decrease of 6% from the estimated 5,296 SHARC holders who subsistence fished for halibut in Alaska in 2009, and is 10% lower than the 7-year average from The estimated subsistence harvest of halibut in Alaska in 2010 is 43,332 fish and 797,560 lb (±3%). In comparison, the 2009 estimated subsistence halibut harvest was 45,434 fish and 861,359 lb (±4%); the 2008 estimated subsistence halibut harvest was 48,604 fish and 886,988 lb (net weight; ±3.0%); the 2007 estimated subsistence halibut harvest was 53,697 fish and 1,032,293 lb (±4.1%); the 2006 estimated subsistence halibut harvest was 54,089 fish and 1,125,312 lb (±2.9%); the 2005 estimated subsistence halibut harvest was 55,875 fish and 1,178,222 lb (net weight; ±3.0%); the 2004 estimated subsistence harvest was 52,412 halibut and 1,193,162 net pounds (±1.5%), and 43,926 halibut for 1,041,330 lb (±4%) were harvested in the subsistence fishery in As measured in pounds, the 2010 subsistence halibut harvest was about 7% lower than the harvest in 2009 and 24% lower than the 7-year average from (Table 19). The total estimated harvests for are below the 1.5 million net pounds estimated for the Alaska subsistence halibut harvest when the current regulations were developed by the North Pacific Fishery Management Council (see page 16748; NPFMC 2003). The larger estimated harvest in 2004 compared to 2003 most likely corresponded to the greater of individuals who held SHARCs through December 2004 and a proportional increase in the of individuals who subsistence fished for halibut. The leveling off and slight decline in the harvests in 2006 and 2005, compared to 2004, are consistent with the leveling-off of the of individuals who held SHARCs for at least a portion of these years. However, harvests as estimated in pounds dropped in 2007 despite an increase in individuals who held a SHARC for at least part of the year. In 2008, estimated harvests dropped by 14% and the of SHARC holders dropped by 23%; in 2009, the of SHARC holders rose slightly (1.5%) while the harvest dropped by 0.1%; in 2020 both the of SHARC holders and the harvest dropped by about 7% compared to the previous year. Average harvests per fisher were about the same in 2010 (8.7 halibut per fisher for 160 lb) as 2009 (8.6 halibut per fisher for 163 lb), but down compared to 2008 (9.2 halibut per fisher for 167 lb), 37
50 2007 (9.1 halibut per fisher for 174 lb), and 2006 (9.2 halibut per fisher for 190 lb). Of the 7 previous project years, average harvests were highest in 2005 (9.9 halibut per fisher for 210 lb). In the first 2 years of the project, averages were 8.8 halibut per fisher for 199 lb in 2004 and 8.9 halibut per fisher for 211 lb in Of the 8 project years, the average weight of subsistence halibut declined from 23.7 lb in 2003 to 18.2 lb in 2008 (a decline of 23%), rose slightly to 19.0 lb in 2009, and dropped slightly to 18.4 lb per fish in 2010 (Table 19). The average weight of a subsistence-caught halibut dropped 11% from 2003 to After 8 years of the harvest assessment program, it appears likely that the overall larger statewide harvest estimates in 2004, 2005, and 2006, compared to 2003, were, at least in part, a consequence of increased participation of subsistence fishers in the SHARC program after 2003 and, perhaps, an increase in trust on the part of subsistence fishers in the survey. The lower harvest estimates for 2008, 2009, and 2010 may in part be a consequence of reduced participation in the SHARC program, especially among eligible tribal members. As the community case studies demonstrate, however, a of factors appear to have caused the differences in harvest estimates over the 8 project years, and these differ by community. Some were methodological (St. Paul, for example), while other factors were probably linked to more thorough and accurate documentation of harvests (Cordova and Sand Point, for example) rather than a true increase. On the other hand, decreases in subsistence halibut harvests in Area 2C appear to reflect declining success in harvests, with declines in Sitka (down 53% from 2003 to 2010) particularly notable. In 2010, most subsistence halibut were harvested with setline (stationary) gear (77%) and the rest with hand-operated gear (23%). Similarly, in 2009, most subsistence halibut were harvested with setline gear (72%) and the rest with hand-operated gear (28%); in 2008, 74% of the subsistence halibut were taken with setline gear; in 2007, 69% of the subsistence halibut were taken with setline gear; in 2006, 70% of the subsistence halibut were taken with setline gear; in 2005, 70% of the subsistence halibut were harvested with setline gear; in 2004, 74% of the subsistence halibut were harvested with setline gear; and in 2003, setlines accounted for 72% of the harvest. The largest portion of the Alaska subsistence halibut harvest in 2010 occurred in Regulatory Area 2C (Southeast Alaska), at 53% (424,818 lb), followed by Area 3A (Southcentral Alaska) at 39% (312,650 lb), Area 3B (Alaska Peninsula) at 3% (23,009 lb), Area 4A (Eastern Aleutian Islands) at 2% (14,548 lb), Area 4C (Pribilof Islands) 1% (10,859 lb), Area 4E (East Bering Sea Coast) at 1% (10,055 lb), Area 4D (Central Bering Sea) at less than 1% (1,171 lb), and Area 4B (Western Aleutian Islands) at less than 1% (450 lb). In , Area 2C (Southeast Alaska) and Area 3A (Southcentral Alaska) also accounted for most of the subsistence harvests. The proportion of the statewide subsistence halibut harvest occurring in Area 2C (Southeast Alaska) has declined from 60% in 2003 and 57% in 2004 to 51% in 2005, 52% in 2006, 51% in 2007, 52% in 2008, 53% in 2009, and 53% in Correspondingly, the portion occurring in Area 3A (Southcentral Alaska) increased from 27% in 2003 to 34% in 2004, 36% in 2005, 34% in 2006, 36% in 2007, 38% in 2008, 38% in 2009, and 39% in Subsistence harvests accounted for 1.3% of the total halibut removals in Alaska waters in 2010, compared to 1.2% in 2009, 1.3% in 2008, 1.4% in 2007, 1.5% in 2006, 1.5% in 2005, 1.5 % in 2004, and 1.3% in Subsistence halibut fishers had an estimated incidental harvest of 12,851 rockfish in This is a decrease of 4% from the estimate of 13,315 rockfish for 2009 and a decrease of 15% from the 7-year average from (Table 19). There were 1,322 SHARC holders who harvested rockfish while subsistence halibut fishing in 2010, compared to 1,427 in 2009, 1,404 in 2008, 1,568 in 2007, 1,529 in 2006, 1,544 in 2005, 1,616 in 2004, and 1,239 in Most of the incidental rockfish harvests in 2010 occurred in Area 2C (60%), as they had in 2009 (67%), 2008 (70%), 2007 (68%), 2006 (68%), 2005 (63%), 2004 (68%), and 2003 (67%). In 2010, subsistence halibut fishers harvested an estimated 2,864 lingcod in the subsistence halibut fishery. This is a decrease of 16% from the estimate of 3,390 lingcod harvested in the subsistence halibut fishery in 2009, and a decrease of 16% from the 7-year average from In total, 732 SHARC holders harvested lingcod while subsistence halibut fishing in This is 19% lower than the
51 SHARC holders who had an incidental harvest of lingcod in 2009, and 17% lower than the 7-year average from (Table 19). As with rockfish, most of the incidental lingcod harvests took place in Area 2C in 2010 (63%), 2009 (60%), 2008 (71%), 2007 (66%), 2006 (59%), 2005 (56%), 2004 (56%) and 2003 (51%). As discussed above, although comparisons of the harvest estimates with those from previous research by the Division of Subsistence are complicated by different research methods, such comparisons may still be instructive. Subsistence harvest estimates for most of the larger communities (combining tribal and rural SHARC holders) such as Sitka, Petersburg, and Kodiak for are within the range of earlier estimates based on household surveys. This is significant in that these communities account for a very large percentage of the total harvest. We conclude that the 8 years of the survey of SHARC holders produced sound estimates of subsistence harvests of halibut in Alaska based on a scientific sample and a relatively high response rate. The estimates can be further evaluated as additional years of harvest data are collected. Continued documentation of the subsistence harvests is also necessary for any meaningful discussion of long-term trends in the fishery. SHARC EXPIRATION AND RENEWAL PATTERNS, Since the current federal subsistence halibut regulations came into effect in 2003 through 2009, 19,603 individuals had obtained SHARCs. SHARCs must be renewed periodically: rural SHARCs every 2 years and tribal SHARCs every 4 years. Continuing participation in the SHARC program by subsistence halibut fishers is essential for achieving reliable harvest estimates. Of the 19,603 SHARC holders, 7,870 (40.1%) did not renew their SHARCs, including 49.7% of tribal SHARC holders and 33.6% of rural SHARC holders. The remaining 11,733 SHARCs were active in 2009 (59.9% of all SHARCs issued), either being renewed one or more times or not yet being subject to renewal. This includes 4,009 tribal SHARCs (50.3% of all Tribal SHARCs that have been issued) and 7,724 rural SHARCs (66.4%; Figure 35). SHARC holders who did not renew their SHARCs were more likely than currently (in 2009) active SHARC holders to have never responded to the harvest survey or to never have participated in the subsistence halibut fishery (Table 20, Figure 36). Of all SHARC holders, 27% of nonrenewals had never responded to the survey, compared to 15% of currently active SHARC holders. Additionally, 33% of expired SHARCs had not been fished; 13% of active SHARC holders have not fished. This pattern exists within each SHARC type as well. Of tribal SHARC holders, 29% who did not renew their SHARC never responded to the survey, compared to 19% of currently active tribal SHARC holders. Also, 41% of expired tribal SHARCs never were fished, compared to 21% of active tribal SHARCs. Of all rural SHARC holders whose SHARCs expired, 25% never responded to the survey and 25% did not fish. Of active rural SHARCs, 12% have not responded to the survey and 8% have never fished. This finding suggests that over time, the set of active SHARC holders has become more likely to include individuals who will respond to the survey and participate in the subsistence halibut fishery. The trend is more pronounced for tribal SHARC holders, most likely because, as discussed above, this group initially included a large percentage young tribal members and elders who did not actively participate in the fishery. However, 40% of expired SHARCs were held by individuals who had participated in the subsistence halibut fishery, including 30% of expired tribal SHARCs and 50% of expired rural SHARCs (Figure 36). Of all SHARC holders that reported some subsistence fishing activity, 27% did not renew their SHARC, including 33% of tribal SHARC holders who fished and 24% of rural SHARC holders who fished (Figure 25 The following analysis is based on data available through the 2009 study year and has not been updated for this report. However, the patterns and trends described for likely continued through the 2010 study year, thus we have retained this section in this current report. 39
52 35). The reasons why subsistence halibut fishers did not renew their SHARCs are unknown. If a substantial of these individuals have continued to participate in the subsistence halibut fishery without renewing their SHARC, an underestimate of future subsistence halibut harvests may result. There were 22 tribes with 13 or more individuals who obtained SHARCs from 2003 through 2009 that had SHARC renewal rates of less than 50%. In total, 2,590 members of these tribes obtained SHARCs, 33% of all tribal SHARC holders, and 1,933 of these SHARCs (75%) were not renewed, 49% of all nonrenewed tribal SHARCs. Of the 963 members of these tribes who held SHARCs and participated in the subsistence halibut fishery, 62% did not renew their SHARCs. Nonrenewal rates for subsistence fishers among this group of tribes ranged from 25% to 100%. This finding suggests a trend in at least some tribes of subsistence fishers dropping out of the SHARC program, which may result in an underestimate of the subsistence halibut harvest in the future. In summary, this analysis of renewal patterns for SHARC holders from 2003 through 2009 suggests 2 trends that may have opposite effects on subsistence halibut harvest estimates. First, it appears that individuals who did not respond to the survey or did not participate in the fishery were less likely than those who fished to renew their SHARCs. Thus nonfishers may have been overrepresented in the first several years of the harvest survey, and been over-represented in the nonrespondent group. If so, harvests for the early years of the program may have been overestimated. Second, it appears that a notable portion of subsistence fishers have not renewed their SHARCs. If so, future estimates of subsistence halibut harvests will be too low, because they are based solely on responses to the survey that is mailed to SHARC holders. RECOMMENDATIONS We conclude this report with the following recommendations based on experiences during the 8 years of this project. These suggestions are similar to those that were offered at the conclusion of the earlier years reports (Fall et al. 2004:30 31; Fall et al. 2005:34 36; Fall et al. 2006:37 38; Fall et al. 2007:39 40; Fall and Koster 2008:39 40; Fall and Koster 2010:35 36; Fall and Koster 2011:36 38). 1. The harvest assessment program for the Alaska subsistence halibut fishery should continue. 26 The 8-year effort just completed developed a time series for assessment of harvest trends in the future. As discussed above, the methods used for (a short postal survey with at least one follow-up mailing, supplemented by community outreach, interviewing in selected communities, and partnerships with tribal governments), were successful and should be retained to facilitate comparisons across project years. It should be noted, however, that due to reduced funding and rising costs, in 2009 and 2010 only 2 survey mailings took place and supplemental surveys occurred only in a few Area 2C communities. Such reductions may result in lower response rates in the future. A recommendation in the final report for the third year of the program was that implementation of a program to collect harvest data in season in selected communities should be considered on a trial basis to help supplement and evaluate the data collected through the postal survey (Fall et al. 2006:37). The Division of Subsistence conducted an inseason harvest monitoring project for the subsistence halibut fishery in Sitka and Kodiak in 2006 with funding provided by NMFS. Findings were presented in Fall et al. (2009). Consideration should be given in the future to inseason monitoring programs in other communities as a method to compare harvest estimates with those from the mailed surveys. 2. As noted in Chapter 1, most likely due to expirations and nonrenewals, total valid SHARCs declined from 15,047 in 2007 to 11,565 in 2008, 11,733 in 2009, and 10,953 in 2010, with 26 Through a new grant, award NA11NMF , the Division of Subsistence received funding in 2011 from NOAA to conduct a ninth year of surveys to document subsistence harvests that occurred in A modest increase in the budget will allow restoration of the third round of survey mailings and enhanced outreach activities. 40
53 most of this decline occurring in the tribal segment of SHARC holders (7,446 in 2007, 4,316 in 2008, 4,009 in 2009, 3,906 in 2010). Such changes in the registration of potential subsistence halibut fishers has implications for future harvest estimates and are another reason why monitoring of the harvests should continue. 3. Additionally, analysis suggests that a significant of subsistence halibut fishers may not have renewed their SHARCs. This finding suggests that additional outreach among eligible tribes and rural areas is necessary to maximize enrollment of fishers in the SHARC program. 4. Specifically, additional or renewed outreach is needed in several communities outside of Area 2C (the only area where outreach took place in the last 2 study years), including Unalaska Dutch Harbor, Atka, Tununak, Toksook Bay, St. Paul, Sand Point, and Savoonga, based on relatively low response rates or unexpectedly low s of SHARCs issued, especially if more reliable harvest estimates are desired in areas 3B and 4, and given reduced funds to conduct the project. Contracts with tribal governments or local hiring in communities of Area 2C, such as Sitka, Angoon, Hydaburg, and Ketchikan, should be continued in future harvest monitoring efforts in those communities. 5. Given the drop in SHARC registrations, community outreach is also necessary in Area 4E (East Bering Sea Coast) if reliable harvest estimates are to be produced. There are many communities in this very large geographic area but, compared to areas 2C and 3A, relatively few SHARCs have been issued and a smaller percentage of the statewide subsistence halibut harvest occurs in Area 4E. Through the 2007 project year, the focus of outreach in Area 4E was on those communities that are known to have relatively large traditional harvests of halibut. Harvests in many other communities in this area are likely to be small. However, due to funding cuts, no outreach or supplemental surveys took place in any Area 4E community for 2009 or Although a major outreach effort that would include most of communities of 4E would be expensive and probably unnecessary, communications with tribal governments could result in more enrollments in the SHARC program and more confidence in the survey results. 6. If rockfish or lingcod incidental harvests in the halibut subsistence fishery continue to be of interest to managers in some areas, more specific data collection tools need to be developed to collect rockfish harvest data at the species level in particular communities. This should be done only in selected areas of concern given the additional costs to data collection and analysis that this will entail (see Wolfe 2002 for more discussion of collection of rockfish harvest data through the SHARC survey). Such research should occur only through partnerships with local communities and tribes, and should include a combination of participant observation, key respondent interviewing, and survey methods. A model is the study of subsistence harvests of rockfish in Nanwalek, Port Graham, Chenega Bay, and Sitka conducted by the Division of Subsistence with funding from the North Pacific Research Board (Turek et al. 2009). 7. Further evaluation of several years of sport fishing harvest data achieved through the postal Statewide Harvest Survey administered by the Division of Sport Fish should take place for the larger rural communities participating in the subsistence halibut fishery. (Analysis of these data for Sitka was conducted as a pilot effort for See Fall et al. 2005:22 24.) As discussed in Chapter 2 and Chapter 3, many SHARC holders also reported that they sport fished for halibut in It will be important to try to determine if a shift in harvest from the sport category to the subsistence category is occurring, in order to evaluate trends in the subsistence fishery and the effect of the new subsistence halibut regulations on fishing patterns. Also, as noted in Chapter 3, comparisons of community harvest estimates 41
54 from previous research require consideration of sport harvests as well as harvests under the new subsistence regulations. Such comparisons are also important for evaluating the subsistence harvest assessment program and the performance of the new subsistence regulations. 8. Consideration should be given to funding and implementing ethnographic investigations in key halibut fishing communities to evaluate the effects of the new subsistence fishing regulations on fishing patterns. These studies would entail more detailed interviewing of fishers regarding changes in gear choice, fishing effort, harvest amounts, incidental harvests of rockfish or lingcod, or other fishing activities that have resulted from the regulatory changes. These interviews could also investigate traditional knowledge about local halibut stocks (as well as local stocks of rockfish and lingcod) that might prove useful to management agencies, communities, and tribes for future management of the subsistence, sport, and commercial halibut fisheries in Alaska. 9. Results of the 8 years of survey data and the inseason project should be evaluated to design a sustainable harvest monitoring program for the Alaska subsistence halibut fishery consistent with available long-term funding. Such a program could be based on a postal survey linked with other data gathering methods in selected communities or regulatory areas, such as faceto-face interviews, calendars, or limited inseason monitoring. Outreach about the subsistence halibut regulations, including the requirement to obtain a SHARC, should be part of any continuing harvest monitoring program. Steps toward evaluating and enhancing the current program will be taken under the new grant (award NA11NMF ) that supports project activities for the 2011 harvest year. The award includes a modest budget increase to restore the third round of survey mailings and support enhanced outreach activities. 42
55 REFERENCES CITED ADLWD (Alaska Department of Labor and Workforce Development) Population Data, Juneau Cochran, W. G Sampling techniques. 3rd edition. John Wiley & Sons, New York. Crapo, C., B. C. Paust, and J. K. Babbitt Recoveries & yields from Pacific fish and shellfish University of Alaska Fairbanks Alaska Sea Grant College Program, Marine Advisory Bulletin #37, Fairbanks. Fall, J. A., D. B. Andersen, L. Brown, M. Coffing, G. Jennings, C. Mishler, A. Paige, C. J. Utermohle, and V. Vanek Noncommercial harvests and uses of wild resources in Sand Point, Alaska, 1992 Alaska Department of Fish and Game Division of Subsistence, Technical Paper No. 226, Juneau Fall, J. A., M. George, and B. Easley Subsistence harvests of Pacific halibut in Alaska, 2004 Alaska Department of Fish and Game Division of Subsistence Technical Paper No. 304, Juneau. Fall, J. A., M. Kerlin, B. Easley, and R. J. Walker Subsistence harvests of Pacific halibut in Alaska, Alaska Department of Fish and Game Division of Subsistence Technical Paper No. 288, Anchorage and Juneau. Fall, J. A., and D. Koster Subsistence harvests of Pacific halibut in Alaska, 2007 Alaska Department of Fish and Game Division of Subsistence Technical Paper No. 342, Anchorage Fall, J. A., and D. Koster Subsistence harvests of Pacific halibut in Alaska, 2008 Alaska Department of Fish and Game, Division of Subsistence Technical Paper No. 348, Anchorage Fall, J. A., and D. Koster Subsistence harvests of Pacific halibut in Alaska, 2009 Alaska Department of Fish and Game, Division of Subsistence Technical Paper No. 357, Anchorage Fall, J. A., D. Koster, and B. Davis Subsistence harvests of Pacific halibut in Alaska, 2005 Alaska Department of Fish and Game Division of Subsistence Technical Paper No. 320, Juneau. Fall, J. A., D. Koster, and M. Turek Subsistence harvests of Pacific halibut in Alaska, Alaska Department of Fish and Game Division of Subsistence Technical Paper No. 333, Juneau. Fall, J. A., D. Koster, and M. Turek Estimates of subsistence harvests of Pacific halibut in Kodiak and Sitka, Alaska, 2006 Alaska Department of Fish and Game Division of Subsistence, Special Publication No , Anchorage. Gilroy, H. L The Pacific halibut fishery, 2004 Pages 5 18 in the proceedings of the International Pacific Halibut Commission Eighty-First Annual Meeting, January 17 21, International Pacific Halibut Commission, Victoria, British Columbia IPHC, and H. Geiger Annual report: 2010 International Pacific Halibut Commission, Seattle, WA. NMFS (National Marine Fisheries Service) Environmental assessment/regulatory impact review/initial regulatory flexibility analysis for a regulatory amendment for defining a halibut subsistence fishery category (EA/RIR/RFA). North Pacific Fishery Management Council, Alaska Department of Fish and Game, International Pacific Halibut Commission, and National Marine Fisheries Service, Anchorage. NPFMC (North Pacific Fishery Management Council) Environmental assessment and regulatory impact review for a regulatory amendment to define a halibut subsistence fishery category in convention waters National Marine Fisheries Service, Juneau and the North Pacific Fishery Management Council, Anchorage 43
56 Stanek, R. T Patterns of wild resource use in English Bay and Port Graham, Alaska Alaska Department of Fish and Game Division of Subsistence, Technical Paper No. 104, Anchorage Trumble, R. J. n.d estimates of personal use halibut. Pages in Report of assessment and research activities International Pacific Halibut Commission, Seattle. U. S. Census Bureau Profiles of general demographic characteristics, Alaska: U.S. Department of Commerce Washington, D. C. U. S. Census Bureau Census. U. S. Census Bureau, Washington, D. C. Williams, G. H Retention of sublegal halibut in the areas 4D/4E CDQ fishery: 2003 harvests. Pages in IPHC staff, editor. International Pacific Halibut Commission report of assessment and research activities 2003, Seattle. Williams, G. H Retention of sublegal halibut in the areas 4D/4E CDQ fishery: 2004 harvests. Pages in IPHC staff, editor. International Pacific Halibut Commission report of assessment and research activities 2004, Seattle. Williams, G. H Retention of sublegal halibut in the area 4D/4E CDQ fishery: 2006 harvests. Pages in IPHC staff, editor. International Pacific Halibut Commission report of assessment and research activities 2006, Seattle. Williams, G. H Retention of sublegal halibut in the area 4D/4E CDQ fishery: 2007 harvests. Pages in IPHC staff, editor. International Pacific Halibut Commission report of assessment and research activities 2007, Seattle. Williams, G. H Retention of sublegal-sized halibut in the Area 4D/4E CDQ fishery: harvests. Pages in, volume IPHC report of assessment and research activities International Pacific Halibut Commission, Seattle. Williams, G. H Retention of U32 halibut in the 2010 Area 4D/4E CDQ fishery. Pages in IPHC report of assessment and research activities, International Pacific Halibut Commission, Seattle. Wolfe, R. J Subsistence halibut harvest assessment methodologies. Report prepared for the National Marine Fisheries Service, Sustainable Fisheries Division, San Marcos, CA. 44
57 TABLES AND FIGURES 45
58 Table 1. Population of rural communities eligible to participate in the Alaska subsistence halibut fishery, 2000 and Community a Regulatory area Population: 2000 Population: 2010 Total Alaska Native Total Alaska Native Angoon 2C Coffman Cove 2C Craig 2C 1, , Edna Bay 2C Elfin Cove 2C Gustavus 2C Haines 2C 1, , Hollis 2C Hoonah 2C Hydaburg 2C Hyder 2C Kake 2C Kasaan 2C Klawock 2C Klukwan 2C Metlakatla 2C 1,375 1,125 1,405 1,245 Meyers Chuck 2C 21 2 Naukati Bay 2C Pelican 2C Petersburg 2C 3, , Point baker 2C Port Alexander 2C Port Protection 2C Saxman 2C Sitka 2C 8,835 2,178 8,881 2,184 Skagway 2C Tenakee Springs 2C Thorne Bay 2C Whale Pass 2C Wrangell 2C 2, , Census area balances d 2C 1,230 Subtotal, Area 2C 5 25,956 8,052 25,957 7,772 Akhiok 3A Chenega Bay 3A Cordova 3A 2, , Karluk 3A Kodiak b 3A 12,973 1,697 12, Larsen Bay 3A Nanwalek 3A Old Harbor 3A Ouzinkie 3A Port Graham 3A Port Lions 3A Seldovia 3A Tatitlek 3A Yakutat 3A Census area balances d 3A Subtotal, Area 3A 17,871 3,735 17,508 2,885 -continued- 46
59 Table 1. Page 2 of 3. Community a Regulatory area Population: 2000 Population: 2010 Total Alaska Native Total Alaska Native Chignik 3B Chignik Lagoon 3B Chignik Lake 3B Cold Bay 3B False Pass 3B Ivanof Bay 3B King Cove 3B Nelson Lagoon 3B Perryville 3B Sand Point 3B Census area balances d 5 Subtotal, Area 3B 2,435 1,311 2,476 1,189 Akutan 4A , Nikolski 4A Unalaska 4A 4, , Census area balances d 178 Subtotal, Area 4A 5, , Adak 4B Atka 4B Census area balances d Subtotal, Area 4B St. George Island 4C St. Paul Island 4C Census area balances d Subtotal, Area 4C Gambell 4D Savoonga 4D Diomede 4D Census area balances d Subtotal, Area 4D 1,438 1,373 1,467 1,401 Alakanuk 4E Aleknagik 4E Brevig Mission 4E Bethel 4E 5,471 3,719 6,080 4,334 Chefornak 4E Chevak 4E Clark's Point 4E Council ANVSA c 4E Dillingham 4E 2,466 1,503 2,329 1,549 Eek 4E Egegik 4E Elim 4E Emmonak 4E Golovin 4E Goodnews Bay 4E Hooper Bay 4E 1, ,093 1,070 King Salmon 4E Kipnuk 4E Kongiganak 4E Kotlik 4E continued- 47
60 Table 1. Page 3 of 3. Community a Regulatory area Population: 2000 Population: 2010 Total Alaska Native Total Alaska Native Koyuk 4E Kwigillingok 4E Levelock 4E Manokotak 4E Mekoryuk 4E Naknek 4E Napakiak 4E Napaskiak 4E Newtok 4E Nightmute 4E Nome 4E 3,505 2,057 3,598 2,348 Nunam Iqua (formerly Sheldon Point) 4E Oscarville 4E Pilot Point 4E Platinum 4E Port Heiden 4E Quinhagak 4E Scammon Bay 4E Saint Michael 4E Shaktoolik 4E Shishmaref 4E Solomon Anvsa 4E South Naknek 4E Stebbins 4E Teller 4E Togiak 4E Toksook Bay 4E Tuntutuliak 4E Tununak 4E Twin Hills 4E Ugashik 4E Unalakleet 4E Wales 4E White Mountain 4E Census area balances d 398 Subtotal, Area 4E 28,880 23,176 30,378 24,856 Total 82,707 38,990 84,353 39,164 Source U.S. Census Bureau 2001, 2011; Alaska Department of Labor and Workforce Development a. Alaska Native village statistical area (ANVSA) populations were used whenever no city or census designated place (CDP) populations were present in the census. b. Total population for Kodiak Island road system area; includes Kodiak City, Kodiak Station, Chiniak, and other areas on the road system. c. There is no census table for a Council CDP or municipality in The Council ANVSA table indicated that all 40 housing units were vacant in d. Population living outside incorporated places and CDPs but eligible for participation in the subsistence halibut fishery as of December 4, e. Nontribal residents of Naukati Bay were not eligible for SHARCs until This community was not included in population estimates for previous study years. 48
61 Table 2. Project chronology, 2010 study year. Date Event/Action October 1, 2010 Award No. NA04NMF between NMFS and ADF&G amended to support the research for study year 2010 January 26, 2011 Presentation of 2009 study findings at IPHC annual meeting, Victoria, B.C. February 7, 2011 Distribution of final report and 4 page summary for study year 2009 March 16, 2011 First mailing of survey forms May 16, 2011 Second mailing of survey forms April through June 2011 Administration of surveys in Angoon, Hydaburg, Ketchikan, and Sitka April 8, 2011 Submission of semiannual report on project progress to NMFS October 24, 2011 Submission of semiannual report on project progress to NMFS November 21, 2011 Release of public review draft of final report December 7, 2011 Presentation of study findings, NPFMC, Anchorage December 31, 2011 Completion of revised final report 49
62 Table 3. Sample achievement. 50 Tribal name Angoon Community Association Aukquan Traditional Council Central Council Tlingit and Haida Indian Tribes Chilkat Indian Village Chilkoot Indian Association Craig Community Association Douglas Indian Association Hoonah Indian Association Hydaburg Cooperative Association Ketchikan Indian Corporation Klawock Cooperative Association Metlakatla Indian Community, Annette Island Reserve Regulatory areas mailed First Mailing Second Mailing Third Mailing Totals undeliverable mailed undeliverable Mailed undeliverable SHARCs issued Returned by mail Returned through staff Response Response rate Undeliverable 2C % 7 2C 1 2C % 40 2C % 1 2C % 2 2C % 6 2C % 1 2C % 13 2C % 9 2C % 35 2C % 5 2C % 10 -continued-
63 Table 3. Page 2 of Tribal name Regulatory areas mailed First Mailing Second Mailing Third Mailing Totals undeliverable mailed undeliverable Mailed undeliverable SHARCs issued Returned by mail Returned through staff Response Response rate Undeliverable Organized Village of 2C % 1 Kake Organized Village of 2C % 3 Kasaan Organized Village of 2C % 3 Saxman Petersburg Indian 2C % 4 Association Sitka Tribe of Alaska 2C % 24 Skagway Village 2C 3 Wrangell Cooperative Association 2C % 7 Subtotal, Area 2C 2, , , , % 171 Kenaitze Indian Tribe 3A % 6 Lesnoi Village (Woody 3A % 6 Island) Native Village of Afognak 3A % 0 Native Village of Akhiok 3A % 2 Native Village of Chenega 3A % 0 Native Village of Karluk 3A 4 -continued-
64 Table 3. Page 3 of Tribal name Regulatory areas mailed First Mailing Second Mailing Third Mailing Totals undeliverable mailed undeliverable Mailed undeliverable SHARCs issued Returned by mail Returned through staff Response Response rate Undeliverable Native Village of Eyak 3A % 4 Native Village of Larsen Bay 3A % 3 Native Village of Nanwalek 3A % 0 Native Village of Ouzinkie 3A % 0 Native Village of Port 3A % 2 Graham Native Village of Port Lions 3A % 0 Native Village of Tatitlek 3A % 2 Ninilchik Village 3A % 7 Seldovia Village Tribe 3A % 6 Sun'aq Tribe of Kodiak (Formerly 3A % 11 Shoonaq') Village of Kanatak 3A % 4 Village of Old Harbor 3A % 4 Village of Salamatoff 3A % 1 Yakutat Tlingit Tribe 3A % 3 Subtotal, Area 3A % 62 Agdaagux Tribe of King Cove 3B % 1 Chignik Lake Village 3B % 1 -continued-
65 Table 3. Page 4 of Tribal name Regulatory areas mailed First Mailing Second Mailing Third Mailing Totals undeliverable mailed undeliverable Mailed undeliverable SHARCs issued Returned by mail Returned through staff Response Response rate Undeliverable Ivanoff Bay Village 3B % 0 Native Village of Belkofski 3B 5 Native Village of Chignik 3B % 0 Native Village of Chignik 3B % 0 Lagoon Native Village of False Pass 3B 1 Native Village of Nelson 3B 3 Lagoon Native Village of Perryville 3B % 2 Native Village of Unga 3B % 2 Pauloff Harbor Village 3B % 9 Qagan Toyagungin Tribe of Sand Point Village 3B % 3 Subtotal, Area 3B % 18 Native Village of Akutan 4A % 0 Qawalingin Tribe of Unalaska 4A % 0 Subtotal, Area 4A % 0 Native Village of Atka 4B 5 Subtotal, Area 4B % 1 -continued-
66 Table 3. Page 5 of Tribal name Regulatory areas mailed First Mailing Second Mailing Third Mailing Totals undeliverable mailed undeliverable Mailed undeliverable SHARCs issued Returned by mail Returned through staff Response Response rate Undeliverable Pribilof Islands Aleut Community of 4C % 0 St. George Pribilof Islands Aleut Community of St. Paul 4C % 0 Subtotal, Area 4C % 0 Native Village of Diomede 4D 1 (Inalik) Native Village of Gambell 4D 1 Native Village of Savoonga 4D % 1 Subtotal, Area 4D % 1 Chevak Native Village 4E 3 (Kashunamiut) Chinik Eskimo Community 4E 1 Egegik Village 4E 1 King Island Native 4E 1 Community Levelock Village 4E 1 Manokotak Village 4E 1 Naknek Native Village 4E % 1 Native Village of Aleknagik 4E % 0 Native Village of Brevig Mission 4E 1 -continued-
67 Table 3. Page 6 of Tribal name Native Village of Council Native Village of Dillingham (Curyung) Native Village of Eek Native Village of Goodnews Bay (Mumtraq) Native Village of Hooper Bay Native Village of Kanakanak Native Village of Kipnuk Native Village of Kongiganak Native Village of Koyuk Native Village of Kwigillingok Native Village of Kwinhagak Native Village of Mekoryuk Native Village of Nightmute Native Village of Scammon Bay Native Village of Shaktoolik Regulatory areas mailed 4E 4 First Mailing Second Mailing Third Mailing Totals undeliverable mailed undeliverable Mailed undeliverable SHARCs issued Returned by mail Returned through staff Response Response rate Undeliverable 4E % 2 4E % 0 4E 4 4E % 0 4E 1 4E % 0 4E 5 4E 1 4E 4 4E 3 4E % 0 4E 1 4E 3 4E 1 -continued-
68 Table 3. Page 7 of Tribal name Regulatory areas mailed First Mailing Second Mailing Third Mailing Totals undeliverable mailed undeliverable Mailed undeliverable SHARCs issued Returned by mail Returned through staff Response Response rate Undeliverable Native Village of Toksook Bay 4E % 0 (Nunakauyak) Native Village of Tununak 4E % 0 Native Village of Unalakleet 4E 3 Native Village of Wales 4E 1 Newtok Village 4E 1 Nome Eskimo Community 4E % 2 Orutsararmuit Native Village 4E % 0 South Naknek Village 4E 1 Stebbins Community 4E 4 Association Traditional Village of 4E 3 Togiak Twin Hills Village 4E 1 Ugashik Village 4E 2 Village of Chefornak 4E % 0 Village of Clark's Point 4E 1 Village of Kotlik 4E 1 Subtotal, Area 4E % 13 Tribal name subtotals 3,906 1, , ,906 1, , % 266 -continued-
69 Table 3. Page 8 of Rural community Regulatory areas mailed First Mailing Second Mailing Third Mailing Totals undeliverable mailed undeliverable Mailed undeliverable SHARCs issued Returned by mail Returned through staff Response Response rate Undeliverable Angoon 2C % 2 Coffman Cove 2C % 0 Craig 2C % 22 Edna Bay 2C % 2 Elfin Cove 2C % 2 Gustavus 2C % 3 Haines 2C % 14 Hollis 2C % 5 Hoonah 2C % 4 Hydaburg 2C % 1 Hyder 2C % 1 Juneau 2C 3 Kake 2C % 2 Kasaan 2C % 0 Ketchikan 2C 5 Klawock 2C % 8 Klukwan 2C 2 Metlakatla 2C % 2 Meyers Chuck 2C % 0 Naukati Bay 2C % 4 Pelican 2C % 4 Petersburg 2C % 27 Port Alexander 2C % 0 Port Protection 2C % 1 Pt. Baker 2C % 0 Saxman 2C % 1 Sitka 2C 1, , % 96 Skagway 2C % 2 Tenakee Springs 2C % 0 Thorne Bay 2C % 4 Ward Cove 2C 2 Whale Pass 2C % 0 -continued-
70 Table 3. Page 9 of Rural community Regulatory areas mailed First Mailing Second Mailing Third Mailing Totals undeliverable mailed undeliverable Mailed undeliverable SHARCs issued Returned by mail Returned through staff Response Response rate Undeliverable Wrangell 2C % 21 Subtotal, Area 2C 4,420 2, , ,420 2, , % 228 Chenega Bay 3A % 0 Chiniak 3A 3 Cordova 3A % 23 Karluk 3A % 0 Kodiak 3A 1, , % 170 Larsen Bay 3A % 1 Nanwalek 3A % 0 Old Harbor 3A % 1 Ouzinkie 3A % 0 Port Graham 3A % 1 Port Lions 3A % 0 Seldovia 3A % 1 Tatitlek 3A % 0 Yakutat 3A % 1 Subtotal, Area 3A 2,348 1, , ,348 1, , % 198 Chignik 3B 1 Chignik Lagoon 3B 1 Chignik Lake 3B 1 Cold Bay 3B % 2 False Pass 3B 1 King Cove 3B % 2 Nelson Lagoon 3B 1 Perryville 3B 1 Sand Point 3B % 1 Subtotal, Area 3B % 6 Unalaska 4A % 8 Subtotal, Area 4A % 8 Adak 4B 5 Subtotal, Area 4B % 2 -continued-
71 Table 3. Page 10 of Rural community St. George Island Regulatory areas mailed 4C 1 First Mailing Second Mailing Third Mailing Totals undeliverable mailed undeliverable Mailed undeliverable SHARCs issued Returned by mail Returned through staff Response Response rate Undeliverable Subtotal, Area 4C % 0 Aleknagik 4E 2 Bethel 4E 1 Chefornak 4E 1 Dillingham 4E % 2 Egegik 4E 1 King Salmon 4E 2 Kongiganak 4E 1 Manokotak 4E 2 Naknek 4E % 0 Nightmute 4E 1 Nome 4E % 2 Port Heiden 4E 3 Quinhagak 4E 1 South Naknek 4E 1 Teller 4E % 0 Togiak 4E 1 Subtotal, Area 4E % 5 Rural community subtotals 7,047 3, , ,047 4, , % 447 Tribal Rural Totals 10,953 5, ,702 1, ,953 6, , % 713 -continued-
72 Table 3. Page 11 of City of residence State of residence mailed First Mailing Second Mailing Third Mailing Totals undeliverable mailed undeliverable Mailed undeliverable SHARCs issued Returned by mail Returned through staff Response Response rate Undeliverable Adak AK % 2 Akhiok AK % 1 Akiachak AK 1 Akutan AK % 0 Aleknagik AK 3 Anchor Point AK % 0 Anchorage AK % 35 Angoon AK % 7 Atka AK 1 Auke Bay AK 5 Barrow AK 1 Bethel AK % 0 Chefornak AK % 0 Chenega Bay AK % 0 Chevak AK 2 Chignik AK % 0 Chignik Lagoon AK % 0 Chignik Lake AK 4 Chiniak AK % 0 Chugiak AK 3 Clarks Point AK 1 Coffman Cove AK % 0 Cold Bay AK % 2 Cordova AK % 17 Craig AK % 30 Dillingham AK % 3 Douglas AK % 7 Dutch Harbor AK % 5 Eagle River AK % 0 Edna Bay AK % 0 Eek AK % 0 Egegik AK 1 Elfin Cove AK % 2 -continued-
73 Table 3. Page 12 of City of residence State of residence mailed First Mailing Second Mailing Third Mailing Totals undeliverable mailed undeliverable Mailed undeliverable SHARCs issued Returned by mail Returned through staff Response Response rate Undeliverable Elmendorf AFB AK 1 Ester AK 1 Fairbanks AK % 2 False Pass AK 1 Fritz Creek AK 1 Gakona AK 1 Gambell AK 1 Girdwood AK 1 Glennallen AK 1 Golovin AK 1 Goodnews Bay AK 4 Gustavus AK % 2 Haines AK % 12 Hollis AK 1 Homer AK % 2 Hoonah AK % 19 Hooper Bay AK % 0 Hydaburg AK % 2 Hyder AK % 1 Juneau AK % 43 Kake AK % 2 Karluk AK % 0 Kasaan AK % 5 Kasilof AK % 3 Kenai AK % 9 Ketchikan AK % 40 King Cove AK % 1 King Salmon AK 2 Kipnuk AK % 0 Klawock AK % 8 Klukwan AK 2 -continued-
74 Table 3. Page 13 of City of residence State of residence mailed First Mailing Second Mailing Third Mailing Totals undeliverable mailed undeliverable Mailed undeliverable SHARCs issued Returned by mail Returned through staff Response Response rate Undeliverable Kodiak AK % 179 Kongiganak AK % 0 Kotzebue AK 1 Kwigillingok AK 3 Larsen Bay AK % 3 Manokotak AK 2 Mekoryuk AK 5 Metlakatla AK % 8 Meyers Chuck AK % 0 Naknek AK % 0 Nanwalek AK % 0 Naukati AK % 3 Nelson Lagoon AK 1 Newtok AK 1 Nightmute AK 2 Nikiski AK % 0 Ninilchik AK % 3 Nome AK % 1 North Pole AK 4 Old Harbor AK % 4 Ouzinkie AK % 0 Palmer AK % 1 Pelican AK % 4 Perryville AK % 2 Petersburg AK % 31 Pilot Point AK 2 Point Baker AK % 1 Port Alexander AK % 0 Port Graham AK % 2 Port Heiden AK 2 Port Lions AK % 0 Port Protection AK 2 Port William AK 1 -continued-
75 Table 3. Page 14 of City of residence State of residence mailed First Mailing Second Mailing Third Mailing Totals undeliverable mailed undeliverable Mailed undeliverable SHARCs issued Returned by mail Returned through staff Response Response rate Undeliverable Quinhagak AK 5 Sand Point AK % 10 Savoonga AK % 1 Saxman AK % 3 Seldovia AK % 2 Seward AK % 4 Sitka AK % 117 Skagway AK % 2 Soldotna AK % 2 St. George Island AK 4 St. Paul Island AK % 0 Sterling AK 4 Tatitlek AK % 0 Teller AK % 0 Tenakee Springs AK % 0 Thorne Bay AK % 2 Togiak AK 4 Toksook Bay AK % 0 Trapper Creek AK 1 Tununak AK % 0 Twin Hills AK 2 Unalakleet AK 1 Unalaska AK % 3 Valdez AK % 0 Ward Cove AK % 1 Wasilla AK % 9 Whale Pass AK % 0 Whittier AK 2 Willow AK 2 Wrangell AK % 25 Yakutat AK % 1 Subtotal, AK 10,804 5, ,634 1, ,804 6, , % 690 -continued-
76 Table 3. Page 15 of 15. City of residence Regulatory areas mailed First Mailing Second Mailing Third Mailing Totals undeliverable mailed undeliverable Mailed undeliverable SHARCs issued Returned by mail Returned through staff Response Response rate Undeliverable Subtotal, non-alaska residents % 23 City of residence totals 10,953 5, ,702 1, ,953 6, , % 713 a. To protect confidentiality, data for tribes and communities with 5 or fewer surveys mailed are not reported in this table. Subtotals include all tribes and communities. 64
77 Table 4. subsistence harvests of halibut, 2010, by SHARC type and regulatory area. 65 SHARC a type Regulatory area Return rate SHARCs issued Percent Subsistence fished halibut Percent of respondents SHARCs Subsistence halibut harvest Sport fished halibut Sport halibut harvest Lingcod bycatch Rockfish bycatch of Percent of of fish pounds c respondents SHARCs fish pounds c respondents fish respondents fish Tribal b 2C 2,335 1, % % 8, , % 1,032 18, ,578 Tribal 3A % % 6,247 95, % , ,560 Tribal 3B % % 1,209 17, % 166 3, Tribal 4A % % 197 3, % Tribal 4B % % % Tribal 4C % % , % Tribal 4D % % 42 1, % Tribal 4E % % , % 106 1, Subtotal, tribal 3,906 2, % 1, % 17, , % 1,953 37, ,496 Rural b 2C 4,420 3, % % 13, ,900 1, % 3,372 54, , ,308 Rural 3A 2,348 1, % % 11, , % 3,080 54, ,637 Rural 3B % % 357 6, % Rural 4A % % , % 208 2, Rural 4B % % % Rural 4C % 0 0.0% % Rural 4D 0 Rural 4E % % % Subtotal, rural 7,047 4, % 3, % 25, ,990 1, % 6, , , ,356 All b 2C 6,755 4, % 3, % 21, ,866 1, % 4,404 72, , ,886 All 3A 3,288 1, % 1, % 17, , % 3,712 68, ,198 All 3B % % 1,567 23, % 200 3, All 4A % % , % 223 2, All 4B % % % All 4C % % , % All 4D % % 42 1, % All 4E % % , % 109 1, Total 10,953 6, % 4, % 43, ,560 2, % 8, , ,864 1,322 12,851 Source ADF&G Division of Subsistence SHARC survey, a. Subsistence Halibut Registration Certificate (SHARC). b. Tribal = individuals who obtained SHARCs as members of an eligible tribe, sorted by location of tribal headquarters. Rural = individuals who obtained SHARCs as residents of an eligible rural community. All = sum of tribal and rural SHARC holders for a regulatory area based on location of tribal headquarters or rural community. Because some SHARC holders may fish in regulatory areas other than the location of the area of their tribal headquarters or rural residence, area totals in this table differ slightly from those in tables 6, 7, and 9. c. Pounds net (dressed) weight = 75% of round (whole) weight.
78 Table 5. Age of Subsistence Halibut Registration Certificate holders by SHARC type, SHARC Type Age (years) Number of SHARC Holders Totals Tribal , % 1.8% 3.0% 4.4% 6.7% 6.6% 6.9% 6.7% 8.8% 11.2% 11.8% 10.8% 8.2% 5.6% 3.9% 2.0% 0.8% 0.4% 0.1% 0.0% Rural , % 0.7% 1.6% 2.8% 3.2% 5.7% 7.8% 7.6% 9.0% 11.5% 13.6% 13.0% 10.4% 6.6% 3.8% 1.6% 0.7% 0.2% 0.0% 0.0% Total ,249 1,421 1,336 1, , % 1.1% 2.1% 3.4% 4.4% 6.0% 7.4% 7.3% 9.0% 11.4% 13.0% 12.2% 9.6% 6.2% 3.9% 1.7% 0.8% 0.3% 0.0% 0.0% Source SHARC database, Restricted Access Management Program, NMFS, Juneau, as of 12/31/
79 Table 6. harvests of halibut in s of fish and pounds net (dressed, head-off) weight by regulatory area and subarea, subsistence harvest by gear type a Set hook gear Hook and line or handline All gear sport harvest Number of SHARCs pounds pounds pounds pounds Regulatory subsistence respondents halibut halibut respondents halibut halibut respondents halibut halibut respondents halibut halibut Subarea area fished c fished harvested harvested b fished harvested harvested b fished harvested harvested b fished harvested harvested b Southern Southeast Alaska 2C 1,618 1,373 9, , ,927 46,831 1,618 12, , ,928 47,523 Sitka Lamp Area 2C ,118 68, , ,704 76, ,960 Northern Southeast Alaska 2C ,084 77, ,007 16, ,091 93, ,880 Subtotal, Area 2C 3,013 2,625 16, ,290 1,118 4,521 71,528 3,013 21, ,818 1,313 4,312 71,364 Yakutat Area 3A , , , ,198 Prince William Sound 3A ,767 35, , ,132 42, ,905 Cook Inlet 3A ,780 36, ,607 28, ,386 65, ,008 Kodiak Island road system 3A ,429 82, ,146 20, , , ,871 35,599 Kodiak Island Other 3A ,854 56, ,346 26, ,201 83, ,055 18,534 Subtotal, Area 3A 1,631 1,283 12, , ,654 88,699 1,631 18, , ,943 72,244 Chignik Area 3B , , , Lower Alaska Peninsula 3B , , ,210 17, ,248 Subtotal, Area 3B , , ,525 23, ,351 Eastern Aleutians East 4A , , , ,682 Eastern Aleutians West 4A , Subtotal, Area 4A , , , ,814 Western Aleutians East 4B Western Aleutians Other 4B 0 Subtotal, Area 4B St. George Island 4C St. Paul Island 4C , , Subtotal, Area 4C , , St. Lawrence Island 4D , Area 4D Other 4D 0 Subtotal, Area 4D , Bristol Bay 4E Yukon Delta 4E , , , Norton Sound 4E Kotzebue Sound 4E 0 Subtotal, Area 4E , , , Total, Alaska c 4,991 4,071 31, ,992 2,183 11, ,567 4,991 43, ,560 2,297 8, ,241 Source ADF&G Division of Subsistence SHARC survey, a. Setline = longline or skate. Hand-operated gear = rod and reel, or handline. b. Weights given are net weight. Pounds net (dressed, head off) weight = 75% of round (whole) weight. c. Because fishers may fish in more than one area, subtotals for regulatory areas and the state total might exceed the sum of the subarea values. Includes subsistence and sport fishing.
80 Table 7. Alaska subsistence halibut harvests from by geographic area fished. 68 Subsistence halibut harvests, net weight (lb) Percent change between years 2009 to 2010 Percentage of state total 7-year average to Geographic area Southern Southeast Alaska 290, , , , , , , , % -15.1% 27.9% 31.0% 27.9% 27.4% 27.5% 28.7% 30.4% 31.9% Sitka LAMP Area 173, , , , , ,973 89,812 76, % -42.0% 16.6% 12.3% 11.3% 13.1% 12.8% 11.8% 10.4% 9.7% Northern Southeast Alaska 159, , , , ,286 98, ,139 93, % -26.8% 15.3% 13.4% 11.5% 11.1% 10.6% 11.1% 12.2% 11.7% Subtotal, Area 2C 623, , , , , , , , % -24.1% 59.9% 56.7% 50.8% 51.6% 50.8% 51.7% 53.1% 53.3% Yakutat Area 11,198 20,153 36,515 19,187 17,516 16,084 14,390 18, % -6.4% 1.1% 1.7% 3.1% 1.7% 1.7% 1.8% 1.7% 2.3% Prince William Sound 28,409 58,429 68,063 47,965 52,407 47,112 33,796 42, % -12.0% 2.7% 4.9% 5.8% 4.3% 5.1% 5.3% 3.9% 5.3% Cook Inlet 52,609 83,939 79,024 59,965 75,623 76,795 81,043 65, % -9.5% 5.1% 7.0% 6.7% 5.3% 7.3% 8.7% 9.4% 8.3% Kodiak Island road system 114, , , , ,538 96, , , % -15.5% 11.0% 10.8% 11.4% 12.5% 12.6% 10.9% 12.5% 12.9% Kodiak Island Other 79, , , ,752 96, ,540 91,202 83, % -16.8% 7.6% 9.4% 9.4% 9.9% 9.3% 11.3% 10.6% 10.5% Subtotal, Area 3A 285, , , , , , , , % -13.7% 27.4% 33.8% 36.4% 33.7% 36.1% 38.0% 38.1% 39.2% Chignik Area 10,500 12,053 14,783 17,780 15,397 11,842 5,889 5, % -53.5% 1.0% 1.0% 1.3% 1.6% 1.5% 1.3% 0.7% 0.7% Lower Alaska Peninsula 16,977 21,467 31,442 30,767 32,351 30,406 19,603 17, % -34.4% 1.6% 1.8% 2.7% 2.7% 3.1% 3.4% 2.3% 2.2% Subtotal, Area 3B 27,477 33,519 46,225 48,547 47,748 42,248 25,492 23, % -40.6% 2.6% 2.8% 3.9% 4.3% 4.6% 4.8% 3.0% 2.9% Eastern Aleutians East 19,345 26,715 33,882 25,993 12,753 19,043 33,090 13, % -45.3% 1.9% 2.2% 2.9% 2.3% 1.2% 2.1% 3.8% 1.7% Eastern Aleutians West 1,852 2,162 1,734 1,069 2, , % -15.0% 0.2% 0.2% 0.1% 0.1% 0.2% 0.1% 0.0% 0.2% Subtotal, Area 4A 21,197 28,877 35,615 27,062 14,946 19,553 33,499 14, % -43.7% 2.0% 2.4% 3.0% 2.4% 1.4% 2.2% 3.9% 1.8% Western Aleutians East 2, ,351 2,761 1,997 4,737 1, % -79.7% 0.2% 0.1% 0.1% 0.2% 0.2% 0.5% 0.1% 0.1% Western Aleutians Other % 0.0% 0.0% 0.0% 0.0% 0.0% 0.0% 0.0% Subtotal, Area 4B 2, ,351 2,761 1,997 4,737 1, % -79.7% 0.2% 0.1% 0.1% 0.2% 0.2% 0.5% 0.1% 0.1% St. George Island 2,042 1,823 2,145 3,443 3,736 1, % -66.5% 0.2% 0.2% 0.2% 0.3% 0.4% 0.1% 0.1% 0.1% St. Paul Island 20,839 7,911 5,571 5,085 11,342 4,507 5,623 10, % 16.6% 2.0% 0.7% 0.5% 0.5% 1.1% 0.5% 0.7% 1.3% Subtotal, Area 4C 22,881 9,734 7,716 8,527 15,077 5,657 6,323 10, % 0.1% 2.2% 0.8% 0.7% 0.8% 1.5% 0.6% 0.7% 1.4% St. Lawrence Island 4,380 10,923 5,848 8,297 3,204 3, , % -77.5% 0.4% 0.9% 0.5% 0.7% 0.3% 0.4% 0.1% 0.1% Area 4D Other % 0.0% 0.0% 0.0% 0.0% 0.0% 0.0% 0.0% Subtotal, Area 4D 4,380 10,923 5,848 8,297 3,204 3, , % -77.5% 0.4% 0.9% 0.5% 0.7% 0.3% 0.4% 0.1% 0.1% Bristol Bay ,169 1,336 2, % 0.0% 0.0% 0.2% 0.1% 0.2% 0.0% 0.0% 0.0% YK Delta 53,284 28,298 51,950 69,407 50,019 14,669 7,468 9, % -75.9% 5.1% 2.4% 4.4% 6.2% 4.8% 1.7% 0.9% 1.2% Norton Sound ,145 1, % 61.1% 0.0% 0.0% 0.0% 0.0% 0.0% 0.1% 0.1% 0.1% Subtotal, Area 4E 53,775 28,501 54,119 70,743 52,135 15,898 8,749 10, % -75.2% 5.2% 2.4% 4.6% 6.3% 5.1% 1.8% 1.0% 1.3% Total, Alaska a 1,041,330 1,193,162 1,178,222 1,125,312 1,032, , , , % -23.7% 100.0% 100.0% 100.0% 100.0% 100.0% 100.0% 100.0% 100.0% Source ADF&G Division of Subsistence SHARC surveys, a. The sum of the harvests by geographic areas for 2003 reported here differs slightly from that reported in Table 8 in Fall et al (2004:50) due to rounding.
81 Table 8. Number of hooks usually fished, setline (stationary) gear, Alaska halibut subsistence fishery, Regulatory area (No. Number of hooks b of SHARC holders) Missing Total a No , ,630 2C (6,755) Pct A (3,288) No ,240 Pct B (369) No Pct A (176) No Pct B (10) No Pct C (49) No Pct D (20) No Pct E (286) No Pct Alaska (10,953) No , ,071 Pct Source ADF&G Division of Subsistence SHARC survey, a. Number of fishers using setline (fixed) gear. Based on location of tribe or rural community of SHARC holder. b. The column for 30 hooks includes those fishers who reported using more than 30. There is no 30-hook limit in Areas 4C, 4D, or 4E.
82 Table 9. Average net weight of subsistence and sport harvested halibut, 2010, by regulatory area fished. Area b Subsistence methods Sport harvest a Total halibut Number Net weight (lb) Average per fish Number Net weight (lb) Average per fish Number Net weight (lb) Average per fish 2C 21, , ,312 71, , , A 18, , ,943 72, , , B 1,525 23, , ,674 25, A , , ,117 17, B C , , D 38 1, , E , , Alaska 43, , , , , , Source ADF&G Division of Subsistence SHARC survey, a. Sport harvest of halibut by SHARC holders. b. Area totals are based on the location of the harvest (see also Table 6 and Table 7). Table 10. harvests of lingcod and rockfish by regulatory area and subarea. Subarea Regulatory area SHARCs fished Lingcod respondents harvested lingcod harvested Rockfish respondents harvested rockfish harvested Northern Southeast Alaska 2C ,088 Sitka Lamp Area 2C ,644 Southern Southeast Alaska 2C 1, ,956 Subtotal, Area 2C 3, , ,688 Cook Inlet 3A Kodiak Island Other 3A ,101 Kodiak Island Road System 3A ,528 Prince William Sound 3A Yakutat Area 3A Subtotal, Area 3A 1, ,426 Chignik Area 3B Lower Alaska Peninsula 3B Subtotal, Area 3B Eastern Aleutians - East 4A Eastern Aleutians - West 4A Subtotal, Area 4A Western Aleutians - East 4B Subtotal, Area 4B St. George Island 4C St. Paul Island 4C Subtotal, Area 4C St. Lawrence Island 4D Subtotal, Area 4D Bristol Bay 4E Norton Sound 4E Yukon Delta 4E Subtotal, Area 4E Totals 4, ,864 1,322 12,851 Source ADF&G Division of Subsistence SHARC survey,
83 Table 11. harvests of halibut by gear type and participation subsistence and sport fisheries, selected Alaska communities, 2003 through Subsistence harvests Setline (fixed) gear Hand-operated gear Total subsistence harvest Sport harvest d All harvests Number of Community a Year SHARC holders b fished pounds harvested fished pounds harvested fished pounds harvested fished pounds harvested fished pounds harvested Cordova , , , , , , , , , , , , , , , , , , , , , , , , , , , , , , , , , , , , , , , ,265 Kodiak , , , , , , , , , , , , , , , , ,455 1, , , , , , ,320 1, , , , , , ,556 1, , , , , , ,915 1, , , , , , ,034 1, , , , , , ,646 1, ,738 Petersburg , , , , , , , , , , , , , , , , , , , , , , , , , , , , , , , , , , , , , , , , , , , , , ,517 Port Graham , , , , , , , , , , , , , , , , , , , , , , , , , , , , , , , ,489 Sand Point , , , , , , , , , , , , , , , , , , , , , , , ,649 -continued-
84 72 Table 11. Page 2 of 2. Community a Year Number of SHARC holders b Subsistence harvests Setline (fixed) gear Hand-operated gear Total subsistence harvest pounds pounds pounds fished harvested fished harvested fished harvested fished Sport harvest d pounds harvested All harvests pounds fished harvested , , , , , , , , , , , , , , ,435 Sitka , , , , , , , , , , ,829 1, , , , , , , , , , , , ,032 1, , , , , , ,200 1, , , , , , , , , , , , , , , , , , , ,985 Toksook Bay , , , , , , , , , , , , , , , , , , , , , , , Tununak , , , , , , , , , , , , , , , , Unalaska c , , , , , , , , , , , , , , , , , , , , , , , , , , , , , , , , , , , , , , , ,811 Source ADF&G Division of Subsistence SHARC surveys, a. For data on all communities for 2009, see appendix tables E-4, E-5, and E-6. b. SHARC = Subsistence halibut registration certificate; includes all SHARC holders living in the community. c. Includes Dutch Harbor. d. Sport harvests by SHARC holders only.
85 Year Table 12. harvests of halibut for home use, Sitka. Number of fishing households Pounds usable (net) weight Removed from commercial harvests Rod and reel Other methods a Total Total without commercial removal 95% confidence range (±%) b ,252 12, , , , , ,048 14, , , Annual average 1,098 14, ,015 14, , ,113 Source ADF&G Community Subsistence Information System (CSIS). a. Harvest data not collected for "other methods" in b. Pertains to estimate of total harvests. Table 13. Number of SHARCs issued, estimated of subsistence halibut fishers, and estimated harvests by SHARC category, Sitka, Year SHARCs Rural SHARCs Tribal SHARCs All SHARC holders residing in Sitka Subsistence fished Harvest Average harvest per fisher (pounds) SHARCs Subsistence fished Harvest Average harvest per fisher (pounds) SHARCs Subsistence fished Harvest Average harvest per fisher (pounds) , , , , , , , , , , , , , , , , , , , , , , , , , , , , , , , , , , , , , , , , Historical average ( ) 1, , , , , Year Table 14. harvests of halibut for home use, Petersburg. Number of fishing households Pounds usable (net) weight Removed from commercial harvests Rod and reel Other methods a Total Total without commercial removal 95% confidence range (±%) b , , , , ,951 49, ,974 49, Annual average 536 9,339 78, ,575 78,236 Sources ADF&G Community Subsistence Information System (CSIS); ADF&G Division of Subsistence household survey, a. Harvest data not collected for "other methods" in b. Pertains to estimate of total harvests. 73
86 Year Table 15. harvests of halibut for home use, Cordova. Number of fishing households Pounds usable (net) weight Removed from commercial harvests Rod and reel Other methods Total Total without commercial removal 95% confidence range (±%) a ,776 31,002 1,752 36,530 32,754 29% , , , ,221 62% ,107 25, ,716 25,609 33% ,383 60, ,995 60,612 48% ,762 39,556 2,056 45,374 41,612 32% ,551 58,647 4,252 66,450 62,899 41% Annual average ,047 55,864 1,421 68,331 57,285 Source ADF&G Community Subsistence Information System (CSIS). a. Pertains to estimate of total harvests. Year Table 16. harvests of halibut for home use, Port Graham. Number of fishing households pounds usable (net) weight Removed from commercial harvests Rod and reel Other methods Total Total without commercial removal 95% confidence range (±%) b ,237 3,809 3,389 8,435 7,198 14% ,217 1,482 1,222 5,921 2,704 47% ,003 4,106 3,171 10,280 7,277 22% ,663 2,332 4,846 8,841 7,178 17% ,867 3,365 11,256 11,232 14% ,105 1,346 4,537 4,451 14% ,881 5,326 8,286 8,207 28% Annual average a 38 1,015 4,017 3,574 8,606 7,591 Source ADF&G Community Subsistence Information System (CSIS). a. Excludes 1989, the year of the Exxon Valdez Oil Spill. b. Pertains to estimate of total harvests. Year Table 17. harvests of halibut for home use, Kodiak road system. a Number of fishing households Pounds usable (net) weight Removed from commercial harvests Rod and reel Other methods Total Total without commercial removal 95% confidence range (±%) b ,404 NA NA NA 451, ,113 45% ,178 48, ,692 40, , ,283 30% ,178 89, ,345 18, , ,077 33% , , ,391 31, , ,254 33% Annual average 1,306 93, ,476 30, , ,682 Source ADF&G Community Subsistence Information System (CSIS). a. Harvest data are available based on random samples drawn from the entire road system population for 1982 and Only Kodiak City was sampled in 1992 and Estimates for the entire road system population were developed for this table based on the known portion of the total road system harvest harvested by city residents in 1982 and b. Pertains to estimate of total harvests. 74
87 Area Table 18. Halibut removals in Alaska by regulatory area, Pounds net weight Commercial a Sport b Subsistence c Wastage Bycatch Total 2C 4,486,000 2,548, , , ,000 8,050,818 3A 20,502,000 5,068, ,650 1,438,000 2,663,000 29,983,650 3B 10,114,000 40,000 23, ,000 1,226,000 12,310, ,469,000 42,000 46, ,000 5,592,000 13,428,601 Alaska 42,571,000 7,698, ,077 2,875,000 9,822,000 63,773,077 Sources Williams 2011; Division of Subsistence, ADF&G, SHARC Survey, 2011; IPHC and Geiger a. Commercial catch includes IPHC research catch and in Area 2C, the Metlakatla fishery catch. b. Projected harvests. c. Includes 9,517 lb of U32 (under 32 inches in length) halibut legally retained by CDQ organizations in areas 4D and 4E for personal use. The subsistence harvest by SHARC holders was 797,560 lb, including 37,084 lb in Area 4. 75
88 Table 19. Comparison of selected SHARC survey results, Study years compared to 2009 Percent change 2010 compared to previous 7- year average Response to survey Number of SHARCs issued 11,635 13,813 14,306 14,206 15,047 11,565 11,733 10, % -16.9% Number of surveys 7,593 8,524 8,565 8,426 8,682 7,316 6,944 6, % -16.7% Response rate 65.3% 61.7% 59.9% 59.3% 57.7% 63.3% 59.2% 60.9% 2.9% 0.0% Subsistence halibut fishing of subsistence halibut fishers 4,942 5,984 5,621 5,909 5,933 5,303 5,296 4, % -10.4% Percent of all SHARC holders subsistence fishing 42.5% 43.3% 39.3% 41.6% 39.4% 45.9% 45.1% 45.6% 0.9% 7.4% of subsistence halibut 43,926 52,412 55,875 54,089 53,697 48,604 45,434 43, % -14.3% net pounds of subsistence halibut 1,041,330 1,193,162 1,178,222 1,125,312 1,032, , , , % -23.7% Average weight of subsistence-harvested halibut % -11.0% Average harvest per fisher, fish % -4.3% Average harvest per fisher, net pounds % -14.9% Sport halibut fishing by SHARC holders of sport halibut fishers 2,580 3,107 3,147 2,894 2,566 2,609 2,528 2, % -17.2% Percent of all SHARC holders sport fishing 22.2% 22.5% 22.0% 20.4% 17.1% 22.6% 21.5% 21.0% -2.6% -0.9% of sport halibut 10,784 12,530 14,096 11,219 10,959 11,427 9,938 8, % -25.2% net pounds of sport halibut 245, , , , , , , , % -33.6% Average weight of sport-harvested halibut % -10.8% Average harvest per fisher, fish % -9.6% Average harvest per fisher, net pounds % -19.4% Total of halibut fishers of fishers, subsistence or sport 5,941 6,980 6,876 6,899 6,787 6,202 6,153 5, % -10.9% Percent of total SHARC holders who fished 51.1% 50.5% 48.1% 48.6% 45.1% 53.6% 52.4% 53.3% 1.6% 6.7% Incidental rockfish harvests Number of rockfish harvesters 1,239 1,616 1,544 1,529 1,568 1,404 1,427 1, % -10.4% Percent of all SHARC holders 10.6% 11.7% 10.8% 10.8% 10.4% 12.1% 12.2% 12.1% -0.8% 7.5% Percent of all subsistence halibut fishers 25.1% 27.0% 27.5% 25.9% 26.4% 26.5% 27.0% 26.5% -1.7% 0.1% Number of rockfish harvested 14,870 19,001 12,395 16,945 15,266 14,346 13,315 12, % -15.2% Average of rockfish harvested, all subsistence halibut fishers % -5.4% Average of rockfish harvested, subsistence halibut fishers who harvested rockfish % -5.7% -continued-
89 Table 19. Page 2 of 2. Study years compared to 2009 Percent change 2010 compared to previous 7- year average Incidental lingcod harvests Number of lingcod harvesters % -16.8% Percent of all SHARC holders 6.0% 6.9% 6.0% 6.5% 6.4% 7.4% 7.7% 6.7% -12.9% -0.3% Percent of all subsistence halibut fishers 14.1% 15.9% 15.3% 15.7% 16.2% 16.1% 17.0% 14.7% -13.7% -7.0% Number of lingcod harvested 3,298 4,407 2,355 3,486 3,402 3,479 3,390 2, % -15.8% Average of lingcod harvested, all subsistence halibut fishers % -6.2% Average of lingcod harvested, subsistence halibut fishers who harvested lingcod % 0.7% Sources Fall et al. 2004, 2005, 2006, 2007; Fall and Koster 2008, 2009, 2010; ADF&G Division of Subsistence SHARC survey,
90 Table 20. Percentage of SHARCs that expired, by SHARC type. Percentage of SHARCs Tribal Rural All Expired Active Expired Active Expired Active Never responded to harvest survey 29.0% 18.4% 25.0% 12.4% 27.1% 14.5% Never subsistence fished for halibut 40.8% 21.3% 24.9% 8.1% 32.9% 12.6% Never harvested halibut 5.3% 10.4% 8.3% 12.2% 6.8% 11.6% Harvest: low (1 to 100 pounds) 11.7% 22.4% 19.0% 28.0% 15.3% 26.1% Harvest: medium (101 to 1,000 pounds) 12.4% 25.6% 22.1% 38.2% 17.2% 33.9% Harvest: high (>1,000 pounds) 0.8% 1.8% 0.8% 1.1% 0.8% 1.3% All harvesters (any amount) 24.9% 49.8% 41.9% 67.3% 33.3% 61.3% All fishers (includes never harvested) 30.2% 60.2% 50.2% 79.5% 40.1% 72.9% 78
91 79 Figure 1. Regulatory areas for the Pacific halibut fishery.
92 Returned Not Returned 12,000 9,000 Return rate = 61% 80 Number of surveys/sharcs 6,000 Return rate = 66% 3,000 Return Rate = 52% 0 Tribal SHARCs Rural SHARCs Total SHARCs Figure 2. Number of surveys and return rates for subsistence halibut surveys, by SHARC type, 2010.
93 100% 90% Rural communities Tribes 87% 80% 70% 75% 76% 71% 73% 73% 70% 64% 63% 66% 64% 63% 66% 79% 68% 68% 60% 50% 55% 53% 48% 44% 44% 50% 53% 49% 55% 53% 55% 51% 40% 38% 81 30% 20% 10% 0% Figure 3. SHARC survey return rates, communities with more than 100 SHARCs issued and tribes with more than 70 SHARCs issued, 2010.
94 54% 62% 70% 67% 68% 64% 71% 71% 34% 54% 61% 47% 46% 59% 69% 47% 97% 78% 50% 66% 75% 88% 100% 90% 80% 70% 60% 50% 40% 30% Percentage of SHARCs issued 20% 10% 0% Figure 4. Return rate by place of residence,
95 First Mailing Second Mailing Staff Administered 8,000 7,000 6,000 Return rate = 57% Return rate = 61% 83 Number of SHARC surveys 5,000 4,000 3,000 2,000 Return rate = 47% 1,000 0 After first mailing (3/16/2011) After second mailing (5/16/2011) Adding staff administered surveys Figure 5. Number of survey responses by response category, 2010.
96 ,000 5,578 6,533 6,437 7,123 7,446 4,316 4,009 3,906 1,836 2,157 2,035 2,329 2,222 1,595 1,549 1,502 6,057 7,280 7,869 7,083 7,601 7,249 7,724 7,047 3,106 3,827 3,586 3,580 3,710 3,708 3,748 3,489 4,942 5,984 5,621 5,909 5,933 5,303 5,296 4,991 11,635 11,565 11,733 10,953 13,813 14,306 14,206 15,047 16,000 14,000 12,000 10,000 8,000 6,000 4,000 2,000 Number of SHARCs 0 SHARCs issued (tribal) subsistence fishers (tribal) SHARCs issued (rural) subsistence fishers (rural) SHARCs issued (total) subsistence fishers (total) Figure 6. Number of SHARCs issued and estimated of subsistence halibut fishers by SHARC type,
97 Tribal Rural Total 16% 14% 12% 85 Percentage of SHARC holders 10% 8% 6% 4% 2% 0% Age cohort (years) Figure 7. Age of subsistence halibut registration certificate holders by SHARC type, 2010.
98 ,000 3,500 3,000 3,082 3,552 3,219 3,298 3,294 3,057 3,187 3,020 2, ,000 1,650 1,657 1,729 1,818 1,712 1,669 1,574 1,500 1,185 1, Area 2C Southeast Alaska Area 3A Southcentral Alaska Area 3B Alaska Peninsula Area 4A Eastern Aleutians Area 4B Western Aleutians Area 4C Pribilof Islands Area 4D Central Bering Sea Area 4E East Bering Sea Coast Figure 8. of Alaska subsistence halibut fishers, by regulatory area of tribe or rural community.
99 ,200 1, Number of subsistence halibut fishers Average, 421 Average, 262 Average, 255 Average, 245 Average, 237 Average, 203 Average, 120 Average, 110 Average, 100 Average, 95 Average, 92 Average, 83 Average, 80 Average, 70 Average, 67 Average, 65 Average, 57 Average, 876 Average,, Figure 9. of subsistence halibut fishers by place of residence, , communities with 50 or more fishers in
100 ,000 27,965 37,745 50,656 54,088 51,057 43,239 31,518 23,733 20,727 27,421 35,185 27,562 16,028 18,960 17,400 14,477 2,472 1,865 1,791 2,286 1,461 2,100 1, ,756 9,227 9,783 8,343 14,990 5,657 7,280 10,859 4,380 10,923 5,813 8,297 7,810 3, ,270 54,458 31,328 50,488 71,219 47,583 15,036 11,083 12, , , , , , , , , , , , , , , , , , , , , ,000 Pounds net weight 200, ,000 0 Area 2C Southeast Alaska Area 3A Southcentral Alaska Area 3B Alaska Peninsula Area 4A Eastern Aleutians Area 4B Western Aleutians Area 4C Pribilof Islands Area 4D Central Bering Sea Area 4E East Bering Sea Coast Figure 10. subsistence halibut harvests, pounds net weight, by regulatory area of tribe and rural community,
101 322, , , , , , , , , , , , , , , , ,988 1,041,330 1,193,161 1,178,222 1,125,312 1,032, , , ,400,000 1,200,000 1,000, , ,000 Pounds net weight 400, ,000 0 Tribal SHARC holders Rural resident SHARC holders All SHARC holders Figure 11. Alaska subsistence halibut harvests in pounds net weight by SHARC type,
102 40% 36.0% 35% 30% 90 Percentage of total pounds harvested 25% 20% 15% 10% 10.8% 9.8% 7.3% 5% 5.1% 5.0% 4.3% 3.7% 3.4% 3.3% 2.9% 2.8% 2.8% 2.7% 0% Central Council THI Ketchikan Hydaburg Sitka Sun'aq Tribe of Kodiak Metlakatka Port Graham Hoonah St. Paul Angoon Ninilchik Yakutat Kenaitze All other tribes Figure 12. Percentage of tribal subsistence halibut harvest by tribe, 2010.
103 35% 30% 30.7% 91 Percentage of total pounds harvested 25% 20% 15% 14.3% 18.7% 10% 8.9% 5% 5.5% 4.9% 4.8% 4.4% 2.9% 2.4% 2.3% 0% Kodiak Sitka Petersburg Wrangell Cordova Craig Haines Seldovia Thorne Bay Unalaska All other rural communities Figure 13. Percentage of rural community subsistence halibut harvest by community, 2010.
104 Area 4A East Aleutians 1.8% Area 3B Alaska Peninsula 2.9% Area 4B West Aleutians 0.1% Area 4C Pribilofs 1.4% Area 4D Central Bering Sea 0.1% Area 4E East Bering Sea Coast 1.3% 92 Area 3A Southcentral 39.2% Area 2C Southeast 53.3% N= 797,560 pounds net weight Figure 14. Percentage of subsistence halibut harvest by regulatory area fished, 2010.
105 300, , pounds net weight 200, , ,000 50,000 0 Figure 15. Alaska subsistence halibut harvests by geographic area, 2010.
106 Prince William Sound 5.3% All other areas 8.6% Cook Inlet 8.3% Southern Southeast Alaska 31.9% YK Delta and Bristol Bay 1.2% 94 Kodiak Island Other 10.5% Sitka LAMP Area 9.7% Kodiak Island Road System 12.9% Northern Southeast Alaska 11.7% N = 797,560 pounds net weight Figure 16. Percentage of Alaska subsistence halibut harvest by geographic area, 2010.
107 27,477 33,519 46,225 48,547 47,748 42,248 25,492 23,009 21,197 28,877 35,615 27,062 14,946 19,553 33,499 14,548 2, ,351 2,761 1,997 4,737 1, ,881 9,734 7,716 8,527 15,077 5,657 6,323 10, , , , , , , , , , , , , , , , ,650 4,380 10,923 5,848 8,297 3,204 3, ,171 53,775 28,501 54,119 70,743 52,135 15,898 8,749 10, , , , , , , , ,000 0 Area 2C Southeast Alaska Area 3A Southcentral Alaska Area 3B Alaska Peninsula Area 4A Eastern Aleutians Area 4B Western Aleutians Area 4C Pribilof Islands Figure 17. subsistence halibut harvests, pounds net weight, by regulatory area fished, Area 4D Central Bering Sea Area 4E East Bering Sea Coast Pounds net weight 95
108 100% 80% 72% 82% 60% 96 Change in harvest (pounds net weight) 40% 20% 0% -20% -7% -5% -10% 15% -7% -40% -60% -57% -62% -80% Area 2C Southeast Alaska Area 3A Southcentral Alaska Area 3B Area 4A Alaska Peninsula Eastern Aleutians Area 4B Western Aleutians Area 4C Area 4D Pribilof Islands Central Bering Sea Area 4E East Bering Sea Coast Alaska Figure 18. Change in Alaska subsistence halibut harvests from 2009 through 2010 by regulatory area fished.
109 50% 30% 97 Change in harvest (pounds net weight) 10% -10% -30% -24% -14% 0% -24% -50% -41% -44% -70% -80% -78% -75% -90% Area 2C Southeast Alaska Area 3A Southcentral Alaska Area 3B Alaska Peninsula Area 4A Eastern Aleutians Area 4B Western Aleutians Area 4C Pribilof Islands Area 4D Central Bering Sea Area 4E East Bering Sea Coast Alaska Figure 19. Change in Alaska subsistence halibut harvests in 2010 compared to recent 7-year average ( ) by regulatory area fished.
110 Pounds of halibut, net weight, per fisher Area 2C Southeast Alaska Area 3A Southcentral Alaska Area 3B Alaska Peninsula Area 4A Eastern Aleutians Area 4B Western Aleutians Area 4C Pribilof Islands Area 4D Central Bering Sea Area 4E East Bering Sea Coast Alaska Figure 20. Average subsistence harvest of halibut per fisher in Alaska, 2010, by regulatory area, in pounds net weight.
111 Number of halibut per fisher Area 2C Southeast Alaska Area 3A Southcentral Alaska Area 3B Alaska Peninsula Area 4A Eastern Aleutians Area 4B Western Aleutians Area 4C Area 4D Pribilof Islands Central Bering Sea Area 4E East Bering Sea Coast Alaska Figure 21. Average subsistence harvest of halibut per fisher in Alaska, 2010, by regulatory area, in of fish.
112 180, , , , ,000 80,000 60,000 40,000 20,000 0 Kodiak Sitka Petersburg Ketchikan Craig Wrangell Cordova Haines Hydaburg Klawock Seldovia Metlakatla Hoonah Yakutat Juneau Pounds net weight Angoon Anchorage Unalaska Thorne Bay Kake St Paul Island Nanwalek King Cove Sand Point Kenai Port Graham Other Alaska Non-Alaska Figure 22. Alaska subsistence halibut harvests by place of residence,
113 Setline (stationary) gear Hand-operated gear 100% 93% 90% 83% 101 Percentage of subsistence halibut harvest 80% 70% 60% 50% 40% 30% 72% 28% 51% 49% 53% 47% 47% 53% 72% 28% 31% 69% 77% 23% 20% 17% 10% 7% 0% 2C 3A 3B 4A 4B 4C 4D 4E Alaska Regulatory Area Figure 23. Percentage of subsistence halibut harvest by gear type by regulatory area, 2010.
114 45% 40% 40.4% 35% 102 Percentage of fishers using setline gear 30% 25% 20% 15% 10% 10.6% 17.1% 8.2% 5% 0% 0.8% 0.5% 0.3% 0.2% 0.9% 0.5% 0.2% 0.5% 0.0% 5.9% 1.7% 0.2% 0.2% 0.0% 0.4% 0.1% 0.5% 0.1% 0.1% 0.2% 0.3% 0.7% 0.7% 0.4% Number of hooks usually fished 3.1% 0.8% Figure 24. Number of hooks usually fished, percentage of fishers using setline (stationary) gear, Alaska subsistence halibut fishery, 2010.
115 Tribal Rural All Area 2C Area 3A Area 3B Area 4A Area 4B Area 4C Area 4D Area 4E All Figure 25. Average of subsistence fishing trips for halibut by regulatory area and SHARC type, 2010.
116 25% 20% 104 Percentage of responses 15% 10% 5% 0% >20 Number of trips Figure 26. Number of subsistence fishing trips for halibut, 2010.
117 Tribal Rural All Area 2C Area 3A Area 3B Area 4A Area 4B Area 4C Area 4D Area 4E All Figure 27. Average of halibut harvested per subsistence fishing trip by regulatory area and SHARC type, 2010.
118 ,000 12,845 12,000 10,000 9,917 11,486 10,331 9,982 8,958 8,000 7,764 7, Number of rockfish 6,000 4,000 3,548 5,090 3,638 3,977 3,706 3,523 3,242 4,426 2,000 0 Area 2C Southeast Alaska Area 3A Southcentral Alaska , Area 3B Alaska Peninsula Area 4A Eastern Aleutians Area 4B Western Aleutians Area 4C Pribilof Islands Area 4D Central Bering Sea Area 4E East Bering Sea Coast Figure 28. incidental harvests of rockfish in the Alaska subsistence halibut fishery, of fish, by regulatory area fished,
119 Area 4A 3.2% Areas 4B,4C,4D,4E 0.7% Area 3B 1.9% 107 Area 3A 34.4% Area 2C 59.8% N = 12,851 rockfish Figure 29. Percentage of incidental harvest of rockfish by regulatory area fished, 2010.
120 ,000 2,500 2,475 2,241 2,466 1, ,311 1, ,057 2,036 2,000 1,800 Number of lingcod 1,500 1, Area 2C Southeast Alaska Area 3A Southcentral Alaska Area 3B Area 4A Alaska Peninsula Eastern Aleutians Area 4B Western Aleutians Area 4C Pribilof Islands Area 4D Central Bering Sea Area 4E East Bering Sea Coast 3 Figure 30. incidental harvests of lingcod in the Alaska subsistence halibut fishery, of fish, by regulatory area fished,
121 Area 4A 2.1% Area 3B 3.6% Areas 4B,4C,4D,4E 0.8% 109 Area 3A 30.7% Area 2C 62.9% N = 2,864 lingcod Figure 31. Percentage of incidental harvest of lingcod by regulatory area fished, 2010.
122 Noncommercial Harvest Removed from commercial harvest (not available for ) 14,000 12,000 10, Total pounds, net weight 8,000 6,000 Annual average noncommercial harvest, excluding 1989 (7,591 lb) 4,000 2, Figure 32. harvests of halibut for home use, Port Graham.
123 Bycatch 15.4% Wastage 4.5% Subsistence 1.3% 111 Sport 12.1% Commercial 66.8% N = million lb, net weight Figure 33. Halibut removals, Alaska, 2010.
124 Commercial Sport Subsistence Wastage Bycatch 100% 90% 82.2% 80% 112 Percentage of total removals, pounds net weight 70% 60% 50% 40% 30% 20% 10% 0% 68.4% 66.8% 55.7% 55.6% 41.6% 31.6% 16.9% 15.4% 12.1% 8.9% 10.0% 7.4% 5.3% 4.2% 4.8% 4.5% 3.1% 1.0% 2.1% 0.3% 0.2% 0.3% 0.3% 1.3% Area 2C Area 3A Area 3B Area 4 Alaska Regulatory Area Figure 34. Halibut removals in Alaska by regulatory area and removal category, 2010.
125 Tribal SHARCs Rural SHARCs All SHARCs 80% 70% 60% 50% 49.7% % 33.6% 40.1% 33.1% 30% 24.2% 26.9% 20% 10% 0% Percentage of SHARCs that expired Percentage of SHARCs that fished that expired Figure 35. Percentage of SHARC holders, and SHARC holders who fished for halibut, who did not renew their SHARC, by SHARC type, through 2009.
126 50% 45% Never responded Never fished Never harvested Harvest: low (1 to 100 lb) Harvest: medium (101 to 1,000 lb) Harvest: high (> 1,000 lb) 40% 35% 30% 25% % 15% 10% 5% 0% Tribal expired Tribal active Rural expired Rural active All expired All active Figure 36. Percentage of SHARCs that were not renewed by survey response type and SHARC type, through 2009.
127 APPENDICES 115
128 116
129 Appendix A. List of eligible tribes and rural communities, 2003 (from Federal Register). 117
130 118
131 119


132 Appendix B. Letter sent to tribes about the project. 120

133 121
134 Appendix C. Survey instrument. 122
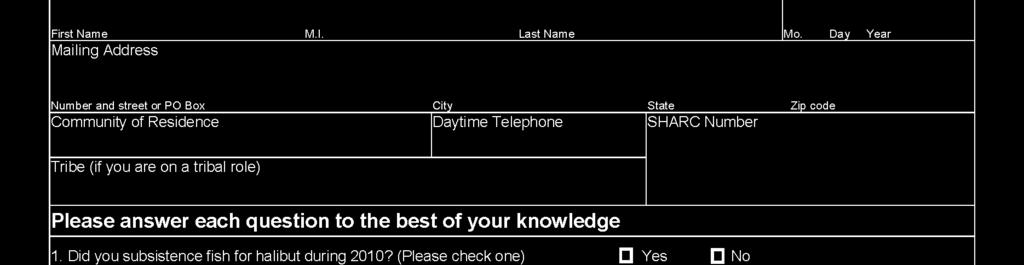
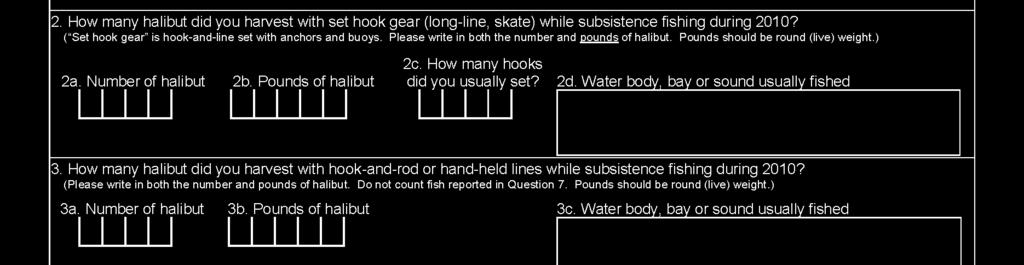
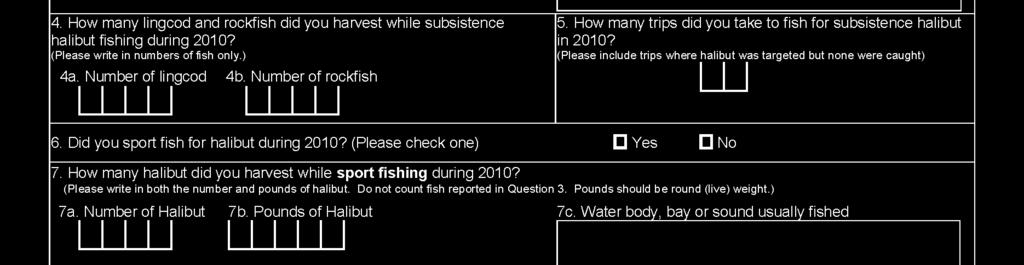
135 123
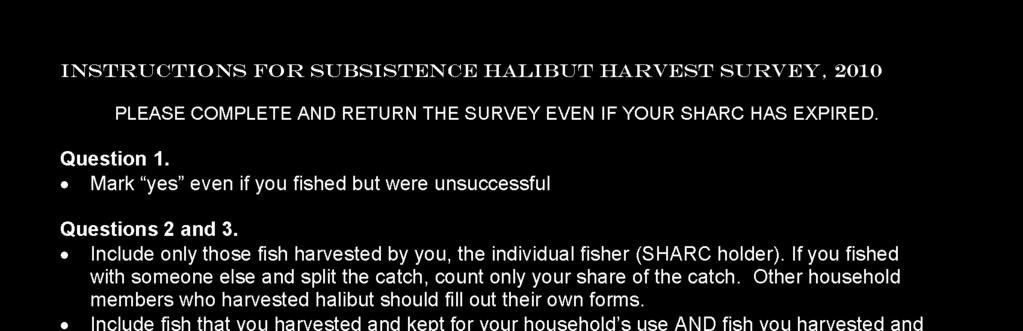
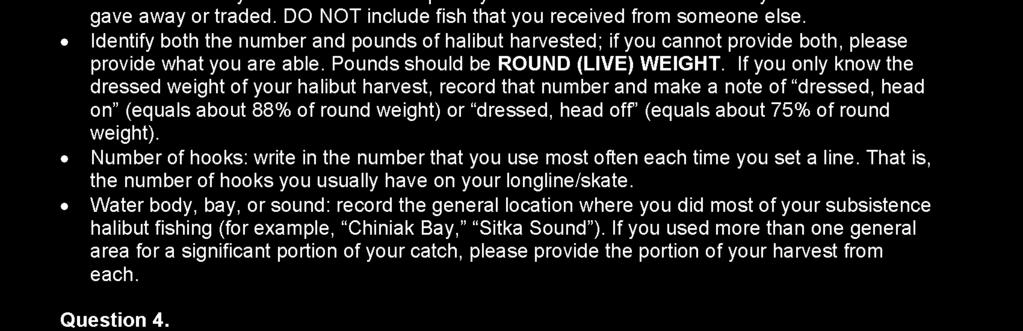
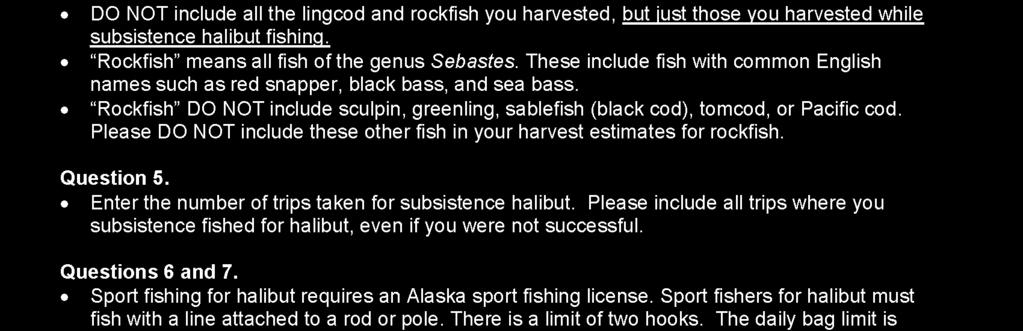
136 124
137 125

138 Appendix D. Set of frequently asked questions and responses. 126
139 127

140 128
141 129 Appendix E. Results from surveys. Appendix E-1. Results from surveys. Return rate Subsistence fished Subsistence harvest Sport fished Sport harvest Lingcod bycatch Rockfish bycatch Regulatory SHARCs Percent Number Percent Number Pounds Number Percent Number Pounds Number Number Number Number Tribal name area issued a respondents respondents halibut halibut b respondents respondents halibut halibut b respondents lingcod respondents rockfish Angoon Community Association 2C % % , % 43 1, Aukquan Traditional Council 2C 1 Central Council Tlingit and Haida 2C % % , % 164 3, Indian Tribes Chilkat Indian Village 2C % % % Chilkoot Indian Association 2C % % 52 2, % Craig Community Association 2C % % 152 4, % Douglas Indian Association 2C % 0 0.0% % Hoonah Indian Association 2C % % 249 7, % Hydaburg Cooperative 2C % % , % Association Ketchikan Indian Corporation 2C % % , % 154 4, Klawock Cooperative Association 2C % % 69 2, % Metlakatla Indian Community, Annette Island 2C % % 268 8, % Reserve Organized Village of Kake 2C % % 165 5, % Organized Village of Kasaan 2C % % % Organized Village of Saxman 2C % % 120 2, % 77 2, Petersburg Indian Association 2C % % 132 2, % Sitka Tribe of Alaska 2C % % , % Skagway Village 2C 3 -continued-
142 Appendix E-1. Page 2 of Tribal name Wrangell Cooperative Association Regulatory area SHARCs issued a Return rate Percent Subsistence fished Number Percent respondents respondents Subsistence harvest Number halibut Pounds halibut b Number respondents Sport fished Sport harvest Lingcod bycatch Rockfish bycatch Percent Number respondents halibut Pounds halibut b Number Number respondents lingcod Number respondents Number rockfish 2C % % 206 6, % 36 1, Subtotal, Area 2C 2,335 1, % % 4, , % , ,565 Kenaitze Indian Tribe 3A % % 173 6, % Lesnoi Village (Woody Island) 3A % % % Afognak 3A % % 65 1, % Akhiok 3A % % % Chenega 3A % % 58 3, % Eyak 3A % % 188 3, % 13 1, Karluk 3A 4 Larsen Bay 3A % % 141 3, % 61 2, Nanwalek 3A % % 337 7, % Ouzinkie 3A % % 72 1, % Port Graham 3A % % , % Port Lions 3A % % 117 2, % 43 1, Tatitlek 3A % % 70 1, % Ninilchik Village 3A % % 971 5, % Seldovia Village Tribe 3A % % 264 6, % Sun'aq Tribe of Kodiak (formerly 3A % % 234 8, % 60 1, Shoonaq') Village of Kanatak 3A % 0 0.0% % Village of Old Harbor 3A % % 52 1, % Village of Salamatoff 3A % % % Yakutat Tlingit Tribe 3A % % 198 6, % Subtotal, Area 3A % % 3,377 74, % 1,221 9, continued-
143 Appendix E-1. Page 3 of Regulatory area SHARCs issued a Return rate Percent Subsistence fished Number Percent respondents respondents Subsistence harvest Number halibut Pounds halibut b Number respondents Sport fished Sport harvest Lingcod bycatch Rockfish bycatch Percent Number respondents halibut Pounds halibut b Number Number respondents lingcod Number respondents Tribal name Agdaagux Tribe of King Cove 3B % % 224 4, % 32 1, Chignik Lake Village 3B % % % Ivanoff Bay Village 3B % % % Belkofski Chignik 3B 5 Number rockfish 3B % % % Chignik Lagoon 3B % % 41 1, % False Pass 3B 1 Nelson Lagoon 3B 3 Perryville 3B % % 71 2, % Unga 3B % % % Pauloff Harbor Village 3B % % 90 1, % Qagan Toyagungin Tribe of Sand Point Village 3B % % 104 2, % Subtotal, Area 3B % % , % 58 2, Akutan 4A % % % Qawalingin Tribe of Unalaska 4A % % % Subtotal, Area 4A % % 67 1, % Atka 4B 5 Subtotal, Area 4B 5 Pribilof Islands Aleut Community of St. 4C % % % George Pribilof Islands Aleut Community of St. Paul 4C % % 150 4, % continued-
144 Appendix E-1. Page 4 of Return rate Subsistence fished Subsistence harvest Sport fished Sport harvest Lingcod bycatch Rockfish bycatch Regulatory SHARCs Percent Number Percent Number Pounds Number Percent Number Pounds Number Number Number Number Tribal name area issued a respondents respondents halibut halibut b respondents respondents halibut halibut b respondents lingcod respondents rockfish Subtotal, Area 4C % % 170 5, % Diomede (Inalik) 4D 1 Gambell 4D 1 Savoonga 4D % % % Subtotal, Area 4D % % % Chevak Native Village 4E 3 (Kashunamiut) Chinik Eskimo Community 4E 1 Egegik Village 4E 1 King Island Native Community 4E 1 Levelock Village 4E 1 Manokotak Village 4E 1 Naknek Native Village 4E % 0 0.0% % Aleknagik 4E % 0 0.0% % Brevig Mission 4E 1 Council 4E 4 Dillingham 4E % % % (Curyung) Eek 4E % % % Goodnews Bay 4E 4 2 (Mumtraq) Hooper Bay 4E % % % Kanakanak 4E 1 Kipnuk 4E % % % continued-
145 Appendix E-1. Page 5 of Return rate Subsistence fished Subsistence harvest Sport fished Sport harvest Lingcod bycatch Rockfish bycatch Regulatory SHARCs Percent Number Percent Number Pounds Number Percent Number Pounds Number Number Number Number Tribal name area issued a respondents respondents halibut halibut b respondents respondents halibut halibut b respondents lingcod respondents rockfish Kongiganak 4E 5 Koyuk 4E 1 Kwigillingok 4E 4 Kwinhagak 4E 3 Mekoryuk 4E % % % Nightmute 4E 1 Scammon Bay 4E 3 Shaktoolik 4E 1 Toksook Bay 4E % % 105 1, % (Nunakauyak) Tununak 4E % % % Unalakleet 4E 3 Wales 4E 1 Newtok Village 4E 1 Nome Eskimo Community 4E % % % Orutsararmuit Native Village 4E % % % South Naknek Village 4E 1 Stebbins Community Association 4E 4 Traditional Village of Togiak 4E 3 Twin Hills Village 4E 1 Ugashik Village 4E 2 Village of Chefornak 4E % % % continued-
146 Appendix E-1. Page 6 of Regulatory area SHARCs issued a Return rate Percent Subsistence fished Number Percent respondents respondents Subsistence harvest Number halibut Pounds halibut b Number respondents Sport fished Sport harvest Lingcod bycatch Rockfish bycatch Percent Number respondents halibut Pounds halibut b Number Number respondents lingcod Number respondents Tribal name Village of Clark's Point 4E 1 Village of Kotlik 4E 1 Subtotal, Area 4E % % 369 6, % 51 1, Tribal name Number rockfish 3,906 2, % % 9, , % 1,896 27, ,680 subtotals Rural Angoon 2C % % 285 8, % Coffman Cove 2C % % 109 2, % 104 1, Craig 2C % % , % 347 6, Edna Bay 2C % % 78 2, % Elfin Cove 2C % % % Gustavus 2C % % 94 2, % 89 2, Haines 2C % % , % 111 3, Hollis 2C % % 99 5, % Hoonah 2C % % 307 6, % 93 1, Hydaburg 2C % % 43 1, % Hyder 2C % % 51 1, % Juneau 2C 3 Kake 2C % % 140 6, % 27 1, Kasaan 2C % % % Ketchikan 2C 5 Klawock 2C % % 417 9, % 160 3, Klukwan 2C 2 Meyers Chuck 2C % % 34 1, % Metlakatla 2C % % 69 2, % Naukati Bay 2C % % 41 1, % 57 2, Pelican 2C % % 87 2, % Petersburg 2C % % 1,895 45, % , Port Alexander 2C % % 84 3, % Port Protection 2C % % 78 2, % Pt. Baker 2C % % % Saxman 2C % % 170 1, % Sitka 2C 1, % % 2,228 64, % 336 8, ,587 -continued-
147 Appendix E-1. Page 7 of Return rate Subsistence fished Subsistence harvest Sport fished Sport harvest Lingcod bycatch Rockfish bycatch Regulatory SHARCs Percent Number Percent Number Pounds Number Percent Number Pounds Number Number Number Number Tribal name area issued a respondents respondents halibut halibut b respondents respondents halibut halibut b respondents lingcod respondents rockfish Skagway 2C % % 62 1, % Tenakee Springs 2C % % 122 3, % Thorne Bay 2C % % , % 221 4, Ward Cove 2C 2 Whale Pass 2C % % % Wrangell 2C % % 1,023 28, % 142 4, Subtotal, Area 2C 4,420 3, % 1, % 9, , % 2,400 55, ,686 Chenega Bay 3A % % 57 1, % Chiniak 3A 3 Cordova 3A % % , % 180 5, Karluk 3A % % % Kodiak 3A 1, % % 4, , % 1,327 34, ,128 Larsen Bay 3A % 0 0.0% % Nanwalek 3A % % 232 5, % Old Harbor 3A % % 82 1, % Ouzinkie 3A % % 50 1, % Port Graham 3A % % 86 1, % Port Lions 3A % % 65 1, % 70 1, Seldovia 3A % % , % 150 3, Tatitlek 3A % % % Yakutat 3A % % 225 8, % 44 1, Subtotal, Area 3A 2,348 1, % % 7, , % 1,831 46, ,599 Chignik 3B 1 Chignik Lagoon 3B 1 Chignik Lake 3B 1 Cold Bay 3B % % 147 3, % False Pass 3B 1 King Cove 3B % % 67 1, % Nelson Lagoon 3B 1 Perryville 3B 1 Sand Point 3B % % % Subtotal, Area 3B % % 246 6, % continued-
148 Appendix E-1. Page 8 of Return rate Subsistence fished Subsistence harvest Sport fished Sport harvest Lingcod bycatch Rockfish bycatch Regulatory SHARCs Percent Number Percent Number Pounds Number Percent Number Pounds Number Number Number Number Tribal name area issued a respondents respondents halibut halibut b respondents respondents halibut halibut b respondents lingcod respondents rockfish Unalaska 4A % % , % 141 2, Subtotal, Area 4A % % , % 141 2, Adak 4B 5 Subtotal, Area 4B 5 St. George Island 4C 1 Subtotal, Area 4C 1 Aleknagik 4E 2 Bethel 4E 1 Chefornak 4E 1 Dillingham 4E % 1 5.9% % Egegik 4E 1 King Salmon 4E 2 Kongiganak 4E 1 Manokotak 4E 2 Naknek 4E % % % Nightmute 4E 1 Nome 4E % % % Port Heiden 4E 3 Quinhagak 4E 1 South Naknek 4E 1 Teller 4E % 0 0.0% % Togiak 4E 1 Subtotal, Area 4E % % % Rural community subtotals 7,047 4, % 2, % 17, ,843 1, % 4, , , ,548 Total (tribal and rural) 10,953 6, % 3, % 26, ,994 1, % 6, , , ,228 -continued-
149 Appendix E-1. Page 9 of Return rate Subsistence fished Subsistence harvest Sport fished Sport harvest Lingcod bycatch Rockfish bycatch Regulatory SHARCs Percent Number Percent Number Pounds Number Percent Number Pounds Number Number Number Number Community name area issued a respondents respondents halibut halibut b respondents respondents halibut halibut b respondents lingcod respondents rockfish Adak AK % % % Akhiok AK % % % Akiachak AK 1 Akutan AK % % % Aleknagik AK 3 Anchor Point AK % % % Anchorage AK % % , % 88 2, Angoon AK % % , % 63 1, Atka AK 1 Auke Bay AK 5 Barrow AK 1 Bethel AK % % % Chefornak AK % % % Chenega Bay AK % % 72 3, % Chevak AK 2 Chignik AK % % % Chignik Lagoon AK % % % Chignik Lake AK 4 Chiniak AK % % 110 2, % Chugiak AK 3 Clarks Point AK 1 Coffman Cove AK % % 103 2, % 73 1, Cold Bay AK % % 158 3, % Cordova AK % % 1,108 28, % 174 5, Craig AK % % 1,333 35, % 359 6, Dillingham AK % 1 5.3% % Douglas AK % % % Dutch Harbor AK % % 335 8, % 122 2, Eagle River AK % % % Edna Bay AK % % 60 1, % Eek AK % % % Egegik AK 1 Elfin Cove AK % % % continued-
150 Appendix E-1. Page 10 of Return rate Subsistence fished Subsistence harvest Sport fished Sport harvest Lingcod bycatch Rockfish bycatch Regulatory SHARCs Percent Number Percent Number Pounds Number Percent Number Pounds Number Number Number Number Community name area issued a respondents respondents halibut halibut b respondents respondents halibut halibut b respondents lingcod respondents rockfish Elmendorf AFB AK 1 Ester AK 1 Fairbanks AK % % % False Pass AK 1 Fritz Creek AK 1 Gakona AK 1 Gambell AK 1 Girdwood AK 1 Glennallen AK 1 Golovin AK 1 Goodnews Bay AK 4 Gustavus AK % % 87 2, % 71 1, Haines AK % % , % 66 1, Hollis AK 1 Homer AK % % 125 1, % Hoonah AK % % , % 98 2, Hooper Bay AK % % % Hydaburg AK % % , % Hyder AK % % 51 1, % Juneau AK % % , % 128 3, Kake AK % % , % Karluk AK % % % Kasaan AK % % % Kasilof AK % % 124 2, % Kenai AK % % 138 5, % 38 1, Ketchikan AK % % 1,333 36, % 332 9, King Cove AK % % 268 6, % King Salmon AK 2 Kipnuk AK % % % Klawock AK % % , % 155 3, Klukwan AK 2 Kodiak AK 1, % % 4, , % 1,387 37, ,231 Kongiganak AK % % % continued-
151 Appendix E-1. Page 11 of Return rate Subsistence fished Subsistence harvest Sport fished Sport harvest Lingcod bycatch Rockfish bycatch Regulatory SHARCs Percent Number Percent Number Pounds Number Percent Number Pounds Number Number Number Number Community name area issued a respondents respondents halibut halibut b respondents respondents halibut halibut b respondents lingcod respondents rockfish Kotzebue AK 1 Kwigillingok AK 3 Larsen Bay AK % % 96 2, % 36 1, Manokotak AK 2 Mekoryuk AK 5 Metlakatla AK % % , % Meyers Chuck AK % % 34 1, % Naknek AK % % % Nanwalek AK % % , % Naukati AK % % 92 2, % Nelson Lagoon AK 1 Newtok AK 1 Nightmute AK 2 Nikiski AK % 0 0.0% % Ninilchik AK % % 99 2, % Nome AK % % % North Pole AK 4 Old Harbor AK % % 139 3, % Ouzinkie AK % % 109 2, % Palmer AK % % % Pelican AK % % 127 3, % Perryville AK % % 68 1, % Petersburg AK % % 2,021 48, % , Pilot Point AK 2 Point Baker AK % % 60 1, % Port Alexander AK % % 119 4, % Port Graham AK % % 318 5, % Port Heiden AK 2 Port Lions AK % % 181 3, % 113 2, Port Protection AK 2 Port William AK 1 Quinhagak AK 5 Sand Point AK % % 213 4, % continued-
152 Appendix E-1. Page 12 of Return rate Subsistence fished Subsistence harvest Sport fished Sport harvest Lingcod bycatch Rockfish bycatch Regulatory SHARCs Percent Number Percent Number Pounds Number Percent Number Pounds Number Number Number Number Community name area issued a respondents respondents halibut halibut b respondents respondents halibut halibut b respondents lingcod respondents rockfish Savoonga AK % % % Saxman AK % 0 0.0% % Seldovia AK % % , % 127 2, Seward AK % % % Sitka AK 1,635 1, % % 2,532 73, % 336 8, ,801 Skagway AK % % 74 2, % Soldotna AK % % 904 2, % St. George Island AK 4 St. Paul Island AK % % 150 4, % Sterling AK 4 Tatitlek AK % % 76 1, % Teller AK % 0 0.0% % Tenakee Springs AK % % 122 3, % Thorne Bay AK % % , % 219 4, Togiak AK 4 Toksook Bay AK % % 105 1, % Trapper Creek AK 1 Tununak AK % % % Twin Hills AK 2 Unalakleet AK 1 Unalaska AK % % 188 3, % Valdez AK % % 42 1, % Ward Cove AK % % % Wasilla AK % % % Whale Pass AK % % % Whittier AK 2 Willow AK 2 Wrangell AK % % 1,289 35, % 175 5, Yakutat AK % % , % 44 1, Alaska subtotal All 10,804 6, % 3, % 26, ,596 1, % 5, , , ,223 Non-Alaska subtotal All % 4 5.3% % 142 3, Total All 10,953 6, % 3, % 26, ,994 1, % 5, , , ,228 a. To protect confidentiality, data for tribes and communities with 5 or fewer SHARCs issued are not reported in this table. Subtotals include all tribes and communities. Blank cells indicate redacted data. b. Pounds of halibut are reported in round weight.
153 Appendix E-2. Harvests by return category. 141 First mailing response Second mailing response Third mailing response Staff administered Number Mean, Number Mean, Number Mean, Number Mean, Number of those Number of those Number of those Number of those Regulatory Number subsistence halibut Mean, all who Number subsistence halibut Mean, all who Number subsistence halibut Mean, all who Number subsistence halibut Mean, all who Tribal name area a fished harvested fished fished harvested fished fished harvested fished fished harvested fished Angoon Community Association 2C Aukquan Traditional Council 2C Central Council Tlingit and Haida Indian 2C Tribes Chilkat Indian Village 2C Chilkoot Indian Association 2C Craig Community Association 2C Douglas Indian Association 2C Hoonah Indian Association 2C Hydaburg Cooperative Association 2C Ketchikan Indian Corporation 2C Klawock Cooperative Association 2C Metlakatla Indian Community, Annette 2C Island Reserve Organized Village of Kake 2C Organized Village of Kasaan 2C Organized Village of Saxman 2C Petersburg Indian Association 2C Sitka Tribe of Alaska 2C Skagway Village 2C Wrangell Cooperative Association 2C Subtotal, Area 2C , , Kenaitze Indian Tribe 3A Lesnoi Village (Woody Island) 3A Afognak 3A continued-
154 Appendix E-2. Page 2 of First mailing response Second mailing response Third mailing response Staff administered Number Mean, Number Mean, Number Mean, Number Mean, Number of those Number of those Number of those Number of those Regulatory Number subsistence halibut Mean, all who Number subsistence halibut Mean, all who Number subsistence halibut Mean, all who Number subsistence halibut Mean, all who Tribal name area a fished harvested fished fished harvested fished fished harvested fished fished harvested fished Akhiok 3A Chenega 3A Eyak 3A Karluk 3A Larsen Bay 3A Nanwalek 3A Ouzinkie 3A Port Graham 3A Port Lions 3A Tatitlek 3A Ninilchik Village 3A Seldovia Village Tribe 3A Sun'aq Tribe of Kodiak (formerly Shoonaq') 3A Village of Kanatak 3A Village of Old Harbor 3A Village of Salamatoff 3A Yakutat Tlingit Tribe 3A Subtotal, Area 3A , Agdaagux Tribe of King 3B Cove Chignik Lake Village 3B Ivanoff Bay Village 3B Belkofski 3B Chignik 3B Chignik Lagoon 3B False Pass 3B -continued-
155 Appendix E-2. Page 3 of 12. First mailing response Second mailing response Third mailing response Staff administered Number Mean, Number Mean, Number Mean, Number Mean, Number of those Number of those Number of those Number of those Regulatory Number subsistence halibut Mean, all who Number subsistence halibut Mean, all who Number subsistence halibut Mean, all who Number subsistence halibut Mean, all who Tribal name area a fished harvested fished fished harvested fished fished harvested fished fished harvested fished Nelson Lagoon 3B Perryville 3B Unga 3B Pauloff Harbor Village 3B Qagan Toyagungin Tribe of Sand Point Village 3B Subtotal, Area 3B Akutan 4A Qawalingin Tribe of 4A Unalaska Subtotal, Area 4A Atka 4B 143 Subtotal, Area 4B Pribilof Islands Aleut Community of St George Pribilof Islands Aleut Community of St Paul 4C C Subtotal, Area 4C Diomede (Inalik) Gambell Savoonga 4D 4D 4D Subtotal, Area 4D Chevak Native Village (Kashunamiut) Chinik Eskimo Community King Island Native Community 4E 4E 4E -continued-
156 Appendix E-2. Page 4 of Regulatory Number Tribal name area a Levelock Village 4E Manokotak Village 4E First mailing response Second mailing response Third mailing response Staff administered Number subsistence fished Number of halibut harvested Mean, those Mean, all who Number fished Number subsistence fished Number of halibut harvested Mean, those Mean, all who Number fished Number subsistence fished Number of halibut harvested Mean, all Mean, those who fished Number Number subsistence fished Number of halibut harvested Mean, those Mean, all who fished Naknek Native Village 4E Aleknagik 4E Brevig Mission 4E Council 4E Dillingham (Curyung) 4E Eek 4E Goodnews Bay 4E (Mumtraq) Hooper Bay 4E Kanakanak 4E Kipnuk 4E Kongiganak 4E Koyuk 4E Kwigillingok 4E Kwinhagak 4E Mekoryuk 4E Nightmute 4E Scammon Bay 4E Shaktoolik 4E Toksook Bay 4E (Nunakauyak) Tununak 4E Unalakleet 4E -continued-
157 Appendix E-2. Page 5 of 12. Regulatory Number Tribal name area a Wales 4E First mailing response Second mailing response Third mailing response Staff administered Number subsistence fished Number of halibut harvested Mean, those Mean, all who Number fished Number subsistence fished Number of halibut harvested Mean, those Mean, all who Number fished Number subsistence fished Number of halibut harvested Mean, all Mean, those who fished Number Number subsistence fished Number of halibut harvested Mean, those Mean, all who fished Newtok Village 4E Nome Eskimo Community 4E Orutsararmuit Native Village 4E South Naknek Village 4E Stebbins Community Association 4E Traditional Village of Togiak 4E Twin Hills Village 4E Ugashik Village 4E Village of Chefornak 4E Village of Clark's Point 4E Village of Kotlik 4E 145 Subtotal, 4E Tribal subtotals 1, , , , continued-
158 Appendix E-2. Page 6 of First mailing response Second mailing response Third mailing response Staff administered Number Mean, Number Mean, Number Mean, Number Mean, Number of those Number of those Number of those Number of those Regulatory Number subsistence halibut Mean, all who Number subsistence halibut Mean, all who Number subsistence halibut Mean, all who Number subsistence halibut Mean, all who Rural community area a fished harvested fished fished harvested fished fished harvested fished fished harvested fished Angoon 2C Coffman Cove 2C Craig 2C Edna Bay 2C Elfin Cove 2C Gustavus 2C Haines 2C Hollis 2C Hoonah 2C Hydaburg 2C Hyder 2C Juneau 2C Kake 2C Kasaan 2C Ketchikan 2C Klawock 2C Klukwan 2C Metlakatla 2C Meyers Chuck 2C Naukati Bay 2C Pelican 2C Petersburg 2C , Port Alexander 2C Port Protection 2C Pt. Baker 2C Saxman 2C Sitka 2C , Skagway 2C Tenakee Springs 2C Thorne Bay 2C Ward Cove 2C Whale Pass 2C continued-
159 Appendix E-2. Page 7 of 12. First mailing response Second mailing response Third mailing response Staff administered Number Mean, Number Mean, Number Mean, Number Mean, Number of those Number of those Number of those Number of those Regulatory Number subsistence halibut Mean, all who Number subsistence halibut Mean, all who Number subsistence halibut Mean, all who Number subsistence halibut Mean, all who Rural community area a fished harvested fished fished harvested fished fished harvested fished fished harvested fished Wrangell 2C Subtotal, Area 2C 2,492 1,320 8, , Chenega Bay 3A Chiniak 3A Cordova 3A Karluk 3A Kodiak 3A , Larsen Bay 3A Nanwalek 3A Old Harbor 3A Ouzinkie 3A Port Graham 3A Port Lions 3A Seldovia 3A Tatitlek 3A Yakutat 3A Subtotal, Area 3A 1, , , Chignik 3B Chignik Lagoon 3B Chignik Lake 3B Cold Bay 3B False Pass 3B King Cove 3B Nelson Lagoon 3B Perryville 3B Sand Point 3B Subtotal, Area 3B Unalaska 4A Subtotal, Area 4A continued-
160 Appendix E-2. Page 8 of 12. Regulatory Number Rural community area a Adak 4B Subtotal, Area 4B St. George Island 4C Subtotal, Area 4C First mailing response Second mailing response Third mailing response Staff administered Number subsistence fished Number of halibut harvested Mean, those Mean, all who Number fished Number subsistence fished Number of halibut harvested Mean, those Mean, all who Number fished Number subsistence fished Number of halibut harvested Mean, all Mean, those who fished Number Number subsistence fished Number of halibut harvested Mean, those Mean, all who fished 148 Aleknagik 4E Bethel 4E Chefornak 4E Dillingham 4E Egegik 4E King Salmon 4E Kongiganak 4E Manokotak 4E Naknek 4E Nightmute 4E Nome 4E Port Heiden 4E Quinhagak 4E South Naknek 4E Teller 4E Togiak 4E Subtotal, Area 4E Rural community subtotal 3,817 2,018 14, , Total (tribal and rural) 5,188 2,590 21, , , , continued-
161 Appendix E-2. Page 9 of First mailing response Second mailing response Third mailing response Staff administered Number Mean, Number Mean, Number Mean, Number Mean, Number of those Number of those Number of those Number of those Regulatory Number subsistence halibut Mean, all who Number subsistence halibut Mean, all who Number subsistence halibut Mean, all who Number subsistence halibut Mean, all who City area a fished harvested fished fished harvested fished fished harvested fished fished harvested fished Adak AK Akhiok AK Akiachak AK Akutan AK Aleknagik AK Anchor Point AK Anchorage AK Angoon AK Atka AK Auke Bay AK Barrow AK Bethel AK Chefornak AK Chenega Bay AK Chevak AK Chignik AK Chignik Lagoon AK Chignik Lake AK Chiniak AK Chugiak AK Clarks Point AK Coffman Cove AK Cold Bay AK Cordova AK Craig AK , Dillingham AK Douglas AK Dutch Harbor AK Eagle River AK Edna Bay AK Eek AK Egegik AK Elfin Cove AK continued-
162 Appendix E-2. Page 10 of Regulatory Number City area a Elmemdorf AFB AK Ester AK First mailing response Second mailing response Third mailing response Staff administered Number subsistence fished Number of halibut harvested Mean, those Mean, all who Number fished Number subsistence fished Number of halibut harvested Mean, those Mean, all who Number fished Number subsistence fished Number of halibut harvested Mean, all Mean, those who fished Number Number subsistence fished Number of halibut harvested Mean, those Mean, all who fished Fairbanks AK False Pass AK Fritz Creek AK Gakona AK Gambell AK Girdwood AK Glennallen AK Golovin AK Goodnews Bay AK Gustavus AK Haines AK Hollis AK Homer AK Hoonah AK Hooper Bay AK Hydaburg AK Hyder AK Juneau AK Kake AK Karluk AK Kasaan AK Kasilof AK Kenai AK Ketchikan AK King Cove AK King Salmon AK Kipnuk AK Klawock AK Klukwan AK Kodiak AK , Kongiganak AK continued-
163 Appendix E-2. Page 11 of Regulatory Number City area a Kotzebue AK Kwigillingok AK First mailing response Second mailing response Third mailing response Staff administered Number subsistence fished Number of halibut harvested Mean, those Mean, all who Number fished Number subsistence fished Number of halibut harvested Mean, those Mean, all who Number fished Number subsistence fished Number of halibut harvested Mean, all Mean, those who fished Number Number subsistence fished Number of halibut harvested Mean, those Mean, all who fished Larsen Bay AK Manokotak AK Mekoryuk AK Metlakatla AK Meyers Chuck AK Naknek AK Nanwalek AK Naukati AK Nelson Lagoon AK Newtok AK Nightmute AK Nikiski AK Ninilchik AK Nome AK North Pole AK Old Harbor AK Ouzinkie AK Palmer AK Pelican AK Perryville AK Petersburg AK , Pilot Point AK Point Baker AK Port Alexander AK Port Graham AK Port Heiden AK Port Lions AK Port Protection AK Port William AK Quinhagak AK Sand Point AK continued-
164 Appendix E-2. Page 12 of First mailing response Second mailing response Third mailing response Staff administered Number Mean, Number Mean, Number Mean, Number Mean, Number of those Number of those Number of those Number of those Regulatory Number subsistence halibut Mean, all who Number subsistence halibut Mean, all who Number subsistence halibut Mean, all who Number subsistence halibut Mean, all who City area a fished harvested fished fished harvested fished fished harvested fished fished harvested fished Savoonga AK Saxman AK Seldovia AK Seward AK Sitka AK , Skagway AK Soldotna AK St. George Island AK St. Paul Island AK Sterling AK Tatitlek AK Teller AK Tenakee Springs AK Thorne Bay AK Togiak AK Toksook Bay AK Trapper Creek AK Tununak AK Twin Hills AK Unalakleet AK Unalaska AK Valdez AK Ward Cove AK Wasilla AK Whale Pass AK Whittier AK Willow AK Wrangell AK , Yakutat AK Subtotal, Alaska 5,123 2,586 21, , , , Subtotal, non-alaska Total 5,188 2,590 21, , , , a. To protect confidentiality, data for tribes and communities with 5 or fewer SHARCs issued are not reported in this table. Subtotals include all tribes and communities. Blank cells indicate redacted data.
165 Appendix E-3. subsistence harvests of halibut by gear type. 153 Tribal name Angoon Community Association Aukquan Traditional Council Central Council Tlingit and Haida Indian Tribes Chilkat Indian Village Chilkoot Indian Association Craig Community Association Douglas Indian Association Hoonah Indian Association Hydaburg Cooperative Association Ketchikan Indian Corporation Klawock Cooperative Association Metlakatla Indian Community, Annette Island Reserve Organized Village of Kake Organized Village of Kasaan Organized Village of Saxman Petersburg Indian Association Regulatory area Number of SHARCs issued a Set hook gear Hook and line or handline All gear respondents fished halibut harvested pounds halibut harvested respondents fished halibut harvested pounds halibut harvested respondents fished halibut harvested Confidence interval for of halibut pounds halibut harvested Confidence interval for pounds of halibut 2C , % 9, % 2C 1 2C ,642 28, , , % 33, % 2C % % 2C , % 3, % 2C , % 5, % 2C % 0 0.0% 2C , , % 10, % 2C , , % 22, % 2C ,156 24, , , % 30, % 2C , % 4, % 2C , % 13, % 2C , % 5, % 2C % % 2C , % 3, % 2C , , % 3, % -continued-
166 Appendix E-3. Page 2 of Number of SHARCs issued a respondents fished Set hook gear Hook and line or handline All gear Confidence pounds pounds interval for halibut halibut respondents halibut halibut respondents halibut of harvested harvested fished harvested harvested fished harvested halibut pounds halibut harvested Confidence interval for pounds of halibut Regulatory Tribal name area Sitka Tribe of Alaska 2C , , % 15, % Skagway Village 2C 3 Wrangell Cooperative Association 2C , % 6, % Subtotal, Area 2C 2, , , ,319 21, , % 168, % Kenaitze Indian Tribe 3A , , % 8, % Lesnoi Village (Woody Island) 3A % % Afognak 3A , % 1, % Akhiok 3A , % 1, % Chenega 3A , % 5, % Eyak 3A , % 4, % Karluk 3A 4 Larsen Bay 3A , , % 4, % Nanwalek 3A , , % 6, % Ouzinkie 3A , % 2, % Port Graham 3A , , % 11, % Port Lions 3A , % 3, % Tatitlek 3A , % 2, % Ninilchik Village 3A , ,138 6, , % 8, % Seldovia Village Tribe 3A , , % 7, % Sun'aq Tribe of Kodiak (formerly Shoonaq') 3A , , % 15, % Village of Kanatak 3A % 0 0.0% -continued-
167 Appendix E-3. Page 3 of Number of SHARCs issued a respondents fished Set hook gear Hook and line or handline All gear Confidence pounds pounds interval for halibut halibut respondents halibut halibut respondents halibut of harvested harvested fished harvested harvested fished harvested halibut pounds halibut harvested Confidence interval for pounds of halibut Regulatory Tribal name area Village of Old Harbor 3A , % 3, % Village of Salamatoff 3A % % Yakutat Tlingit Tribe 3A , , % 8, % Subtotal, Area 3A ,739 62, ,508 33, , % 95, % Agdaagux Tribe of King Cove 3B , , % 6, % Chignik Lake Village 3B % % Ivanoff Bay Village 3B % % Belkofski 3B 5 Chignik 3B % % Chignik Lagoon 3B % 1, % False Pass 3B 1 Nelson Lagoon 3B 3 Perryville 3B , % 2, % Unga 3B % % Pauloff Harbor Village 3B , , % 3, % Qagan Toyagungin Tribe of Sand Point Village 3B , , % 3, % Subtotal, Area 3B , , , % 17, % Akutan 4A , % 1, % Qawalingin Tribe of Unalaska 4A % 1, % Subtotal, Area 4A , % 3, % -continued-
168 Appendix E-3. Page 4 of Number of SHARCs issued a Regulatory Tribal name area Atka 4B 5 Subtotal, Area 4B 5 Pribilof Islands Aleut Community of St. George Pribilof Islands Aleut Community of St. Paul respondents fished Set hook gear Hook and line or handline All gear Confidence pounds pounds interval for halibut halibut respondents halibut halibut respondents halibut of harvested harvested fished harvested harvested fished harvested halibut pounds halibut harvested Confidence interval for pounds of halibut 4C % % 4C , % 10, % Subtotal, Area 4C , % 10, % Diomede (Inalik) 4D 1 Gambell 4D 1 Savoonga 4D % 1, % Subtotal, Area 4D % 1, % Chevak Native Village (Kashunamiut) 4E 3 Chinik Eskimo Community 4E 1 Egegik Village 4E 1 King Island Native Community 4E 1 Levelock Village 4E 1 Manokotak Village 4E 1 Naknek Native Village 4E % 0 0.0% Aleknagik 4E % 0 0.0% Brevig Mission 4E 1 Council 4E 4 Dillingham (Curyung) 4E % % -continued-
169 Appendix E-3. Page 5 of Number of SHARCs issued a respondents fished Set hook gear Hook and line or handline All gear Confidence pounds pounds interval for halibut halibut respondents halibut halibut respondents halibut of harvested harvested fished harvested harvested fished harvested halibut pounds halibut harvested Confidence interval for pounds of halibut Regulatory Tribal name area Eek 4E , % 1, % Goodnews Bay 4E 4 (Mumtraq) Hooper Bay 4E % % Kanakanak 4E 1 Kipnuk 4E , % 2, % Kongiganak 4E 5 Koyuk 4E 1 Kwigillingok 4E 4 Kwinhagak 4E 3 Mekoryuk 4E % % Nightmute 4E 1 Scammon Bay 4E 3 Shaktoolik 4E 1 Toksook Bay 4E % % (Nunakauyak) Tununak 4E % % Unalakleet 4E 3 Wales 4E 1 Newtok Village 4E 1 4E % % Nome Eskimo Community -continued-
170 Appendix E-3. Page 6 of Regulatory area Number of SHARCs issued a Tribal name Orutsararmuit Native Village South Naknek Village 4E 1 Stebbins Community 4E 4 Association Traditional Village of Togiak 4E 3 Twin Hills Village 4E 1 Ugashik Village 4E 2 Village of Set hook gear Hook and line or handline All gear respondents fished halibut harvested pounds halibut harvested respondents fished halibut harvested pounds halibut harvested respondents fished halibut harvested Confidence interval for of halibut pounds halibut harvested Confidence interval for pounds of halibut 4E % % 4E , % 1, % Chefornak Village of Clark's Point 4E 1 Village of Kotlik 4E 1 Subtotal, Area 4E , , % 11, % Tribal SHARC subtotal All regulatory areas 3,906 1,143 12, , ,247 74,585 1,502 17, % 308, % -continued-
171 Appendix E-3. Page 7 of Number of SHARCs issued a respondents fished Set hook gear Hook and line or handline All gear Confidence pounds pounds interval for halibut halibut respondents halibut halibut respondents halibut of harvested harvested fished harvested harvested fished harvested halibut pounds halibut harvested Confidence interval for pounds of halibut Regulatory Rural community area Angoon 2C , , % 5, % Coffman Cove 2C , , % 2, % Craig 2C ,165 20, , , % 23, % Edna Bay 2C , % 2, % Elfin Cove 2C % % Gustavus 2C , % 2, % Haines 2C ,007 20, , , % 21, % Hollis 2C , % 4, % Hoonah 2C , , % 5, % Hydaburg 2C , % 1, % Hyder 2C , % 1, % Juneau 2C 3 Kake 2C , % 5, % Kasaan 2C % % Ketchikan 2C 5 Klawock 2C , , % 9, % Klukwan 2C 2 Metlakatla 2C , % 2, % Meyers Chuck 2C , % 1, % Naukati Bay 2C , % 1, % Pelican 2C , % 2, % Petersburg 2C ,784 31, , , % 43, % Port Alexander 2C , % 3, % Port Protection 2C , % 2, % Pt. Baker 2C % % Saxman 2C , % 2, % Sitka 2C 1, ,933 62, , , % 69, % Skagway 2C , % 1, % Tenakee Springs 2C , % 2, % Thorne Bay 2C , , % 11, % Ward Cove 2C 2 Whale Pass 2C % % Wrangell 2C ,045 20, , , % 26, % Subtotal, Area 2C 4,420 1,887 10, , ,218 50,117 2,161 13, % 261, % Chenega Bay 3A % % Chiniak 3A 3 Cordova 3A , , , % 24, % Karluk 3A % % Kodiak 3A 1, , , ,739 34, , % 150, % -continued-
172 Appendix E-3. Page 8 of Number of SHARCs issued a respondents fished Set hook gear Hook and line or handline All gear Confidence pounds pounds interval for halibut halibut respondents halibut halibut respondents halibut of harvested harvested fished harvested harvested fished harvested halibut pounds halibut harvested Confidence interval for pounds of halibut Regulatory Rural community area Larsen Bay 3A % 0 0.0% Nanwalek 3A , % 3, % Old Harbor 3A % 1, % Ouzinkie 3A % 1, % Port Graham 3A , % 2, % Port Lions 3A % 1, % Seldovia 3A , , , % 14, % Tatitlek 3A % % Yakutat 3A , , % 7, % Subtotal, Area 3A 2, , , ,961 53,382 1,202 11, % 208, % Chignik 3B 1 Chignik Lagoon 3B 1 Chignik Lake 3B 1 Cold Bay 3B , % 2, % False Pass 3B 1 King Cove 3B , % 2, % Nelson Lagoon 3B 1 Perryville 3B 1 Sand Point 3B , % 1, % Subtotal, Area 3B , , % 6, % Unalaska 4A , , % 11, % Subtotal, Area 4A , , % 11, % Adak 4B 5 Subtotal, Area 4B 5 St. George Island 4C 1 Subtotal, Area 4C 1 Aleknagik 4E 2 Bethel 4E 1 Chefornak 4E 1 Dillingham 4E % 0 0.0% Egegik 4E 1 King Salmon 4E 2 Kongiganak 4E 1 Manokotak 4E 2 Naknek 4E % 0 0.0% Nightmute 4E 1 Nome 4E % % Port Heiden 4E 3 Quinhagak 4E 1 South Naknek 4E 1 -continued-
173 Appendix E-3. Page 9 of 9. Number of SHARCs issued a respondents fished Set hook gear Hook and line or handline All gear Confidence pounds pounds interval for halibut halibut respondents halibut halibut respondents halibut of harvested harvested fished harvested harvested fished harvested halibut pounds halibut harvested Confidence interval for pounds of halibut Regulatory Rural community area Teller 4E % 0 0.0% Togiak 4E 1 Subtotal, Area 4E % % Rural SHARC subtotal All regulatory areas 7,047 2,928 19, ,008 1,449 6, ,982 3,489 25, % 488, % Tribal subtotal All 3,906 1,143 12, , ,247 74,585 1,502 17, % 308, % Rural community subtotal All 7,047 2,928 19, ,008 1,449 6, ,982 3,489 25, % 488, % Total All 10,953 4,071 31, ,992 2,183 11, ,567 4,991 43, % 797, % 161 Regulatory area Number of SHARCs issued a respondents fished Set hook gear Hook and line or handline All gear Confidence pounds pounds interval for halibut halibut respondents halibut halibut respondents halibut of harvested harvested fished harvested harvested fished harvested halibut pounds halibut harvested Confidence interval for pounds of halibut 2C 6,755 2,630 17, ,173 1,121 4,537 71,692 3,020 21, % 430, % 3A 3,288 1,240 12, , ,469 86,515 1,574 17, % 303, % 3B , , , % 23, % 4A , , % 14, % 4B % % 4C , % 10, % 4D % 1, % 4E , , % 12, % Total All 10,953 4,071 31, ,992 2,183 11, ,567 4,991 43, % 797, % a. To protect confidentiality, data for tribes and communities with 5 or fewer SHARCs issued are not reported in this table. Subtotals include all tribes and communities. Blank cells indicate redacted data.
174 Appendix E-4. subsistence harvests of halibut by place of residence. 162 Number of SHARCs Issued a Subsistence fished respondents Subsistence harvest Sport fished Sport harvest Lingcod bycatch Rockfish bycatch halibut pounds halibut respondents halibut pounds halibut respondents lingcod respondents rockfish City State Adak AK Akhiok AK , Akiachak AK 1 Akutan AK , Aleknagik AK 3 Anchor Point AK Anchorage AK , , Angoon AK , , Atka AK 1 Auke Bay AK 5 Barrow AK 1 Bethel AK Chefornak AK , Chenega Bay AK , Chevak AK 2 Chignik AK Chignik Lagoon AK , Chignik Lake AK 4 Chiniak AK , Chugiak AK 3 Clarks Point AK 1 Coffman Cove AK , , Cold Bay AK , Cordova AK ,596 28, , Craig AK ,055 37, , Dillingham AK Douglas AK Dutch Harbor AK , , Eagle River AK Edna Bay AK , Eek AK Egegik AK 1 -continued-
175 Appendix E-4. Page 2 of Number of SHARCs Issued a Subsistence fished respondents Subsistence harvest Sport fished Sport harvest Lingcod bycatch Rockfish bycatch halibut pounds halibut respondents halibut pounds halibut respondents lingcod respondents rockfish City State Elfin Cove AK Elmemdorf AFB AK 1 Ester AK 1 Fairbanks AK False Pass AK 1 Fritz Creek AK 1 Gakona AK 1 Gambell AK 1 Girdwood AK 1 Glennallen AK 1 Golovin AK 1 Goodnews Bay AK 4 Gustavus AK , , Haines AK ,274 25, , Hollis AK 1 Homer AK , Hoonah AK , , Hooper Bay AK Hydaburg AK , Hyder AK , Juneau AK , , Kake AK , Karluk AK Kasaan AK Kasilof AK , Kenai AK , , Ketchikan AK ,211 40, , King Cove AK , , King Salmon AK 2 Kipnuk AK , Klawock AK , , continued-
176 Appendix E-4. Page 3 of Number of SHARCs Issued a Subsistence fished respondents Subsistence harvest Sport fished Sport harvest Lingcod bycatch Rockfish bycatch halibut pounds halibut respondents halibut pounds halibut respondents lingcod respondents rockfish City State Klukwan AK 2 Kodiak AK 1, , , ,580 47, ,271 Kongiganak AK Kotzebue AK 1 Kwigillingok AK 3 Larsen Bay AK , , Manokotak AK 2 Mekoryuk AK 5 Metlakatla AK , Meyers Chuck AK , Naknek AK Nanwalek AK , Naukati AK , Nelson Lagoon AK 1 Newtok AK 1 Nightmute AK 2 Nikiski AK Ninilchik AK , Nome AK North Pole AK 4 Old Harbor AK , Ouzinkie AK , Palmer AK Pelican AK , Perryville AK , Petersburg AK ,817 47, , Pilot Point AK 2 Point Baker AK , Port Alexander AK , Port Graham AK , Port Heiden AK 2 -continued-
177 Appendix E-4. Page 4 of Number of SHARCs Issued a Subsistence fished respondents Subsistence harvest Sport fished Sport harvest Lingcod bycatch Rockfish bycatch halibut pounds halibut respondents halibut pounds halibut respondents lingcod respondents rockfish City State Port Lions AK , , Port Protection AK 2 Port William AK 1 Quinhagak AK 5 Sand Point AK , , Savoonga AK , Saxman AK Seldovia AK ,155 17, , Seward AK Sitka AK 1, ,951 82, , ,805 Skagway AK , Soldotna AK ,813 3, St. George Island AK 4 St. Paul Island AK , Sterling AK 4 Tatitlek AK , Teller AK Tenakee Springs AK , Thorne Bay AK , , Togiak AK 4 Toksook Bay AK Trapper Creek AK 1 Tununak AK Twin Hills AK 2 Unalakleet AK 1 Unalaska AK , Valdez AK , Ward Cove AK Wasilla AK Whale Pass AK Whittier AK 2 -continued-
178 Appendix E-4. Page 5 of 5. Number of SHARCs Issued a Subsistence fished respondents Subsistence harvest Sport fished Sport harvest Lingcod bycatch Rockfish bycatch halibut pounds halibut respondents halibut pounds halibut respondents lingcod respondents rockfish City State Willow AK 2 Wrangell AK ,928 36, , Yakutat AK , , Alaska subtotal 10,804 4,982 43, ,957 2,267 8, , ,864 1,320 12,839 Non-Alaska subtotal , Total 10,953 4,991 43, ,560 2,297 8, , ,864 1,322 12,851 a. To protect confidentiality, data for tribes and communities with 5 or fewer SHARCs issued are not reported in this table. Subtotals include all tribes and communities. Blank cells indicate redacted data. 166
179 Appendix E-5. subsistence harvests of halibut by gear type and place of residence. harvests by gear type Set hook gear Hook and line or handline All gear 167 Number of SHARCs issued a respondents fished fish harvested pounds fish harvested respondents fished fish harvested pounds fish harvested respondents fished fish harvested pounds fish harvested City State Adak AK Akhiok AK , ,008 Akiachak AK 1 Akutan AK , ,659 Aleknagik AK 3 Anchor Point AK Anchorage AK , , ,545 Angoon AK , , ,797 Atka AK 1 Auke Bay AK 5 Barrow AK 1 Bethel AK Chefornak AK , ,081 Chenega Bay AK , ,503 Chevak AK 2 Chignik AK Chignik Lagoon AK ,138 Chignik Lake AK 4 Chiniak AK , ,524 Chugiak AK 3 Clarks Point AK 1 Coffman Cove AK , , ,211 Cold Bay AK , ,968 Cordova AK ,289 22, , ,596 28,428 Craig AK ,714 33, , ,055 37,419 Dillingham AK Douglas AK Dutch Harbor AK , , ,615 -continued-
180 Appendix E-5. Page 2 of 5. harvests by gear type Set hook gear Hook and line or handline All gear 168 Number of SHARCs issued a respondents fished fish harvested pounds fish harvested respondents fished fish harvested pounds fish harvested respondents fished fish harvested pounds fish harvested City State Eagle River AK Edna Bay AK , ,725 Eek AK Egegik AK 1 Elfin Cove AK Elmemdorf AFB AK 1 Ester AK 1 Fairbanks AK False Pass AK 1 Fritz Creek AK 1 Gakona AK 1 Gambell AK 1 Girdwood AK 1 Glennallen AK 1 Golovin AK 1 Goodnews Bay AK 4 Gustavus AK , ,234 Haines AK ,221 24, ,274 25,424 Hollis AK 1 Homer AK , ,984 Hoonah AK , , ,651 Hooper Bay AK Hydaburg AK , , ,178 Hyder AK , ,447 Juneau AK , , ,054 Kake AK , ,307 Karluk AK Kasaan AK Kasilof AK , ,997 -continued-
181 Appendix E-5. Page 3 of 5. harvests by gear type Set hook gear Hook and line or handline All gear 169 Number of SHARCs issued a respondents fished fish harvested pounds fish harvested respondents fished fish harvested pounds fish harvested respondents fished fish harvested pounds fish harvested City State Kenai AK , ,243 Ketchikan AK ,612 32, , ,211 40,799 King Cove AK , , ,871 King Salmon AK 2 Kipnuk AK , ,230 Klawock AK , , ,824 Klukwan AK 2 Kodiak AK 1, , , ,843 36, , ,092 Kongiganak AK Kotzebue AK 1 Kwigillingok AK 3 Larsen Bay AK , ,297 Manokotak AK 2 Mekoryuk AK 5 Metlakatla AK , ,784 Meyers Chuck AK , ,147 Naknek AK Nanwalek AK , , ,743 Naukati AK , ,349 Nelson Lagoon AK 1 Newtok AK 1 Nightmute AK 2 Nikiski AK Ninilchik AK , ,216 Nome AK North Pole AK 4 Old Harbor AK , , ,026 Ouzinkie AK , , ,122 Palmer AK continued-
182 Appendix E-5. Page 4 of 5. harvests by gear type Set hook gear Hook and line or handline All gear 170 Number of SHARCs issued a respondents fished fish harvested pounds fish harvested respondents fished fish harvested pounds fish harvested respondents fished fish harvested pounds fish harvested City State Pelican AK , ,514 Perryville AK , ,140 Petersburg AK ,936 33, , ,817 47,266 Pilot Point AK 2 Point Baker AK , ,932 Port Alexander AK , ,942 Port Graham AK , , ,222 Port Heiden AK 2 Port Lions AK , , ,932 Port Protection AK 2 Port William AK 1 Quinhagak AK 5 Sand Point AK , , ,306 Savoonga AK ,270 Saxman AK Seldovia AK , , ,155 17,888 Seward AK Sitka AK 1, ,460 74, , ,951 82,728 Skagway AK , ,109 Soldotna AK , , ,813 3,797 St. George Island AK 4 St. Paul Island AK , ,139 Sterling AK 4 Tatitlek AK , ,019 Teller AK Tenakee Springs AK , ,668 Thorne Bay AK , , ,910 Togiak AK 4 Toksook Bay AK continued-
183 Appendix E-5. Page 5 of 5. harvests by gear type Set hook gear Hook and line or handline All gear 171 Number of SHARCs issued a respondents fished fish harvested pounds fish harvested respondents fished fish harvested pounds fish harvested respondents fished fish harvested pounds fish harvested City State Trapper Creek AK 1 Tununak AK Twin Hills AK 2 Unalakleet AK 1 Unalaska AK , , ,465 Valdez AK , ,424 Ward Cove AK Wasilla AK Whale Pass AK Whittier AK 2 Willow AK 2 Wrangell AK ,503 28, , ,928 36,080 Yakutat AK , , ,247 Alaska subtotal 10,804 4,064 31, ,563 2,181 11, ,393 4,982 43, ,957 Non-Alaska subtotal Total 10,953 4,071 31, ,992 2,183 11, ,567 4,991 43, ,560 a. To protect confidentiality, data for tribes and communities with 5 or fewer SHARCs issued are not reported in this table. Subtotals include all tribes and communities. Blank cells indicate redacted data.
184 Appendix E-6. of respondents that subsistence or sport fished, by place of residence. Number of SHARCs issued a subsistence or sport fished City State Adak AK 8 5 Akhiok AK 6 5 Akiachak AK 1 0 Akutan AK 16 9 Aleknagik AK 3 0 Anchor Point AK 12 4 Anchorage AK Angoon AK Atka AK 1 0 Auke Bay AK 5 4 Barrow AK 1 2 Bethel AK 8 2 Chefornak AK 14 8 Chenega Bay AK 8 9 Chevak AK 2 0 Chignik AK 10 4 Chignik Lagoon AK 13 6 Chignik Lake AK 4 10 Chiniak AK Chugiak AK 3 2 Clarks Point AK 1 0 Coffman Cove AK Cold Bay AK Cordova AK Craig AK Dillingham AK 30 1 Douglas AK 17 2 Dutch Harbor AK Eagle River AK 8 7 Edna Bay AK Eek AK 6 5 Egegik AK 1 0 Elfin Cove AK 14 8 Elmemdorf AFB AK 1 0 Ester AK 1 1 Fairbanks AK 7 2 False Pass AK 1 1 Fritz Creek AK 1 2 Gakona AK 1 0 Gambell AK 1 0 Girdwood AK 1 0 Glennallen AK 1 0 Golovin AK 1 0 Goodnews Bay AK 4 2 Gustavus AK continued- 172
185 Appendix E-6. Page 2 of 3. Number of SHARCs issued a subsistence or sport fished City State Haines AK Hollis AK 1 0 Homer AK Hoonah AK Hooper Bay AK 14 5 Hydaburg AK Hyder AK Juneau AK Kake AK Karluk AK 9 5 Kasaan AK 15 2 Kasilof AK Kenai AK Ketchikan AK King Cove AK King Salmon AK 2 0 Kipnuk AK Klawock AK Klukwan AK 2 0 Kodiak AK 1,702 1,074 Kongiganak AK 6 2 Kotzebue AK 1 0 Kwigillingok AK 3 0 Larsen Bay AK Manokotak AK 2 0 Mekoryuk AK 5 4 Metlakatla AK Meyers Chuck AK 8 7 Naknek AK 9 3 Nanwalek AK Naukati AK Nelson Lagoon AK 1 0 Newtok AK 1 0 Nightmute AK 2 1 Nikiski AK 9 2 Ninilchik AK Nome AK 23 8 North Pole AK 4 0 Old Harbor AK Ouzinkie AK Palmer AK 10 2 Pelican AK Perryville AK Petersburg AK Pilot Point AK 2 0 -continued- 173
186 Appendix E-6. Page 3 of 3. Number of SHARCs issued a subsistence or sport fished City State Point Baker AK Port Alexander AK Port Graham AK Port Heiden AK 2 0 Port Lions AK Port Protection AK 2 0 Port William AK 1 2 Quinhagak AK 5 3 Sand Point AK Savoonga AK 17 6 Saxman AK 12 0 Seldovia AK Seward AK 12 2 Sitka AK 1, Skagway AK Soldotna AK St. George Island AK 4 6 St. Paul Island AK Sterling AK 4 2 Tatitlek AK Teller AK 10 0 Tenakee Springs AK Thorne Bay AK Togiak AK 4 0 Toksook Bay AK Trapper Creek AK 1 0 Tununak AK 11 9 Twin Hills AK 2 0 Unalakleet AK 1 0 Unalaska AK Valdez AK Ward Cove AK 32 9 Wasilla AK 43 4 Whale Pass AK 8 6 Whittier AK 2 0 Willow AK 2 0 Wrangell AK Yakutat AK Alaska subtotal 10,804 5,796 Non-Alaska subtotal Total 10,953 5,835 a. To protect confidentiality, data for tribes and communities with 5 or fewer SHARCs issued are not reported in this table. Subtotals include all tribes and communities. Blank cells indicate redacted data. 174
187 Appendix E-7. subsistence harvests of halibut and sport harvests of halibut, pounds (net weight), and incidental harvests of lingcod and rockfish, by eligible Alaska tribe and eligible Alaska rural community, Return rate Subsistence fished halibut Subsistence halibut harvest Sport fished halibut Sport halibut harvest Lingcod bycatch Rockfish bycatch 175 Tribal name Angoon Community Association Aukquan Traditional Council Central Council Tlingit and Haida Indian Tribes Chilkat Indian Village Chilkoot Indian Association Craig Community Association Douglas Indian Association Hoonah Indian Association Hydaburg Cooperative Association Ketchikan Indian Corporation Klawock Cooperative Association Metlakatla Indian Community, Annette Island Reserve Organized Village of Kake Organized Village of Kasaan Organized Village of Saxman Regulatory area SHARCs issued a Percent respondents Percent of SHARCs fish pounds respondents Percent of SHARCs fish pounds respondents fish respondents fish 2C % % 609 9, % 52 1, C 1 2C % % 2,060 33, % 373 5, C % % % C % % 111 3, % C % % 286 5, % C % 0 0.0% % C % % , % C % % , % C % % 1,515 30, % 243 4, C % % 171 4, % C % % , % C % % 241 5, % C % % % C % % 240 3, % 154 3, continued-
188 Appendix E-7. Page 2 of 10. Return rate Subsistence fished halibut Subsistence halibut harvest Sport fished halibut Sport halibut harvest Lingcod bycatch Rockfish bycatch 176 respondents Percent of SHARCs fish respondents Regulatory SHARCs Percent of Tribal name area issued a Percent pounds SHARCs pounds Petersburg Indian Association 2C % % 241 3, % Sitka Tribe of Alaska 2C % % , % Skagway Village 2C 3 fish respondents fish respondents Wrangell Cooperative Association 2C % % 309 6, % 55 1, Subtotal, Area 2C 2,335 1, % % 8, , % 1,032 18, ,578 Kenaitze Indian Tribe 3A % % 337 8, % 57 1, Lesnoi Village (Woody Island) 3A % % % Afognak 3A % % 121 1, % Akhiok 3A % % 59 1, % Chenega 3A % % 123 5, % Eyak 3A % % 355 4, % 25 1, Karluk 3A 4 Larsen Bay 3A % % 254 4, % 110 3, Nanwalek 3A % % 337 6, % Ouzinkie 3A % % 136 2, % Port Graham 3A % % , % Port Lions 3A % % 170 3, % 63 1, Tatitlek 3A % % 146 2, % Ninilchik Village 3A % % 1,980 8, % Seldovia Village Tribe 3A % % 464 7, % continued- fish
189 Appendix E-7. Page 3 of 10. Return rate Subsistence fished halibut Subsistence halibut harvest Sport fished halibut Sport halibut harvest Lingcod bycatch Rockfish bycatch 177 respondents Percent of SHARCs fish respondents Regulatory SHARCs Percent of Tribal name area issued a Percent pounds SHARCs pounds Sun'aq Tribe of Kodiak (formerly 3A % % , % 157 2, Shoonaq') Village of Kanatak 3A % 0 0.0% % Village of Old Harbor 3A % % 127 3, % Village of Salamatoff 3A % % % Yakutat Tlingit Tribe 3A % % 368 8, % Subtotal, Area 3A % % 6,247 95, % , ,560 Agdaagux Tribe of King Cove 3B % % 434 6, % 93 1, Chignik Lake Village 3B % % % Ivanoff Bay Village 3B % % % Belkofski 3B 5 Chignik 3B % % % Chignik Lagoon 3B % % 87 1, % False Pass 3B 1 Nelson Lagoon 3B 3 Perryville 3B % % 112 2, % Unga 3B % % % Pauloff Harbor Village 3B % % 309 3, % Qagan Toyagungin Tribe of Sand Point Village fish respondents fish respondents fish 3B % % 194 3, % Subtotal, Area 3B % % 1,209 17, % 166 3, continued-
190 Appendix E-7. Page 4 of 10. Return rate Subsistence fished halibut Subsistence halibut harvest Sport fished halibut Sport halibut harvest Lingcod bycatch Rockfish bycatch 178 respondents Percent of SHARCs fish respondents Regulatory SHARCs Percent of Tribal name area issued a Percent pounds SHARCs pounds Akutan 4A % % 90 1, % Qawalingin Tribe of Unalaska 4A % % 107 1, % Subtotal, Area 4A % % 197 3, % Atka 4B 5 fish respondents fish respondents Subtotal, Area 4B 5 Pribilof Islands Aleut Community of 4C % % % St. George Pribilof Islands Aleut Community of St. Paul 4C % % , % Subtotal, Area 4C % % , % Diomede 4D 1 (Inalik) Gambell 4D 1 Savoonga 4D % % 42 1, % Subtotal, Area 4D % % 42 1, % Chevak Native Village 4E 3 (Kashunamiut) Chinik Eskimo Community 4E 1 Egegik Village 4E 1 King Island Native Community 4E 1 Levelock Village 4E 1 Manokotak Village 4E 1 Naknek Native Village 4E % 0 0.0% % continued- fish
191 Appendix E-7. Page 5 of 10. Return rate Subsistence fished halibut Subsistence halibut harvest Sport fished halibut Sport halibut harvest Lingcod bycatch Rockfish bycatch 179 Tribal name Aleknagik Brevig Mission Council Dillingham (Curyung) Eek Goodnews Bay (Mumtraq) Hooper Bay Kanakanak Kipnuk Kongiganak Koyuk Kwigillingok Kwinhagak Mekoryuk Nightmute Scammon Bay Shaktoolik Toksook Bay (Nunakauyak) Regulatory area SHARCs issued a Percent respondents Percent of SHARCs fish pounds respondents Percent of SHARCs fish pounds respondents fish respondents fish 4E % 0 0.0% % E 1 4E 4 4E % % % E % % 37 1, % E 4 4E % % % E 1 4E % % 273 2, % E 5 4E 1 4E 4 4E 3 4E % % % E 1 4E 3 4E 1 4E % % % continued-
192 Appendix E-7. Page 6 of 10. Return rate Subsistence fished halibut Subsistence halibut harvest Sport fished halibut Sport halibut harvest Lingcod bycatch Rockfish bycatch 180 respondents Percent of SHARCs fish respondents Regulatory SHARCs Percent of Tribal name area issued a Percent pounds SHARCs pounds Tununak 4E % % % Unalakleet 4E 3 Wales 4E 1 Newtok Village 4E 1 Nome Eskimo Community 4E % % % Orutsararmuit Native Village 4E % % % South Naknek Village 4E 1 Stebbins Community Association 4E 4 Traditional Village of Togiak 4E 3 Twin Hills Village 4E 1 Ugashik Village 4E 2 Village of fish respondents fish respondents fish 4E % % 75 1, % Chefornak Village of Clark's Point 4E 1 Village of Kotlik 4E 1 Subtotal, Area 4E % % , % 106 1, Tribal subtotal 3,906 2, % 1, % 17, , % 1,953 37, ,496 -continued-
193 Appendix E-7. Page 7 of 10. Return rate Subsistence fished halibut Subsistence halibut harvest Sport fished halibut Sport halibut harvest Lingcod bycatch Rockfish bycatch 181 respondents Percent of SHARCs fish respondents fish respondents fish respondents Regulatory SHARCs Percent of Rural community area issued a Percent pounds SHARCs pounds Angoon 2C % % 285 5, % Coffman Cove 2C % % 129 2, % 121 1, Craig 2C % % 1,405 23, % 561 6, Edna Bay 2C % % 112 2, % Elfin Cove 2C % % % Gustavus 2C % % 121 2, % 116 1, Haines 2C % % 1,080 21, % 146 2, Hollis 2C % % 114 4, % Hoonah 2C % % 350 5, % 121 1, Hydaburg 2C % % 48 1, % Hyder 2C % % 64 1, % Juneau 2C 3 Kake 2C % % 174 5, % Kasaan 2C % % % Ketchikan 2C 5 Klawock 2C % % 640 9, % 227 3, Klukwan 2C 2 Metlakatla 2C % % 106 2, % Meyers Chuck 2C % % 34 1, % Naukati Bay 2C % % 56 1, % 75 1, Pelican 2C % % 125 2, % Petersburg 2C % % 2,574 43, % , Port Alexander 2C % % 140 3, % Port Protection 2C % % 121 2, % Pt. Baker 2C % % % Saxman 2C % % 283 2, % Sitka 2C 1, % % 3,349 69, % 534 9, ,402 Skagway 2C % % 87 1, % Tenakee Springs 2C % % 138 2, % Thorne Bay 2C % % , % 283 4, Ward Cove 2C 2 Whale Pass 2C % % % continued- fish
194 Appendix E-7. Page 8 of 10. Return rate Subsistence fished halibut Subsistence halibut harvest Sport fished halibut Sport halibut harvest Lingcod bycatch Rockfish bycatch 182 respondents Percent of SHARCs fish respondents fish respondents fish respondents Regulatory SHARCs Percent of Rural community area issued a Percent pounds SHARCs pounds Wrangell 2C % % 1,422 26, % 190 3, Subtotal, Area 2C 4,420 3, % 2, % 13, ,900 1, % 3,372 54, , ,308 Chenega Bay 3A % % % Chiniak 3A 3 Cordova 3A % % 1,260 24, % 241 4, Karluk 3A % % % Kodiak 3A 1, % % 7, , % 2,419 43, ,035 Larsen Bay 3A % 0 0.0% % Nanwalek 3A % % 232 3, % Old Harbor 3A % % 103 1, % Ouzinkie 3A % % 67 1, % Port Graham 3A % % 143 2, % Port Lions 3A % % 89 1, % 96 1, Seldovia 3A % % 1,007 14, % 201 3, Tatitlek 3A % % % Yakutat 3A % % 293 7, % 57 1, Subtotal, Area 3A 2,348 1, % 1, % 11, , % 3,080 54, ,637 Chignik 3B 1 Chignik Lagoon 3B 1 Chignik Lake 3B 1 Cold Bay 3B % % 163 2, % False Pass 3B 1 King Cove 3B % % 121 2, % Nelson Lagoon 3B 1 Perryville 3B 1 Sand Point 3B % % 68 1, % Subtotal, Area 3B % % 357 6, % Unalaska 4A % % , % 208 2, Subtotal, Area 4A % % , % 208 2, Adak 4B 5 Subtotal, Area 4B 5 -continued- fish
195 Appendix E-7. Page 9 of 10. Return rate Subsistence fished halibut Subsistence halibut harvest Sport fished halibut Sport halibut harvest Lingcod bycatch Rockfish bycatch 183 respondents Percent of SHARCs fish respondents fish respondents fish respondents Regulatory SHARCs Percent of Rural community area issued a Percent pounds SHARCs pounds St. George Island 4C 1 Subtotal, Area 4C 1 Aleknagik 4E 2 Bethel 4E 1 Chefornak 4E 1 Dillingham 4E % 1 6.1% % Egegik 4E 1 King Salmon 4E 2 Kongiganak 4E 1 Manokotak 4E 2 Naknek 4E % % % Nightmute 4E 1 Nome 4E % % % Port Heiden 4E 3 Quinhagak 4E 1 South Naknek 4E 1 Teller 4E % 0 0.0% % Togiak 4E 1 Subtotal, Area 4E % % % fish Rural community subtotal All 7,047 4, % 3, % 25, ,990 1, % 6, , , ,356 -continued-
196 Appendix E-7. Page 10 of 10. Return rate Subsistence fished halibut Subsistence halibut harvest Sport fished halibut Sport halibut harvest Lingcod bycatch Rockfish bycatch Percent Regulatory SHARCs of Percent of Alaska area issued a Percent respondents SHARCs fish pounds respondents SHARCs fish pounds respondents fish respondents fish Tribal subtotal All 3,906 2, % 1, % 17, , % 1,953 37, ,496 Rural community subtotal All 7,047 4, % 3, % 25, ,990 1, % 6, , , ,356 Total All 10,953 6, % 4, % 43, ,560 2, % 8, , ,864 1,322 12,851 a. To protect confidentiality, data for tribes and communities with 5 or fewer SHARCs issued are not reported in this table. Subtotals include all tribes and communities. Blank cells indicate redacted data. 184
197 Appendix F. Project findings summary. 185
198 186
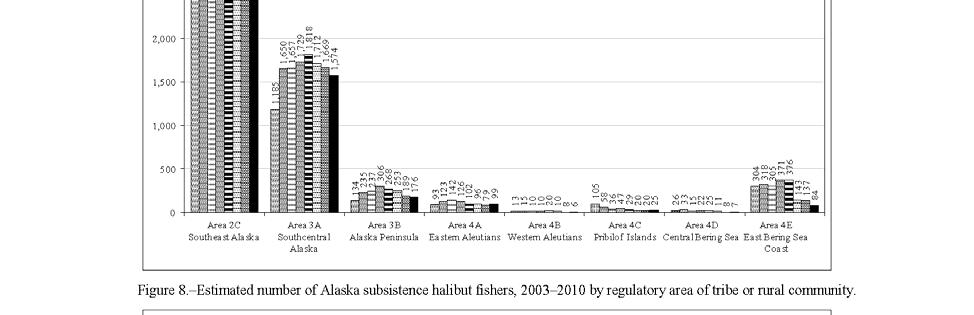
199 187
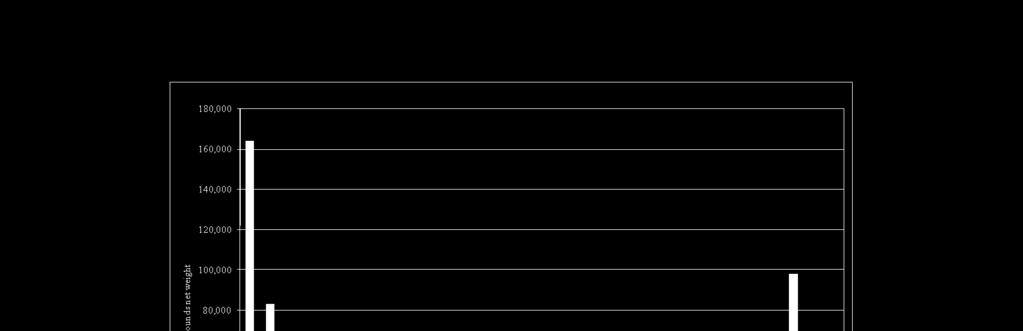
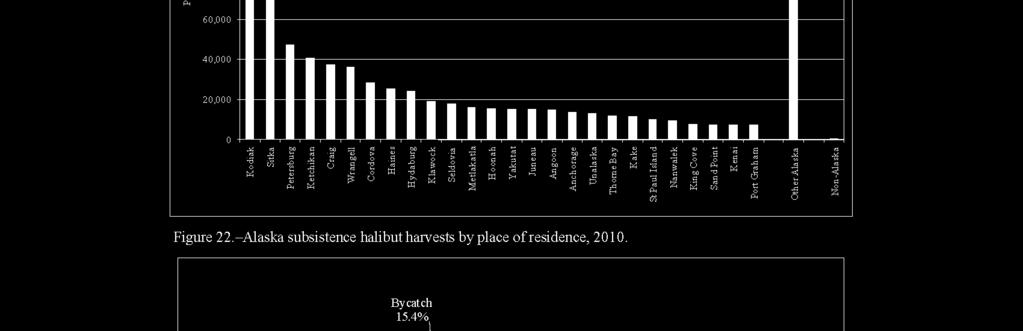

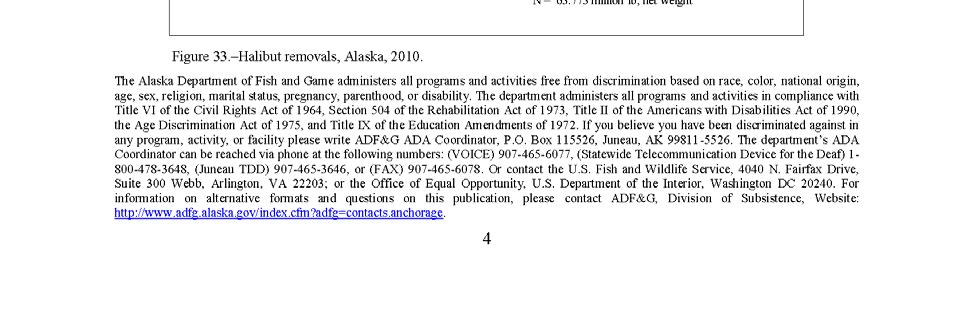
200 188
Subsistence Harvests of Pacific Halibut in Alaska, 2008
 Technical Paper No. 348 Subsistence Harvests of Pacific Halibut in Alaska, 2008 by James A. Fall and David Koster January 2010 Alaska Department of Fish and Game Division of Subsistence Symbols and Abbreviations
Subsistence Harvests of Pacific Halibut in Alaska, 2006
 Technical Paper No. 333 Subsistence Harvests of Pacific in Alaska, 2006 by James A. Fall, David Koster, and Michael Turek December 2007 Alaska Department of Fish and Game Division of Subsistence Symbols
2013 Kotzebue Sound Salmon Fisheries Management Plan
 Regional Information Report 3A13-04 2013 Kotzebue Sound Salmon Fisheries Management Plan by Jim Menard Alaska Department of Fish and Game May 2013 Divisions of Sport Fish and Commercial Fisheries Symbols
DEPARTMENT OF FISH AND GAME
 Sean Parnell, GOVERNOR DEPARTMENT OF FISH AND GAME November 4, 2011 DIVISION OF SPORT FISH 3298 Douglas Place Homer, AA 99603-8027 PHONE: (907) 235-8191 FAX: (907) 235-2448 and Douglas Island Center Bldg
Fishery Management Report No Fishery Management Plan for the South Alaska Peninsula Area State-Waters Pacific Cod Season, 2013
 Fishery Management Report No. 13-01 Fishery Management Plan for the South Alaska Peninsula Area State-Waters Pacific Cod Season, 2013 by Trent Hartill Alaska Department of Fish and Game January 2013 Divisions
Stock Assessment of Sockeye Salmon from the Buskin River, Kodiak, Alaska, 2000
 Annual Project Report No. FIS 00-032 USFWS Office of Subsistence Management Fishery Information Services Division Stock Assessment of Sockeye Salmon from the Buskin River, Kodiak, Alaska, 2000 by Donn
Methodology for ISER Surveys of Alaska Halibut Fishermen
 Methodology for ISER Surveys of Alaska Halibut Fishermen by Gunnar Knapp Institute of Social and Economic Research University of Alaska Anchorage 3211 Providence Drive Anchorage, Alaska 99508 907-786-7710
Alaska Peninsula-Aleutian Islands Management Area Food and Bait Herring Fishery Management Plans, 2015
 Fishery Management Report No. 15-26 Alaska Peninsula-Aleutian Islands Management Area Food and Bait Herring Fishery Management Plans, 2015 by Charles W. Russell Alaska Department of Fish and Game May 2015
Special Publication No. BOF
 Special Publication No. BOF 2015-02 Customary and Traditional Use Worksheet and Options for Amounts Reasonably Necessary for Subsistence: Tanner Crab, Dungeness Crab, Shrimp, and Miscellaneous Shellfish,
The Harvest of Moose, Caribou, Bear, and Gray Wolf in the Lower-Middle Yukon River Communities of Grayling, Anvik, Shageluk, and Holy Cross
 Technical Paper No. 305 The 2004 2005 Harvest of Moose, Caribou, Bear, and Gray Wolf in the Lower-Middle Yukon River Communities of Grayling, Anvik, Shageluk, and Holy Cross by Caroline L. Brown and David
Port Graham: Holdings of Limited Entry Permits, Sablefish Quota Shares, and Halibut Quota Shares Through 1998 and Data On Fishery Gross Earnings
 Port Graham: Holdings of Limited Entry Permits, Sablefish Quota Shares, and Halibut Quota Shares Through 1998 and Data On Fishery Earnings CFEC Report 99-Port Graham-SN Alaska Commercial Fisheries Entry
Technical Paper No. 310 Household Harvests of Moose, Caribou, Bears, and Wolves in 8 Central Kuskokwim Region Communities, Alaska,
 Technical Paper No. 310 Household Harvests of Moose, Caribou, Bears, and Wolves in 8 Central Kuskokwim Region Communities, Alaska, 2003 2006 by Tracie Krauthoefer Caroline Brown and David Koster June 2015
Department of Fish and Game
 Department of Fish and Game DIVISION OF SPORT FISH 3298 Douglas Place Homer, AK 99603 Main: 907-235-8191 Fax: 907-235-2448 P.O. Box 110024 Juneau, AK 99811-0024 Main: 907-465-4270 Fax: 907-465-2034 October
Regional Information Report No. 3A Norton Sound Salmon Fisheries Outlook and Management Strategies
 Regional Information Report No. 3A15-02 2015 Norton Sound Salmon Fisheries Outlook and Management Strategies by Jim Menard May 2015 Alaska Department of Fish and Game Division of Commercial Fisheries Symbols
2017 PACIFIC HALIBUT CATCH SHARING PLAN FOR AREA 2A
 (a) FRAMEWORK 2017 PACIFIC HALIBUT CATCH SHARING PLAN FOR AREA 2A This Plan constitutes a framework that shall be applied to the annual Area 2A total allowable catch (TAC) approved by the International
Alaska Peninsula-Aleutian Islands Management Area Food and Bait Herring Fishery Management Plans, 2013
 Fishery Management Report No. 13-13 The 2013 Dutch Harbor Food and Bait purse seine fishery allocation is corrected in the current publication. Nichols, Nathaniel W., 5/24/13 Alaska Peninsula-Aleutian
Department of Fish and Game
 MEMORANDUM TO: THRU: Kevin Duffy Deputy Commissioner Juneau Rob Bentz Deputy Director Division of Sport Fish Juneau State Of Alaska Department of Fish and Game DATE: September 21, 21 TELEPHONE NO: 465-6187
2016 PACIFIC HALIBUT CATCH SHARING PLAN FOR AREA 2A
 (a) FRAMEWORK 2016 PACIFIC HALIBUT CATCH SHARING PLAN FOR AREA 2A This Plan constitutes a framework that shall be applied to the annual Area 2A total allowable catch (TAC) approved by the International
Technical Paper No. 418 Kodiak City, Larsen Bay and Old Harbor: An Ethnographic Study of Traditional Subsistence Salmon Harvests and Uses
 Technical Paper No. 418 Kodiak City, Larsen Bay and Old Harbor: An Ethnographic Study of Traditional Subsistence Salmon Harvests and Uses by Meredith A. Marchioni, James A. Fall, Brian Davis and Garrett
Stock Assessment of Sockeye and Coho Salmon from Billy s Hole, Prince William Sound, Alaska, 2003
 Annual Project Report No. FIS 03-033 USFWS Office of Subsistence Management Fishery Information Services Division Stock Assessment of Sockeye and Coho Salmon from Billy s Hole, Prince William Sound, Alaska,
A Study of Commercial Fishing Gear Selectivity During the 2012/13 Aleutian Islands Golden King Crab Fishery East of 174 W Longitude
 Fishery Data Series No. 13-41 A Study of Commercial Fishing Gear Selectivity During the 2012/13 Aleutian Islands Golden King Crab Fishery East of 174 W Longitude by Vicki Vanek, Douglas Pengilly, and M.
Chignik Area Subsistence Salmon Fisheries Research Report to the Alaska Board of Fisheries, January 2011
 Special Publication No. BOF 2010-06 RC 3 Tab 9 Chignik Area Subsistence Salmon Fisheries Research Report to the Alaska Board of Fisheries, January 2011 by Lisa Hutchinson-Scarbrough, Terri Lemons, James
CFEC Permit Holdings, Harvests, and Estimated Gross Earnings by Resident Type in the Bristol Bay Salmon Gillnet Fisheries
 CFEC Permit Holdings, Harvests, and Estimated Gross Earnings by Resident Type in the Bristol Bay Salmon Gillnet Fisheries Photo courtesy of Lindsey Bloom CFEC Report 09-1N February, 2009 Commercial Fisheries
ECONOMIC IMPACTS AND CONTRIBUTIONS OF SPORTFISHING IN ALASKA
 ECONOMIC IMPACTS AND CONTRIBUTIONS OF SPORTFISHING IN ALASKA 2 0 0 7 R E P O R T A Message from the Director CHARLIE SWANTON, DIRECTOR ADF&G, DIVISION OF SPORT FISH Alaska supports arguably some of the
SOUTHEASTERN DISTRICT MAINLAND (ALASKA PENINSULA AREA) SALMON MANAGEMENT PLAN, 1994
 SALMON MANAGEMENT PLAN, 1994") SOUTHEASTERN DISTRICT MAINLAND (ALASKA PENINSULA AREA) SALMON MANAGEMENT PLAN, 1994 James N. McCullough and Rodney D. Campbell Regional Information ~ e~ort' No. 4K94-14 Alaska Department of Fish and Game
SOUTHEASTERN DISTRICT MAINLAND (ALASKA PENINSULA AREA) SALMON MANAGEMENT PLAN, 1994 James N. McCullough and Rodney D. Campbell Regional Information ~ e~ort' No. 4K94-14 Alaska Department of Fish and Game
INFORMATIONAL LEAFLET NO. 2. Length-Width Relationships of Carapace. Measurements of the King Crab
 INFORMATIONAL LEAFLET NO. 2 Length-Width Relationships of Carapace Measurements of the King Crab (Parali thodes camtschatica) Roy Ri ckey-westward Regional Di rector Alaska Department of Fish and Game
City of Ketchikan and Other Places Within the Ketchikan Gateway Borough:
 City of Ketchikan and Other Places Within the Ketchikan Gateway Borough: Holdings of Limited Entry Permits, Sablefish Quota Shares, and Halibut Quota Shares Through 1997 and Data On Fishery CFEC Report
Ketchikan and Other Nearby Places:
 Ketchikan and Other Nearby Places: Holdings of Limited Entry Permits, Sablefish Quota Shares, and Halibut Quota Shares Through 1998 and Data On Fishery Earnings CFEC Report 99-Ketchikan area-sn Alaska
SOUTH UNIMAK AND SHUMAGIN ISLANDS JUNE SALMON FISHERY MANAGEMENT PLAN, 2003
 SOUTH UNIMAK AND SHUMAGIN ISLANDS JUNE SALMON FISHERY MANAGEMENT PLAN, 2003 By Arnold R. Shaul Charles Burkey, Jr. and Joseph J. Dinnocenzo Regional Information Report 1 No. 4K03-20 Alaska Department of
Discussion Paper: Consideration of a Registration for Self-Guided Halibut Rental Boats
 Discussion Paper: Consideration of a Registration for Self-Guided Halibut Rental Boats December 2017 1 1 Introduction... 1 2 Description of the Problem... 1 2.1 Definition of self-guided halibut rental
Fishery Data Series No Distribution and Run Timing of Stocked McDonald Lake Sockeye Salmon,
 Fishery Data Series No. 15-38 Distribution and Run Timing of Stocked McDonald Lake Sockeye Salmon, 2011 2014 by Malika T. Brunette, Andrew W. Piston, and Steven C. Heinl Alaska Department of Fish and Game
Discussion Paper on BSAI Fixed Gear Parallel Waters Fishery North Pacific Fishery Management Council October 2008
 Discussion Paper on BSAI Fixed Gear Parallel Waters Fishery North Pacific Fishery Management Council October 2008 Item D-2(b) At its April 2008 meeting, the Council initiated a staff discussion paper on
Analysis of Management Options for the Area 2C and 3A Charter Halibut Fisheries for 2019
 Analysis of Management Options for the Area 2C and 3A Charter Halibut Fisheries for 2019 A Report to the North Pacific Fishery Management Council Sarah Webster, Robert Powers Alaska Department of Fish
2009 commercial shery and regulation changes
 2009 commercial shery and regulation changes Heather L. Gilroy, Lara M. Erikson, and Kirsten A. MacTavish Abstract This section presents the 2009 regulations and the results of the commercial halibut shery.
IPHC Regulatory Area 2A Directed Commercial Pacific Halibut Fishery Sample Vessel Fishing Period Limit Options for Longer Fishing Periods
 Agenda Item G.1.a IPHC Report 1 September 2017 IPHC Report September 2017 IPHC Regulatory Area 2A Directed Commercial Pacific Halibut Fishery Sample Vessel Fishing Period Limit Options for Longer Fishing
Proposed Changes to the Catch Sharing Plan
 Agenda Item E.1.a ODFW Report 1 November 2017 OREGON DEPARTMENT OF FISH AND WILDLIFE REPORT ON PROPOSED CHANGES TO THE PACIFIC HALIBUT CATCH SHARING PLAN FOR THE 2018 FISHERY The Oregon Department of Fish
Fisheries Off West Coast States; Coastal Pelagic Species Fisheries; Annual. AGENCY: National Marine Fisheries Service (NMFS), National Oceanic and
, National Oceanic and") This document is scheduled to be published in the Federal Register on 06/30/2017 and available online at https://federalregister.gov/d/2017-13685, and on FDsys.gov Billing Code 3510-22-P DEPARTMENT OF
This document is scheduled to be published in the Federal Register on 06/30/2017 and available online at https://federalregister.gov/d/2017-13685, and on FDsys.gov Billing Code 3510-22-P DEPARTMENT OF
Survey Methodologies and Reported Sex Compositions of Harbor Seal Harvests of Alaska Natives,
 Survey Methodologies and Reported Sex Compositions of Harbor Seal Harvests of Alaska Natives, 19954997 Robert J. Wolfe, Matt Kookesh, Amy W. Paige, Cheryl Scott, Morgen Smith, Michael Turek, and Charles
REPORT ON THE 2017 PACIFIC HALIBUT FISHERIES IN AREA 2A
 Agenda Item E.1.a NMFS Report 1 November 2017 REPORT ON THE 2017 PACIFIC HALIBUT FISHERIES IN AREA 2A The 2017 Area 2A Pacific halibut (halibut) total allowable catch (TAC) of 1,330,000 pounds (lbs.),
REPORT ON THE 2018 PACIFIC HALIBUT FISHERIES IN AREA 2A (10/5/2018)
") Agenda Item F.1.a NMFS Report 1 November 2018 REPORT ON THE 2018 PACIFIC HALIBUT FISHERIES IN AREA 2A (10/5/2018) The 2018 Area 2A Pacific halibut (halibut) total allowable catch (TAC) of 1,190,000 pounds
Agenda Item F.1.a NMFS Report 1 November 2018 REPORT ON THE 2018 PACIFIC HALIBUT FISHERIES IN AREA 2A (10/5/2018) The 2018 Area 2A Pacific halibut (halibut) total allowable catch (TAC) of 1,190,000 pounds
Alaska Department of Fish and Game. Saltwater Guided Sport Fishing Logbook Reporting Program, 2014
 Regional Operational Plan SF.4A.2014.03 Alaska Department of Fish and Game Statewide Saltwater Guided Sport Fishing Logbook Reporting Program, 2014 by Dora Sigurdsson Alaska Department of Fish and Game
STOCK ASSESSMENT AND FISHERY EVALUATION REPORT FOR THE GROUNDFISH FISHERIES OF THE GULF OF ALASKA AND BERING SEA/ALEUTIAN ISLAND AREA:
 STOCK ASSESSMENT AND FISHERY EVALUATION REPORT FOR THE GROUNDFISH FISHERIES OF THE GULF OF ALASKA AND BERING SEA/ALEUTIAN ISLAND AREA: ECONOMIC STATUS OF THE GROUNDFISH FISHERIES OFF ALASKA, 1998 by Terry
Regional Information Report 5J
 Regional Information Report 5J.2016-06 Does the Queets Exploitation Rate Indicator Stock Represent the Distribution of Fishery Impacts of Washington Coastal Chinook Salmon Stocks in Pacific Salmon Treaty
Evaluation of Alaska Charter Logbook Data for A Report to the North Pacific Fishery Management Council, October 2009
 Evaluation of Alaska Charter Data for 26-28 A Report to the North Pacific Fishery Management Council, October 29 Scott Meyer, Bob Powers Alaska Department of Fish and Game, Division of Sport Fish, Anchorage
Effects of IFQ Management on Fishing Safety: Survey Responses of Alaska Halibut Fishermen
 Effects of IFQ Management on Fishing Safety: Survey Responses of Alaska Halibut Fishermen by Gunnar Knapp Institute of Social and Economic Research University of Alaska Anchorage 3211 Providence Drive
Technical Paper No. 381 Alaska Subsistence and Personal Use Salmon Fisheries 2010 Annual Report
 Technical Paper No. 381 Alaska Subsistence and Personal Use Salmon Fisheries 2010 Annual Report by James A. Fall Benjamin M. Balivet Andrew R. Brenner Sarah S. Evans Davin Holen Lisa Hutchinson-Scarbrough
North Alaska Peninsula Salmon Management Plan, 2013
 Fishery Management Report No. 13-16 North Alaska Peninsula Salmon Management Plan, 2013 by Robert L. Murphy and Dawn M. Wilburn Alaska Department of Fish and Game April 2013 Divisions of Sport Fish and
Charter Boat Fishing in Lake Michigan: 2015 Illinois Reported Harvest
 Illinois Department of Natural Resources Division of Fisheries Charter Boat Fishing in Lake Michigan: 2015 Illinois Reported Harvest Steven R. Robillard Illinois Department of Natural Resources Lake Michigan
Thomas Bay Baseline Investigation
 Regional Information Report No. 1J16-10 Thomas Bay Baseline Investigation by Patrick Fowler and Troy Thynes Alaska Department of Fish and Game November 2016 Divisions of Sport Fish and Commercial Fisheries
Regional Operational Plan SF.4A Alaska Statewide Sport Fish Harvest Survey, 2014
 Regional Operational Plan SF.4A.2013.07 Alaska Statewide Sport Fish Harvest Survey, 2014 by William J. Romberg and Gretchen Jennings Alaska Department of Fish and Game August 2013 Divisions of Sport Fish
AD HOC WORKING GROUP ON GROUNDFISH MANAGEMENT, MAY 5 and 6 Overview of ADF&G skate fishery management and data collection, 2003
 Skate fisheries in state waters: AD HOC WORKING GROUP ON GROUNDFISH MANAGEMENT, MAY 5 and Overview of ADF&G skate fishery management and data collection, 003 Alaska Board of Fisheries requires a Commissioner
GROUNDFISH MANAGEMENT TEAM REPORT ON CONSIDERATION OF INSEASON ADJUSTMENTS, INCLUDING CARRYOVER. Annual Vessel Limit (15.4%)
") Agenda Item I.3.a Supplemental GMT Report 2 March 2017 GROUNDFISH MANAGEMENT TEAM REPORT ON CONSIDERATION OF INSEASON ADJUSTMENTS, INCLUDING CARRYOVER The Groundfish Management Team (GMT) reviewed the
Agenda Item I.3.a Supplemental GMT Report 2 March 2017 GROUNDFISH MANAGEMENT TEAM REPORT ON CONSIDERATION OF INSEASON ADJUSTMENTS, INCLUDING CARRYOVER The Groundfish Management Team (GMT) reviewed the
International Fisheries; Pacific Tuna Fisheries; Revised 2018 Commercial Fishing
 This document is scheduled to be published in the Federal Register on 03/28/2018 and available online at https://federalregister.gov/d/2018-06148, and on FDsys.gov BILLING CODE 3510-22-P DEPARTMENT OF
Kodiak and Alaska Peninsula Commercial Dungeness Crab Fisheries, Report to the Alaska Board of Fisheries. Michael P. Ruccio.
 Kodiak and Alaska Peninsula Commercial Dungeness Crab Fisheries, 1999 Report to the Alaska Board of Fisheries By Michael P. Ruccio and David R. Jackson Regional Information Report 1 No. 4K00-3 Alaska Department
FISHERY MANAGEMENT PLAN FOR THE RED KING CRAB COMMERCIAL FISHERY IN BRISTOL BAY REGISTRATION AREA T, Rance Morrison
 FISHERY MANAGEMENT PLAN FOR THE RED KING CRAB COMMERCIAL FISHERY IN BRISTOL BAY REGISTRATION AREA T, 1999 by Rance Morrison Regional Information Report 1 No. 4K00-6 Alaska Department of Fish and Game Division
Charter Boat Fishing in Lake Michigan: 2017 Illinois Reported Harvest
 Illinois Department of Natural Resources Division of Fisheries Charter Boat Fishing in Lake Michigan: 2017 Illinois Reported Harvest Steven R. Robillard Illinois Department of Natural Resources Lake Michigan
National Oceanic and Atmospheric Administration. Notice of Intent to Prepare an Environmental Impact
 This document is scheduled to be published in the Federal Register on 08/15/2017 and available online at https://federalregister.gov/d/2017-17173, and on FDsys.gov BILLING CODE 3510-22-P DEPARTMENT OF
Fisheries of the Caribbean, Gulf of Mexico, and South Atlantic; Reef Fish Fishery of Puerto Rico and the U.S. Virgin Islands;
 This document is scheduled to be published in the Federal Register on 06/11/2018 and available online at https://federalregister.gov/d/2018-12420, and on FDsys.gov BILLING CODE: 3510-22-P DEPARTMENT OF
Draft Discussion Document. May 27, 2016
 Draft Discussion Document May 27, 2016 Action to consider modifications to the sub-acl of GB haddock allocated to the Atlantic herring fishery and associated accountability measures AP/ CMTE Input 1. Review
Public Meetings to Discuss the Pacific Halibut Catch Sharing Plan for Portland July 31 North Bend August 6 Newport August 7
 Public Meetings to Discuss the Pacific Halibut Catch Sharing Plan for 2013 Portland July 31 North Bend August 6 Newport August 7 1 Meeting Outline Background on overall halibut management 2A Catch Sharing
AGENCY: National Marine Fisheries Service (NMFS), National Oceanic and Atmospheric
, National Oceanic and Atmospheric") This document is scheduled to be published in the Federal Register on 05/30/2013 and available online at http://federalregister.gov/a/2013-12869, and on FDsys.gov BILLING CODE 3510-22-P DEPARTMENT OF COMMERCE
This document is scheduled to be published in the Federal Register on 05/30/2013 and available online at http://federalregister.gov/a/2013-12869, and on FDsys.gov BILLING CODE 3510-22-P DEPARTMENT OF COMMERCE
Atlantic Highly Migratory Species; Atlantic Bluefin Tuna Fisheries. AGENCY: National Marine Fisheries Service (NMFS), National Oceanic and Atmospheric
, National Oceanic and Atmospheric") This document is scheduled to be published in the Federal Register on 05/11/2018 and available online at https://federalregister.gov/d/2018-09960, and on FDsys.gov Billing Code: 3510-22-P DEPARTMENT OF
This document is scheduled to be published in the Federal Register on 05/11/2018 and available online at https://federalregister.gov/d/2018-09960, and on FDsys.gov Billing Code: 3510-22-P DEPARTMENT OF
Bering Sea Salmon Bycatch Update North Pacific Fishery Management Council, July 2017
 Bering Sea Salmon Bycatch Update North Pacific Fishery Management Council, July 2017 Salmon are caught incidentally in the Bering Sea and Aleutian Islands (BSAI) offshore trawl fisheries, especially in
Northern Cook Inlet Chinook and Coho Salmon Escapement Surveys for
 Regional Operational Plan SF.2A.2013.16 Northern Cook Inlet Chinook and Coho Salmon Escapement Surveys for 2013-2015 by Samantha Oslund Alaska Department of Fish and Game June 2013 Divisions of Sport Fish
Magnuson-Stevens Act Provisions; Fisheries Off West Coast States; Tribal Usual and
 This document is scheduled to be published in the Federal Register on 06/08/2016 and available online at http://federalregister.gov/a/2016-13469, and on FDsys.gov Billing Code: 3510-22-P DEPARTMENT OF
Wildlife Ad Awareness & Attitudes Survey 2015
 Wildlife Ad Awareness & Attitudes Survey 2015 Contents Executive Summary 3 Key Findings: 2015 Survey 8 Comparison between 2014 and 2015 Findings 27 Methodology Appendix 41 2 Executive Summary and Key Observations
Fishery Manuscript Series No Hatchery Chum Salmon Contribution to Southern Southeast Alaska Commercial Net Fisheries,
 Fishery Manuscript Series No. 13-1 Hatchery Chum Salmon Contribution to Southern Southeast Alaska Commercial Net Fisheries, 26 21 by Malika T. Brunette Andrew W. Piston Steven C. Heinl and Susan K. Doherty
ALASKA DEPARTMENT OF FISH AND GAME
 RC 2 ALASKA DEPARTMENT OF FISH AND GAME STAFF COMMENTS COMMERCIAL, PERSONAL USE, SPORT, GUIDED SPORT, AND SUBSISTENCE FINFISH REGULATORY PROPOSALS COMMITTEE OF THE WHOLE GROUPS 1 6 FOR THE UPPER COOK INLET
A.M. The time between 12:00 midnight and 12:00 noon. Houghton Mifflin Co. 1 Grade 4 Unit 5
 A.M. The time between 12:00 midnight and 12:00 noon. Houghton Mifflin Co. 1 Grade 4 Unit 5 bar graph A graph in which information is shown by means of rectangular bars. Favorite Sea Creature Sea Creature
North Pacific Fishing Crew Demographics and Trends
 North Pacific Fishing Crew Demographics and Trends 1993-2003 Courtney Carothers University of Washington National Marine Fisheries Service Alaska Fisheries Science Center Jennifer Sepez National Marine
OR DUNGENESS CRAB FISHERY:
 E 55 OR DUNGENESS CRAB FISHERY: an economic analysis of productivity and profitability David S. Liao Joe B. Stevens OREGON STATE UNIVERSITY SEA GRANT COLLEGE PROGRAM Publication no. ORESU-T-75-005 AGRICULTURAL
United States Commercial Vertical Line Vessel Standardized Catch Rates of Red Grouper in the US South Atlantic,
 SEDAR19-DW-14 United States Commercial Vertical Line Vessel Standardized Catch Rates of Red Grouper in the US South Atlantic, 1993-2008 Kevin McCarthy and Neil Baertlein National Marine Fisheries Service,
NATIONAL MARINE FISHERIES SERVICE REPORT ON PACIFIC HALIBUT CATCH SHARING PLAN CHANGES FOR 2015
 Agenda Item G.1.b Supplemental NMFS Report 1 November 2014 NATIONAL MARINE FISHERIES SERVICE REPORT ON PACIFIC HALIBUT CATCH SHARING PLAN CHANGES FOR 2015 Table of Contents Purpose of the document... 2
Agenda Item G.1.b Supplemental WDFW Report June 2017
 1 Agenda Item G.1.b Supplemental WDFW Report June 2017 WASHINGTON DEPARTMENT OF FISH AND WILDLIFE REPORT ON SCOPING OF CATCH SHARING PLAN CHANGES AND INTERNATIONAL PACIFIC HALIBUT COMMISSION DATA REQUEST
TRENDS IN PARTICIPATION RATES FOR WILDLIFE-ASSOCIATED RECREATION BY RACE/ETHNICITY AND GENDER:
 TRENDS IN PARTICIPATION RATES FOR WILDLIFE-ASSOCIATED RECREATION BY RACE/ETHNICITY AND GENDER: 1980-2001 Allan Marsinko Professor Department of Forestry and Natural Resources Clemson University Clemson,
Fishery Dependent Data Collection Office of Science and Technology
 Fishery Dependent Data Collection Office of Science and Technology MREP Southeast St. Petersburg, Florida April 22, 2014 Gordon Colvin Summary Overview of Fishery-Dependent Sampling Methods: four basic
Atlantic States Marine Fisheries Commission
 Atlantic States Marine Fisheries Commission DRAFT ADDENDUM XXIV TO THE SUMMER FLOUNDER, SCUP AND BLACK SEA BASS FISHERY MANAGEMENT PLAN FOR PUBLIC COMMENT Summer Flounder Recreational Management in 2013
The Impact of TennCare: A Survey of Recipients 2009
 The Impact of TennCare: A Survey of Recipients 2009 Christopher Carty Research Associate, Center for Business and Economic Research William F. Fox Director, Center for Business and Economic Research and
2001 REVIEW OF THE ATLANTIC STATES MARINE FISHERIES COMMISSION FISHERY MANAGEMENT PLAN FOR WEAKFISH (Cynoscion regalis)
") 2001 REVIEW OF THE ATLANTIC STATES MARINE FISHERIES COMMISSION FISHERY MANAGEMENT PLAN FOR WEAKFISH (Cynoscion regalis) Plan Review Team Rick Cole, DE Louis Daniel, NC Charles Lesser, DE Rob O Reilly,
2001 REVIEW OF THE ATLANTIC STATES MARINE FISHERIES COMMISSION FISHERY MANAGEMENT PLAN FOR WEAKFISH (Cynoscion regalis) Plan Review Team Rick Cole, DE Louis Daniel, NC Charles Lesser, DE Rob O Reilly,
Pacific Halibut Fishery Regulations 2018
 Pacific Halibut Fishery Regulations 2018 INTERNATIONAL PACIFIC HALIBUT COMMISSION 2320 WEST COMMODORE WAY, SUITE 300 SEATTLE, WASHINGTON 98199-1287 PHONE: (206) 634-1838 FAX: (206) 632-2983 WEBSITE: www.iphc.int
Math 15 Test 3 Review Section Change 4.5 yards to inches. Round your answer to the nearest inch. (1 yd = 3 ft, 1 ft = 12 in)
") Page 1 Math 15 Section 6.3 18. Change 4.5 yards to inches. Round your answer to the nearest inch. (1 yd = 3 ft, 1 ft = 12 in) 30. Change 528 inches to feet. (1 ft = 12 in) 42. Change 3 1/16 pounds to ounces.
Page 1 Math 15 Section 6.3 18. Change 4.5 yards to inches. Round your answer to the nearest inch. (1 yd = 3 ft, 1 ft = 12 in) 30. Change 528 inches to feet. (1 ft = 12 in) 42. Change 3 1/16 pounds to ounces.
Dauphin Lake Fishery. Status of Walleye Stocks and Conservation Measures
 Dauphin Lake Fishery Status of Walleye Stocks and Conservation Measures Date: December, 21 Dauphin Lake Fishery Status of Walleye Stocks and Conservation Measures Background: Walleye stocks in Dauphin
National Oceanic and Atmospheric Administration. Fisheries of the Caribbean, Gulf of Mexico, and South Atlantic;
 This document is scheduled to be published in the Federal Register on 02/05/2019 and available online at https://federalregister.gov/d/2019-01117, and on govinfo.gov BILLING CODE 3510-22-P DEPARTMENT OF
Fishery Management Report No Pasagshak River Weir Report, 2015
 Fishery Management Report No.15-37 Pasagshak River Weir Report, 2015 by Mark J. Witteveen Alaska Department of Fish and Game September 2015 Divisions of Sport Fish and Commercial Fisheries Symbols and
California Department of Fish and Wildlife Report to the International Pacific Halibut Commission on 2017 California Fisheries
 IPHC-2018-AM094-AR08 Received: 22 December 2017 California Department of Fish and Wildlife Report to the International Pacific Halibut Commission on 2017 California Fisheries California Department of Fish
Draft Addendum V For Board Review. Coastal Sharks Management Board August 8, 2018
 Draft Addendum V For Board Review Coastal Sharks Management Board August 8, 2018 Outline Overview Statement of the Problem Background Management Options Questions Overview May 2018: Board was presented
OPTIONS FOR DISCUSSION ON FISHING IN MULTIPLE IFQ MANAGEMENT AREAS
 OPTIONS FOR DISCUSSION ON FISHING IN MULTIPLE IFQ MANAGEMENT AREAS Agenda Item G.9.a NMFS Report June 2016 This report provides options for discussion on fishing in multiple individual fishing quota (IFQ)
2017 Regulatory Proposals
 2017 Regulatory Proposals Jamie Goen Agenda Item 7 IPHC-2017-AM093-10 Rev_1 IPHC-2017-AM093-PropA-P D. Griffay Regulatory Proposals * Each Fall IPHC solicits regulatory proposals from IPHC staff, agencies,
1. A Report to the Attorney General of the State of Alaska I TO THE EXXON VALDEZ OIL SPILL. December 18, 1992 OF RECREATIONAL FISHING LOSSES RELATED
 A PRELIMINARY ECONOMIC ANALYSIS OF RECREATIONAL FISHING LOSSES RELATED TO THE EXXON VALDEZ OIL SPILL Richard T. Carson W. Michael Hanemann December 18, 1992 1. A Report to the Attorney General of the State
Estimating Ridership of Rural Demand-Response Transit Services for the General Public
 Estimating Ridership of Rural Demand-Response Transit Services for the General Public August 2016 prepared for US DOT prepared by Jeremy Mattson North Dakota State University Upper Great Plains Transportation
NATIONAL MARINE FISHERIES SERVICE REPORT
 Agenda Item J.1 Situation Summary April 2007 NATIONAL MARINE FISHERIES SERVICE REPORT National Marine Fisheries Service (NMFS) Southwest Region and Science Center will briefly report on recent developments
Special Publication No. BOG Customary and Traditional Use Worksheet: Snowy Owl, Game Management Units 17, 18, 22, 23, and 26
 Special Publication No. BOG 2016-05 Customary and Traditional Use Worksheet: Snowy Owl, Game Management Units 17, 18, 22, 23, and 26 Prepared by Alaska Department of Fish and Game, Division of Subsistence
Fishery Data Series No Kodiak Management Area Salmon Escapement and Catch Sampling Results, 2015
 Fishery Data Series No. 16-19 Kodiak Management Area Salmon Escapement and Catch Sampling Results, 2015 by Michelle L. Wattum Alaska Department of Fish and Game April 2016 Divisions of Sport Fish and Commercial
[FWS R1 ES 2015 N076; FXES FF01E00000] Endangered and Threatened Wildlife and Plants; Revised Draft Recovery Plan for
![[FWS R1 ES 2015 N076; FXES FF01E00000] Endangered and Threatened Wildlife and Plants; Revised Draft Recovery Plan for](/thumbs/87/96960993.jpg "[FWS R1 ES 2015 N076; FXES FF01E00000] Endangered and Threatened Wildlife and Plants; Revised Draft Recovery Plan for") This document is scheduled to be published in the Federal Register on 06/04/2015 and available online at http://federalregister.gov/a/2015-13624, and on FDsys.gov DEPARTMENT OF THE INTERIOR Fish and Wildlife
This document is scheduled to be published in the Federal Register on 06/04/2015 and available online at http://federalregister.gov/a/2015-13624, and on FDsys.gov DEPARTMENT OF THE INTERIOR Fish and Wildlife
Standardized catch rates of U.S. blueline tilefish (Caulolatilus microps) from commercial logbook longline data
 from commercial logbook longline data") Standardized catch rates of U.S. blueline tilefish (Caulolatilus microps) from commercial logbook longline data Sustainable Fisheries Branch, National Marine Fisheries Service, Southeast Fisheries Science
Standardized catch rates of U.S. blueline tilefish (Caulolatilus microps) from commercial logbook longline data Sustainable Fisheries Branch, National Marine Fisheries Service, Southeast Fisheries Science
Year End Report of The Fishing Company of Alaska Offshore Rockfish Cooperative
 Year End Report of The Fishing Company of Alaska Offshore Respectively submitted to: Regional Administrator NMFS Alaska P.O. Box 21668 Juneau, Alaska 99802 December 15, 2010 TABLE OF CONTENTS I. INTRODUCTION.
FEDERAL SUBSISTENCE REGIONAL ADVISORY COUNCIL Membership Application & Nomination Packet for CLOSING DATE: January 29, 2016
 FEDERAL SUBSISTENCE REGIONAL ADVISORY COUNCIL Membership Application & Nomination Packet for 2016 CLOSING DATE: January 29, 2016 Like us on Facebook! www.facebook.com/subsistencealaska Federal Subsistence
STANDARDIZED CATCH RATES OF QUEEN SNAPPER, ETELIS OCULATUS, FROM THE ST. CROIX U.S. VIRGIN ISLANDS HANDLINE FISHERY DURING
 STANDARDIZED CATCH RATES OF QUEEN SNAPPER, ETELIS OCULATUS, FROM THE ST. CROIX U.S. VIRGIN ISLANDS HANDLINE FISHERY DURING 1984-1997 by Shannon L. Cass-Calay and Monica Valle-Esquivel National Marine Fisheries
CALIFORNIA DEPARTMENT OF FISH AND WILDLIFE UPDATE ON LANDINGS OF TUNA, SWORDFISH AND OTHER PELAGICS
 Agenda Item H.2.c Supplemental CDFW Report 1 November 217 CALIFORNIA DEPARTMENT OF FISH AND WILDLIFE UPDATE ON LANDINGS OF TUNA, SWORDFISH AND OTHER PELAGICS CDFW Summary of HMS Landings Data Improvement
Report to the North Pacific Fishery Management Council on the 2012 Bering Sea Pollock Mothership Salmon Savings Incentive Plan
 Report to the North Pacific Fishery Management Council on the 2012 Bering Sea Pollock Mothership Salmon Savings Incentive Plan F. Joseph Bersch III, IPA Representative This report is to the North Pacific