@2012. Gohar A. Petrossian ALL RIGHTS RESERVED
|
|
|
- Hector Chase
- 6 years ago
- Views:
Transcription
1 @2012 Gohar A. Petrossian ALL RIGHTS RESERVED
2 THE DECISION TO ENGAGE IN ILLEGAL FISHING: AN EXAMINATION OF SITUATIONAL FACTORS IN 54 COUNTRIES By GOHAR A PETROSSIAN A dissertation submitted to the Graduate School-Newark Rutgers, The State University of New Jersey in partial fulfillment of requirements for the degree of Doctor of Philosophy Graduate Program in Criminal Justice written under the direction of Professor Ronald V. Clarke and approved by Dr. Ronald V. Clarke (Chair) Dr. Norman Samuels Dr. Joel Miller Dr. Michael G. Maxfield (Outside Reader) Newark, New Jersey October, 2012
3 ABSTRACT The Decision to Engage in Illegal Fishing: An Examination of Situational Factors in 54 Countries By GOHAR PETROSSIAN Dissertation Director: Professor Ronald V. Clarke The rising global demand and the increasing value of fish and fish products have made international illegal fishing a lucrative business. Despite the regulatory measures undertaken internationally, regionally and locally, the problem persists and has significantly impacted fish stocks and the global ecosystem. Nearly 80% of global fish stocks are fully exploited, overexploited or depleted, and illegal fishing is one of the major contributing factors to this problem. Should current rates of depletion continue, most global fish stocks will have collapsed by Coastal countries bear the direct consequences of illegal fishing, as 90% of these activities occur within their territorial waters. Poor coastal countries are particularly affected, since these countries have the richest marine resources that are exploited both internally and externally. The factors contributing to this problem have been studied before, but few studies have examined the problem globally. These studies have focused on such macro-level factors as a country s GDP, governance effectiveness, level of corruption and lack of accountability, political stability, and the degree to which it is able to manage its ii
4 resources. No study to date has examined globally the situational factors influencing the decision to engage in international illegal fishing. This research, therefore, analyzes situational factors by using data on 54 countries. Based on the framework of rational choice and situational crime prevention theories, such predictors as resource attractiveness, access to an easy escape route, formal and informal surveillance, and fisheries management efforts, are explored as significant factors affecting the decision to engage in illegal fishing. Findings confirm all propositions except that examining the effect of informal surveillance. Spatial analyses substantiate these findings and provide further detail about the regional impact of each predictor variable, as well as examine other global patterns. iii
5 ACKNOWLEDGEMENTS This dissertation would not have been possible without the support, guidance and encouragement of many people. I am indebted to my dissertation chair, Dr. Ronald V. Clarke, for everything he has done for me throughout my studies at Rutgers. If I were to write the many reasons why I am thankful to him, this section would most probably be longer than the dissertation itself! Among other reasons, I am grateful to him for playing such an integral role in my intellectual growth. I also wish to express my gratitude to my committee members, Dr. Norman Samuels, Dr. Joel Miller and Dr. Michael Maxfield, for their invaluable assistance and support. Thank you all, for believing in my ability to undertake and successfully complete such an unconventional study. I am fortunate to have Tigran Nanian as my husband. Without his limitless patience with me (!) and his unconditional love, I would not have been able to complete this dissertation. Thank you for being my source of inspiration! I am thankful to my parents for their love and support, and for encouraging me to pursue knowledge. I wouldn t have been where I am today without the great sacrifices and deprivations you had to endure. This dissertation is dedicated to my little sunshine, Sophia Elen Nanian, whose existence has made me strive to become the best I can be to, one day, make her proud. iv
6 TABLE OF CONTENTS Abstract ii Introduction 1 Problem Statement 1 Dissertation Outline 3 Chapter 1 The Fishing Industry 6 A Brief History 6 Introduction 6 The two periods of industrialization and expansion of fisheries 7 The first industrialization period ( ) 7 The second industrialization period ( ) 8 Fisheries, Fishers and the Fishing Industry 10 The fishing industry and its main sectors 10 Types of capture fisheries 11 Global fisheries production and trade 12 Fishers and their workforce 13 How are Fish Caught? 14 An overview of fishing gear 14 An overview of fishing techniques 16 An overview of fishing vessels 17 Chapter Summary 20 Chapter 2 An Overview of Illegal, Unreported and Unregulated (IUU) Fishing and Related Problems 21 Defining IUU Fishing 21 The Impact of Illegal Fishing 22 How big is the problem? 22 Where does it occur? 23 v
7 How does it affect developing countries? 24 How does it affect the marine ecosystem? 25 Facilitators of Illegal Fishing 27 Flags of convenience 27 Refrigerated cargo vessels 29 Ports of convenience 30 Chapter Summary 31 Chapter 3 Global Measures Adopted to Address Illegal Fishing 33 Instruments Proposed by the United Nations 33 Legally-binding instruments 33 Voluntary agreements 35 Other International Measures 36 Regional Measures 38 Notable State Measures and Bilateral Agreements 40 Regional Fisheries Management Organizations (RFMOs) and their Role 41 Fisheries Certifications as a Means to Control Illegal Fishing 43 Trade-Related Control Measures 44 Chapter Summary 44 Chapter 4 Exploring the Factors Contributing to Illegal Fishing 46 Global Research 46 Regional Research 48 Country-Specific Case Studies 52 Chapter Summary 56 Chapter 5 Theoretical Framework 61 Rational Choice Theory 61 Situational Crime Prevention 64 Rational Choice Theory, Situational Crime Prevention and Illegal Fishing 67 vi
8 Propositions Derived from Rational Choice Theory and Situational Crime Prevention 69 Chapter 6 Research Design 71 Introduction 71 Units of Analysis 72 Data Sources 74 Source 1: University of British Columbia Fisheries Centre 74 A. Compliance Reports 74 B. The Sea-Around-Us Project 76 Source 2: United States Naval Institute 77 Source 3: Ports.com 78 Source 4: The PASTA-MARE Project 78 Description and Operationalization of Variables 83 Dependent variable 83 Independent variables expected to constrain illegal fishing 85 Formal and informal surveillance 85 Formal surveillance at sea 86 Formal surveillance and control at land 87 Informal surveillance at sea 87 Independent variables expected to facilitate illegal fishing 88 Access to ports of convenience 88 Attractive resource 93 Proposed Hypotheses 94 Chapter Summary 96 Chapter 7 Descriptive Analyses 97 Introduction 97 Descriptive Analysis of Illegal Fishing 97 vii
9 Descriptive Analysis of Independent Variables 99 Attractive resource 99 Access to ports of convenience 101 Monitoring, control and surveillance (MCS) capacity 103 Formal surveillance capacity 108 Detectable (Class A) fishing vessels 109 Summary of Results 112 Chapter 8 Pre- and Post-Analysis Diagnostics and Variable Transformations 115 Introduction 115 Pre-Analysis Diagnostics 116 Testing the normality assumption of the dependent variable 116 Testing the multicollinearity assumption for the four MCS variables 117 Internal consistency reliability test for the four MCS variables 118 Principal components analysis for the four MCS variables 119 Transforming independent variables 122 Detectable fishing vessels 122 Access to ports of convenience 122 Power analysis and sample size estimation 123 Post-Analysis Diagnostics 124 Assessing the assumption of no multicollinearity 124 Examining casewise diagnostics 125 Checking for assumptions 126 Checking for the independence of errors 126 Checking for linearity and homoscedasticity 126 Checking for the normality of residuals 127 Chapter Summary 129 viii
10 Chapter 9 Quantitative Analysis Results 131 Introduction 131 Results of Ordinary Least Squares (OLS) Regression Analysis 131 Summary of Results 136 Chapter 10 Spatial Analysis 138 Introduction 138 Descriptive Spatial Analysis 139 Examining spatial patterns of illegal fishing 139 Examining spatial patterns of availability of highly commercial species 141 Examining spatial patterns of access to ports of convenience 143 Hot- and Cold-Spot Analysis 144 Identifying hot and cold spots of illegal fishing 145 Identifying hot and cold spots of highly commercial species 147 Identifying hot and cold spots based on access to ports of convenience 148 Examining Regional Variations: Geographically Weighted Regression (GWR) Analysis 150 Introduction 150 Results of the overall model 152 Results of the impact of each independent variable 156 Summary of Results 161 Descriptive spatial analysis results 161 Hot- and cold-spot analysis results 162 Geographically Weighted Regression (GWR) analysis results 162 Chapter 11 Discussions and Conclusions 165 Summary of Results 165 Hypotheses measuring constraining factors 166 Hypotheses measuring facilitating factors 168 ix
11 Discussion of Findings 170 The impact of formal surveillance and control 170 The impact of resource abundance 172 The impact of ports of convenience 173 The impact of informal surveillance 174 Theory Implications 175 Implications for Policy 177 Increase the risk: Improve fisheries management and formal surveillance capacity Increase the effort: Enhance international cooperation to address the problem of ports of convenience Reduce the reward: Safeguard the highly commercial species 179 Prioritize response strategies based on your geographic location 180 Considerations on Displacement and Diffusion of Benefits 181 Study Limitations and Suggestions for Future Research 183 Concluding Remarks 188 List of Tables Table 1.1. Fishing Vessels by Type 18 Table 4.1. Table 6.1. Summary Table of Studies Examining Factors Contributing to Illegal Fishing Compliance Score Questions and Scoring Protocols from the Compliance Reports used in the Current Research Table 6.2. Table 6.3. Detected Port Visits by IUU Blacklisted Vessels during Summary of Independent Variables and their Data Sources 94 Table 7.1. Summary of the Scores of the Countries (N=54) on the Degree of Illegal Fishing Occurring within Their Territorial Waters 98 x
12 Table 7.2. Descriptive Statistics on the Number of Highly Commercial Species 99 Table 7.3. Number of Ports of Convenience Available within 1500nm from Each of the Countries 101 Table 7.4. Table 7.5. List of Countries and Ports of Convenience within 1500nm 102 Descriptive Statistics of MCS Scores 104 Table 7.6. Table 7.7. Table 7.8. Table 7.9. Table Best and Worst Performing Countries on their Efforts on Observer Schemes Best and Worst Performing Countries on their Efforts on Catch Inspection Schemes Best and Worst Performing Countries on their Efforts on Vessel Monitoring Schemes Best and Worst Performing Countries on their Efforts to Control Access in Stopping Illegal Fishing Descriptive Statistics on the Average Number of Detectable Class A Fishing Vessels Table 8.1. Table 8.2. Table 8.3. Table 9.1. Intercorrelations between the Four MCS Variables 118 KMO and Bartlett s Test Results 120 Factor Loadings for the Four MCS Variables 121 Simultaneous Multiple Regression Analysis Results 132 List of Figures Figure 1.1. Figure 6.1. Fishing Gear Classification by Type 15 Map of the Study Area 73 Figure The Density of Class A Fishing Vessels Within and Outside of the 81 xi
13 EEZs Figure 6.3. An Example of Calculating the Total Number of Class A Fishing Vessels within the U.S. Exclusive Economic Zone using GIS 82 Figure 6.4. Figure 6.5. Figure 6.6. Geographic Distribution of the Ten Ports of Convenience 90 Distance from Leonardo Harbor, U.S., to Port of Guayaquil, Ecuador 91 An Example of a Calculation of a Centrally Located Coastal Port 92 Figure 7.1. Figure 7.2. Countries Scoring 8 or higher on the Degree of Illegal Fishing Activities within Their Territorial Waters (N=22) Countries with 23 or more Highly Commercial Fishes and their Illegal Fishing Scores Figure 7.3. Figure 7.4. Boxplots of the MCS Scores 105 Boxplot of the Total Number of Patrol Boats per 100,000 sq km 109 Figure 7.5. Figure 8.1. Countries with More than Ten Class A Detectable Fishing Vessels (N=18) A Histogram Testing the Normality of Distribution for the Dependent Variable Figure 8.2. Scree Plot of the Factored Components 120 Figure 8.3. Correlation between Standardized Residual and Standardized Predicted Value 127 Figure 8.4. Figure 8.5. Figure Figure Histogram of the Standardized Residual 128 Normal P-P Plot of Normally Distributed Residuals 129 Degree of Illegal Fishing within 54 EEZs 140 Number of Highly Commercial Species 142 xii
14 Figure Number of Ports of Convenience Available within 1500 nm From Countries EEZs 143 Figure Statistically Significant Hot and Cold Spots of Illegal Fishing 146 Figure Figure Statistically Significant Hot and Cold Spots of Highly Commercial Species Statistically Significant Hot and Cold Spots based on Access to Ports of Convenience Figure 10.7 Figure Figure A Map of Standardized Residuals 154 The Variation in R² Values Across Study Area 156 Regional Variations of the Impact of Each Predictor Variable 157 A. Variation in Regional Impact of Highly Commercial Species B. Variation in Regional Impact of Access to Ports of Convenience C. Variation in Regional Impact of Formal Surveillance 159 D. Variation in Regional Impact of MCS Capacity 160 Bibliography 190 Appendices Appendix A: Appendix B: Appendix C: Appendix D: List of Countries Examined 203 FAO Statistical Areas 204 List of Eighteen Regional Fisheries Management Organizations 205 RFMO Convention Areas 206 xiii
15 Appendix E: Appendix F: Appendix G: Twenty Five Techniques of Situational Crime Prevention 207 Disputed and Joint Territories Excluded from the Current Study 208 Excluded Overseas EEZs Belonging to the Countries Under Study 210 Appendix H: Complete List of Detected Port Visits by IUU Blacklisted Vessels in Appendix I: Centrally Located Ports of 54 Countries 220 Appendix J: Appendix K: List of Highly Commercial Species and Number of Countries Where These Species are Found List of Principal Species per FAO 2009 Yearbook of Fisheries and Aquaculture Statistics VITA 228 xiv
16 1 INTRODUCTION Problem Statement Illegal, unreported and unregulated (IUU) fishing is broadly defined as any fishing activity that does not comply with national, regional or international fisheries management or conservation regulations. IUU fishing activities vary, and these range from underreporting catches to relevant authorities to operating within countries territorial waters or in the high seas without authorization. There are major differences between illegal, unreported and unregulated fishing, which are discussed in detail in chapter two. This research explores the illegal fishing aspect only. In recent years, illegal fishing has gained international awareness, as increasing number of studies have examined its implications for the global ecosystem. According to United Nations Food and Agriculture Organization estimates (FAO, 2005), nearly 80% of global fish stocks are fully exploited, overexploited or depleted 1, and illegal fishing is one of the major contributors to this problem (EFTEC, 2008). Should current rates of depletion persist, most global fish stocks will have collapsed by 2048 (Worm et. al., 2006; as cited in EJF, 2007). Illegal fishing especially affects coastal countries, as 90% of 1 FAO definition, available at Fully exploited: The fishery is operating at or close to an optimal yield level, with no expected room for further expansion. Overexploited: The fishery is being exploited above a level that is believed to be sustainable in the long term, with no potential room for further expansion and a high risk of stock depletion/collapse. Depleted: catches are well below historical levels, irrespective of the amount of fishing effort exerted.
17 2 these activities occur within their territorial waters, known as Exclusive Economic Zones (EEZs) (MRAG, 2008). A major factor related to illegal fishing is the rising global demand and the increasing value of fish and fish products. Between 1960 and 2002, capture of wild fish for human consumption increased from 20 to 84.5 million tons (HSTF, 2006). A recent analysis conducted by the United Nations Food and Agriculture Organization (2008) shows that the value of world exports of fish and fish products, which also include farmed fish, grew by 7% in 2007, reaching $92 billion. China s economic growth is playing a major role per capita fish consumption in China has increased from 5kg in the 1970s, to 26kg presently, a 420% increase in less than 40 years (FAO, 2008). This high demand, coupled with inadequate fisheries management resources, has made illegal fishing a profitable business venue. Evaluations of the factors contributing to illegal fishing have been conducted by a number of academic disciplines, including economics, political science and marine biology, and much of the literature on illegal wildlife trade in general has been published in journals dedicated to conservation, ecology and the protection of the environment (Walchol, et.al., 2003). The available global studies have concentrated on examining corruption and lack of accountability, poor governance, political instability and weak monitoring, control and surveillance capacity as contributing factors to illegal fishing. Despite the available studies, voids remain in the literature regarding the factors that contribute to its occurrence globally. This research, therefore, proposes to explore the situational factors that influence the decision to engage in illegal fishing. Clarke (1997:4) suggests that the commission of specific kinds of crime depends crucially on a
18 3 constellation of particular environmental opportunities, an aspect that has been overlooked in the global studies examining the correlates of illegal fishing. The proposed examination of 54 countries 2, consequently, provides an ideal opportunity to test this approach, as they altogether represent 96% of world fish catch. As such, these countries are considered to be significant sites to examine the current problem. Dissertation Outline This research is presented in eleven chapters. Chapter one provides a general overview on the fishing industry. It begins with a discussion of the history of its development, followed by a description of the main sectors of the industry, types of fisheries and the role of fishers in the industry, as well as global trade patterns. An overview of fishing techniques, gear and vessels is also provided to gain a better understanding about how fishing operations are carried out. Chapter two explores the main issues related to illegal fishing. Drawing on the literature published by non-governmental organizations, regional fisheries management organizations and reports prepared for individual governments, the current chapter provides a general overview of what illegal fishing is, what impacts it has on the human population, the global fish stocks and the ecosystem. It then discusses other issues closely related to illegal fishing. Chapter three outlines the international, regional and local responses to illegal fishing implemented or proposed to date. It first discusses the major international 2 Refer to Appendix A for a list of these countries
19 4 conventions and treaties proposed by the United Nations and other international organizations, followed by a discussion of regional agreements that have been developed by countries to address the problem. The chapter then highlights notable country-level responses. Lastly, it discusses other measures that have been taken to address the problem. Chapter four further studies the problem by exploring the literature that has looked into the contributing factors, as examined by disciplines previously mentioned. This chapter specifically reviews the case studies conducted in individual countries. It also explores the few empirical research studies that have been conducted on the regional level, as well as reviews the studies conducted globally, leading up to a summary of the present state of knowledge in the field. Chapter five provides a review of criminological theories that are applied in the current study to examine the issue of illegal fishing from the micro-level perspective. This chapter provides the background on which the predictor variables are built and hypotheses are formed. Chapter six outlines the variables used in the current study, as well as discusses research design and hypotheses. A detailed discussion on the data sources is also provided in this chapter. Chapter seven discusses the results of descriptive analyses pertaining to the dependent and independent variables. Some major findings of these descriptive analyses are explored further in order to gain more understanding about illegal fishing patterns and its contributing factors.
20 5 Chapter eight outlines the pre- and post-analysis diagnostics that have been performed to test major assumptions pertaining to the dependent and independent variables. It also discusses the methodology that was employed to address the violations of some of these assumptions. Chapter nine summarizes the quantitative findings of the current study. Chapter ten examines the spatial dimensions of the problem by conducting both descriptive and quantitative spatial analyses. The quantitative spatial analyses conducted in this chapter examine the variation in the model predictive power over the study area, as well as provide further detail about the predictive power of each independent variable for the countries examined, thus highlighting the importance of the impact of these variables with a more micro-level focus. Additionally, hot- and cold-spot analyses are performed to examine spatial patterns of illegal fishing and some of its predictors. Lastly, chapter eleven summarizes the findings of the current research, as well as considers both theory and policy implications derived from the findings of this study. Discussions about the study limitations and propositions for future research are also provided in this chapter.
21 6 CHAPTER 1 THE FISHING INDUSTRY A Brief History Introduction Fishing grounds have been one of the primary hunting grounds for humans for centuries, and fishing is one of the oldest human activities (Gelchu and Pauly, 2007). Early humans caught fish for their families and kin using rudimentary gear. Fishing gear, are in fact, among the oldest tools ever made by humans, and humans began using these gear earlier than any other artifacts surviving today (Watson, et. al., 2004). In some countries, for example Spain, some methods, such as beach combing and wading, are still used today (Vincent, 2004, as cited in Watson, et. al, 2004). Within the capability of early humans were also some more sophisticated gear, such as nets, fish traps, and baited hooks constructed of bone (Watson, et. al, 2004). Today, fishers employ a wide variety of sophisticated techniques and vessels, and fish in expansive fishing grounds. This is primarily due to the growth of the human population, which necessitated the shift from harvesting small quantities of fish to developing means to catch fish in bulk (Brandt, 1972, as cited in Gelchu and Pauly, 2007). Two distinct periods mark the beginning of this incredible expansion of fisheries worldwide and growth of fishing into a multi-billion dollar industry.
22 7 The two periods of industrialization and expansion of fisheries The first industrialization period ( ) No century has seen as remarkable an increase in the number of fishing boats and means by which fish are caught as the last decades of the 19 th century, which mark the beginning of the first industrialization period and the expansion of global fisheries. This growth has been especially noticeable in Europe and North America (Brandt, 1972, Cushing, 1988 and Pauly, et.al, 2002; as cited in Gelchu and Pauly, 2007), and was driven by high demand in fish due to increases in population and urbanization (Gulland, 1974). The introduction of steam drifter vessels and increased mechanization means lead to significant expansions of fishing activities farther into offshore fishing grounds, thus allowing broader harvesting opportunities. Similar noticeable expansions took place in other parts of the world during the same period. Japan s fisheries expansion began in 1890s, with the Sino-Japanese War ( ) and Russo-Japanese War ( ) marking the first phase of fleet motorization in the country (Takayam, 1963, as cited in Gelchu and Pauly, 2007). In China, fisheries were an integral part of their livelihood as far back as the 12 th century (Solecki, 1966, as cited in Gelchu and Pauly, 2007), but China has not been as successful in expanding its fishing operations in Asia as Japan was. This was due to the fall of the Ch`ing dynasty, the civil war and the subsequent Japanese invasion, which was a major setback that lasted until the Chinese communist party came to power in 1949 (Jia and Chen, 2000).
23 8 World War I ( ) stalled fishing activities in much of Europe for a short period of time, but the war s aftermath lead to increased fish catches resulting in the depletion of several fish stocks in the North Atlantic (Gelchu and Pauly, 2007). World War I also marked the expansion of Japan s overseas fishing interests into the Pacific, from the Bering Sea to the South China Sea, and into the South Pacific (Gelchu and Pauly, 2007). The second industrialization period ( ) The second industrialization period, marked by yet another leap in fisheries production worldwide, corresponds to the aftermath of the Second World War, and this leap was driven by the post-war economic recovery (Gulland, 1974). This growth was also due to the fisheries industrialization in developing countries brought about by the United Nations Food and Agriculture Organization projects that included technology transfers and the establishment of bilateral development aid (Chidambaram, 1963, Thiele, 1999, as cited in Gelchu and Pauly, 2007). The second industrialization period is considered to be the most important phase of the expansion of fisheries production. This period is marked by considerable improvements in fishing techniques and fishing gear, as well as the growth of the size of the vessels (Gelchu and Pauly, 2007). At the time, the former Soviet Union had the largest number of factory trawlers capable of traveling great distances and fishing at great depths (Solecki, 1979), but trawlers were also common and widely used in Europe and North America (Anon, 2002, as cited in Gelchu and Pauly, 2007).
24 9 The aftermath of World War II also lead to the rapid growth of the Japanese fishing industry, and this was primarily due to the need to fill the food deficit that emerged in the late 1940s in the country (Asada, et. al., 1983, APO, 1988, as cited in Gelchu and Pauly, 2007). China s first fisheries expansion period (1950 through 1959), also known as the period of initial development (Jia and Chen, 2001) coincided with the beginning of this industrialization period. Other countries, that included South Korea and India, Philippines, Malaysia, Indonesia and Thailand, experienced similar expansions in their fisheries productions, and this was primarily due to the availability of modernized fishing technologies and gear, as well as the motorization of fishing vessels (Gelchu and Pauly, 2007). Surprisingly, it was not until after World War II that the fishing capacity in Australia and New Zealand was notably expanded (Bian, 1985). Neither was this expansion significant in the South American-Caribbean region until the same period. While the coastal African countries depended heavily on fish for livelihood for centuries, the development of the African fishing industry was slow, and before the 1950s, primarily small artisanal vessels exploited the African fisheries (Johnson, 1992). It was only in the late 1950s that newly decolonized African countries took the initiative to expand their fisheries programs, and this was mainly the initiative of European owners of small fleets in these countries (Njifondjou and Njock, 2000). By the late 1960s, Western and Southern-sub regions, which accounted for more than 80% of the continent s marine resources (Tvedten and Hersoug, 1992), expanded the exploitation of their natural resources (Lawson and Kwei, 1974, as cited in Gelchu and Pauly, 2007). The global expansions in technology, gear and vessels made the harvesting of fish easy, and lead to the manipulation of fisheries worldwide. This expansion, however, also
25 10 lead to the collapse of some important fisheries in the 1960s and 1970s, which included the Californian sardine, North Atlantic herring, Peruvian anchovy, North Sea mackerel and Atlantic menhaden fisheries (Gulland, 1974). It was as early as 1970s that overfishing became a serious problem and lead to the depletion of many of the world s fish stocks (Gelchu and Pauly, 2007). The problem of overfishing, coupled with the growing sense of failure of the international community to properly manage marine resources, lead to the unilateral declaration of the Exclusive Economic Zones by many countries in 1974 at the Third United Nations Conference of the Law of the Sea in Caracas, Venezuela. These exclusive economic zones extended state jurisdictions over marine resources to 200 nautical miles from coast. This change in access forced coastal countries that had been operating in distant fisheries of other countries to limit their operations to their own EEZs and international waters (MacSweet, 1983, Garcia and Newton, 1997, as cited in Gelchu and Pauly, 2007). However, this did not stop the overexploitation of marine resources, a problem that persists today. Fisheries, Fishers and the Fishing Industry The fishing industry and its main sectors The fishing industry today includes a conglomerate of activities that aim at taking, culturing, processing, preserving and storing, as well as transporting, marketing and selling fish or fish products. According to the United Nations Food and Agriculture Organization, the fishing industry is comprised of three main sectors, which include the commercial, subsistence or traditional, and recreational sectors. The commercial sector,
26 11 in turn, comprises the harvesting, processing and marketing chains (FAO, n.d.). Activities in the commercial sector are aimed at harvesting and selling fish and fish products, and generally include enterprises or individuals involved in a wide range of related activities. Subsistence or traditional fisheries are usually small-scale, and the fish caught are shared or consumed directly by the families of fishers. The recreational sector does not include sale or trade of fish, but rather consists of enterprises that manufacture and retail fishing equipment, apparel, books and magazines, as well as engage in the design and sale of recreational fishing boats. Types of capture fisheries Fisheries are generally classified into industrial, commercial, small-scale, artisanal, subsistence, traditional and recreational (FAO, n.d.). Fisheries targeting species for reduction purposes, such as for fishmeal or manufacture of fish oil, are generally referred to as industrial fisheries, and these are the largest fisheries in the world. Industrial fishing almost exclusively targets small species inhabiting the upper layer of the sea, also known as pelagic fishes, and these species are not in demand for direct human consumption. Such industrial species as sprat, capelin and horse mackerel are used in fish oil that is, in turn, used in a range of products that include margarine and biscuits (Marine Conservation Society, n.d.). The Peruvian purse seine fishery for anchoveta, which is considered to be the world s largest fishery, is an example of an industrial fishery.
27 12 Commercial fisheries are the second largest fisheries, and involve species that are sold in markets for direct human consumption. Commercial fisheries are generally exploited by individuals and enterprises that aim at harvesting the fish for sale on the market. These fisheries, consequently, supply the seafood markets. In turn, catches from small-scale, subsistence and traditional fisheries are mainly consumed directly by the families of the fishers and are found close to shore, and these fisheries are exploited by using small fishing vessels. Fish caught from these fisheries are rarely used for sale, and are often exchanged for other goods or services by local fishermen (FAO, n.d.). These fisheries are generally family-owned. Artisanal fisheries share most of the same characteristics as these small-scale, subsistence and traditional ones. However, artisanal fisheries can be exploited for either subsistence or commercial purposes, and the fish caught at these fisheries are either for consumption by the families of the fishers, sale in local markets or exportation. Vessels used in artisanal fisheries range from small one-person canoes in poor developing countries, to trawlers, seiners or long-liners that are over 20 meters (approximately 65 feet) long, which are more common in developed countries (FAO, n.d.). Global fisheries production and trade The global capture fisheries production in 2008 was estimated to be about 90 million tones, which translates into a first-sale value of about $94 billion (FAO, 2010). The largest fisheries production is in China, with an estimated 15 million tones, followed by Peru and Indonesia.
28 13 The world s top ten exporters of fish and fisheries products, as of 2008, were China, Norway, Thailand, Denmark, Vietnam, United States, Chile, Canada, Spain and Netherlands, in that order. Of these, China, Norway and Thailand accounted for 44.5% of all exports from the top ten subtotals, and about 20% of all global exports. Conversely, the world s top ten importers of fish and fisheries products are Japan, United States, Spain, France, Italy, China, Germany, United Kingdom, Denmark and South Korea, in that order. About 45% of all global imports are made by Japan, United States and Spain (FAO, 2010). Fishers and their workforce There are a number of actors who make up the fishing industry. Among these, the most important are the fishers, i.e. people who are engaged in the capture production sector of the industry. Fishers may or may not own the vessel they operate. Oftentimes, fishers are employees onboard the fishing vessels engaged in the fishing activity, and they work for the vessel owner, also known as the fishing operator. The vessel owner is generally the person or entity registered in the flag State who has a direct control over the vessel s operations. The true beneficial owners of the vessel may sometimes be anonymous, but they are often closely linked to the person overseeing the fishing operations (UNODC, 2011). As of 2008, an estimated 44.9 million fishers worked in the fishing industry worldwide, of which 85.5% worked in Asia and 9.3% worked in Africa (FAO, 2010). China employs the highest number of fishers, with almost 13.3 million people working as
29 14 fishers or fish farmers. A vast majority of these fishers and fish farmers work for smallscale or artisanal fisheries. Some estimates suggest that these artisanal fishers and fish farmers contribute to almost 50% of the world s fisheries production for direct human consumption (Love, 2010, as cited in UNODC, 2011). How are Fish Caught? An overview of fishing gear New technologies to catch fish and other marine species developed to address the growing human needs for food in the 19 th century. This development occurred following the advent of steam engine, which lead to a better maneuvering of wooden vessels, travelling further distances and the ability to remain in the sea for days. Today, the fishing gear are equipped with technology that provides a huge advantage to fishers. Among these are lobster traps that can be returned to the surface via coded sonar commands, and underwater cameras, which have become commonplace in some fisheries (Watson, et. al., 2004). As of 2012, the United Nations Food and Agriculture Organization (FAO) listed 81 types of fishing gear under 11 categories. These categories are shown in Figure 1.1 below. The gear are further categorized as either mobile/active or static/passive, and this depends on whether they are fixed to the seabed by boats or dragged along (Marine Conservation Society, n.d.).
30 15 Figure 1.1. Fishing Gear Classification by Type Adapted from FAO Each fishing gear is constructed to capture certain types of fish species, and based on this, the 11 fishing gear categories are grouped into three major groups: those that target groundfish, or demersal fishing gear; those that target large pelagic fish (i.e. fish living closer to the surface), and those that target small pelagic fish. Among the major gear used to capture groundfish are bottom trawls, gill nets, hooks and lines, and these are used to capture cod, haddock, flounders, among other species. Seines and long lines, in turn, are used to capture large pelagic fish, such as tuna and billfishes, while midwater
31 16 trawls and mobile nets are among the gear used to capture small pelagic fish, such as mackerels, pilchards, Atlantic menhaden and so on. Depending on the target species availability and demand, some gear are more widely used than others. For example, a study conducted by Watson and colleagues (2004) showed that there had been a dramatic increase in the use of seines and midwater trawl gear since Such gear are used to catch, for example, Australian salmon, herrings, dolphinfishes, anchovies, cods and tunas. An overview of fishing techniques Fishing techniques are also classified by the species they target, and there are about 80 known such techniques. Of these, nine are major techniques, and include American boat purse seining, bottom pair trawling, Danish seining, drum seining, European boat-operated purse seining, midwater pair trawling, pair seining, Scottish seining and two-boat operated purse seine. Four of these nine techniques target exclusively demersal species, while three target pelagic species only. Among the fishing techniques, trawling is considered to be the most important and one of the most efficient methods. It can be carried out from very shallow waters up to a depth of 2000 meters (FAO, n.d.). The American boat purse seining and European boat-operated purse seining target pelagic species that travel in dense schools. Bottom pair trawling and Scottish seining are used to catch demersal, or bottom species. Bottom pair trawling is used to catch European hake, Atlantic cod, flatfish and shrimps and is operated up to 800 meters depths, in both
32 17 marine and inland waters. Drum seining targets salmon and herring, and is seasonal, depending on when fish aggregate into large dense schools. Unlike these techniques, which target either pelagic or demersal species, midwater pair trawling is used to target both, and is used to catch such known demersal species as Atlantic herring, European pilchard, European sprat, hake and sea bass. An overview of fishing vessels Closely associated with the fishing technique classifications are the fishing vessels, which are defined as boats or ships used to catch fish in the sea, lake or river. Fishing vessels are classified into different categories based on their use in the commercial, subsistence or traditional and recreational fishing sectors, as well as the techniques they use. Commercial fishing vessels are generally classified based on the gear they use. For example, a trawler uses trawls or trawl nets to catch fish, while long liners use fishing lines that have thousands of baited hooks that are attached to the main line by branch lines or snoods. The United Nations Food and Agriculture Organization classifies all fishing vessels into ten categories. Each of these categories also contains sub-categories of vessels, which are grouped based on their similar functionality. There are a total of 36 vessel types, which are classified under one of the categories listed in Table 1.1 below.


33 18 Table Fishing Vessels by Type TRAWLERS LONGLINERS Factory Trawlers Freezer Trawlers Wet-fish Trawlers Outrigger Trawlers Beam Trawlers Trawlers nei PURSE SEINERS Freezer Long Liners Factory Long Liners Wet-fish Long Liners Long Liners nei OTHER LINERS Tuna Purse Seiners Purse seiners nei OTHER SEINERS Sein Netters Seiners nei Jigging Line vessels Handliners Pole and Line vessels Trollers Liners nei MULTIPURPOSE VESSELS Trawlers-purse seiners Multipurpose vessels nei
34 19 GILL NETTERS DREDGERS TRAP SETTERS OTHER FISHING VESSELS Pot vessels Trap setters nei Lift netters Lift netters using boat-operated net Lift netters nei Vessels using pump for fishing Platforms for mollusk culture Recreational fishing vessels Fishing vessels nei (Picture Source: FAO Fisheries and Aquaculture:
35 20 According to FAO (2010) estimates, there are some 4.3 million fishing vessels worldwide. Of these 41% are smaller craft without engine propulsions, also known as non-motorized fishing fleet, while the remaining 59% are engine-powered vessels. Of the motorized fishing vessels, 75% are located in Asia, with the remaining of these vessels found in Latin America and the Caribbean (8%), Africa (7%) and Europe (4%) (FAO, 2010, as cited in UNODC, 2011). In addition, about 85% of the motorized vessels are less than 12 meters in length, i.e. small-scale. The larger vessels are predominantly found in the Pacific region, Oceania, Europe and North America (FAO, 2008, as cited in UNODC, 2011). Chapter Summary The purpose of the current chapter was to provide an overview about the fishing industry and its many components. The chapter began with the discussion of the two major phases of the development of the fish production worldwide. These were the phases that lead to the development of the current-day fishing industry as a multi-billion dollar conglomerate. The chapter also provided an overview of the types of fisheries, the fishing industry sectors, as well as the role and the function of the fishers. A discussion on the fishing technologies, gear and vessels was provided to gain a better understanding about how fishing operations are carried out. The chapter also discussed the global trade trends to provide a general understanding of the fishing industry s role in the food markets worldwide.
36 21 CHAPTER 2 AN OVERVIEW OF ILLEGAL, UNREPORTED AND UNREGULATED (IUU) FISHING AND RELATED PROBLEMS Defining IUU Fishing The United Nations International Plan of Action to Prevent, Deter and Eliminate Illegal Unreported Unregulated Fishing (IPOA-IUU fishing) defines IUU fishing as: Illegal: (1) those conducted by national or foreign vessels in waters under the jurisdiction of a State, without the permission of that State, or in contravention with its laws and regulations; (2) those conducted by vessels flying the flag of States that are parties to a relevant regional fisheries management organization, but operate in contravention of the conservation and management measures adopted by that organization; or (3) those conducted in violation of national laws or international obligations, including those undertaken by cooperating States to a relevant regional fisheries management organization (RFMOs) (FAO, 2010). Unreported (1) fishing activities which have not been reported, or have been misreported to the relevant national authority, and in contravention of national laws and regulations; (2) fishing activities undertaken in the area of competence of RFMO [Regional Fisheries Management Organization], which have not been reported, or have been misreported, and in contravention of the reporting procedures of that organization. Unregulated (1) fishing activities in the area of application of a relevant RFMO, that are conducted by vessels in a manner that are not consistent with or contravenes the conservation and management measures of that organization, or (2) fishing activities in areas, or for fish stocks in relation to which there are no applicable conservation or management measures, and where such fishing activities are conducted in a manner inconsistent with States responsibilities for the conservation of living marine resources under international law. When a vessel has authorization to operate within a country s managed exclusive economic zone, it may still engage in illegal fishing activities. There are a range of such activities, and these include (a) using prohibited gear or methods, (b) operating in closed
37 22 areas or during closed seasons, (c) operating with a fake license or vessel registration, and (d) operating without a vessel monitoring system. A vessel operates illegally in the high seas (generally by commercial vessels) if it does not show a flag or other markings. A vessel engages in unregulated fishing if it operates in high seas in contravention of the regulations set forth by the regional fisheries organization(s) responsible for managing those waters. Lastly, a vessel engages in unreported fishing activities if it fails to report or underreports the catches to relevant authorities, or takes prohibited, protected, unauthorized or endangered species. The Impact of Illegal Fishing How big is the problem? Illegal fishing occurs in almost all fishing grounds and is believed to account for a significant proportion of global catches (EJF, 2005). In some important fisheries, illegal fishing is estimated to account for 30% of all total catches, and landings of fish caught by illegal fishing vessels account for 50% of total landings in some ports (EJF, 2005). In some fishing grounds, a great majority of fishing vessels engages in illegal fishing. For example, in 2001, an aerial surveillance of Guinea s exclusive economic zone found, that of the 2313 vessels fishing in the area, about 60% were engaged in illegal fishing (HSTF, 2006). The global scale of illegal fishing is estimated at about million tons (includes unreported and unregulated catch), which is about $ billion annually
38 23 (MRAG, 2008). Of this estimate, approximately $1.25 billion comes from the high seas 3, and the rest is taken from the exclusive economic zones (EEZs) of coastal countries (HSTF, 2006). As such, these coastal states bear the direct consequences of illegal fishing and are impacted the most. Where does it occur 4? The few studies examining the geographic distribution of illegal fishing activities suggest that it is a global problem and it affects almost every coastal country. An assessment conducted in 2005 on global Illegal fishing activities, for example, found that the South Eastern Pacific, the North West Pacific and South East Asia are geographic regions most affected by these activities (MRAG, 2005). Sumaila, et. al. (2006) examined the spatial distribution of vessels incriminated in illegal fishing activities between 1980 and Their study concluded that most illegal fishing activities concentrated in the Asia-Pacific region, especially in South East Asia, the North Pacific and the East Pacific. Pitcher et al. s (2006) evaluation identified high levels of illegal fishing in North Pacific and South East Asia, which includes such countries as China, Indonesia, the Philippines, the Russian Federation, Chinese Taipei, Thailand and Vietnam. A more recent study conducted by MRAG (2008) identified the Eastern Central Atlantic as being increasingly affected by illegal fishing activities. The same study 3 The term high seas was first defined in the 1982 UN Convention on the Law of the Sea, and means all parts of the sea that are not included in the exclusive economic zone, in the territorial sea or in the internal waters of a State, or in the archipelagic waters of an archipelagic State. Essentially, this is the area of the open ocean that is not within the territorial waters or jurisdiction of any particular country. 4 Refer to Appendix B for a map of FAO statistical areas.
39 24 concluded that, in response to declining resource status, there had also been increased overall levels of illegal fishing in the South West Atlantic. From these studies it is evident that illegal fishing activities are widespread and posit a serious threat to fisheries resources worldwide. How does it affect developing countries? Due to depleting resources within their waters, rich fishing countries are turning to developing countries for their marine resources, and this has brought increasing external pressures on the latter. According to recent estimates, developing countries account for 50% of global exports, while developed countries account for 80% of the value of global trade (FAO, 2008). Swartz, et. al. s (2010) examination of the world s three major fish markets, namely the European Union, the United States and Japan, revealed that in recent years, the European Union has increased its bilateral fishing deals with West Africa, East Africa and a few countries in the South Pacific (Kiribati, Solomon Islands and Micronesia). Meanwhile, over 60% of Japan s marine catches are from its neighboring EEZs that include China, Russia and South Korea. Lastly, U.S. fish consumption has reached most of the world s fisheries, particularly those off the coast of South America and along Southeast Asian coastlines. The developing countries in Africa are especially affected by illegal fishing activities. In many of the African countries, illegal fishing operators not only exploit their marine resources, but they also take advantage of the fact that a great majority of these
40 25 countries is financially vulnerable. Consequently, to increase revenue, illegal fishing vessel operators recruit crews in these African countries where they can take advantage of unregulated labor markets and minimal controls on working conditions (EJF, 2005). These crews end up working in dangerous conditions and many are subjected to abuse. A recent study published by the Environmental Justice Foundation (2010) reported serious human rights abuses aboard illegal fishing vessels, and these included financial exploitation and withholding of earnings, imprisonment aboard the vessel without food and water, and physical and verbal abuse. The worst cases included murder. How does it affect the marine ecosystem? Illegal fishing vessels often use destructive fishing practices, such as bottom trawling, blast fishing, poison fishing, cyanide fishing and muro-ami nets, all of which have lead to the obliteration, devastation and often permanent damage of the key components of the marine ecosystem (FAO, 2007). Bottom trawl is a heavy net that is dragged across the seafloor, scooping up everything in its way, both target fish and incidentally caught corals. Bottom trawls can destroy large areas of seafloor habitats that give marine species food and shelter, and these damages can sometimes be permanent (Marine Conservation Biology Institute, n.d.). Blast fishing involves the use of a bomb set to explode under water, and it is used in over 30 countries. This practice has lead to the loss of over 50% of the coral reef system in South East Asia (Caldwell and Fox, 2006), an impact that requires an estimated years to recover from (Caldwell, 2006). Poison fishing is fishing with the aid of poisonous plants or substances. In Africa,
41 26 for example, the fishers sew the plants into the water, and within a period of time, which varies according to conditions, fish rise to the surface of the water and can be taken by hand. There are about 325 such plants in Africa (Neuwinger, 2004). Cyanide fishing is also used for this purpose, but its poisonous substance kills coral polyps (an invertebrate that comprises the majority of coral life), and the damage of these polyps leads to the discoloration of coral colonies (Mak, Yanase and Renneberg, 2005). Lastly, muro-ami nets are nets with weighted bags that are pounded to startle fish out of crevices (Bryant et. al., 1998). Illegal fishing practices have also lead to the incidental capture of unintended species. Collectively known as bycatch, as much as 25% of all marine species caught in global fisheries are thrown back into the sea primarily because they are not the intended target. Some estimates suggest that approximately 300,000 whales, dolphins and tortoises, one hundred million sharks, as well as 480,000 metric tons of shrimp are discarded every year (Kuper, no date). Shrimp trawlers account for the highest rate of bycatch within the seas (Alverson, et al., 1994), while longline fishing in protected areas has lead to the annual loss of an estimated 100,000 albatross (Brothers, 1991), some of which are critically endangered (IUCN, 2011). Bottom trawling and dredging, both considered as active-towed gears because they are dragged across the seabed by boats, are among the most destructive gears in use (Watson et. al., 2006), and have lead to the significant damaging of coral reefs and seagrass beds (Chuenpagdee et al, 2003). Lastly, large, slow-growing predatory fish, such as cod, halibut and grouper, and high-value invertebrates, such as shrimp, lobster and large shellfish are particularly affected by illegal fishing (Pauly et al, 1998). In many regions of the world, illegal
42 27 fishing has led to fishing down the food web, a term coined by marine biologists to explain the reduction of marine biodiversity in a process where large predators are gradually replaced by short-lived, fast-growing and small fish (Pauly et al, 1998). This has far-reaching consequences for the functioning of the marine ecosystem. For example, the decline of great sharks in the Northwestern Atlantic has triggered a tropic cascade that collapsed a century-old fishery for bay scallops (Ferretti, et. al., 2008: 953). Facilitators of Illegal Fishing Flags of convenience International maritime law requires that every merchant ship be registered in a country, (i.e. has a flag country). No vessel can leave or arrive into a port without flying a flag. Accordingly, when a vessel is registered to a state, it is subject to that state s regulatory control and, therefore, operates under its laws (United Nations, 2005). When ships fly a flag in a sovereign state that is different from that of the ship owner, it operates a so-called Flag of Convenience (FOC). This practice began after the First World War when non-maritime countries such as Panama, Liberia and Honduras began registering foreign-owned vessels for economic reasons while exercising minimal control over the operations and activities of these registered vessels (Osieke, 1979). This practice was fairly common among American-owned ships as well, as vessel owners, frustrated with increasing regulations and increasing labor costs, started registering their vessels in Panama in the 1920s (McLeod, 1964).
43 28 States that operate open registries are often referred to as Flags of Convenience States, and these states allow foreign-owned vessels to fly their flag once registered. Many of these states are also the states that lack the resources or the will to monitor and control vessels flying their flag (EJF, 2009). Most importantly, a state can only be bound to legal requirements if it has ratified the pertinent international instruments, and many of these states operating open registries have not done so (EJF, 2009). Lastly, many of these open registries, despite their international obligations, do not investigate or take into account whether a fisheries vessel has had a history of illegal fishing before registering them under their flag (EJF, 2009). Consequently, illegal fishing vessels are increasingly using FOC, a practice that allows them to bypass international and national fisheries regulations and controls. Flags of Convenience are easy to acquire, and can be obtained over the Internet for a few hundred dollars. Online sites are used by vessel owners not only to register their ships, but also to register a company (EJF, 2009). Moreover, vessels can re-flag and change names several times in a season, which is a practice known as flag-hopping. The name, nationality and country of residence of the true owner of these vessels is often carefully hidden (Gianni and Simpson, 2005), which makes it extremely difficult to identify and penalize the illegal vessel owners. Panama, Belize, Honduras and St Vincent and the Grenadines currently top the list of ten FOC states in terms of numbers of large-scale (greater or equal to 24 meters in length) fishing vessels on their registries, and because they are most often identified by regional fisheries management organizations as being the flag states of particular concern (Swann, 2002). Gianni and Simpson (2005) analyzed information available
44 29 from Lloyd s Register of Ships, which provides a good indication of trends in relation to fishing vessels and the Flags of Convenience system. Their analysis revealed that large fishing vessels from Panama, Belize, Honduras and St Vincent and the Grenadines comprised a significant percentage of all FOC vessels registered on the system, with the four countries together owning more than 75% of the large vessels. MRAG (2005) identified several factors that may create an incentive for some vessels to re-flag under open registries and to engage in illegal fishing. These included increased costs of fishing, reduction in catch in relation to fishing effort, the globalization of capital, and increased international and national fishing regulations. Moreover, registering under an open registry allows these fishing vessels to avoid regulations pertaining to health and safety, insurance, crew employment conditions; as well as those pertaining to taxes, national and international legislation relating to fisheries, as well as environmental and maritime laws and conventions. Refrigerated cargo vessels Many distant-water fishing vessels stay on high seas for long periods of time. They can do so primarily because their catch can be transshipped through refrigerated cargo vessels, known as reefers. Reefers are used to not only transport the catch, but also to refuel, rotate crews and resupply bait, food and water (Gianni and Simpson, 2008). This practice is also used by illegal fishing vessels, because it allows them to remain in distant waters for long periods of time without having to make costly runs into ports to offload fish (Gianni and Simpson, 2008). In West Africa, field investigations
45 30 undertaken by Environmental Justice Foundation found that almost all illegal reefers were documented flying flags of convenience. A total of 700 reefers are currently registered with flags of convenience, with Panama, Bahamas and Liberia accounting for 70% of those vessels (EJF, 2009). Ports of convenience Ports of convenience (POC) are ports with a free economic zone status 5. As such, they generally have favorable customs regulations and lax controls over transshipment of goods 6. POCs are attractive to illegal fishing vessels because they offer many customs advantages, which include exemptions from import duty, warehousing of goods with no time limits, serving as free destinations for goods, and having no customs procedures for goods leaving toward a third country. In addition, no transshipment regulations exist in such ports, which make it difficult for both flag and port states to detect these vessels. This allows the illegally caught fish to relatively easily enter the legitimate markets. Literature has implicated several ports as being used by illegal fishing vessel operators. One such known port is Las Palmas de Gran Canaria, located in Spain s Canary Islands, which serves as the largest point of entry for fish from West Africa coming into Europe. For example, between January 2003 and December 2006, about 17 5 Free economic zones are areas designated by countries, where both local and international companies can conduct business without being taxed or are taxed very lightly. Currently, 29 countries have such zones, with Italy offering 22 such zones, followed by United Arab Emirates (12) and Egypt (10). 6 Ports with a free economic zone status generally have lax customs regulations and limited inspections on arriving ships. These are also called free ports or bonded areas.
46 31 of the 53 vessels documented by the Environmental Justice foundation (EJF) were linked to illegal fishing activities, and these vessels have visited the port to unload their catches (EJF, 2007). Once fish have been unloaded in Las Palmas, it can be transported anywhere within the European Union without further inspection of its origin or legality, thus allowing for and easy laundering of illegally caught fish into the legal market (EJF, 2007). Other ports mentioned in literature include Port Louis (Mauritius), Cape Town (South Africa) the Tanger Exportation Free Zone (Morocco) (DFID, 2008), Mombasa (Kenya), Port Victoria (Seychelles) (Rigg et al, 2003), Qingdao (China), Tanjung Priok (Indonesia), Walvis Bay (Namibia), Montevideo (Uruguay), and Tenjog Pelepas (Malaysia) (HSTF, 2006). Literature, however, does not provide further detail on these ports pertaining to the degree of illegal fishing activities occurring there. Chapter Summary The current chapter provided a general overview of the issues related to illegal fishing. It began with a summary and explanation of the definition of IUU fishing, followed by a discussion of what impact illegal fishing has had on coastal countries. Discussions on the extent of the problem, global patterns, as well as the type of countries significantly affected by it are provided to gain a better understanding of the problem. The chapter revealed that, while every coastal country bears direct consequences of illegal fishing, developing nations are among the ones most affected by it. This is primarily due to the growing global demand for fish and fish products, as well as increasing dependence on the developing countries to supply the major global markets
47 32 with fish and fish products. Illegal fishing is made possible through such widely used practices as operating under a flag of convenience, which allows illegal fishing vessel owners to avoid national and international fisheries laws; using a port of convenience, i.e. a port with lax customs regulations, to unload illegal catch; or transshipping the illegal catch at high seas through the use of refrigerated cargo vessels. The combination of increasing global demand for fish and the availability of means to avoid both national and international fisheries laws, therefore, creates ideal conditions for vessels to engage in illegal fishing globally.
48 33 CHAPTER 3 MEASURES ADOPTED TO ADDRESS ILLEGAL FISHING 7 Instruments Proposed by the United Nations The international fisheries instruments designed for oceans governance proposed by the United Nations are comprised of hard laws and soft laws. Hard laws refer to legally binding instruments of a global nature, and include treaties and charters. Once a country ratifies any of these laws or agreements, it is legally bound to implement it fully through the development and enforcement of appropriate domestic legislation. Soft laws refer to non-binding declarations, codes of conduct, resolutions and plans of action, and depend on the countries willingness to voluntarily commit to these arrangements. These are generally easier to negotiate, and even if a country commits to any of the codes or agreements, there is little that can be done to monitor whether, in practice, anything has or is being done by that country. Legally-binding instruments The United Nations Conference on the Human Environment held in Stockholm in 1972 and the Third United Nations Conference on the Law of the Sea (UNCLOS) that ran from 1973 to 1982 (United Nations, 1983), provided the background for international fisheries development during the 1970s and 1980s (Beckett, 1998). Among the most notable legally binding instruments are the 1982 United Nations Convention on the Law 7 The chapter discusses only some notable international, regional and national measures, and is not comprehensive as such. For a detailed review of international and national case law, multilateral treaty actions and related issues, see OceanLaw Information and Consultancy Services (2007).
49 34 of the Sea; the 1982 United Nations Fish Stock Agreement, (UNFSA); the 1995 Agreement for the Implementation of the Provisions of the United Nations Convention on the Law of the Sea of 10 December 1982 Relating to the Conservation and Management of Straddling Fish Stocks and Highly Migratory Fish Stocks (UN Fish Stock Agreement); and the 1995 Convention on the Conservation and Management of Highly Migratory Fish Stocks in the Western and Central Pacific Ocean (MHLC). The 1982 UNCLOS deals with all matters related to oceans and seas, and, as such, provides rules about the regulation of all uses of oceans and seas. It also suggests a framework to develop conservation and management measures concerning marine resources not only within the Exclusive Economic Zones of the countries, but also on the high seas. The 1982 UNFSA requires States to ensure the sustainable use of fish stocks by imposing obligations on participating Parties to protect the marine environment through the adoption of measures to maintain or restore populations of species that are part of the same ecosystem. The 1995 UN Fish Stock Agreement elaborates on the provisions of the UNCLOS and concerns the conservation and management of straddling fish stocks and highly migratory fish stocks that are situated beyond areas under national jurisdiction. The Agreement also specifies requirements concerning compliance, catch verification and reporting for the purposes of monitoring and enforcement. Lastly, the 1995 MHLC was developed to ensure a long-term and sustainable use and effective conservation of highly migratory fish in the western and central Pacific Ocean, and was a measure adopted in Honolulu, United States. Although the agreement mainly deals with highly migratory fish stocks, it has some broad provisions that can be applied for the protection of marine ecosystems, such as minimization of waste/discards, prevention or
50 35 elimination of overexploitation of other fish stocks, as well as enforcement of conservation measures through effective monitoring, control and surveillance. Voluntary agreements Throughout years, the United Nations has developed non-binding codes and voluntary agreements and encouraged governments to apply the provisions of these codes into local law to help them protect their marine resources. Among the most notable codes of conduct are the 1995 FAO Code of Conduct for Responsible Fisheries, the 2001 International Plan of Action-Illegal, Unreported and Unregulated Fishing (IPOA-IUU Fishing), and the 2005 FAO Port State Model Scheme. The 1995 FAO Code of Conduct for Responsible Fisheries has important links to the UNCLOS. The code outlines a framework to be used by states in their efforts to minimize waste, discards, and negative impacts of fishing. The Code addresses general principles that relate to fisheries management, fishing operations, aquaculture development, fisheries integration into coastal area management, as well as trade and fisheries research. The 2001 IPOA-IUU was designed to help countries in their effort to prevent, deter and eliminate illegal fishing either by acting directly or through the relevant regional fisheries management organization. The IPOA-IUU proposes provisions for port States to collect specified information on fishing activities and possibly deny the landings or transshipment of catch to IUU fishing vessels. In addition, states can impose trade-related measures, such as import bans, as well as adopt legislative measures to make it an offense
51 36 to trade in fishing caught by IUU vessels. The IPOA also urges coastal States to implement effective control and surveillance in their waters in addition to the development of port control measures. The 2005 FAO Port State Model Scheme describes the port State measures that should be applied by responsible port States and relevant regional fisheries management organizations (RFMOs). To ensure compliance at ports, the Model Scheme proposes measures that apply not only to fishing vessels but also to any vessel directly involved in fishing operations, such as support ships and carrier vessels. Some of the important provisions of the Scheme refer to port states denying landing, transshipment or processing of fish caught by vessels flagged to a non-party of an RFMO; denying access to port to vessels listed as IUU fishing vessels by relevant fisheries bodies; requiring vessels to provide prior notice for port access that include such information as vessel identification, fishing license, vessel monitoring system, and information on catch and fishing trip; and requiring port inspectors to communicate with the flag State should it be determined that the vessel had been used for IUU fishing. Other International Measures Several international measures have been adopted in the last five decades to address the issue of effective sustainability and conservation of biodiversity. While pertaining to biodiversity and conservation, these measures have strong implications for fisheries as well (FAO, 2010). Among the most notable of these measures include the 1948 International Union for Conservation of Nature and Natural Resources (IUCN) Red List of Endangered Species Assessment, which is an instrument adopted to scientifically
52 37 asses the status of all species, both terrestrial and marine, and assign status pertaining to their vulnerability to become extinct. One of the major contributions of IUCN was the initiation of the establishment of an international convention to govern the trade in animal species and their products, namely the drafting of the Convention on International Trade in Endangered Species of Wild Fauna and Flora (CITES) (Sheikh and Corn, 2005). The first draft of the Convention was produced in 1964, and it went into effect in 1975 after the signing of 21 nations of the Convention in Washington D.C (Sheikh and Corn, 2005). To date, CITES has 175 member states, and governs the international trade in more than 5,000 animal and 28,000 plant species. The CITES signatory countries, known as the Parties, meet every two years at the Conference of the Parties (COP), to discuss the state of select species, consider efforts that have been implemented to safeguard these species, and propose solutions and recommendations. During the 2005 COP, the bluefin tuna was among the species highlighted as needing much more protection than it was receiving. Among the most important contributions of CITES is the listing of the species in appendices (I, II and III), most stringent being Appendix I that restricts the trade of these species internationally. Species listed in Appendix I cannot be traded internationally except for some special circumstances, such as scientific exchange, breeding or educational programs. In the latter cases, the trade must be accompanied by both an import and export permit. The trade in Appendix II species requires an export permit and proof that the trade will not be detrimental to the survival of the species in the wild. Lastly, Appendix III species can be traded when accompanied by an export permit and a certificate of origin, and providing proof that the trade will not be detrimental to the survival of the species is not required
53 38 for these species. When party to CITES, countries are required to implement local legislation governing the trade in the species and providing for penalties for violations. In the United States, for example, the provisions of CITES are implemented through the Endangered Species Act, the Lacey Act, and the Pelly Amendment of the Fisherman s Protective Act (Sheikh and Corn, 2005) 8. Other international instruments that deal with biodiversity and conservation include The Global Plan of Action for the Protection of the Marine Environment from Land Based Activities, the Regional Seas Conventions and associated Action Plans, and the International Convention for the Prevention of Pollution from Ships (FAO, 2010). Regional Measures Among the most notable regional measures adopted to address illegal fishing activities is the Common Fisheries Policy, an initiative launched in 1983 by the European Commission. A reform of the policy was proposed in 2002 and involves limiting fishing capacity by member states in an effort to achieve better balance between the fishing capacity of their fleets and available resources. The Directorate General for Fisheries, comprised of a team of 290 members (the Commission) from such backgrounds as marine biology, naval architecture, economics, law, political science and veterinary sciences, is in charge of managing the Common Fisheries Policy through working with 8 A comprehensive list and short descriptions of U.S. fisheries laws can be found at A thorough review of fisheries laws in select European, Asian, African, Latin American countries, as well as in North America, New Zealand and the South Pacific, is provided in a legislative study prepared for the Food and Agriculture Organization of the United Nations by Cacaud, Kuruc and Spreij (2003).
54 39 stakeholders. Around 25 fisheries inspectors accompany national inspectors on control missions. They may initiate legal procedures against Member States that are determined to have failed in their enforcement responsibility. For example, in 2005, the Commission delivered a EUR 20 million fine against France by the European Court of Justice, along with a periodic penalty of EUR 57 million every six months (until the failings were remedied), for failing to put an end to the systematic capture and landing of undersized hake. In 2007, the Commission opened three new infringement proceedings for underdeclaration of landings and overfishing against Italy and France in connection with the bluefin tuna fishery, and against Poland in relation to the Baltic cod fishery (European Communities, 2009). The Policy was revised in 2007 and includes technical details in the areas such as prior notification of landings, transshipments and consignments, landing and transshipment declarations, port inspections, catch inspection schemes, and administrative cooperation with third countries concerning catch certificates (European Commission, 2010). The Southern African Development Community (SADC) Protocol on Fisheries is a legally binding instrument that provides mechanisms to fight illegal fishing in the region. The Protocol focuses on the management of shared resources, development of harmonized legislation among SADC States, law enforcement, access agreements, and information sharing among member States in their effort to develop effective monitoring, control and surveillance measures to address illegal fishing (DFID, 2007). The Bay of Bengal Program is an intergovernmental initiative launched in 1999 and formally signed by the Governments of Bangladesh, India, Sri Lanka and the Government of Maldives in The program encourages safe fishing practices among
55 40 small-scale artisanal fishermen, raises awareness about fisheries management and capacity building and encourages collaboration between the member States (Hosch, 2009). Notable State Measures and Bilateral Agreements Over years, countries have developed regulatory controls over the trade in illegal wildlife, among these being the legislative remedies addressing illegal fishing specifically. For example, the Lacey Act is a U.S. statute that prohibits trade in illegally caught fish and wildlife, and makes it unlawful for any person subject to the jurisdiction of the United States to import, export, transport, sell, received, acquire, or purchase any fish or wildlife taken, possessed, transported or sold in violation of any law or regulation of any State or in violation of any foreign law (HSTF, 2006). China s domestic laws and regulations require compliance of fishing vessels with set legal and technical requirements regarding distant water fishing (for a thorough discussion, see Xue, 2006). Australia s Fisheries Management Act of 1991 makes it an offense for an Australian national to engage in illegal fishing activities on vessels flagged to any nation (HSTF, 2006). An approach similar to Australia s is South Africa s Marine Living Resources Act of 1998, which applies to South African nationals both inside and outside the country s national territory (Erceg, 2006). Norwegian legislation requires its nationals and residents who fish on the high seas to obtain authorization from the Norwegian Directorate of Fisheries before registering their vessel. The applicants may be refused authorization if the relevant fishery is considered to be in conflict with Norwegian
56 41 fisheries interests or is regulated by an RFMO (Erceg, 2006). The Coastal Fisheries Protection Act and Regulations provide the legal framework for foreign vessels permitted to conduct activities within Canadian waters and ports. These activities range from fishing to transshipment, processing, and provisioning (OECD, 2005). The joint Norwegian-Russian initiative for port state control is among the notable bilateral agreements. The two countries, in May 2007, called for the North East Atlantic Fisheries Commissions, one of the RFMOs, to set out procedures requiring the provision of prior notification of landings of frozen fish that will include declarations from the fishing vessel, as well as verification from the flag state. Before the landings can be authorized by the port state, the flag state must confirm that the fishing vessel had sufficient quota to allow for the catch. Without this confirmation, no landing authorization can be given by the port state (WWF, 2008). Regional Fisheries Management Organizations (RFMOs) and their Role Regional Fisheries Management Organizations (RFMOs) are intergovernmental fisheries organizations of arrangements, as appropriate, that have the competence to establish fisheries conservation and management measures (IPOA-IUU, 2001). RFMOs are composed of members from different fishing nations, and are responsible for the conservation and protection of fish stocks on the high seas and those migrating through the waters of more than a single State. A country bordering several oceans may belong to more than one RFMO. For example, Canada, which borders three oceans, belongs to several RFMOs, including: International Commission for the Conservation of Atlantic
57 42 Tuna (ICCAT), North Atlantic Salmon Conservation Organization (NASCO), North Pacific Anadromous Fish Commission (NPAFC), and Western and Central Pacific Fisheries Commission (WCPFC). RFMOs have a duty to conserve all species associated or affected by their fisheries, including seabirds, turtles, dolphins, sharks and non-target fish. RFMOs may focus on certain species of fish (e.g. the Commission for the Conservation of Southern Bluefin Tuna) or have a wider agenda related to living marine resources within a region (e.g. the Commission for the Conservation of Antarctic Marine Living Resources). These responsibilities have been specified in new international agreements governing the oceans, such as FAO s Code of Conduct for Responsible Fisheries, and the United Nations Fish Stocks Agreement. Among the main responsibilities of RFMOs are setting and allocating quotas for the fish stocks under their management 9, as well as enforcing their quotas through control, monitoring and surveillance activities. These activities include the establishment of port control measures, such as granting authorization to transship or land to vessels included in a white list or prohibiting transshipments and landings from vessels included in a black list (Fabra, et. al., no date; EJF, 2005). Other IUU fishing measures adopted by RFMOs include observer programs, boarding and inspection procedures, port inspection schemes, trade documentation schemes, and other trade-related measures (Tsamenyi, et. al., 2008). 9 See Appendix C for a map of RFMO Convention Areas
58 43 Fisheries Certification as a Means to Control Illegal Fishing The European and American markets have been encouraging certification initiatives to control the trade in illegally caught fish. These certification programs aim at creating market incentives while focusing on sustainability. One such initiative is the Marine Stewardship Council (MSC) certification program, which, as of 2010, has certified 56 species and 139 fisheries (MSC, 2010). To receive MSC certification, the fishery must obey all local, national and international laws, as well as undergo a rigorous evaluation by the scientific community to assess their environmental impact. The rigorous requirements imposed by MSC ensure that fish sold bearing the MSC s Chain of Custody certificate can be traced back from the point of sale to the point of landing. Every company involved in the chain of MSC-labeled fish must undergo a MSC Chain of Custody assessment. MSC-certified fish is gaining increasing interest from consumers in Europe, Asia and the United States. Several major retailers have made commitments to source all their wild-caught fish from sustainable sources. For examples, in the Netherlands, 25 chains of retailers have set targets to sell only MSC-certified seafood starting 2011; and Wal-Mart in the United States has made a commitment to shift their supplies of wild-caught fresh and frozen fish to MSC-certified fisheries by (Tindall, no date). Although most of the MSC certified fisheries are in developed countries, there is an increased interest in developing countries to implement this program (Tindall, no date).
59 44 Trade-Related Control Measures Efforts to curb illegal fishing activities also include monitoring the trade in certain commercial species. This is accomplished by means of implementing catch documentation schemes, trade documentations schemes, and port and market state arrangements, as well as imposing trade bans on countries that fail to cooperate with established management measures. Other trade-related measures include maintaining and updating vessels listed in the black and white lists of vessels by the regional fisheries management organizations (APEC, 2008b). The purpose of the catch documentation schemes, for example, is to closely monitor catch (through the use of real-time data), which is done by using documentation that, once issued, accompanies the product to its end market (APEC, 2008b). Vessel lists, as discussed earlier, are created and maintained by regional fisheries management organizations, which list and de-list vessels based on their involvement in illegal fishing activities. Chapter Summary This chapter outlined some important international, regional and national efforts undertaken to address the problem of illegal fishing both within the exclusive economic zones of coastal countries and on the high seas. The chapter discussed the role and functions of: (a) legally binding instruments and non-binding voluntary agreements, proposed by the United Nations; (b) the Convention on International Trade in Endangered Species of Wild Fauna and Flora; (c) notable regional fisheries policies, such as the European Commission s Common Fisheries Policy; (d) bilateral agreements; and
60 45 (e) national fisheries laws. The chapter also discussed the main responsibilities of Regional Fisheries Management Organizations, which are intergovernmental fisheries organizations established to conserve and manage resources in the high seas. Lastly, the chapter provided a brief discussion on other initiatives adopted to control illegal fishing, which included fisheries certification programs and trade-related measures.
61 46 CHAPTER 4 EXPLORING THE FACTORS CONTRIBUTING TO ILLEGAL FISHING This chapter reviews literature identifying the factors contributing to illegal fishing. The research discussed in the current chapter is divided into three sections, and includes empirical research conducted on the international and regional levels, and country-specific case studies. Global Research Despite the prevalence of illegal fishing activities across the globe, empirical research on the international level that examines the factors related to these activities remains scarce. To date, there have been four such studies, which are discussed below. Sumaila, Alder and Keith (2006) devised an economic model to explain the cost and benefit aspects of risks of engaging in illegal fishing activities. The key drivers and motivators of engaging in illegal fishing activities were examined from the point of view of the violator and were broken down into (a) benefits of engaging in the illegal activity, (b) the probability of being detected, depending on the level of enforcement or the set of regulations in place, (c) the penalty the fisher faces if caught, (d) the cost to the fisher in engaging in avoidance activities, and (e) the degree of the fishers moral and social standing in society and how this is likely to be affected by engaging in illegal fishing. Their findings suggest that for the cases examined, there was one in five chance of being
62 47 apprehended, and the reported fines for the apprehended vessels will have to be increased by 24 times for the expected costs to be at least as much as the expected benefits. Through the examination of 292 case study fisheries in 54 Exclusive Economic Zones and 15 high seas regions, Agnew and colleagues (2009) found significant differences in the levels of illegal and unreported fishing activities within regions. Their estimates suggested that the level of illegal and unreported catches were highest in the Eastern Central Atlantic and lowest in the Southwest Pacific. Overall, these activities have declined in 11 areas and increased in five since the 1990s. Several explanatory variables have been explored as economic drivers for illegal fishing that included fish prices, governance and indicators of the control problem. There was no significant relationship between illegal fishing (measured as a proportion of the reported catch that is additionally taken as illegal and unreported catch) and the prices of fish, the size of the EEZ or the fishery, however, a significant relationship was found with different World Bank governance indices measured in 2003 that included government effectiveness, regulatory quality, rule of law and control of corruption. Pitcher and colleagues (2009) examined the overall compliance score of 53 countries with the Code of Conduct for Responsible Fisheries, and its correlation with such predictors as the World Bank Governance Index, measuring political stability, violence, corruption and accountability; Transparency International s Corruption Perception Index; the United Nations Human Development Index; and the Yale Environmental Performance Index. Fairly high and significant correlations were found between the governance (R² =0.75) and corruption (R² =0.70) indices; and relatively high
63 48 and significant correlations between the human development (R² =0.48) and environmental performance (R² =0.42) indices. Borsky and Raschky (2011) provide a different perspective on the problem by highlighting the importance of spatial dependency and its role in a country s decisionmaking process. The authors examine 53 countries on their compliance with the Code of Conduct for Responsible Fisheries, and provide an econometric analysis of the correlation between spatial dependency and fisheries compliance. Their findings suggest that, while corruption, country s GDP, a country s effort to protect biodiversity, competition, and country s export share within the global fishing industry are all significant predictors of a country s compliance, proximity to countries who are willing to comply plays a significant role in a country s decision to partake in local and regional enforcement agreements, and, consequently, comply with the Code. Therefore, any international measures aimed at fisheries compliance on the global scale should note the role the local and regional institutional arrangements can play in imposing fisheries regulations. Regional Research APEC (2008a) examined the nature and extent of illegal fishing activities in the east coast region of Peninsular Malaysian States, namely Kelantan, Terengganu, Pahang, and eastern Johor. Among the illegal fishing activities evident in the region are unlicensed fishing, as well as illegal, unregulated and unreported harvest of protected species (lobsters, arowana, cockle spat, turtle eggs, grouper fry and sharks) in national
64 49 waters and within marine protected areas. The report highlights the complexity of identifying the factors that contribute to illegal fishing, nevertheless examines the drivers, pressures and impacts of illegal fishing in the area through the presentation of the driverpressure-state-impact-response model. Based on the surveys and the analysis of secondary data, the report suggests that lack of funding of enforcement capacity, poor development and low economic diversity (i.e. reduced alternative livelihood options for coastal communities), cultural tolerance of rule bending, as well as cultural cuisine habits and traditional beliefs in medical properties from marine organisms are among the significant drivers of illegal fishing in the region. It is especially difficult to control the illegal fishing activities in the region, as these drivers are coupled with such pressures as technological advancement in the fishing industry, high market demand for wild-caught fish, and illegal fishing, fish smuggling and transshipment activities by foreign fishing vessels. A case study conducted by Palma and Tsamenyi (2008) focused on exploring the nature and extent of illegal fishing activities in the Sulawesi Sea, one of the most significant and biologically diverse marine areas in the Asia Pacific region. Through the analysis of existing literature on illegal fishing in the Sea, and through the collection of official records of apprehensions and sightings, incident reports and government reports from Indonesia, Malaysia and the Philippines, the authors identified several key factors that contributed to the problem in the area. These included the high demand for fish worldwide, continuous population growth in Asia, increase in the number of fishers brought about by migration of people to areas known to have rich fisheries resources, the potential for gaining high profits, weak monitoring, control and surveillance, and the high
65 50 demand for aquarium and exotic fishes in foreign and domestic markets. Moreover, poor economic and social conditions among the coastal communities are major contributing factors. Lastly, the easy availability of substances used in dynamite-making, such as ammonium nitrate and blasting caps; chemicals such as cyanide, and lack of maritime boundary agreement among the APEC economies bordering the Sulawesi Sea all contribute to the problem. One of the major focuses of MRAG s (2008) research in the Southern African Development Community (SADC) region was to identify the factors contributing to illegal fishing activities occurring within some SADC countries 10. Through the examination of existing literature, interviews with fisheries management authorities, and contacts with locals, research efforts to estimate removals due to illegal fishing, and several country visits, the researchers identified several key factors that influenced the prevalence of the illegal activity within these fisheries. Governance, measured as the degree of political will and commitment to implement regional initiatives targeting illegal fishing, as well as fisheries monitoring, control and surveillance capacity (MCS) (measured in terms of knowledge of the scale of the problem in the region, regional assets and capacity, size of the areas requiring significant surveillance, coordination between regional MCS, and overall MCS governance), were found to be important factors related to the degree of illegal fishing activity occurring within these states. The study also found that foreign vessels were responsible for most illegal fishing activities recorded in the area, and domestic and artisanal vessels played a more limited role. 10 The SADC states examined in the report covered the coastal states of Angola, Democratic Republic of Congo, Madagascar, Mauritius, Mozambique, Namibia, South Africa and Tanzania.
66 51 In 2005, Marine Resources Assessment Group (MRAG, 2005) examined the factors influencing the vulnerability of sub-saharan African countries and outlying islands to illegal fishing (N=33), and the factors contributing to it. Several vulnerability indices were developed as potential indicators of high illegal fishing activity within the region, which included (a) the state of monitoring, control and surveillance (MCS) resources, (b) the state of governance of the country, (c) whether the country has an EU fisheries agreement, (d) the number of other agreements that the country has signed, (e) the size of the MCS problem: either the length of the coastline or the size of the shelf, (f) the value of the resource; and (g) the amount of tuna fishing in the zone and in adjacent high seas waters (tuna being of greater importance in the region). The analysis revealed that compliance improved with increasing MCS activity (developed as an arbitrary ranked scale), but decreased as full compliance was approached. The other significant factor explaining the level of illegal activity (measured as the percent of total catch value lost due to illegal fishing in the region) was governance, with the governance score explaining 81% of the variance in illegal fishing activity. Other factors mentioned above were also inversely related to the level of illegal fishing activity, but to a smaller degree. In their examination of illegal fishing activities occurring in Arctic Waters, an area that is of significant importance not only to the Arctic region and its coastal communities, but also globally, World Wildlife Fund (2008) provided an illustration of the widespread nature of the problem in the region, the major threats posed by these activities, and the impact of these activities on fisheries resilience and sustainability in general. Home to about 70% of the world s total white fish supply, as well as rich in Atlantic cod and Alaska Pollock (WWF, 2008), two significant commercial fish species,
67 52 the Arctic waters create an ideal environment for illegal fishing activities. The WWF (2008) study discussed specifically the illegal fishing activities occurring within the Barents Sea, the Western Bering Sea and the Sea of Okhotsk, where the Russian Federation and Norway are the two primary fishing countries, and where most of the fishing areas are covered by either of these countries exclusive economic zones. Their findings suggested that illegal fishing activities within the Barents Sea, home to the last of the large cod stocks, have reached to an estimated illegal catch of cod in 2005 to more than 100,000 tons, translating into a loss of $350 million, while in the Western Bering Sea and the Sea of Okhotsk, which hold Alaska Pollock, illegal fishing activities continue on a massive level (pg. 25). Although strides have been made to halt these activities within these regions through bilateral port agreements, a ban on transshipment vessels flying a flag of convenience, as well as the implementation of the North East Atlantic Fisheries Commission port control initiative 11, illegal fishing activities within the region remain a real problem in need of constant monitoring and surveillance. Country-Specific Case Studies Clarke (2007) explored the extend of IUU fishing activities within the Exclusive Economic Zone (EEZ) of Japan, a country with one of the world s most highly developed fishing industries and historically depending heavily on its marine resources for food. An 11 The North East Atlantic Fisheries Commission (NEAFC) is a regional fisheries management organization responsible for the management of the fisheries in the region. The NEAFC port control initiative came into effect on May 1, 2007, and includes an authorization prior to arrival at designated ports in Europe, which is only provided upon successful confirmation of supporting documents. Without the authorization, landings cannot take place in these ports. Vessels are also subject to direct inspections at these ports.
68 53 analysis of illegal fishing incidents, as well as estimates of illegal catch within Japanese waters, found that Japan does not suffer heavily from illegal fishing activities by either local or foreign vessels. According to Clarke (2007), this was due to the country s strong enforcement programs, such as investment in surveillance technologies and patrol vessels, as well as efforts to increase the penalties for illegal fishing offenses. In recent years, Japan encouraged local fishermen to partake in the government s efforts to detect and discourage illegal fishing activities. Lastly, improved international relations on fisheries issues, namely improved consultations between Japan and China, and Japan and Korea are believed to have resulted in a decline in violations. Putt and Anderson (2007) examined the extent and prevalence of illegal fishing activities within Australian fisheries. Through the examination of government records, review of the Australian legislation, analysis of prosecutions and court outcomes, and, lastly, a national survey of fisheries officers, Putt and Anderson (2007) attempted to provide a holistic depiction of the problem in the country. The increase in value of certain fish stocks, especially those that had lucrative overseas markets, such as rock lobsters, abalones and sharks, was among the potential vulnerabilities of the fishing sector. Other contributing factors included the prevalence of many small-scale illegal business ventures, which were pressured by the competition from seafood imports into the country. The involvement of organized criminal groups that had significant financial resources, were willing and capable of using violence and had large distribution networks both domestically and internationally, added to the complexity of dealing with the problem in the region, and significantly hindered the effective enforcement of fisheries management and regulation mechanisms in the country.
69 54 The prevalence of illegal fishing activities in Raja Ampat Regency, Eastern Indonesia, was explained by the availability of important and abundant resources (Varkey, et. al., 2010). Ambiguity of the laws governing fishing of the resources in the region pertaining to subsistence and traditional fishing vessels made it difficult to deal with the problem, and contributed to not only the overfishing of these resources by large local and foreign vessels, but also the overexploitation and under-reporting by small-scale vessels. While the indigenous people in the region were previously engaged in subsistence fishing allowable by law, they increasingly integrated into the cash economy and moved away from subsistence to commercial exploitation. (Varkey, et. al., 2010: 235). Nielsen and Mathiesen (2003) interviewed Danish fishermen in an attempt to determine the factors that weighed on their decision to comply with fisheries regulations. The research focused on three specific fisheries that included the cod fishery in the Baltic Sea, the demersal 12 and Nephrops (type of lobster) fishery in Kattegat and the industrial fishery (non-human consumption fishery) in the North Sea. Through the analysis of survey questionnaires (N=154) and information obtained by conducting in-depth interviews with fishers (N=56), Nielsen and Mathiesen were able to identify several factors that significantly affected the fishers decision-making pertaining to their compliance with fisheries management regulations. These factors included the calculation of the economic gains, possibility of sanctions (deterrence), compatibility between regulations and fishing practices and patterns, the efficacy of present regulations, behavior of other fishers and morals, and the perception of being part of the decision- 12 The term refers to the fish living close to the floor of the sea
70 55 making process (Nielsen and Mathiesen, 2003). While all the factors mentioned above were found to be important, the most important factor was the economic incentive (gains), and given the opportunity, fishers showed no reservations pertaining to noncompliance behavior. To identify the drivers and measures that have helped enhance fisheries compliance in South Africa, Hauck and Kroese (2006) looked at a 10-year history of political and institutional developments in the country to examine the effect these had on managing fisheries both nationally and regionally. The study looked at two fisheries, namely the rock lobster and abalone fisheries, and their compliance practices, and concluded that the country had increasingly become effective in ensuring compliance within these fisheries due to its focus on providing for more law enforcement, through the increase in visibility along the coast and target of organized/repeat offenders; investment in the institutional structure; and strengthening of both regional and international partnerships. An analysis of illegal fishing activities in West Africa, namely Nigeria and Ghana, highlighted the vulnerability of these countries to illegal fishing by foreign vessels, especially that of China, North Korea, Italy, Greece, Russia, Japan, Cameroon and Togo. A major contributing factor to the inability to challenge the illegal activities by foreign private fishing vessels was identified to be the lack of adequate monitoring, control and surveillance measures with regards to both equipment and management systems in these countries (Falaye, 2008). While Nigeria suffered from the lack of such necessary platforms (p. 17) as patrol boats, aircraft and vessel monitoring systems to monitor its waters, Ghana lacked the capacity to enforce local laws that applied to foreign
71 56 vessels. Falaye (2008) suggested that weak monitoring, control and surveillance measures, coupled with inadequate fisheries laws and regulations made it difficult for the countries to control illegal fishing practices by foreign vessels in their waters. Through the analysis of the National Oceanic and Atmospheric Administration (NOAA) United States Coast Guard enforcement and prosecution statistics for the Northeast region, as well as interviews conducted with fishers, managers, scientist and enforcement personnel, King and Sutiner (2010) found that the benefits of fishing illegally far exceeded the costs. The findings suggested that illegal fishing activities within the region were prevalent, with at least 12-24% of the resources harvested illegally. King and Sutiner s (2010) finding suggested that fishers had little incentive not to fish illegally. A calculation revealed that expected illegal earnings per trip were approximately $5,500, and the expected cost for a violation was $1,166, which left the fishers with an earned income of $4,334 per trip if they were caught fishing illegally. Moreover, only 32.5% of the illegal fishing activities were detected, of which only 33.1% resulted in a prosecution and a subsequent penalty. Therefore, there was a solid link between the rational calculation and the decision to engage in illegal activities when it came to illegal fishing. Chapter Summary The current chapter discussed the studies examining the factors contributing to illegal fishing activities, and, as such, offered valuable insight into understanding the problem. The studies conducted on the global, regional and national levels suggested
72 57 several macro- and micro-level factors that were significantly related to illegal fishing. Some of these macro-level factors were tested empirically, while case studies and regional research provided perspectives on several important micro-level factors. Among the major macro-level factors contributing to the problem were: (a) the lack of political will, as seen by the reluctance to enforce applicable laws or unwillingness to invest in enforcement; (b) corruption and ineffective governance; (c) lack of political stability; (d) export share within the global fishing industry; (e) spatial dependency on other countries willingness to comply with regional institutional agreements and impose fisheries laws locally; (f) country s unwillingness to strengthen international partnerships; and (g) poor economic and social conditions within countries. Some of the more important micro-level factors associated with the problem included: (a) the weak deterrence effect of applicable laws weighed against the gains that could be made from fishing illegally; (b) weak surveillance capacity or unwillingness to invest in surveillance technology and patrol vessels; (c) cultural tolerance of rule bending driven by cultural cuisine habits, as well as other fishers practices and patterns; (d) availability of illegal gear and substances; (e) inability to control foreign vessels within one s territorial waters; (f) abundance of significant commercial fish species; and (g) economic incentives driven by the high values and the growing demand for wildcaught fish. The table below provides a summary of the research conducted prior, as well as outlines the locations where these studies have been conducted and factors contributing to illegal fishing that were examine in each research study.
73 58 Table 4.1. Summary Table of Studies Examining Factors Contributing to Illegal Fishing Location Factors Type Author(s) Globally Globally Globally Globally East coast region of Peninsular Malaysian States (Kelantan, Terengganu, Pahang, and Eastern Johor) Sulawesi Sea (Indonesia, Malaysia and the Philippines) South African Development Community region (Angola, Democratic Republic of Congo, Madagascar, Mauritius, Mozambique, Namibia, South Africa and Tanzania) Sub-Saharan African countries (N=33) and outlying islands Economic drivers (benefits of engaging, probability of being caught, penalty if caught) Fish prices, size of the EEZ, government effectiveness, government regulatory quality, rule of law and control of corruption Countries political stability, violence, corruption and accountability, governance, environmental performance Country s GDP, corruption, efforts to protect biodiversity, competition, country s export share within the global fishing industry, proximity to countries willing to comply with fisheries regulations Lack of funding for enforcement capacity, poor development and low economic diversity, cultural tolerance of rule bending, cultural cuisine habits, belief in medical properties from marine organisms, as well as high market demand for wild-caught fish and technological advancement in the fishing industry High demand for fish worldwide, population growth, increased number of fishers, weak monitoring control and surveillance capacity, poor economic and social conditions, easy availability of illegal substances used in dynamite making, lack of maritime boundary agreements among the APEC economies bordering the Sea Governance, monitoring control and surveillance capacity, regional assets and capacity, size of the areas requiring significant surveillance State of monitoring control and surveillance resources, country s governance, how many EU fisheries and other regulatory agreements the country is a part of, the size of the EEZ, the value of the resources within theses EEZs, amount of tuna fishing in the zone Micro-level Both microand macrolevel Macro-level Both microand macrolevel Both microand macrolevel Both microand macrolevel Both microand macrolevel Both microand macrolevel Sumaila, Alder & Keith (2006) Agnew et. al. (2009) Pitcher et. al. (2009) Borsky & Raschky (2011) APEC (2008a) Palma & Tsamenyi (2008) MRAG (2008) MRAG (2005)
74 59 Arctic waters (specifically Barents Sea, Western Bering Sea and Sea of Okhotsk) The presence of highly commercial fish species, namely Atlantic cod and Alaska Pollock, Micro-level WWF (2008) Japan Monitoring control and surveillance capacity, efforts to increase penalties for illegal fishing offenses, local and international efforts to discourage illegal fishing activities Both microand macrolevel Clarke (2007) Australian fisheries Value of certain fish stocks, presence of smallscale illegal business ventures, involvement of organized crime groups Macro-level Putt & Anderson (2007) Raja Ampat Regency, Eastern Indonesia Presence and abundance of resources, laws governing fishing Micro-level Varkey et. al. (2010) Danish fisheries (Baltic Sea, Kattegat, North Sea) Economic calculation of sanctions versus gain, efficacy of present regulations, other fishers behavior and morals Both microand macrolevel Nielsen & Mathiesen (2003) South Africa Political and institutional development, increased visibility of enforcement along the coast, targeting organized/repeat offenders, strengthening of regional and international partnerships Both microand macrolevel Hauck & Kroese (2006)
75 60 Nigeria and Ghana Monitoring control and surveillance capacity, inability to enforce local laws that apply to foreign vessels Micro-level Falaye (2008) United States Economic calculation of cost and benefit (examined in terms of gains per trip and penalties if caught) Micro-level King & Sutiner (2010)
76 61 CHAPTER 5 THEORETICAL FRAMEWORK This study attempts to explain the variation of illegal fishing activities within countries by examining the fishers decision-making process and by assuming that this process is a rational one based on the situational factors available or lacking, thereof. This chapter, will summarize the rational choice theory and situational crime prevention, and explain their application to the illegal fishing problem. Rational Choice Theory The concept of crime being a product of the decision-making process of an individual based on the opportunities available to them is, in part, based on economic theory. Becker (1968) suggested that criminal behavior could be understood in the same terms economists analyze consumer choice: the costs and benefits of committing a crime are considered before the actual act. The rational choice perspective expands this idea by focusing on the decision-making process of the offender (Felson and Clarke, 1998). Whether one chooses to engage in crime may be dependent upon the characteristics of the individuals ( motivated offenders are more likely to have low self-control), however, it is the opportunities presented to them during the normal patterns of social and economic life that serve as the catalyst in their decision-making process. The cardinal rule of the rational choice theory is not to reject a criminal act as senseless or irrational, but rather attempt to examine the purpose behind the offences committed (Clarke and Cornish, 2001: 25), as offender decision-making is always different for different types of crime,
77 62 and a synthesis of each offense should be done in light of situations that give rise to these crimes. Accordingly, the rational choice theory asserts that the offender engages in a calculated, utility-maximizing conduct that seeks to maximize gain/reward and minimize loss/cost. Simply put, the decision to engage in a criminal behavior is a conscious step based on the opportunities presented to the potential offender. That is, the decisions that offenders make are deliberate acts, committed with the intention of benefiting the offender (Clarke & Cornish, 2001, p. 24). Although these opportunities may be constrained in time and space, these dynamics are factored into the decision-making formula, and it is these factors that may, consequently constrain the potential offender s cognitive abilities (Cornish and Clarke, 1986). Cornish and Clarke (1986) suggest two phases of the decision-making process. The first phase involves the potential offender s decision to engage in a criminal behavior. This initial decision may be related to the root causes of crime, such as low-self control, weak social bonds, class origin, intelligence or neighborhood context. These propositions have been studied by traditional theories, but from a rational choice perspective, these theories do not give a complete explanation of why crime is committed. According to the rational choice perspective, crime is not simply due to underlying motivations or predispositions, but rather involves a sequence of choices that must be made if these motivations are to result in an actual criminal act (Lilly et. al. 2007). Clarke & Cornish (2001) introduce the concept of limited rationality to explain the constraints an offender is faced with during the decision-making process: an offender does not consider all the possible costs and benefits when deciding to engage in crime
78 63 (Cornish and Clarke, 1986; Felson and Clarke, 1998). Any given crime involves an array of benefits (financial reward, prestige, status, etc.) and costs (financial loss, arrest, etc.), therefore, an offender s calculations are limited to their moods, feelings, immediate motives and intentions, as well as the amount of time available to them to engage in a criminal behavior. Further, the decision-making processes vary greatly at different stages and among different crimes, and this element of crime-specificity must be taken into consideration when analyzing the different stages of criminal involvement in particular crimes (i.e. initial involvement, continuation and desistance). However limited, the immediate assumption from this theory is that a decision not to commit a crime is also made when the calculated risks are higher than the anticipated rewards. The application of the rational choice theory in the organizational and corporate decision-making process has also been proposed (March, 1994). Like individuals, organizations behave based on the risk-reward and cost-benefit calculations, which are considered in the background of four guiding questions (March, 1994): 1. What possible actions can they engage in (thus alternatives)? 2. What possible consequences can follow based on these alternatives (thus expectations)? 3. Which alternative is more preferable based on how valuable it may be (thus preference)? 4. What would the decision-making process entail in terms of choosing the possible alternatives (thus the decision rule)?
79 64 Like individuals, organizations are also conscious decision makers who weigh their options and act within the rationality of their calculations, however limited this calculation may be. It is within this context that crime is more likely to occur. The rational choice theory s assumption about the nature of criminal offenders is captured in the 25 techniques of situational crime prevention discussed below. Situational crime prevention suggests focusing on the opportunities that make the commission of a crime possible. Any calculation of committing a crime would be highly dependent upon the situations in which offenses occur, thus, changing aspects of this situation by making crime more difficult or less profitable to commit will make crime a less attractive choice. Any potential offender would seek to reduce the risks and the effort of committing a crime, and increase the rewards; therefore, it is these aspects of crime that need to be considered when devising policies to reduce crime. Situational Crime Prevention Unlike traditional theories of crime, situational crime prevention emphasizes the situational determinants of crime. Situational crime prevention offers a range of techniques and strategies for crime prevention and reduction geared toward the criminal events, thus, departing from the traditional theories of crime that focus on criminal dispositions. The theory pays close attention to the role of opportunity in both predicting and preventing crime. To understand why crime happens, less attention should be paid to the criminal dispositions or motivations, and more emphasis made on the opportunity structures shaping crime routes (Clarke, 1980).
80 65 As proposed by Clarke (1983), the opportunity reduction mechanisms should employ measures that (1) are directed at highly specific forms of crime (2) that involve the management, design, or manipulation of the immediate environment in as systematic and permanent a way as possible (3) so as to reduce the opportunities for crime and increase its risks as perceived by a wide range of offenders It should be noted that crime opportunities are not distributed randomly, but rather concentrate in time and space. That is, only certain locations are more crime-prone than others, and crime occurs during specific time periods. As such, the policy deriving from this approach should focus on opportunity reduction by devising strategies that would significantly reduce criminal opportunities that lead to offending. One of the major innovations of the theory is the proposition that an actual criminal act depends on situational factors: whether one decides to engage in crime or not will be determined by situational factors that are highly specific. These situational factors may either involve the more immediate physical environment, or may be influenced by the management style or maintenance of the facilities (Cornish and Clarke, 2003). Situational crime prevention offers strategies that can be used to block crime occurrence. These strategies should focus on: (a) increasing the risk of attempting to commit a crime, (b) increasing the effort needed to commit the crime, (c) reducing the rewards of crime, (d) reducing provocations, and (e) removing excuses for committing a
81 66 crime. These five specific types of intervention are further explained through the 25 techniques, examples of which include target hardening, controlling access to facilities, screening exits, assisting natural surveillance, strengthening formal surveillance, denying benefits, and so on (for a full list, see Appendix E). To tackle the crime problems, it is equally important to address the availability of the crime facilitators along with the crime itself. According to Eck & Clarke (2003), there are three types of crime facilitators that assist in the commission of a crime: physical, social and chemical. Physical facilitators can be tools or the design of the physical environment itself that help the potential offenders overcome the barriers, i.e. the prevention measures, to commit a crime. Social facilitators are the factors that stimulate crime by enhancing the perceived reward of committing it. An example of a social facilitator is a criminal network a potential offender is a part of. Lastly, chemical facilitators include drugs or alcohol use that helps offenders ignore the risks of committing a crime. These crime facilitators act against the situational crime prevention strategies by undermining specific prevention methods. Physical facilitators, for example, counter the crime prevention measures that are designed to increase the risk, increase the effort and reduce provocations. Chemical facilitators counter the prevention measures geared toward increasing the risk, increasing the effort and removing excuses. Lastly, the social facilitators can offset all five situational crime prevention strategies.
82 67 Rational Choice Theory, Situational Crime Prevention and Illegal Fishing The implication of the rational choice theory for illegal fishing is that the decision to engage in illegal fishing will likely be influenced by several factors. First, the potential offender will consider the degree of effort involved in getting the caught species to the intended markets. If the target species are within territorial waters of a country with strong port inspection programs or one that is too far from a port of convenience, this will discourage potential offenders from engaging in illegal fishing. Second, the offenders will calculate the possible reward by considering the availability of the resource sought (i.e. commercially significant species), regardless of the effort. Third, the offender will calculate the possible risk of being caught. This risk calculation will entail not only the risk of being caught while fishing illegally at sea, but also the risk of being detected with an illegally caught fish onboard the vessel while offloading it at port. Although a country may have rich resources of commercially significant fish, they may not be vulnerable to illegal fishing if they have sufficient surveillance measures in place both at sea and at landing ports. Given the premise of the rational choice theory, it would, therefore, be expected that the selection of locations to engage in illegal fishing activities would not be random, but rather dependent on the low level of risk of being caught and high levels of rewards in terms of the availability of the fish sought. The theoretical premise of situational crime prevention in explaining illegal fishing behavior is especially relevant, as it seeks to explain the situational environment of crime events. Although no research to date has applied situational crime prevention principles to explain illegal fishing, the theory offers especially useful principles to understand the nature of the problem. Not all tactics from situational crime prevention
83 68 may be suitable for explaining illegal fishing, but a majority of these are especially helpful and have, indeed, been employed to thwart illegal fishing activities. For example, controlling access to facilities, in this case, the territorial waters of the countries where vessels can fish, commercial vessel monitoring systems and vessel licenses are mandated by all countries. Screening exits include the catch inspection schemes at ports, which are random inspections of fish on board vessels before they are landed. The reducing anonymity technique applies to requiring vessel registration. The strengthening formal surveillance technique would incorporate surveillance at sea by using patrol vessels or aerial surveillance methods, again measures already used by countries in some capacity. The utilizing place managers technique is used through observer schemes, i.e. placing fisheries control officers onboard fishing vessels who keep records of catches, fishing gear used, and so on. In terms of understanding illegal fishing behavior within countries exclusive economic zones, situational crime prevention, therefore, offers helpful techniques. The concept of crime facilitators can also be extended to explain illegal fishing. Literature has identified and emphasized the role of ports of convenience in facilitating these activities. Lack of inspections on arriving ships at these ports, tax exemptions from import duty, lack of transshipment regulations are among the factors decreasing the risk of being caught, while creating the convenience and reducing frustrations and stress of having to deal with customs inspections. Thus, ports of convenience may serve as physical facilitators to crime commission, and a country s proximity to such ports is expected to make it a vulnerable target.
84 69 Propositions Derived from Rational Choice Theory and Situational Crime Prevention Both rational choice theory and situational crime prevention help understand why some countries are more vulnerable to illegal fishing than others. They predict that, although widely spread across the globe, these activities are not random but instead occur within countries where there is an opportunity to do so. Although the theories have not been used previously to explain such activities as illegal fishing, they provide several useful understandings. From the perspective of these theories, several propositions can be derived: Illegal fishing will concentrate in areas that are abundant in resources that are highly commercial internationally Illegal fishing will concentrate in areas where less effort is necessary to get to the target species Illegal fishing activities will continue as long as incentives to engage in it persist. These incentives are the expectations that the expected benefits will exceed the expected sanctions Offenders decision will be guided by not only the calculation of the availability of targeted fish, but will also be weighed against the likelihood of being detected either through formal surveillance or by other legally-operating detectable vessels Illegal fishing is less likely to occur within countries with effective observer schemes, port inspection schemes or effective access-control measures Effective surveillance both at sea and at ports is an important mechanism that would factor into the decision-making process
85 70 Countries that are within a close geographic proximity to a number of ports of convenience will be preferred over other countries by international illegal fishing vessels It is, therefore, expected that a country s vulnerability to illegal fishing within its territorial waters will be determined by the factors explained above 13. Therefore, illegal fishing may be explained not only through macro-level predictors previously used in other studies, but also by the specific situational factors proposed in the current research. 13 Notes that most of these assumptions are also applicable to the high seas territories, however, this research does not measure any of these assumptions beyond the territorial waters of the countries under study.
86 71 CHAPTER 6 RESEARCH DESIGN Introduction Based on the theoretical framework of rational choice and situational crime prevention theories, this study explores whether certain situational factors play a role in the decision to engage in illegal fishing. The following questions are formulated into eight hypotheses that explore the constraining and facilitating factors expected to play a role in the decision to engage in illegal fishing: What is the availability of the target species within the target fishing grounds? How much are these fishing grounds (facilities) controlled and managed in terms of access, inspection and surveillance? How much effort would it involve to remove the species from the target fishing grounds in time to take these species to the markets? This research uses five secondary data sources to measure the variables used to test the proposed hypotheses. These sources derive from several research centers, institutions and websites that provide access to the information pertaining to the variables for all the countries under study. There are several advantages to using these sources and these include the following: Data are derived by using scientific methodology, and, therefore, are reliable
87 72 The sources provide a one-stop access to data for all the countries under study The data come from one source, and are, therefore, valid measures of the variables across all the countries under study The data are public and easily accessible The section on data sources provides a discussion on the sources, as well as the variables that have been extracted from these sources. More detail on these variables is provided to have a better understanding of their operationalization and measurement. Units of Analysis The current research examines the degree of illegal fishing within the Exclusive Economic Zones of 54 countries, which, together, comprise 96% of total world fish catch. The Exclusive Economic Zones (EEZs) are marine areas that have been established under the Law of the Sea and include sea-zones over which states have special rights to use the marine resources. A country s EEZ has been established by the Law of the Sea to stretch from the seaward edge of the state s territorial sea to 200 nautical miles from its coast. When EEZs of the countries overlap, it is up to the states to decide their maritime boundaries. The general rule established by the Law of the Sea is that the point within the overlapping area defaults to the nearest state. The exclusive economic zones (countries) examined in the current research are shown in Figure 6.1 below. The EEZ boundary shapefile for this map is downloaded
 to compile up-to-date and accurate information on all the EEZs. Figure 6.1.")
88 73 from the Flanders Marine Institute website ( which, in turn, uses several sources (Australian Maritime Boundaries Information System, U.S. National Oceanic and Atmospheric Administration and the Eurosion GIS Database) to compile up-to-date and accurate information on all the EEZs. Figure 6.1. Map of the Study Area There are a total of 150 coastal countries in the world, which are sovereigns of 232 EEZs. Of these, six EEZs are disputed, one has a joint development status and is under the sovereignty of Australia and East Timor, and three are under the joint regime status and involve Nigeria-Sao Tome & Principe, Japan-Korea, Colombia-Jamaica (see Appendix F for maps of these areas). In addition to the mainland, countries may be
89 74 sovereigns of several overseas territories, therefore, have several EEZs. For example, in addition to the mainland, Australia holds sovereignty over several islands that include Heard and McDonald Islands, Christmas Island, Cocos Islands, Norfolk Island and Macquarie Island (see Appendix G for maps of the overseas territories belonging to the countries under study). Unfortunately, the data used in the current research to measure the variables are provided by country, and it is impossible to extract/apply the scores these countries receive to their overseas territories. Consequently, only the exclusive economic zones of the mainland of the countries are used in all analyses, and their overseas territories are excluded. Data Sources Source 1: University of British Columbia Fisheries Centre A. Compliance Reports Eleven years past the UN Code of Conduct for Responsible Fisheries in 1995, scholars from the University of British Columbia conducted an evaluation of the compliance of 54 countries (strictly marine fisheries jurisdictions) with Article 7 of the Code dealing with Fisheries Management. The reports (henceforth, Compliance Reports ) evaluate the performance of each country in terms of 44 questions derived from the provisions of the Code. The 44 questions in the Compliance Reports are divided into six sections that include Objectives, Framework, Precaution, Stocks, Fleets and Gear, Socio-Economics, and Monitoring, Control and Surveillance. Each of the 44 questions is scored from 0 to 10 as reference points indicating worst and best.
90 75 Several scholars from the University have been involved in analyzing the 54 countries and scoring these countries performance on the 44 questions of the Code of Conduct. Teams of two to three scholars examined the countries and reviewed the available literature on these countries after which they carefully rated these countries on their performance. These scholars reviewed a total of 2475 reference materials (for the 54 countries combined) that included national legislation, international treaties, country synopses from FAO, national fisheries agency reports, published and grey literature, as well as information from fisheries experts. In addition to inter-rater validation through the within-team reviews, external validation procedures through consultation with fisheries experts within the countries were conducted for 33 out of 54 countries. The current methodology is a reasonably objective way of evaluating compliance with the Code. Prior evaluations involved collecting questionnaires about progress in compliance with the Code from the countries directly (COFI, 2007), which has led to biased results. For example, while 90% of the countries responding to the questionnaires considered themselves to be in conformity with the Code, only 25% of these countries had functioning fishery management plans in their jurisdiction (Pitcher et al, 2006). The independent variables observer schemes, vessel monitoring schemes, catch inspection schemes and control of access to stop illegal fishing derive from Questions #1, 2, 3, 5 from the Monitoring, Control & Surveillance evaluation field of these reports. The dependent variable, degree of illegal fishing is Question #4 from the same field. Details on these questions and scoring protocols are provided in Table 6.1 below.
91 76 Table 6.1. Compliance Score Questions and Scoring Protocols from the Compliance Reports used in the Current Research Evaluation Field 6: Monitoring, Control & Surveillance (MCS) Scores Results of Management Reference Points Code Clauses Attributes Worst Best Main Other 1 On a scale of 0 to 10, how effective is the observer scheme? No scheme (0) to almost fully effective (10). 2 On a scale of 0 to 10, how effective is the catch inspection scheme? No scheme (0) to almost fully effective (10). 3 On a scale of 0 to 10, how effective is the vessel monitoring scheme? No scheme (0) to almost fully effective (10). 4 Are vessels fishing illegally in the area of this fishery? No (0); occasionally (2.5); often (5); a great deal-half as much as legal vessels (7.5); almost as much as, or more than legal vessels (10). If no information is available, score 10. Note reverse direction of this question: this is allowed for in all analyses. 5 How effective is control of access in stopping illegal fishing? Not at all effective (0), to almost fully effective (10). 6 Are vessels that really derive from this jurisdiction re-flagged in States of Convenience to avoid reporting or other fishery regulations? Never (0); sometimes (1-5); often (6-7); practice is very common (8-10). Note reverse direction of this question: this is allowed for in all analyses Source: Fisheries Centre Research Reports 12(2), B. The Sea-Around-Us Project The Sea-Around-Us Project, launched in 1999, is a scientific collaboration between the University of British Columbia and the Pew Environment Group. The goal of the project was to provide the global community with a database on catches, distribution of commercial marine species, countries fishing access agreements, marine protected areas
92 77 and other data. Since then, the Project has been providing increasingly sophisticated analyses of trends in global fisheries that allow policymakers and fisheries managers to make more accurate and informed decisions (Sea Around Us Project, 2000, p. 2). The project s publicly available website provides EEZ-specific data on fish and other marine species, and classifies these species through different filters/categories, such as dangerous, freshwater, endemic, and so on. Among these filters one is especially relevant to the current research, and includes the category commercial fishes. All the fishes in the commercial filter also have information on their status and include highly commercial for local use, commercial for local use, highly commercial for use elsewhere, and commercial for use elsewhere. The number of fish classified under highly commercial for use elsewhere is used to measure the independent variable resource attractiveness. Source 2: United States Naval Institute The current research will use the 15 th edition of the Naval Institute s Guide to Combat Fleets of the World: Their Ships, Aircraft and Systems, authored by Eric Wertheim. Data in this guide is compiled through unclassified sources and through correspondence received from the countries directly. For some countries, such as North Korea, the numbers are estimated out of necessity (Wertheim, 2007). The guide uses multiple sources that include such periodicals as The Almanac of Seapower; Defense News; Flight International; Intelligence, Surveillance & Reconnaissance Journal; Jane s Navy International; Marine News; Naval Aviation News, and so on. For each country, the
93 78 guide provides information on their coastal defense resources that include ships, aircraft and armament. Information on each ship, for example, is provided in units in inventory as of January 1, The independent variable, number of patrol vessels per 100,000 sq km of EEZ derives from this source. Source 3: Ports.com The Website provides a wealth of business-related information for shipping companies, vessel owners and other related businesses. Most of the information provided through this website is free. One of the free tools offered through the website is the sea distance/route calculator that gives details on the distance between ports in nautical miles. The website also provides a map showing the route that can be used by vessels to travel from Port A to Port B. Expected length of time, calculated based on the speed of the boat, and is also provided. To measure the independent variable close geographic proximity to Ports of Convenience, this source is used to calculate sea-distances between ports. Source 4: The PASTA-MARE Project The PASTA-MARE Project was a 2-year project sponsored by the European Commission and was aimed, among other things, at identifying and mapping the global
94 79 maritime traffic density of all Class A 14 registered vessels in both the high seas and within the exclusive economic zones of all countries, as well as assisting in the analysis of global maritime traffic density of these types of ships. The project provides details, such as traffic patterns, type and navigation status, about global vessel movements through the analysis of the signals received from the space-based sensors (s-ais) and terrestrial sensors (t-ais) (Eiden & Goldsmith, 2010). To identify the locations of these vessels (about 62,000, according to the Lloyds MIU Handbook of Maritime Security); signals from the s-ais were collected within a time window of eight days, capturing the locations of over 60,000 vessels, and from every area in the world. In highly dense areas, such as the European Union, the data collected from the s-ais was complemented by the data gathered through the t-ais, so that the signals from the vessels that may not have reached the s-ais due to its high volume would be compensated through integrating the available information with the data collected by t-ais. The project assumes that no seasonality in global vessel patterns exists, thus, making the resulting product applicable to all seasons (European Commission, Maritime Forum, The data were collected over the study period from January 1, 2010 through March 31, In the current study, only the data pertaining to the study area were extracted from the PASTA-MARE GIS shapefile, and only information pertaining to Class A fishing vessels. Of the total of 2618 grid cells identified as containing fishing vessels, only Every commercial vessel is assigned a class based on its use and area of operation. The vessel classes range from 1-4, of which class 3 refers to a fishing vessel engaged in commercial fishing activity. Operation areas are denoted by letters A through E, with A denoting operations greater than 200 nautical miles to seaward of the coast B denoting operations up to 200 nautical miles to seaward from the coast, or within lesser limits as specified and so on. A detailed discussion on these classifications is provided at
95 80 were within the exclusive economic zones of the 54 countries, the remaining being in the high seas, in EEZs of other coastal countries, in inland waters or along the coasts of inland ports. Figure 6.2 below shows the locations of these fishing vessels, both within and outside of the exclusive economic zones of the 54 countries.

96 Figure 6.2. The Density of Class A Fishing Vessels Within and Outside of the 54 EEZs 81

97 82 To calculate the total number of detectable fishing vessels within a country s EEZ, each centroid of these grid cells was examined, as it carried information on the average number of fishing vessels within the 1 x 1 grid cell they represented. For example, within the United States Exclusive Economic Zones, a total of 155 centroids were identified. A further examination of these points yielded a total of 385 fishing vessels, 144 passenger vessels, 114 tankers, 379 cargo vessels, and 1377 other vessels. Figure 6.3 below is a print screen detailing the statistics pertaining to fishing vessels within the U.S. EEZ by using the GIS summary statistics tool. This source was used to extract data on the independent variable detectable fishing vessel density. Figure 6.3. An Example of Calculating the Total Number of Class A Fishing Vessels within the U.S. Exclusive Economic Zone Using GIS
98 83 Description and Operationalization of Variables Dependent variable The dependent variable is a measure of the degree of illegal fishing activities occurring within a country s EEZ. Extracted directly from the UBC Compliance Reports, the variable is measured on a scale of If a country is given a score of 0, this indicates that vessels are not fishing illegally within the country s EEZ. Scores that fall between indicate that vessels are occasionally fishing illegally within the country s EEZ; a score that falls between indicates that vessels are often fishing illegally within the country s EEZ, a score falling between indicate that a great deal-half as much as legal vessels are fishing illegally, and, lastly, a score between indicates that almost as much as, or more than legal vessels are shipping illegally within a country s EEZ. Thus, a high score indicates that a country experiences high illegal fishing activities within its coastal waters (see table 6.1 for a short summary). Previous studies have used two methods to estimate illegal catch within a country s EEZ. The first method involves a so-called top-down approach, which uses a global estimate of the proportion of unreported catch. The estimates of unreported catch as a proportion of the total global reported catch was proposed to be in the range of 25-30% by Pauly & McLean (2003). MRAG (2005) estimated the illegal catch of sub-saharan Africa to be 19%. Thus, these estimates vary from country to country and from region to region, and are based on the extrapolations from detectable illegal catch from countries or fisheries where this activity has been reported. Consequently, this estimate does not include estimates from countries where illegal fishing has not been detected or is
99 84 assumed to be zero (MRAG, 2005). The bottom-up approach has been used at a more local scale, and it is believed that information collected using this methodology is both very patchy and hard to collect (MRAG, 2005: 17). Some bottom-up approaches used previously included extrapolations from surveillance spotting of IUU activity (CCAMLR), Monte-Carlo interpolations from direct observer data (Pitcher et al, 2002), and estimates using trade records from commercial markets (Clarke, et al, 2006). While some of these methods help researchers understand and estimate the extent of illegal fishing activities within a country s EEZ based on catch data, these are not helpful in determining the frequency of this activity within these countries. Moreover, these estimates are extrapolated from the weight of the fish caught, and are used as proxies for illegal fishing activities within the countries EEZs. The dependent variable used in the current research, consequently, is a more reliable measure of the frequency of this activity within the countries EEZs. Moreover, the scores assigned to each country are based on rigorous and objective evaluations of available literature by scholars from the University of British Columbia, and come from a single source, thus allowing for a global evaluation attempted in the current research.
100 85 Independent variables expected to constrain illegal fishing Formal and informal surveillance Research has shown that monitoring, control and surveillance (MCS) efforts are inversely related to illegal fishing activities within a country s EEZ (MRAG, 2005; Clarke, 2007; APEC, 2008; Palma & Tsamenyi, 2008; Falaye, 2008). That is, the stronger a country s MCS capacity, the less likely it is to experience illegal fishing activities within its territorial waters. But before a discussion on MCS measures used in the current research is provided, it is important to note that the current study departs from prior research in its measurement of MCS. The current research isolates the MCS in terms of it being applied at sea or at land. This is done on the basis of the official definition of MCS as established by the Food and Agriculture Organization of the United Nations and discussed in Flewwelling (1999). As outlined in the official definition, there are three components to MCS, and these include the land component, the sea component and the air component, with the latter pertaining to the use of satellite technology. The land component pertains to port inspections of catch, control of access to resources and so on. The sea component refers to the observer schemes, among other measures. Lastly, the air component pertains to the use of vessel monitoring systems to track for their movements at sea. Separating different MCS components, therefore, will allow researchers to disentangle the deterrent effects of each component. Moreover, while prior research has shown the correlation between MCS and illegal fishing, the research studies were either regional (e.g. MRAG, 2005) or country-specific case studies (e.g. Hauck & Kroese, 2006; Clarke, 2007; Falaye, 2008). The current
101 86 research examines the role of MCS in 54 countries, thus allowing for a global comparison. This research also measures formal surveillance, as well as considers informal surveillance at sea and its ability to deter illegal fishing vessel operators, a concept that has not been previously studied. A total of six independent variables are considered in the current research as MCS measures, as well as formal and informal surveillance measures. A brief description of these variables is provided below. Formal surveillance at sea Observer Schemes. Observers are fisheries inspectors who are placed onboard vessels to keep a record of the vessel s catch, gear used and other fishing practices. Observers ensure that violations are not made aboard the fishing vessels. Observer schemes are legally imposed programs that require fishing vessels to have an inspector onboard. Generally, these observers are placed by either the fisheries management organization or the coast guard. Vessel Monitoring Schemes. All registered fishing vessels are required to install approved vessel monitoring systems on their vessels (FAO, 2007). These systems are used to identify and track the vessels at sea. Number of Patrol Vessels per 100,000 sq km. The size of the EEZs of the countries examined differs greatly. To be able to compare the formal surveillance measures, namely number of patrol vessels across countries, the numbers were divided by the size of the country s EEZ in square kilometers.
102 87 Formal surveillance and control at land Catch Inspection Schemes. These are measures whereas fisheries inspectors examine the catch at ports. Inspections can also occur at sea when a suspicious fishing vessel is spotted by the patrol boats. Inspections, however, are more systematic at ports of landing. The current measure (scores given from the source used to measure this variable) of effective catch inspection schemes pertains specifically to the fisheries programs where inspectors examine the catch at ports. Control of Access in Stopping Illegal Fishing. There are several measures that are used by fisheries management programs to control access to illegal fishing. Research identifies several of such measures, and these include catch quotas, restrictions on fishing effort, licensing requirements that limit access to fisheries resources and size limits (Pascoe et al, 2003). Informal surveillance at sea Detectable Fishing Vessel Density. It is assumed that if a vessel is detectable and the signals were picked up by the space-based or terrestrial-based sensors, then these fishing vessels are authorized to be in the EEZs of the countries. The positions of these vessels are tracked by monitoring centers, and therefore, they are assumed to be fishing legally.
103 88 Independent variables expected to facilitate illegal fishing Access to ports of convenience Research on illegal fishing, as discussed in an earlier chapter, has identified the importance of ports of convenience as facilitators of illegal fishing activities. Regardless of the local measures taken by a country, the country may still be vulnerable to illegal fishing due to its proximity to a port with lax requirements. These types of ports allow the illegal fishing vessels to conceal their catch by unloading it and transferring via other methods to the target destinations and into international markets. Therefore, based on the framework of rational choice perspective, fishing within a country s EEZ and unloading the fish in a port of convenience would facilitate a reduction of risk of being detected at landing. Consequently, it is hypothesized that access and availability of such ports within a convenient distance from the fishing grounds of a country would make that country vulnerable to illegal fishing. A study undertaken by the Pew Environmental Group (2010) examined the movements of detectable IUU blacklisted vessels during a six-year period ( ). A major contribution of the study was the identification of the ports that were used by these illegal vessels to offload their catch. Based on the findings of the study, a website ( was launched that provides a wealth of information on 32 countries and 94 ports within these countries, as well as number of visits to these ports by the detectable blacklisted vessels during the study period. Of the total of 178 blacklisted vessels, only 58 showed movements (detectable), and the remaining 120 vessels could not be tracked. The report stated that it was unlikely that these vessels
104 89 ceased operations, but rather more likely that they continued their illegal operations without being detected (Pew Environmental Group, 2010). There were a total of 425 visits to 140 ports in 71 countries (by these 58 vessels), however, the website provides information on only 359 (84.5%) visits to 94 ports in 32 countries. These 32 countries are those that had at least four visits during the six-year period. An examination of these port visits revealed that 10 ports (7%) accounted for 155 visits (37% of all port visits). Table 6.2 below summarizes the results for these 10 ports (henceforth, Ports of Convenience ) 15. Table 6.2. Detected Port Visits by IUU Blacklisted Vessels during Country Name of Port Number of Visits Percent of Visits Cumulative Percent of Visits Singapore Singapore Ecuador Bahia de Manta Ukraine Sevastopol Mauritania Nouadhibou Russia Kaliningrad Colombia Cartagena Germany Rostock South Pusan Korea Ghana Tema Spain Las Palmas Total 155 Cumulative Percent of Ports 15 A full table of this analysis is provided in Appendix H.

105 90 Due to the large amount (5076) of calculations of distances from each country s centrally located port to these 94 ports, a decision was made to focus on the 10 ports listed in Table 6.2 above. In addition, these ports seem to be the most vulnerable ports used by illegal fishing vessels. Figure 6.4 below shows the geographic distribution of these ports. Figure 6.4. Geographic Distribution of the Ten Ports of Convenience

106 91 Sea distance between countries is measured differently. Firstly, there are set marine traffic routes that are used by ships to move in the seas. Secondly, this distance is measured in nautical miles, rather than miles, kilometers or other measurements used in distance calculations. Taking these two factors into consideration, distances are calculated between each centrally located port along the coastline of the countries examined in the current research, and all ten ports discussed above. These calculations were made through the online sea distance/voyage calculator available through Figure 6.5 below shows a calculation of a sea distance in nautical miles between Leonardo Harbor, U.S., and Port of Guayaquil, Ecuador. Figure 6.5. Distance from Leonardo Harbor, U.S., to Port of Guayaquil, Ecuador Source:
.")
107 92 This research calculated sea distance from the centrally located port along the coast of the 54 countries to each of these 10 ports. To find these centrally located ports, the researcher used the Central Feature calculation tool available in ArcGIS (see Appendix I for a map of the centrally located ports of all 54 countries). This feature represents the most centrally located feature, in terms of distance (Mitchell, 2005). This centrally located port sums the distance to all other ports, because it has the shortest total distance to all ports within the coastline. Figure 6.6 below shows the geographic distribution of all ports along the coast of Brazil, as well as the most centrally located port, Port of Ilheus. The latter was used to make all port calculations for Brazil. Figure 6.6. An Example of a Calculation of a Centrally Located Coastal Port
108 93 Attractive resource It is intuitive to think that illegal fishing would be in areas where there are highly sought-after resources. These resources can be attractive for those fishing illegally because they are highly desirable in international markets, and, consequently, will be easily disposable. Moreover, these species can be easily sold as they will always be in demand, and, as such, they are more attractive. Resource attractiveness will be conceptualized in terms of the availability of species that are highly commercial internationally. Logic would suggest that countries that have more such resources are more vulnerable to illegal fishing, as they posses more vulnerable targets which are attractive hot products. (see Appendix J for a list of these species and number of countries they occur within). In summary, a total of five data sources are used to collect information on eight independent variables and one dependent variable. The summary table below shows all independent variables, what they intend to measure, and what data sources are used for these variables.
109 94 Table Summary of Independent Variables and their Data Sources INDEPENDENT VARIABLES DATA SOURCES SURVEILLANCE Formal Surveillance At-Sea Surveillance 1. Observer Schemes UBC Compliance Reports (Q1) 2. Vessel Monitoring Schemes UBC Compliance Reports (Q3) 3. Number of Patrol Vessels per 100,000 sq United States Naval Institute km At Land Surveillance and Control 4. Control of Access in Stopping Illegal UBC Compliance Reports (Q5) Fishing 5. Catch Inspection Schemes UBC Compliance Reports (Q2) Informal Surveillance 6. Detectable Fishing Vessel Density The PASTA-MARE Project ACCESS TO PORTS OF CONVENIENCE 7. Availability of known Ports of Convenience within close geographic proximity (1500nm) ATTRACTIVE RESOURCE 8. Number of Highly Commercial Species Found within the EEZ of the country Ports.com (source used to calculate sea distance) The Sea Around Us Project Proposed Hypotheses Based on the assumptions of the situational crime prevention model, countries with good MCS measures in place are less likely to experience high degrees of illegal fishing activities within their jurisdiction. This is because these measures would increase the perceived risk of being caught, as they are designed to screen exits, reduce anonymity, utilize place managers and control access to facilities. It is also expected, that rational offenders would avoid areas with strong formal or informal surveillance. The proposed hypotheses below measure formal surveillance both at sea and at land, as well as informal
110 95 surveillance at sea. Lastly, it is proposed that areas that have the desired resources and have accessible Ports of Convenience within a close geographic proximity are more likely to experience high degrees of illegal fishing. The hypotheses derived from these assumptions are listed below: Surveillance A. Formal Surveillance At-Sea H1. Countries with effective observer schemes are less likely to experience high levels of illegal fishing within their territorial waters. H2. Countries with effective vessel monitoring schemes are less likely to experience high levels of illegal fishing within their territorial waters. H3. The number of countries patrol vessels per 100,000 sq km of EEZ is inversely related to illegal fishing within their territorial waters. B. Formal Surveillance and Control at Land H4. Countries with effective control of access are less likely to experience high levels of illegal fishing within their territorial waters. H5. Countries with effective catch inspection schemes are less likely to experience high levels of illegal fishing within their territorial waters. C. Informal Surveillance H6. Countries with a high number of detectable fishing vessels are less likely to experience high levels of illegal fishing within their territorial waters.
111 96 Access to Ports of Convenience H7. The availability of Ports of Convenience within a close geographic proximity (1500nm 16 ) affects the level of illegal fishing within countries territorial waters. Attractive Resource H8. The number of species found within the countries EEZs that are highly commercial internationally is positively correlated with the level of illegal fishing activities within countries territorial waters. Chapter Summary The current chapter provided a discussion on the proposed research questions that are examined in the chapters that follow. The chapter began with a discussion of the units of analysis, followed by a discussion of data sources, with the latter providing further detail on how data pertaining to the dependent and independent variables were extracted from these sources. A consideration of the reliability and usefulness of these sources was also provided to further justify their use. Detailed discussions of the dependent variable and eight independent variables used to construct eight research hypotheses were also provided to furnish a better understanding about their operationalization and measurement. The independent variables were grouped in terms of constraining or facilitating factors affecting the decision to engage in illegal fishing within a country s territorial waters. An outline of the eight proposed hypotheses was provided at the end of the chapter to sum the work conducted in the chapter. 16 It takes approximately 6 days to travel 1500nm with a speed of 10 knots.
112 97 CHAPTER 7 DESCRIPTIVE ANALYSES Introduction The current chapter will focus on analyzing the patterns of illegal fishing, as well as examining the independent variables that will be used in a multivariate model in chapter eight as predictors. The examination of the dependent variable degree of illegal fishing will provide general information on countries that are known to have illegal fishing problems within their territorial waters, as well as allow for a comparison across countries. Looking closely at some of the independent variables will provide more insight into understanding the problem, without initially conducting statistical analyses of their correlations with the dependent variable. Descriptive Analysis of Illegal Fishing Literature in the past has pointed out that illegal fishing is a significant problem, and the current analysis attests to that fact. One would think that many of the countries that are rich in surveillance resources, and are better equipped with fisheries management tools to govern their resources, would be less vulnerable to illegal fishing. However, this may not necessarily be the case. Table 7.1 below summarizes the scores of the countries, with the higher score indicating higher levels of illegal. From the table it is evident that a striking number of countries are vulnerable to high levels of illegal fishing within their territorial waters. More specifically, a total of 22 countries (i.e. 41%) have a significant
113 98 illegal fishing problem, as they have scored 8 or above, indicating that the degree of illegal fishing activity within their waters is almost as much as, or more than legal vessels. Of the remaining 32 countries (i.e. 59%), 50% experience a great deal of illegal fishing activity within their waters, while the remaining 50% have often or occasional incidences of illegal fishing. Cumulatively, a total of 38 of the 54 countries, i.e. 70% of the countries, have to deal with very serious illegal fishing problems, and are, therefore, highly vulnerable. Table 7.1. Summary of the Scores of the Countries (N=54) on the Degree of Illegal Fishing Occurring within Their Territorial Waters Score Interpretation Score Range Number of Countries Percent of Countries Almost as much as, or more than legal vessels % A great deal, half as much as legal vessels % Often % Occasionally % To further examine the variable, the 22 countries that have scored 8 or higher are shown in Figure 7.1 below. Of these 22 countries, four (i.e. 18%) received the highest scores, and include Thailand, Russia, Spain and Myanmar.
114 Thailand Russia Spain Myanmar Taiwan Nigeria Vietnam Indonesia Philippines China Morocco Argentina Turkey United Kingdom Denmark Netherlands Peru Ecuador Sri Lanka Ukraine Italy Yemen Illegal Fishing Score 99 Figure 7.1. List of Countries Scoring 8 or higher on the Degree of Illegal Fishing Activities within Their Territorial Waters (N=22) Descriptive Analysis of Independent Variables Attractive resource Table 7.2 below shows the descriptive statistics on the number of species within countries EEZs that are highly commercial internationally. The 54 countries had an average of highly commercial species, with some countries having up to 55 such species. Table 7.2. Descriptive Statistics on the Number of Highly Commercial Species Minimum Maximum Mean Std. Deviation

115 100 A further examination revealed that the middle 50% of the countries had between eight and 22 highly commercial species. Figure 7.2 below identifies the countries that had 23 or more such species, as well as their score in the degree of illegal fishing occurring within their territorial waters. As it can be seen from the graph, a total of 13 out of the 54 (i.e. 24%) countries had 23 or more fishes that were highly commercial internationally, and a majority of these countries (54%) scored extremely high on illegal fishing. It is also interesting to see that the majority of these countries are in South-Eastern and Eastern Asia. Thailand that has the most species (N=55), was among the four countries that received a score of 10 on the degree of illegal fishing discussed earlier. Figure 7.2. Countries with 23 or more Highly Commercial Fishes and their Illegal Fishing Scores Number of Highly Commercial Species Illegal Fishing Score
116 101 Access to ports of convenience The importance of ports of convenience in facilitating illegal fishing has not only been highlighted in literature in general, but also demonstrated by the study conducted by the Pew Environmental Group (2010). While there may be thousands of ports globally, only a few are used by illegal fishing vessel operators to launder fish. This section attempts to look at how many such ports are available that are within a close geographic proximity to the countries where illegal fishing occurs. Table 7.3 below shows the number of Ports of Convenience (of the 10 examined) available to fishing vessel operators should they decide to fish within the waters of these 54 countries. As it can be seen from the table, there are some countries that do not have these ports available (29.6%) within a close geographic proximity, and there are countries that have two of these ports available (27.8%). Cumulatively, 70% of the countries are close to at least one Port of Convenience. Table 7.3. Number of Ports of Convenience Available within 1500 nm from Each of the 54 Countries Number of Available Ports of Convenience Number of Countries Within 1500nm to Ports of Convenience Percent Cumulative Percent TOTAL
117 102 Table 7.4 lists the 15 countries that are within 1500nm to two Ports of Convenience and the names of these ports. The table is important for two reasons: (a) it shows the countries that may possibly be more vulnerable to illegal fishing due to the availability of two exit points and (b) it shows the ports that may possibly be used by illegal fishing operators should they decide to operate in these countries. The table also shows that most of the countries listed are in Europe, and the most accessible Ports of Convenience for these countries are Port Kaliningrad and Port Rostock, located in Russia and Germany, respectively. Table 7.4. List of Countries and Ports of Convenience within 1500 nm Country Port of Convenience 1 Port of Convenience 2 Denmark Kaliningrad, Russia Rostock, Germany Ecuador Manta, Ecuador Cartagena, Colombia Faroe Islands Kaliningrad, Russia Rostock, Germany Germany Kaliningrad, Russia Rostock, Germany Ireland Kaliningrad, Russia* Rostock, Germany Latvia Kaliningrad, Russia Rostock, Germany Morocco Las Palmas, Spain Nouadhibou, Mauritania Peru Kaliningrad, Russia Rostock, Germany Poland Manta, Ecuador Cartagena, Colombia* Portugal Kaliningrad, Russia Rostock, Germany Senegal Las Palmas, Spain Nouadhibou, Mauritania Spain Las Palmas, Spain Nouadhibou, Mauritania* Sweden Kaliningrad, Russia Rostock, Germany United Kingdom Kaliningrad, Russia Rostock, Germany *Within 1500nm from end-line of the 200nm territory
118 103 Surprisingly, there are no Asian countries in the list. This is not to say that these countries are not conveniently located, as they have other Ports of Convenience available that are located in Asia (namely Port Singapore in Singapore and Port Busan in South Korea), but rather to note that there is more geographic clustering of the European countries as represented by their proximity to these Ports of Convenience. In fact, a further analysis of the distance of countries to Port Singapore revealed that six countries, namely Thailand, Myanmar, Vietnam, Indonesia, Philippines and Malaysia, are within 1500 nm from this port. Port Singapore is a particularly interesting port to examine, as 32 out of the total of 155 visits (i.e. 21%) to these ten Ports of Convenience were made to this port alone during It is also noteworthy that all the countries that are within 1500 nm from Port Singapore had among the highest scores (9-10) on illegal fishing, except for Malaysia. Monitoring, control and surveillance (MCS) capacity It has been discussed in an earlier chapter that the University of British Columbia Compliance Reports had a section examining the MCS efforts of each country and scores of these countries on their MCS efforts. The four measures that include observer schemes, vessel monitoring schemes, catch inspection schemes and control of access to stop illegal fishing, are all measures of a country s fisheries management capacity to monitor its waters. The descriptive analyses on the scores of these four measures, ranging from 0-10 ( no scheme to almost fully effective ), are used in the current research to understand the overall performance of the 54 countries on their MCS efforts.
119 104 Table 7.5 below summarizes the scores of these four measures. As it may be evident from the mean, countries in general score poorly on their fisheries MCS efforts, as their scores appear on a lower end of the scale. While countries overall ranked poorly on their MCS efforts, these efforts on each element of the MCS differ greatly. For example, when further examining the scores on observer schemes it was revealed that 13 out of 54 countries (24%) had a score of 0, which indicates absence of any of such schemes in these countries. When examining catch inspection schemes, it is evident that many countries performed average with a score of 5 (more specifically, 12 or 22% of the countries). Efforts on vessel monitoring schemes were among the better ones, as is seen from the overall mean score. A further examination on this variable revealed that a total of 10 countries, i.e. 18.5% received a score of 8 on this measure, while eight countries (15%) received a score of 0. Lastly, countries efforts to control access to stop illegal fishing are toward the middle of the scale, with 10 countries having a score of 4 and 10 countries a score of 5 (20 out of 54, or 37%). Table 7.5. Descriptive Statistics of MCS Scores Statistic Observer Schemes Catch Inspection Schemes Vessel Monitoring Schemes Mean Median Mode St. Dev Control of Access to Stop Illegal Fishing
. The boxplots show slight negative skewness (i.e. overall, countries scored slightly lower on the scale) for the variables observer scheme and catch inspection scheme ; slightly positive skewness (i.")
120 105 The four variables above are also grouped together in one boxplot graph (see Figure 7.3. below) to have a further look at their distributions and compare them against each other. This comparison is possible as these variables were all measured on the same metric (i.e. scale ranging from 0-10). The boxplots show slight negative skewness (i.e. overall, countries scored slightly lower on the scale) for the variables observer scheme and catch inspection scheme ; slightly positive skewness (i.e. overall, countries scored slightly higher on the scale) for the variable vessel monitoring scheme ; and fairly normal distribution for the variable control of access to stop illegal fishing. The whiskers show a spread of scores between 0 and 9, with the middle 50% of the cases, for example, for the variable vessel monitoring scheme, falling between the scores of 2 and 7. The boxplot also confirms that overall, countries performed worst on the observer schemes variable, as they scored lower on this variable than the other three. Figure 7.3. Boxplots of the MCS Scores
121 106 To look at the best and worst performing countries on these scores, Tables 7.6 through 7.9 were created. This information is useful, as it compares these countries to all 54 countries in their performance on the four measures discussed above. For example, Table 7.6 shows that only one out of the 54 countries received a maximum score of 9 on its observer schemes efforts. Meanwhile, 13 countries had no schemes, as they received a score of 0 on this measure, indicative of the absence of any such scheme. Table 7.6. Best and Worst Performing Countries on their Efforts on Observer Schemes BEST WORST Country Score Country Score Norway 9 Maldives 0 Iran 0 India 0 Viet Nam 0 Thailand 0 Philippines 0 North Korea 0 Nigeria 0 Myanmar 0 Malaysia 0 Angola 0 Turkey 0 Peru 0 Table 7.7. Best and Worst Performing Countries on their Efforts on Catch Inspection Schemes BEST WORST Country Score Country Score Norway 9 Nigeria 0 North Korea 0
122 107 Table 7.8. Best and Worst Performing Countries on their Efforts on Vessel Monitoring Schemes BEST WORST Country Score Country Score Iceland 9 Turkey 0 Ecuador 0 Sri Lanka 0 Bangladesh 0 Egypt 0 Angola 0 North Korea 0 Nigeria 0 Table 7.9. Best and Worst Performing Countries on their Efforts to Control Access in Stopping Illegal Fishing BEST WORST Country Score Country Score Namibia 8.5 Ukraine 0 Bangladesh 0 Angola 0 North Korea 0 Nigeria 0 Several conclusions can be drawn from the tables above. Firstly, much fewer countries have performed almost perfectly on their MCS efforts, and the best score was 9 on the 10-point scale. Secondly, two countries, in particular Nigeria and North Korea, lack any MCS capacity, receiving a score of 0 on all four measures examined. Other countries, for example Angola, lacked most of these measures, receiving a score of 0 on three of these measures, and Bangladesh lacked half of these measures, receiving a score of 0 on two. Lastly, the majority of the countries that performed poorly on these measures are developing countries.
123 108 Formal surveillance capacity This variable was measured by dividing the total number of patrol boats available by the size of the exclusive economic zones of the countries and multiplying the results by 100,000sq km. Descriptive analyses revealed that the countries had on average patrol boats per 100,000sq km, with the numbers ranging from zero to 102. In addition, a frequency table was constructed to look further into these numbers. It was revealed, that 27 countries (i.e. 50%) had less than 10 patrol boats per 100,000sq km, and one country, namely Thailand, had 102 patrol boats per 100,000sq km, with Denmark (n=73) and Italy (n=79) being the other two outliers. Lastly, the Boxplot graph in Figure 7.4 below shows that 51 out of the 54 countries (i.e. 94%) had between zero and 66 patrol boats per 100,000sq km, with the middle 50% of the countries having between three and 30 boats (as seen from the bottom and top edges of the box). The graph also reveals a significant positive skewness showing a tail toward larger numbers, which is attributable to the three countries with most patrol boats.
 fishing vessels This variable serves as a measure of informal surveillance.")
124 109 Figure 7.4. Boxplot of the Total Number of Patrol Boats per 100,000 sq km Patrol Boats Per 100,000 sq km Detectable (Class A) fishing vessels This variable serves as a measure of informal surveillance. It is assumed that when there are more detectable/authorized fishing vessels, there would be fewer illegal fishing vessels. This statement is based on two assumptions: (a) legally fishing vessels would likely report illegally fishing vessels, as this will be economically advantageous for them, and (b) when more vessels can be detected in fishing grounds, this is indicative of not only high legal fishing volumes within a country, but also good control/surveillance over these fishing vessels by local/terrestrial control centers. As
125 110 such, the latter is also an indirect measure of country s ability to monitor its territorial waters. These numbers are calculated by looking at each individual centroid point (representing a grid cell) that falls within a country s EEZ. These points are spread across the area of the EEZ, and contain information on the average number of fishing vessels. The total average number is then calculated for each country by adding the average numbers of fishing vessels for each point. For example, if Country A had three points falling within its EEZ, and Point 1 contained an average of 10 fishing vessels, Point 2 contained an average of 10 fishing vessels, and Point 3 contained an average of 15 fishing vessels, then the total average number of detectable fishing vessels within the country would be the sum of all three. There was, therefore, no need for standardizing the final total number by the size of the EEZ, as these cells were spread across the area. The descriptive statistics presented in Table 7.10 below show that on average, countries had (Class A) fishing vessels. However, this number does not represent the variable well, as the minimum and maximum number range was The skewness statistic also indicates a fairly high negative skew, which is also evident when looking at the median. Table Descriptive Statistics on the Average Number of Detectable Class A Fishing Vessels Minimum Maximum Mean Median Std. Dev. Skewness
126 111 A further examination of the variable revealed that 66.7% of the countries (36 out of 54) had less than 10 detectable fishing vessels within their EEZs. This may mean that: (a) either a majority of fishing vessels do not comply with the vessel monitoring systems installation requirement when they fish in most of these countries, and this is the reason why they are not detected, or (b) that the majority of these countries have small EEZs, thus the small number of (detectable) fishing vessels. Figure 7.5 below shows the countries that had 10 or more detectable fishing vessels. One may assume that the countries that have larger exclusive economic zones would be expected to have more detectable fishing vessels. To test this assumption, the researcher looked at the four countries that had more than 250 such vessels, which included Russia, Iceland, Norway, and the United States. The researcher then looked at the size of their exclusive economic zones, which were approximately 8 million sq. km., 772 thousand sq. km, 1.4 million sq. km., and 6.2 million sq. km., respectively. It is evident from the numbers above that, although Norway s EEZ size is 4.50 times smaller than that of the United States, they both had more than 400 detectable fishing vessels. A similar analysis with Russia and Iceland was performed, and it revealed that, while Russia s EEZ is times larger than that of Iceland, they had almost the same number of detectable fishing vessels within their EEZs. It can, therefore, be concluded that the size of the EEZ may not necessarily be the reason why some countries have significantly larger number of detectable fishing vessels within their territorial waters. Instead, the importance of that country as a fishing country, as well as its capacity to monitor its waters, may be a more plausible argument.
127 Number of Detectable Fishing Vessels 112 Figure 7.5. Countries with More than Ten Class A Detectable Fishing Vessels (N=18) Summary of Results The findings discussed in this chapter are valuable in not only identifying important patterns, but also providing initial understanding on why correlations between the dependent variable (degree of illegal fishing) and the independent variables would be expected. A summary of the most important findings is provided below: About 40% of the countries had almost as many illegal vessels as legally fishing vessels in their territorial waters. About 70% of the countries had very serious illegal fishing problems within their territorial waters. Four out of the 54 countries, which include Thailand, Russia, Spain and Myanmar, scored 10 on the degree of illegal fishing.
128 113 On average, countries had 18 species that were highly commercial internationally. About 24% of the countries had 23 or more such fishes, and the majority of these countries scored extremely high on the degree of illegal fishing. The majority of the countries that had more than 23 species are in South- Eastern and Eastern Asia. Thailand topped the list of not only having the most highly commercial species, but also being among the four countries with worst ( 10 ) scores on illegal fishing. About 70% of the countries are within a close geographic proximity to at least one Port of Convenience, while 28% of the countries have access to two such ports. Port Kaliningrad in Russia, and Port Rostock in Germany, are the most accessible Ports of Convenience, as nine countries in Europe have access to both. Port Singapore, the most vulnerable Port of Convenience, is accessible to the five countries that had among the highest scores on illegal fishing. Of the four MCS measures that include observer schemes, vessel monitoring schemes, catch inspection schemes an control of access to stop illegal fishing, countries performed most poorly on observer schemes, with 24% of the countries lacking any such programs. The better performing MCS measure was the vessel monitoring schemes, however, 15% of the countries lacked any such schemes.
129 114 Norway, Iceland and Namibia are among the best performing countries on the MCS measures. Nigeria and North Korea have none of the four MCS measures, while Angola lacks three of these measures, and two of these measures were absent in Bangladesh. All of these countries, except for North Korea, are also among the most vulnerable countries for illegal fishing. About half of the countries had less than 10 patrol boats per 100,000 sq km of EEZ, while three countries had significantly higher number of patrol boats, and include Thailand (n=102), Denmark (n=73) and Italy (n=79). About 67% of the countries had 10 or less detectable Class A fishing vessels within their territorial waters, and four had over 250. While many of the countries scored high on the degree of illegal fishing occurring within their waters, the names of only few countries were recurring in the analyses of independent variables. By looking at these few countries, it is evident that the number of highly commercial species available within their waters can be a magnet for illegal fishing, coupled with the lack of fisheries monitoring, control and surveillance capacity, availability of Ports of Convenience within a close geographic proximity, and insufficient formal surveillance capacity. Obviously, this will have to be true for many countries, so that valid conclusions can be drawn. It is, therefore, important to examine these relationships by applying more complex statistical models. These analyses will be presented in chapter nine.
130 115 CHAPTER 8 PRE- AND POST-ANALYSIS DIAGNOSTICS AND VARIABLE TRANSFORMATIONS Introduction Before any parametric tests (which will be performed in chapter nine) are conducted, it is important that a screening of the variables be conducted. This initial step is important, as parametric tests require that the researcher meet certain assumptions about the variables before these variables can be used to test empirical correlations. Failure to do so will result in inaccurate interpretations of the results of the study. In the current study, ordinary least squares regression is the intended statistic that will be performed to test the relationship between the independent variables and the dependent. The assumptions of the test are as follows: (a) the dependent variable should be normally distributed (b) there is no multicolinnearity between the independent variables. This is especially problematic, as it will lead to inaccurate results or misleading interpretations (Leech et al, 2005). (c) there should be a linear relationship between the independent variables and the dependent variable (d) Homoscedasticity, i.e. the residuals at each level of the predictor(s) should have the same variance (Field, 2005).
131 116 (e) Independence of errors, i.e. the residual terms should not be correlated (Field, 2005). (f) Errors should be normally distributed, i.e. the difference between the model and the observed data are most frequently zero or very close to zero (Field, 2005). Assumptions (a) and (b) outlined above are examined in the pre-analysis diagnostics section of this chapter, while the remaining assumptions are tested after the regression model has been run, i.e. in the post-analysis section. Variable transformations are also discussed in the pre-analysis diagnostics section, so is the consideration of sample size, i.e. power analysis. Pre-Analysis Diagnostics Testing the normality assumption of the dependent variables One of the most important assumptions of running parametric statistical tests is the requirement that the variable be normally distributed, as mentioned earlier. This assumption is especially important to test for the dependent variable. Whether the dependent variable is normally distributed or skewed may have a significant effect on the results. An analysis of the results of descriptive statistics for the dependent variable revealed a skewness score of -.484, which falls between +1.0 and -1.0, indicating a nonskewed distribution. The same results are seen in the Histogram in Figure 8.1 showing a

132 117 normal distribution of the scores. It must be noted, however, that the distribution seems to be slightly peaked, which is indicative of leptokurtic distribution. Nevertheless, this does not hinder selecting the intended parametric test to test the proposed hypotheses. Figure 8.1. A Histogram Testing the Normality of Distribution for the Dependent Variable Testing the multicollinearity assumption for the four MCS variables There are four independent variables that measure different components of monitoring, control and surveillance. It is expected that these measures are highly correlated with each other, given they are parts of the same concept.
133 118 To look further into this assumption, a bivariate correlation analysis was performed between these four independent variables. The results are presented in Table 8.1 below. Table 8.1. Intercorrelations between the Four MCS Variables Variable Catch Inspection - 2. Vessel Monitoring.80*** - 3. Observer.64***.62*** - 4. Control of Access.75***.73***.67*** - *p<.10; **p<.05; ***p<.01 As it can be seen from the table, there is a strong and significant correlation between all the measures of Monitoring, Control and Surveillance, which include catch inspection schemes, vessel monitoring schemes, observer schemes, and control of access to stop illegal fishing. The inter-correlations between these four variables are very strong (r >.60), which is a problem that needs to be addressed before these variables can be used in the final multiple regression model. Internal consistency reliability test for the four MCS variables One solution to the multicollinearity problem encountered above with the four independent variables is to group these variables into a composite index and use the factored score of that index to represent the variables in the final analysis. This will be performed after it is established that these variables together form a reliable scale. To assess the reliability of the new scale, Cronbach s alpha was computed. The Cronbach s alpha for the four variables was.89, which shows that the items have good
134 119 internal consistency. Consequently, they can be reliably grouped into one composite index. Principal components analysis for the four MCS variables Principal components analysis is a valuable tool when researchers want to reduce the number of predictor variables in an analysis, or when they want to group several variables that hang together into one measure (Leech et al, 2005). It is especially valuable when there is a multicollinearity problem, but the researcher wants to use all these variables in one single model. Principal components analysis, therefore, allows the researcher to create one single score that can be used to represent all the variables in the group, given their combination is reliable and given they together are sufficient to create one single composite variable. In order to be able to conduct principal components analysis, the data must meet several assumptions. One of the major and important assumptions is that the variables are related to each other in a linear fashion, and that they are at least moderately correlated with each other. Luckily, both assumptions are met, as is evident from the intercorrelations table presented earlier in the chapter. This means that the principal components analysis test can be conducted. Table 8.2 below shows the results of the Kaiser-Meyer-Olkin (KMO) and Bartlett s test. The KMO measure is.83, which shows that enough items are predicted by each factor (Leech, 2005). The Bartlett s test is significant (p<.01), which shows that the variables are correlated well enough with each other and, therefore, provide a reasonable basis for the principal components analysis.

135 120 Table 8.2. KMO and Bartlett s Test Results Kaiser-Meyer-Olkin Measure of Sampling Adequacy. Bartlett's Test of Sphericity.833 Approx. Chi-Square Df Sig..000 Figure 8.3 below is a Scree Plot supporting the conclusion that these four variables can be reduced to one single component. The Eigenvalue is also greater than 1, which indicates that the factor is useful and the newly extracted component (which is the combination of the four variables) can be reliably used in future analyses. Figure 8.2. Scree Plot of the Factored Components
136 121 Table 8.3 below presents the factor loadings for each variable used to create the final component. It also shows the Eigenvalue and percent of variance explained by this component. As it can be seen form factor loadings, the items load strongly on each other. The newly created factor is also a reliable measured based on the Eigenvalue (3.11), and the percent of variance that is accounted for by this new factor. Lastly, the Determinant was.071 > 0, indicating that the collinearity was not too high to be of concern. Table 8.3. Factor Loadings for the Four MCS Variables Item Factor Loadings Communality Observer Schemes Catch Inspection Schemes Vessel Monitoring Schemes Control of Access to Stop Illegal Fishing Eigenvalue 3.11 % of Variance The diagnostic tests performed above were conducted to test important assumptions that had to be met before any multivariate models could be built. The most important assumptions, namely normality of the distribution of the dependent variable, linearity of the correlation between the dependent and independent variables, and no multicollinearity between the independent variables were confirmed. However, before using these variables in a multivariate model, it is also important to conduct power analysis. This is especially important in the current study, as the sample size is relatively small, and there is a restriction as to how many predictor variables can be used in a single multivariate model. Power analysis and sample size estimation, therefore, is performed in the following section to determine the sufficient sample size
137 122 and power level given the number of predictor variables that are intended to be used in the multivariate linear regression model. Transforming independent variables Detectable fishing vessels To address the problem of extreme skewness for the independent variable average number of detectable fishing vessels, a decision was made to recode the variable into two attributes, which would represent presence and absence of detectable fishing vessels. The countries that had no such vessels within their territorial waters were coded as 0, and those with at least one such vessel were coded as 1. This dichotomous variable will be used in the final multivariate model. Access to ports of convenience The descriptive analyses performed earlier revealed that countries had up to two Ports of Convenience within close geographic proximity. This variable, as such, is constrained in range. An Analysis of Variance test was performed to determine whether there is a significant difference on the degree of illegal fishing between the countries that had 0, 1 or 2 such ports. The analysis revealed an overall statistically significant difference (F (2, 51)= 5.54, p<0.05) between the groups. A further examination was
138 123 performed by running the Tukey s HSD Post Hoc Test 17 to determine specifically which groups differed significantly on their degree of illegal fishing. It was determined that the countries that had 0 such ports were statistically significantly different from those that had 1 (p<0.05). No other significant difference was found between the remaining groups. Consequently, a decision was made to recode this variable into 0 and 1 representing no access and access to such ports, with the latter including the countries that have access to one or two such ports. This newly transformed dichotomous variable will be used in the final multivariate model. Power analysis and sample size estimation Power analysis and sample size estimation allow the researchers to decide the adequacy and reliability of statistical tests performed in their study. Without these calculations, the results may be of little use. For example, if the sample size is too small, the experiment will have little precision to provide reliable answers, regardless the analyses yielded significant results or not (Miles, J., no date). There are several sources that can be used to easily perform this test. Apart from the availability of programs that can be freely downloaded and used to conduct power analysis, there are also online statistical calculators that allow for a quick estimation. Generally there are three anticipated effect sizes,.02,.15 and.35, corresponding to small, medium and large effect sizes. The desired power level is usually set at.80. The power analysis also requires that the researcher set the expected significance level, 17 This Post-Hoc test was conducted, as the Homogeneity of Variances Test revealed that the Levene s statistic was not statistically significant, consequently, the groups had equal variances.
139 124 and the number of predictors. Consequently, for an a priori multiple regression model, with an anticipated effect size of.35, desired power level of.80, standard significance level of p<.05, and five predictor variables, the power analysis calculations yielded a minimum required sample size of 43. In the current research the sample size is 54, therefore, the research is likely to find significant effects. Post-Analysis Diagnostics Assessing the assumption of no multicollinearity While in the pre-analysis diagnostics section the assumption of no multicollinearity was tested, this section provides further detail to examine this assumption. More so, this section looks at the no multicollinearity assumption after the variable transformations have been performed and after all the variables have been entered into the regression model. Namely, this section reviews the VIF and tolerance statistics to review further this assumption. Specifically, four guidelines outlined in Field (2005) are followed to draw conclusions: a. Examination of whether the VIF value is greater than 10 b. Examination of the average VIF value c. Examination of tolerance and whether it is below.10 d. Examination of tolerance and whether it is below.20
140 125 According to Field (2005), if the largest VIF value is greater than 10, then this is problematic. So is the average VIF value that is substantially greater than 1. Moreover, tolerance below.10 indicates a serious problem, while tolerance below.20 indicates a potential problem. Taken these guidelines into consideration, both the VIF and tolerance collinearity statistics obtained from the regression model were examined. The obtained VIF values ranged from 1.09 and 1.48, well below 10 and the average of all the values was not substantially greater than 1 (average = 1.23). Moreover, the tolerance statistics ranged between.68 and.92, well above.20, therefore, allowing for a conclusion that there was no collinearity within the data in the model. Examining casewise diagnostics The residuals diagnostics allow for an examination of extreme cases in the model. According to Field (2005), it is expected that 95% of the cases have standardized residuals within +/- 2. In this sample of 54 cases, it is reasonable to expect about 2.65 cases (5%) to have residuals outside of these limits. An analysis of the Casewise Diagnostics table revealed only one such case (case #44 - Spain). Further, Field (2005) suggests that 99% of cases should lie within +/- 2.5, and if the standardized residual is greater than 3, then this should be cause for concern. An examination of Spain s standardized residual (St. Resid. = 2.26) shows that there is no cause for concern for the current model, as even this outlier falls within the +/- 2.5 range. Cook s distance values were also examined for all the cases in the model to determine if there were any cases that significantly influenced the overall model.
141 126 Generally, a Cook s distance value of 1 indicates such influence (Field, 2005). In the model examined, none of the obtained Cook s distance values exceeded 1, with all the values ranging from Checking for assumptions Checking for the independence of errors One of the tests that can be used to examine this assumption is the Durbin-Watson test, which is obtained when running the regression analysis (Field, 2005). The obtained Durbin-Watson score for the current model was 2.07, a value close to 2, thus indicating that the assumption of independence of errors has not been violated in this model (Field, 2005). Checking for linearity and homoscedasticity The best method to check this assumption is to run a scatterplot examining the relationship between the standardized residual and the standardized predicted value (Field, 2005). The results are shown in Figure 8.3 below.

142 127 Figure 8.3 Correlation between Standardized Residual and Standardized Predicted Value The scatterplot above shows that there is a slight heteroschedasticity problem in the data, as the data points are not completely randomly dispersed around zero, but rather form a shape of a funnel by becoming slightly more spread out across the graph. However, this spread is not very large to be of concern. Checking for the normality of residuals To check for the normality of residuals, two graphs below have been created. Figure 8.4 is a histogram that shows that the standardized residual is fairly normally distributed.

143 128 Figure 8.4. Histogram of the Standardized Residual Figure 8.5 below is a normal probability plot that shows the deviations from normality. The straight line represents a normal distribution, while the points represent the observed residuals (Field, 2005).

144 129 Figure 8.5. Normal P-P Plot of Normally Distributed Residuals As it can be seen from Figure 8.5 above, the dataset is almost perfectly normally distributed, as the points cluster very closely on the line. Consequently, the assumption of the normality of residuals has been met. Chapter Summary The current chapter was comprised of two sections. The first section performed pre-analysis diagnostic tests. The goal of this was to screen the variables used in the multivariate analysis in chapter eight. This was important for several reasons. Firstly, it tested several assumptions that had to be met before any multivariate models could be applied to test the hypotheses. Secondly, due to the small sample size, some data preparations were necessary. The data preparation entailed reducing several variables into
145 130 a single model, those that conceptually hung together. This was performed because these variables were highly correlated with each other, thus presenting a multicollinearity problem. Two independent variables, namely average number of detectable fishing vessels and access to ports of convenience were recoded into nominal dichotomous variables. Lastly, due to the small sample size, power analysis was performed to examine whether the intended number of independent variables could be used simultaneously in the multivariate model without violating important statistical caveats, as well as to determine the minimum effect size that had to be achieved for the results of the multivariate analyses performed in the following chapter to be meaningful. Other very important assumptions were examined in the post-analysis diagnostics section of the chapter, which included the examination of the independence of errors, homoscedasticity, and normality of the distribution of errors. The details provided in these two sections provide confidence in the results derived from the quantitative analyses performed in the following chapter.
146 131 CHAPTER 9 QUANTITATIVE ANALYSIS RESULTS Introduction Given the characteristics of the variables used in this research, ordinary least squares regression (OLS) is utilized as the main analytic tool to examine the multivariate relationship between the variables discussed earlier. Ordinary least squares regression is chosen over other statistical techniques because the level of measurement of the variables is either continuous or nominal with two attributes (dichotomous). Ordinary least squares regression will also let the researcher make predictions about the dependent variable from the independent variables used in this study. That is, given a significant relationship is found between the variables examined, it will be possible to determine the expected/predicted degree of illegal fishing within a country s EEZ. Results of Ordinary Least Squares (OLS) Regression Analysis An OLS regression model can test two distinct sets of hypotheses: one that involves a hypothesis testing the overall regression model and how well it predicts the dependent variable when all variables are considered together; and another that looks at each individual variables ability to stand out as a predictor of the dependent variable, thus testing individual hypotheses (Norusis, 2006). The results of the OLS regression analysis are presented in Table 9.1 below.
147 132 To examine the model s overall predictive power, the overall F test for the model is examined. As it can be seen from the table, all the variables taken together can statistically significantly predict the degree of illegal fishing within countries territorial waters F(5, 47) =14.49, p<.001. In addition, the coefficient of determination, R² shows that the model can, overall, explain 61% of the variance in the dependent variable. Note that for the model to be of use (with the sample size we had), the model had to achieve at least.35 for the effect (and it had to be large), as indicated by the power analysis test performed earlier. The R in the current model is.78, therefore the effect was achieved here and it is large according to Cohen (1988). Also, note that the total number of cases considered in the current model was 53. This is because the model was performed by excluding cases listwise. The country that was not included in the current analysis was Netherlands which had missing data on the number of patrol boats per 100,000sq km 18. It should also be noted that a separate analysis was performed with Thailand excluded, as it represented an outlier on the number of patrol boats per 100,000 sq km, however, the latter model yielded similar results 19. Table 9.1. Simultaneous Multiple Regression Analysis Results Variable B SEB ß Highly Commercial Species ** Patrol Boats Per 100,000 sq km * Detectable Fishing Vessels (0=not present; 1=present) MCS Capacity ** Access to Ports of Convenience (0=no access; * 1=access to at least one) Constant Note. R² =.61; F (5, 47) = 14,49, (p<.001); *p<.05; **p< The country has no boats of its own and employs patrol boats from private firms whenever necessary (Wertheim, 2007). 19 The results with Thailand excluded were as follows: F(5,46)=13, 35, p<.01; all the variables were significant at p<.05, except for the variable available detectable fishing vessels ; and the R² was.59.
148 133 The OLS regression model, as mentioned earlier, also allows for an examination of each predictor variable s impact on the dependent variable degree of illegal fishing. Based on the outcome of the model, four out of the five predictor variables used in the model are significant predictors. The b values indicate each predictor variable s unique contribution to the model. The positive b values indicate a positive relationship between the predictor and outcome variables, which means when there is increase in the value of the predictor variable, there is also increase in the value of the outcome variable. Similarly, the negative b values indicate an inverse relationship. The b value for highly commercial species predictor variable (b=0.06) indicates that with one unit increase in the number highly commercial species, the level of illegal fishing within the country s territorial waters increases by Because the variable highly commercial species was measured in single units, this indicates that for every fish species that becomes highly commercial internationally, the degree of illegal fishing within the country s EEZ increases by 0.06 points on the measurement scale (0-10), when the effects of all other variables in the model are held constant. The b value for the predictor variable patrol boats per 100,000 sq km (b=-0.02) indicates that with one unit increase in the number of patrol boats per 100,000 sq km, the level of illegal fishing within the country s territorial waters decreases by Because the variable patrol boats per 100,000 sq km was measured in units per area of the EEZ, the number indicates that when patrol boats increase by one for every 100,000 sq km of area, the degree of illegal fishing decreases by 0.02 points on the measurement scale (0-10), when controlling for all the variables in the model.
149 134 The b value for the predictor variable MCS Capacity (b=-1.71) indicates that with one unit increase in the MCS score, the level of illegal fishing within the country s territorial waters decreases by 1.71 units. Because this measure was on a scale from 0-10, this would be interpreted that with every unit of change on the scale (0-10) measuring monitoring, control and surveillance efforts, the degree of illegal fishing will decrease by 1.71 points on the measurement scale (0-10), when other variables in the model remain constant. Lastly, the b value for the predictor variable Access to ports of convenience (b=1.27) shows that when a port of convenience within 1500nm becomes available, the level of illegal fishing within the country s EEZ increases by 1.27 points. More specifically, if there is an accessible Port of convenience, the degree of illegal fishing within a country increases by a measure of 1.27 points on the measurement scale (0-10), when holding the effects of the remaining variables in the model constant. The Beta coefficient also allows for individual comparisons, and indicates that as values in the predictor variables change by one standard deviation, the values in the dependent variable also changed by the X unit of the Beta coefficient. To put these into perspective, we examine each predictor variable separately. The standard deviation for highly commercial species was 17.83, while the standard deviation for fishing illegally was Based on the Beta coefficient (ß=.37) this constitutes a changes of 0.84 (i.e..37 x 2.26). Therefore, for every species that become highly commercial internationally, the change in the degree of illegal fishing increases by a unit of 0.84 points on the 10-point scale.
150 135 The standard deviation for patrol boats per 100,000sq km was 24. Based on the Beta coefficient (ß=-.22), this constitutes a change of This indicates that to achieve a half-score decrease on the scale measuring the degree of illegal fishing, the countries will have to increase the number of patrol boats per 100,000sq km by 24 units. Based on the standard deviation of the variable MCS capacity (SD= 1.00), and the Beta coefficient (ß=-.76) to achieve 1.72 points of decrease on the scale measuring the degree of illegal fishing, the countries will have to improve their MCS capacity by 1 point on the MCS scale. The standardized coefficient Beta also allows for a comparison among all predictor variables. This coefficient shows the degree to which predictor variables contribute to the model. As it can be seen from Table 9.1, as well as the discussions above, the predictor MCS capacity contributes most strongly to the model (ß=-.76), followed by highly commercial species (ß=.37), Access to ports of convenience (ß=.26), and patrol boats per 100,000 sq km (ß=-.22).
151 136 Summary of Results The hypotheses proposed in the current research were tested by conducting an ordinary least squares analysis. All the predictor variables were entered into the model simultaneously and were examined while other variables were held constant. The results are as follows: All hypotheses were supported, except for the one involving informal surveillance, which was measured by the presence of detectable fishing vessels in the country s territorial waters. The findings confirmed the expected directions of the hypothesized relationships. Among the predictor variables used in the current research, the variable MCS capacity was among the strongest to explain the variance in illegal fishing. The number of highly commercial species could significantly predict the degree of illegal fishing activity within the countries territorial waters. Moreover, for every species that become highly commercial internationally, the degree of illegal fishing increases by 0.84 points (on a 10-point scale). An increase in the number of patrol boats, a measure of formal surveillance was significantly associated with the decrease in illegal fishing activities. Moreover, to achieve a 0.50 point decrease on the degree of illegal fishing, countries will have to increase patrol surveillance by 24 units for every 100,000 sq km of EEZ. An increase in MCS capacity could significantly predict the decrease in illegal fishing. A one-point increase on this measure will result in an almost two-point decrease on the degree of illegal fishing.
152 137 Access to a port of convenience within close geographic proximity was a significant predictor of illegal fishing within a country s EEZ. Access to such port increases the degree of illegal fishing by 1.27 points on a 10-point scale.
153 138 CHAPTER 10 SPATIAL ANALYSIS Introduction The findings of the previous chapter provided useful information for both policy and theory. However, before any conclusions are presented, it would be useful to look at spatial patterns and distributions of what has been discussed in the previous chapter. This is important for two reasons: (a) the spatial analysis will provide more insight into the issue, and explain the problem by adding a spatial dimension to it, and (b) it will provide additional support to the findings of the previous chapter by looking at the proposed relationships through quantitative spatial lens. Consequently, this chapter is important in that it will provide visual information by looking at the values of the variables spatially. As such, it will produce useful information by not only highlighting some of the important aspects of the data collected, but it will also add to the body of literature that has tried to identify the most vulnerable parts of the world where illegal fishing occurs. If the spatial analyses reveal similar findings pertaining to illegal fishing, they will confirm the message conveyed by prior studies. Otherwise, if the spatial analyses reveal different findings (e.g. hot spots), they will shed light on the areas that are most vulnerable to illegal fishing. This chapter is divided into three sections. The first section provides descriptive spatial analyses on the dependent variable degree of illegal fishing, as well as the predictor variables used in the multivariate model in the previous chapter. The aim of this section is to provide a first glance at spatial distributions and identify spatial patterns
154 139 without applying statistical analyses. The second section presents the results of more rigorous spatial analyses used to identify spatial clusters, i.e. hot and cold spots. This section uses spatial statistics to confirm the results of the descriptive spatial analyses. Lastly, spatial relationships between the dependent and independent variables are explored by conducting a geographically weighted regression analysis. Descriptive Spatial Analysis The maps in the current section provide a first glance at the patterns of both illegal fishing and other explanatory variables. This section lays out the maps followed by brief interpretations of the patterns conveyed by these maps. Examining spatial patterns of illegal fishing While many countries are vulnerable to illegal fishing, as was discovered by the descriptive analyses provided in Chapter seven, some may be due to their geographic location. It may be that countries, where illegal fishing is high, are located next to or are within a close geographic proximity to other countries that have similar problems. To examine this assumption Figure 10.1 below is examined.
155 140 Figure Degree of Illegal Fishing within 54 EEZs From the map above it is evident that illegal fishing is a serious problem, and it is a problem that, although, may be confined to certain areas in the world, is nevertheless spread across countries and continents. Except for Namibia and Australia (marked in light blue), illegal fishing occurs often in the remaining 52 countries, with some countries experiencing a higher degree of the activity than others. Illegal fishing, for example, seems to be quite problematic in South America, with the countries examined experiencing a very high degree of the problem, most vulnerable of these being Ecuador, Peru and Argentina. Like patterns can be noticed in Europe, with eight countries experiencing among highest levels of illegal fishing. European countries most affected include Spain and Italy in the south, Denmark and Ireland in the north-east, UK in the
156 141 north, France and Netherlands in the west, and Russia and Ukraine in the east. Unlike South America and Europe, where countries experience slightly different degrees of illegal fishing within their waters, South East Asian countries are equally vulnerable to high degrees of illegal fishing, as is marked by the darkest blue color in the map. These countries, namely Indonesia, Vietnam, Philippines, Myanmar, Malaysia, Thailand, Taiwan and Bangladesh, seem to have formed a geographic hub for illegal fishing, with each being equally vulnerable to extreme high levels of illegal fishing within their territorial waters. Examining spatial patterns of availability of highly commercial species This section examines the geographic distribution of the highly commercial species. More specifically, it explores whether the countries that have more species that are highly commercial internationally geographically cluster together. Figure 10.2 below is a map of the EEZs and the number of highly commercial species found within.
157 142 Figure Number of Highly Commercial Species One interesting pattern is evident from the map above. The countries that had more than 33 highly commercial species are almost exclusively in South-East or Eastern Asia. More specifically, the majority of the countries that have 33 or more highly commercial species are the same countries that formed the geographic hub of high levels of illegal fishing activities discussed earlier. It seems from this analysis that these species may be magnets of illegal fishing, at least for these countries. It is also evident from the map that all the European countries had at least nine such species, and few countries had less than eight highly commercial species. The South American countries that were identified as having among the serious illegal fishing problems were also those that had at least nine highly commercial species, except for Peru.
158 143 Examining spatial patterns of access to ports of convenience While the number of species is an important factor affecting the decision to engage in illegal fishing, so is the ability to get away with the illegally caught fish. As such, the availability of Ports of Convenience within a close geographic proximity plays a significant role in this decision-making process. To see whether the countries are conveniently located around these ports, the map in Figure 10.3 was created. Figure Number of Ports of Convenience Available within 1500 nm from Countries EEZs The map in Figure 10.3 helps the researcher discern several important patterns. First, almost every country that is within or borders Asia and Europe has access to at least one such port. Second, the counties that don t have access to these ports seem to be either
159 144 slightly geographically isolated, or are along the edges of the continents where they belong. Third, two of the countries in South America that have an extremely serious illegal fishing problem have access to at least one such port, so does Mexico in the north (which also has very serious illegal fishing problems). Lastly, the majority of African countries that have a great deal of illegal fishing are also within a close geographic proximity to at least one such port. Hot- and Cold-Spot Analysis While the maps above provide useful information about the geographic distributions of illegal fishing, species abundance and availability of Ports of Convenience, they remain descriptive in nature. As such, limited conclusions can be drawn from these maps. For example, while the researcher noted that illegal fishing may be concentrated in South East and Eastern Asia, it is, nevertheless, impossible to make solid conclusions without exploring the assumption further. More rigorous statistical analyses are, therefore, necessary to empirically support the assumptions drawn in the previous section. For that reason, two statistical tests are performed in the following two sections: one that looks at statistically significant hot and cold spots by performing a Getis-Ord Gi* hot-spot analysis, and another that tests the statistical significance of the relationships between the independent variables and the dependent variable used in the multivariate ordinary least squares regression analysis in chapter nine. There are two ways of identifying spatial patterns: global statistics and local statistics (Mitchell, 2005), each of which use different techniques. Global spatial statistics
160 145 measures look at the features to understand if these features form any patterns in any discernible way. Unlike global spatial statistical measures, the local measures take into account the characteristics of neighboring features and the weights these characteristics carry, and calculate hot and cold spots based on these characteristics. For example, Namibia borders Angola and South Africa. To show that Namibia is a statistically significant hot spot for illegal fishing, it will have to have not only a high score on the degree of illegal fishing, but Angola s and South Africa s level of illegal fishing will also have to be relatively high. Identifying hot and cold spots of illegal fishing In light of the discussion above, this section attempts to identify concentrations of hot and cold spots for illegal fishing by conducting a local spatial statistical analysis, namely Getis-Ord Gi* analysis. This statistic allows for a micro-level analysis of geographic clustering of high and low values. The results of the analysis are displayed in Figure 10.4 below.
 or greater than 1.")
161 146 Figure Statistically Significant Hot and Cold Spots of Illegal Fishing Figure 10.4 above displays the results of the Getis-Ord Gi* spatial analysis. The statistically significant hot or cold spots are determined by the values of the obtained z-scores. The areas that had z-scores that were less than (marked in blue) or greater than 1.96 (marked in red) are statistically significant cold and hot spots of illegal fishing at a confidence level of 95%, respectively. As it can be seen from the map above, the coldest spot for illegal fishing is Canada, and there are 11 illegal fishing hot spots, which include India, Pakistan, North Korea, Bangladesh, Myanmar, China, Japan, Sri Lanka, Taiwan, South Korea, Thailand and Vietnam. From here it is evident that many of the countries that have been identified in the descriptive spatial analyses as hubs of illegal fishing are now statistically significant hot spots. Note that Japan, while scoring a
162 147 5 on the degree of illegal fishing, indicating that vessels often fish illegally within its waters, is among the remaining countries in the region. This could be because its waters border China, North Korea, South Korea and Russia, all of which have significant illegal fishing problems within their territorial waters. Identifying hot and cold spots of highly commercial species The map in Figure 10.5 was created with an attempt to identify statistically significant hot and cold spots of the number of species within the countries EEZs that are highly commercial internationally. Figure Statistically Significant Hot and Cod Spots of Highly Commercial Species
163 148 The map above provides support to the descriptive spatial analyses performed earlier that attempted to understand the concentrations of countries on the number of highly commercial species. It shows, for example, that the South Eastern and Eastern Asia remains a hot spot of not only illegal fishing, but also a place where more species found within the countries territorial waters are highly commercial internationally. Of the 12 countries identified as hot spots, 10 are found in these areas (which include North Korea, Malaysia, China, Japan, Taiwan, South Korea, Thailand, Vietnam, Philippines and Indonesia), with the other two being Canada and Australia. It also identifies 13 cold spots (marked in blue), and these include Ghana, Nigeria, Angola and Morocco in Africa; Netherlands, Italy, France, UK, Portugal, Spain and Turkey in Europe; and Iran in Southern Asia. Identifying hot and cold spots based on access to ports of convenience The analysis in this section focuses on identifying the areas that are statistically significant hot or cold spots based on their access to Ports of Convenience. This section, therefore, complements the discussions made earlier in chapter seven, when such ports, as well as the countries that had access to two such ports were identified.
164 149 Figure Statistically Significant Hot and Cold Spots based on Access to Ports of Convenience As it can be seen from Figure 10.6 above, the hot spots of access to Ports of Convenience are almost exclusively in Europe. These findings suggest that most European countries had access to at least one such port or shared borders with a number of countries that had such access. The rest of the countries examined had access to one such port, or were adjacent to at least one country that had such access. The cold spots, which include Yemen, Iran, Pakistan, India, Bangladesh, Maldives and Myanmar, are the areas which don t have access to any such ports, neither are they adjacent to countries that have at least one such port, with the exception of Myanmar.
165 150 Examining Regional Variations: Geographically Weighted Regression (GWR) Analysis Introduction While Ordinary Least Squares (OLS) regression analysis is the most widely used statistical tool that links each independent variable in the model to the dependent variables, it nevertheless is less superior to Geographically Weighted Regression when used to examine spatial data (Charlton, et. al., 2006). This is so because the OLS model assumes that the relationships between the variables are static over space an assumption that is not always true. Geographically Weighted Regression (GWR) allows for devising models that vary over space, therefore, is a useful technique for several reasons. First, it examines same relationships as the OLS regression analysis model while taking the geographic dependence of all the scores into consideration. This allows for a comparison of whether using a GWR analysis would be a better choice than OLS, given the characteristics of the variables in the model. Second, GWR analysis produces a regionspecific R² value, thus allowing for a further scrutiny of whether the OLS model was equally applicable to all regions, or whether there was a spatial variation in its explanatory power. In other words, GWR model explores spatial heterogeneity, thus allowing for an examination across the study area. Third, Geographically Weighted Regression analysis allows the model coefficients (predictors) to vary regionally (Mitchell, 2005). In other words, the analysis runs a regression for each region (in this case country) rather than for the entire study area (or group) as a whole, and produces not only different R² values, but can also show variations across coefficients (predictors),
166 151 thus allowing for an examination of the level of influence of these coefficients on each region. A GWR analysis is generally conducted after an initial OLS regression model is examined and interpreted, as GWR analysis does not provide model summary tables that examine the individual significant relationships between the variables, although there are complex methodologies that allow for this examination (Charlton, et. al., 2006). GWR analysis is more of an exploratory tool that allows for further examination of the relationships between the variables after it has been confirmed that there exists a significant relationship between these variables. Consequently, whatever is found to be statistically significant in the OLS model is also statistically significant in the GWR analysis. To build the GWR model, several important a priori considerations must be made. Among these is the decision as to which Kernel type, of which there are two (fixed and adaptive) should be used given the characteristics of the data. A spatial kernel is a measure that is used to provide the geographic weighting in the model (Charlton and Fotheringham, n.d.). To determine which Kernel type is appropriate, two methods are used. First, the researcher decides whether the observations are reasonably regularly positioned in the study area or whether these observations are clustered with varying densities of the observations around the study area (Charlton and Fotheringham, n.d.). In the former, the fixed kernel type is selected, and in the latter adaptive. Another method would be to examine the AIC (Münster, 2007) to determine bandwidth given the characteristics of the study area. The AIC is a measure of the relative distance between the model that has been fitted and the unknown true model (Charlton and
167 152 Fotheringham, n.d.: 3). Lower AIC means the model is closer in its approximation to reality (Münster, 2007). An examination of two GWR models with fixed and adaptive kernel types revealed a slightly lower AIC (203 versus 206) for the fixed kernel type. Consequently, the researcher made the decision to use this kernel type to run and interpret the results of the GWR analysis. Another consideration is the selection of bandwidth method, of which there are three: AICc, CV and Bandwidth Parameter. The first two allow researchers to use an automatic method for finding the bandwidth that gives the best predictions, while the latter allows for a specification of bandwidth by the researcher (Charlton and Fotheringham, n.d.). In the current study, the AICc bandwidth method was selected. Results of the overall model To determine whether GWR analysis produces better model fits than the ordinary OLS regression, several key elements are explored: (a) the overall model explanatory power, or R², and (b) the Akaike Information Criterion. When comparing the two models, the same principles as discussed above are applied: the model with a smaller value of the AIC is determined to be a better model than the other (Charlton and Fotheringham, n.d.). The AIC value for the OLS regression analysis performed in ArcGIS was 199, while the AICc value obtained from the GWR analysis by using the fixed kernel type and AICc bandwidth method was 203, a difference of 4 points. This difference indicates that the OLS model and the GWR model performed almost identically. In other words, when
168 153 the AIC difference does not exceed 4 points, there is little to choose between the two models (Charlton and Fotheringham, n.d.). Nevertheless, the GWR model will provide more detail when examining the influence of local coefficient estimates, and, consequently, it is worth exploring further. Geographically Weighted Regression (GWR) analysis was performed to examine the relationship between the five explanatory variables, which included the number of highly commercial species, access to a port of convenience, patrol boats per 100,000 sq km, MCS capacity and presence of detectable fishing vessels, and the dependent variable degree of illegal fishing. GWR was performed by using the Spatial Statistics Tool available in ArcGIS. Mapping the values of Standardized Residuals is generally the first step researchers take before further examining the GWR model results (Charlton and Fotheringham, n.d.). This exercise is performed for two specific reasons: (a) to determine whether there are unusually high or low residuals across the study area, and (b) to determine whether the residuals are spatially autocorrelated.

169 154 Figure A map of Standardized Residuals Figure 10.7 above shows the distribution of standardized residuals across the study area. As it may be seen from the map, most residuals are not large enough to be of concern. There is, however, one country, namely Namibia, that has a standardized residual value < This is because Namibia received the lowest score on the degree of illegal fishing (with a score of 0.5). As such, the model will slightly over-predict the dependent variable in Namibia, a point that should be taken into consideration when further interpreting the results. When the residuals exhibit spatial clustering, i.e. spatial autocorrelation, the results of the GWR analysis are not completely accurate. Therefore, it is most important to check for spatial autocorrelation of the residuals (ESRI, 2009). To examine spatial autocorrelation, Moran s I test was conducted by using the Spatial Autocorrelation Tool
170 155 available in the ArcGIS Spatial Statistics toolbox. The results of the Moran s I test showed no significant autocorrelation of the residuals (Moran s I Index = -0.02,p = 0.97), thus there is little evidence of autocorrelation in these residuals. Lastly, the condition numbers were examined to look for the existence of the possible local variable redundancy problem. None of these numbers were greater than 30, thus, indicating no such problem (ESRI, 2009). Figure 10.8 below shows the R² variations as obtained from the GWR analysis. As shown, while the coefficient of determination varies across areas, this variation is not large (the R² ranged from 60% to 61%) 20. This indicates that there is little local variation in the model s explanatory power when each unit (here the EEZs) of the study area is considered. As such, the results of the GWR model are almost identical to the OLS model. While the GWR model did not add much variation in R² values across the study area, it is nevertheless a useful model to continue exploring, because, as mentioned earlier, it allows for an examination of the influence of local coefficient estimates, which are mapped and discussed in the following section. 20 Netherlands was excluded from this analysis, as it lacked information on one of the independent variables, namely number of patrol vessels per 100,000 sq km.
171 156 Figure The Variation in R² Values Across Study Area Results of the impact of each independent variable The analyses below were conducted to look further at each predictor variable s unique impact on the regression model and to see whether these predictors vary across the study area. Figure 10.9 (A, B, C, D) shows the results of these analyses.
172 157 Figure Regional Variations of the Impact of Each Predictor Variable A. Variation in Regional Impact of Highly Commercial Species Map A in Figure 10.9 above examines how well the number of highly commercial species was able to predict the degree of illegal fishing activities within these countries. As is seen from the map, the predictor explained best that impact for most of the countries in East Asia, as well as Russia. This variable can predict illegal fishing moderately well for most countries in South East Asia, as well as Europe. The impact of the number of highly commercial species is comparatively low for countries in Africa, as well as Canada, it is lowest in all the countries in South America, as well as Mexico and the United States. Note, however, that the impact of these coefficients is also dependent upon the influence of the surrounding countries as noted by Mitchell (2005), thus

173 158 producing slightly skewed results for countries that are surrounded by relatively more countries than others. Therefore, this impact interpretation should be done with this caution in mind. Nevertheless, the results show that the countries that had highly commercial species were also surrounded by other countries with similar values for that predictor variable. B. Variation in Regional Impact of Access to Ports of Convenience Map B above examines the impact of Ports of Convenience on the degree of illegal fishing in the regions. It seems that Ports of Convenience present a significant problem to countries in Southern and South Eastern Asia, as well as most countries in Europe. It seems to be less of a problem for countries in South America. It is slightly unclear why the Port of convenience presence may impact Canada or the United States,
174 159 given they are not close to any such ports. One explanation can be their relative proximity to Europe to the East, as well as their relative proximity to East Asia, where access to Ports of Convenience has the strongest impact. C. Variation in the Regional Impact of Formal Surveillance Map C above examines the impact of the number of patrol boats on the degree of illegal fishing. It is important to note that the correlation between this and the dependent variable is negative, thus, the interpretation below takes this direction into consideration. It seems that the number of patrol boats as a predictor has the most impact on countries in North and South Americas, as well as most countries in Europe and Africa. The impact of patrol boats in predicting illegal fishing is weakest in South East and Eastern Asia. That is, regardless of the number of boats, illegal fishing may still remain a relatively serious
175 160 problem in the area, an important finding that will be discussed further in the policy implications section of the last chapter. D. Variation in Regional Impact of MCS Capacity Lastly, Map D above examines the relative impact of MCS capacity on the variation in illegal fishing. Note that MCS capacity was inversely related to illegal fishing. As is seen from the map, MCS capacity has strongest impact in North America and most countries in South America, relatively strong impact in Europe and Africa, and the weakest impact on South Eastern and East Asian countries. In other words, strong MCS capacity can explain lower levels of illegal fishing in North and part of South America, Europe and Africa much better than it can for South Eastern and East Asian countries.
176 161 Summary of Results The purpose of the current chapter was to examine the geographic relationships between the proposed variables in the current study by conducting both descriptive and quantitative spatial analyses. The most important results are summarized below: Descriptive spatial analysis results Almost every country and continent has a serious illegal fishing problem Only two countries, namely Australia and Namibia, have occasional illegal fishing within their territorial waters In South America, Ecuador, Peru and Argentina are among the most vulnerable countries, and the former two are neighboring countries A total of eight European countries have very high degrees of illegal fishing, and these don t seem to display any particular geographic clustering within the region South-East Asian countries are equally vulnerable to illegal fishing and seem to form a geographic hub Countries that have 33 or more highly commercial species are almost exclusively in South East and Eastern Asia Almost every country bordering or within Europe or Asia has access to at least one Port of convenience within a close geographic proximity The majority of African countries is close to at least one Port of convenience
177 162 At least one Port of convenience is available in South America, which may be the cause for problem for not only the countries in the region, but also Mexico in the north Hot- and cold-spot analysis results A total of 11 countries were identified as statistically significant hot spots for illegal fishing, all of which are either in South East or Eastern Asia The statistically significant cold spot for illegal fishing was Canada A total of 12 countries were identified as the statistically significant hold spots for the number of highly commercial species available within their territorial waters. Ten out of 12 are in South East and Eastern Asia, with the other countries being Canada and Australia The statistically significant cold spots for the number of highly commercial species were all in Europe and Africa The hot spots of Access to Ports of Convenience are almost exclusively in Europe, and only six out of 54 countries are statistically significant cold spots, as they have no access or are not adjacent to any countries that do have access to such ports Geographically Weighted Regression (GWR) analysis results The GWR model, which took into account the spatial aspects of the data, returned similar results pertaining to the overall predictive power of the model, thus confirming the results of the OLS model.
178 163 An examination of the impact of each predictor variable on explaining the dependent variable revealed that: o Availability of highly commercial species has most impact in Eastern Asia, a fairly strong impact in South East Asia and Europe, and weakest impact in South America, as well as United States and Mexico o Patrol boats have strongest impact in North and South Americas, a fairly strong impact in Europe and Africa, and weakest impact in South East Asia o Ports of Convenience have most impact in South and South East Asia, as well as most of Europe. Even countries, such as U.S. and Canada, that have no access to such ports, are relatively impacted, which may be explained by their relatively close proximity to Europe to the east; and East Asia to the west, where Ports of Convenience have strongest impact. Least affected are South American countries. o MCS capacity has the strongest impact in North and most of South America, relatively strong impact in Europe and Africa, and lowest impact in South East and Eastern Asia. This chapter provided a different, spatial dimension to understanding these relationships. This understanding was achieved by not only examining the relationships between the variables through exploratory means, but also by confirming certain
179 164 interpretations that arose from these descriptive analyses through conducting spatial statistical tests. More specifically, hot- and cold-spot analyses were performed to look further into the patterns that emerged from the descriptive analyses. The geographically weighted regression analysis was conducted to not only confirm the results of the OLS regression analysis conducted in chapter seven, but also to examine the relative impact of each predictor variable on the dependent variable by examining the spatial variations across the study area.
180 165 CHAPTER 11 DISCUSSIONS AND CONCLUSIONS Summary of Results The purpose of this dissertation was to examine situational factors expected to affect the decision to engage in illegal fishing activities internationally. While previous global research explained the phenomenon from a macro-level perspective, this research was aimed at highlighting micro-level, situational factors, thus adding a new dimension to the body of global research conducted on the topic prior. The major questions tested were whether one could identify factors that constrained and those that facilitated illegal fishing internationally. These questions were operationalized in terms of fisheries monitoring, control and surveillance capacity, formal surveillance capacity and presence of other fishing vessels as the main constraining factors; and the number of highly commercial species and Ports of Convenience as the main facilitating factors affecting the decision to engage in illegal fishing. To achieve this goal, eight hypotheses were proposed, six of which were based on examining these constraining factors, and two examined the facilitating factors. The eight hypotheses are outlined below, followed by a brief discussion of the findings of each hypothesis.
181 166 Hypotheses measuring constraining factors A. Formal Surveillance At-Sea H1. Countries with effective observer schemes are less likely to experience high levels of illegal fishing within their territorial waters. This hypothesis was supported. Having observer schemes, which represents one of the four elements of fisheries monitoring, control and surveillance effort (the strongest predictor), was significantly correlated with the degree of illegal fishing. In other words, the countries that had strong observer schemes in place were significantly less likely to experience high degrees of illegal fishing within their territorial waters than those that had insufficient or no such schemes in place. H2. Countries with effective vessel monitoring schemes are less likely to experience high levels of illegal fishing within their territorial waters. This hypothesis was supported. Similar to observer schemes, vessel monitoring schemes are one element of fisheries monitoring, control and surveillance effort. The findings suggest that having strong vessel monitoring schemes was inversely related to the degree of illegal fishing within a country territorial waters. H3. The number of countries patrol vessels per 100,000 sq km of EEZ is inversely related to illegal fishing within their territorial waters. This hypothesis was supported. Patrol surveillance as a measure of formal surveillance at sea was a significant predictor of the degree of illegal fishing. In other
182 167 words, countries that had more patrol vessels per 100,000 sq km experienced significantly lower degrees of illegal fishing than those that had fewer such vessels. B. Formal Surveillance and Control at Land H4. Countries with effective control of access are less likely to experience high levels of illegal fishing within their territorial waters. This hypothesis was supported. While observer schemes and vessel monitoring schemes, discussed above, represented formal surveillance at sea, the control of access measured in the current hypothesis is a measure of monitoring, control and surveillance at land. The findings of the current study suggest that control of access is inversely related to the degree of illegal fishing. More specifically, the more a country is effective in controlling access to illegal fishing, the less illegal fishing activities occur within its territorial waters. H5. Countries with effective catch inspection schemes are less likely to experience high levels of illegal fishing within their territorial waters. This hypothesis was also supported. Having catch inspection schemes, measured in terms of inspection of vessels landings at port, can significantly predict the degree of illegal fishing within the countries territorial waters. In other words, countries that had sound inspection schemes in place were less likely to experience high degrees of illegal fishing activities within their exclusive economic zones than those that lacked such schemes or where catch inspection schemes were found to be insufficient.
183 168 C. Informal Surveillance at Sea H6. Countries with a high number of detectable fishing vessels are less likely to experience high levels of illegal fishing within their territorial waters. This hypothesis was not supported. Contrary to expectation, informal surveillance, measured by the presence of detectable fishing vessels, was not a significant deterrent of illegal fishing. Although the results were in the expected direction (i.e. more detectable fishing vessels, less illegal fishing activity), these results, nevertheless, did not reach statistical significance. Hypotheses measuring facilitating factors H7. The availability of Ports of Convenience within a close geographic proximity (1500nm) affects the level of illegal fishing within countries territorial waters. This hypothesis was supported. Countries that had access to at least one such port were significantly more vulnerable to illegal fishing that those that didn t. Access to a port of convenience, therefore, is an important factor in the decision to engage in such activities. In the regression model, access to Ports of Convenience was the third most important variable explaining the variance in illegal fishing. H8. The number of species found within the countries EEZs that are highly commercial internationally is positively correlated with the level of illegal fishing activities within countries territorial waters.
184 169 This hypothesis was also supported. Countries that had more such species to offer were significantly more vulnerable to high degrees of illegal fishing activities within their waters than those that had fewer such species. The presence of highly commercial species was the second strongest predictor of illegal fishing activities. This study used a combination of eight variables to measure constraining and facilitating factors and their effect on the decision to engage in illegal fishing. These variables were all considered simultaneously, each controlling for the other in the regression model. When the effects of other variables were accounted for, all facilitating factors were able to significantly predict the degree of illegal fishing, while all but one constraining factor had similar effect. Among the strongest predictors were monitoring, control and surveillance effort, followed by the presence of highly commercial species, as well as access to a port of convenience. Patrol boats, although significant, had the weakest predictive power when all other variables were considered. The variable that did not achieve statistical significance was the one measuring informal surveillance. Additionally, when separating the different effects of the significant predictor variables, it became evident that monitoring, control and surveillance measures had the strongest impact on North and most of South America, and the weakest in South East and Eastern Asia. In other words, while this measure could significantly predict the degree of illegal fishing, its effect varied across geographic regions when each study area was examined separately. Similar patterns were observed when the presence of patrol boats was examined. Meanwhile, the presence of highly commercial species had the strongest impact in Eastern Asia, and weakest in South America, as well as some of North
185 170 America. That is, there were geographic variations when observing the effect of the presence of highly commercial species on each of the countries under study, and having such species made the countries in Eastern Asia most vulnerable to illegal fishing. Lastly, access to Ports of Convenience had strongest impact in South and South East Asia, and weakest impact in South America, although some of the countries in South America also had access to at least one such port. Discussion of Findings The impact of formal surveillance and control The findings of the current research are consistent with prior studies that have attempted to examine the effect of patrol surveillance, as well as countries fisheries management practices in reducing illegal fishing. While the issue was previously examined and similar findings reported, most of these studies were either regional or country-specific. Moreover, prior research measured fisheries monitoring, control and surveillance (MCS) differently, without separating its four distinct components, which was attempted in the current study. This study looked at the effect of formal surveillance, as well as each of the components of monitoring, control and surveillance by examining their impact globally. Additionally, this study attempted to separate these surveillance measures into different components: those undertaken at sea and those implemented at land, thus allowing for a more detailed scrutiny. The findings of this study indicate that countries with weak formal surveillance and inability or lack of fisheries management resources are largely the same countries that have significant illegal fishing problems. The spatial analyses conducted in the
186 171 current study add further detail to these findings by highlighting the importance of these coefficients when each country is considered separately. While MCS capacity and presence of a strong formal surveillance were each significant predictors of illegal fishing, they, nevertheless, played a slightly greater role in North and South America. In other words, the countries in these regions are able to curb the illegal fishing problem within their waters due to the sound fisheries management efforts that are in place, as well as the presence of patrol surveillance. The same cannot be said about the majority of the countries in the South, South East and Eastern Asia. While still a significant predictor of illegal fishing, MCS and formal surveillance capacity played a lesser role in South, South East and Eastern Asia regions. There are several possible explanations pertaining to the latter finding. First, the majority of the countries in these regions are also the countries that are unwilling to do much about the illegal fishing problem within their waters due to the importance of the fishing industry in their countries. Most of these countries, as discussed earlier in country-specific research studies, are also the countries that depend heavily on marine resources for food (Clarke, 2007; Varkey, et al, 2010). Second, despite the efforts to reduce the illegal fishing problem within these countries, the problem may remain due to the importance of these countries as major suppliers of fish products to the global markets. This global demand for fish deriving from their fisheries may overshadow the necessity to invest in more fisheries management and other surveillance resources. Third, prior research has shown how poor governance and corruption contributed to the illegal fishing problem within these countries. Consequently, MCS capacity or patrol surveillance may be less effective in these countries due to their inherently corrupt nature coupled with the inability to govern their
187 172 resources properly. This could be the very reason why no real effort has been made in these countries to invest in these preventive measures in the first place. The impact of resource abundance Resource abundance as a major attractor of illegal fishing has been studied regionally and locally before. For example, the World Wildlife Fund (2008) research examining the extent of illegal fishing in Arctic Waters found that the problem is massive (p. 25) due to the abundance of primary fish species in these waters, such as cod. Similarly, this research showed that the number of highly commercial species attracts illegal fishing within the countries territorial waters. This is so because these species can easily be traded, therefore disposed of, not only in local markets, but also in any international market. Consequently, these species can draw illegal fishing activities conducted by not only local fishing vessels, but also international fishing vessels that aim at taking the illegally harvested fish into the global markets. To further examine this assumption, the impact of the coefficient number of highly commercial species is examined spatially, and a distinct pattern emerges: the presence and abundance of these species has far stronger impact on predicting illegal fishing than the MCS capacity or patrol surveillance capacity within Eastern and South- East Asian countries. Again, as a major supplier to the global markets, the Eastern and South East Asian countries are among the most vulnerable to illegal fishing primarily due to the wealth of marine resources they possess and the unwillingness or inability to properly manage these resources.
188 173 The impact of ports of convenience While prior research has continuously highlighted the importance of Ports of Convenience as gateways for illegal vessels to smuggle the fish, no research prior to this study has empirically tested that conviction. Many ports have been continuously implicated as being heavily used by the illegal fishing vessel operators or illegal reefers, such as, for example, Las Palmas de Gran Canaria in Canary Islands (EJF, 2007). However, to test the generalizability of such convictions, an empirical methodology was necessary, and this was attempted in this research. The global examination of the presence of Ports of Convenience and their impact on the degree of illegal fishing within countries in close proximity, therefore, provides new insight to understanding the decision-making process of the illegal fishing vessel operators. The study findings confirmed that the availability and reasonable proximity of Ports of Convenience presented a significant problem to the countries examined: those that had access to at least one such port had significantly higher degrees of illegal fishing than those that had no such access. In fact, Ports of Convenience presented a significant problem to countries in the Southern and South East Asia regions, when the results of spatial analyses were examined, a finding that complements the assumptions made earlier: the countries with rich marine resources, poor fisheries governance and weak formal surveillance capacity that are close to at least one Port of convenience do, indeed, have significantly higher degrees of illegal fishing than those that lack these characteristics. Being able to fish for the resource sought, as well as getting it into the markets proved vital, and, these ports provide ideal settings for the illegal vessels to carry out their operations. Obviously, the presence of Ports of Convenience may not be that important
189 174 for local fishers, who aim at bringing the fish back into the country where they are harvested. In the latter case, poor fisheries management capacity is the key to carrying out their illegal operations. Ports of Convenience become important as facilitators of illegal fishing when the fishers aim at international markets. The impact of informal surveillance It may not be completely surprising not to find a correlation between the presence of informal surveillance (in the form of the presence of other fishing vessels) and illegal fishing activities within the countries exclusive economic zones. The size of the exclusive economic zones of the majority of these countries is vast, and to expect a legitimately fishing vessel to see what other fishing vessel is engaged in may be possible only if both fish within a visible range. Moreover, legally fishing vessels may have little incentive to report the presence of illegally fishing vessels, even if they are competing for the same resource. As long as the resource they are seeking is abundant and easily disposable, little consideration may be given to who else is harvesting that resource.
190 175 Theory Implications The assumptions of the current research were based on two criminological theories, namely the rational choice theory and situational crime prevention. It was expected that these theories would be helpful in understanding global illegal fishing patterns. The rational choice perspective posits that a motivated offender will consider the risks, efforts and rewards and decide upon this calculus to engage in criminal acts accordingly (Cornish and Clarke, 1986). Consequently, it was expected that the increased presence of patrol surveillance, as well as the strong monitoring, control and surveillance capacity of the fisheries management organizations within these countries will serve as important deterrents for illegal fishing vessel operators. For example, the presence of observers on board fishing vessels who keep logs of fish caught, will increase the risk of being caught or make it harder for vessel owners to engage in illegal fishing, as these observers closely monitor their activities and ensure that these vessels do not catch above the allowable quota, neither do they engage in the catch of the species that they are not authorized to have. Vessel monitoring systems, in turn, expose these vessels to the control centers, which carefully monitor their movements across the waters, thus noticing any violations in time to act. Catch inspection schemes at ports significantly increase the risk of being caught with the illegally harvested fish. A combination of these MCS measures, therefore, raises the potential offenders perception of risk of being caught, as well as increases risk and reduces reward. Reducing the presence of Ports of Convenience will mean increasing the efforts the potential offenders will have to make to get their illegally caught fish on land, as they would need to look for new locations or travel
191 176 longer distances, which may not be desirable or completely possible. This will also mean diminishing opportunities for the illegal fishing vessel operators to get their illegally harvested fish into the markets on time. The findings of the current research support the application of the rational choice theory in understanding the decision to engage in illegal fishing. All of the measures discussed above, were, indeed significant predictors of where illegal fishing operations would be more likely to occur: areas where there was little risk, minimal effort and extensive reward were among the most vulnerable to illegal fishing. This was particularly true for countries in South, South East and Eastern Asia, where risk and effort elements were among the weakest, and the reward was substantial. Derived from the principles of rational choice theory, the 25 techniques of situational crime prevention focus on specifically these elements. Designed around increasing risk, increasing effort, reducing reward (as well as removing excuses and reducing provocations), the situational crime prevention strategies propose useful understandings of how offenders act spatially. The decision to engage in illegal fishing would, accordingly, depend not only on the availability of the resources sought, but also the availability of easy exits that are not screened, and weak surveillance or lack, thereof. In fact, some techniques of situational crime prevention are already in use by the countries in the form of monitoring, control and surveillance measures discussed in the current research. Examples of these include: mandating fishing licenses and vessel monitoring systems, i.e. controlling access to facilities ; inspecting catch at ports, i.e. screening exits ; requiring vessel registrations, i.e. reducing anonymity ; and utilizing observers onboard fishing vessels, i.e. strengthening formal surveillance. It is worth
192 177 noting, that these monitoring, control and surveillance measures that are, in fact, situational, were the strongest predictors of illegal fishing. The theoretical guidance from both rational choice and situational crime prevention theories proved important in understanding the decision to engage in illegal fishing. Implications, therefore, lie within applying the principles of these theories to explain crimes that are global in nature from a micro-level perspective. Implications for Policy The current research findings attest to the importance of applying situational solutions when proposing global or local measures to address the problem of illegal fishing. To achieve successful reductions in illegal fishing activities, the proposed considerations in this section may prove useful. Increase the risk: Improve fisheries management and formal surveillance capacity One of the important sections in the current dissertation was chapter seven, which laid out the best and worst performing countries in terms of their MCS effort. The fisheries management practices of the countries that have performed the best can be replicated by other countries that are less effective in controlling illegal fishing within their territorial waters. For example, Norway has performed the best for its effort on observer schemes and catch inspection schemes. When examining Norway s catch inspection practices, the researcher learned that the country performs physical inspection of catches not only when they are landed at port, but catch inspection is also carried out at
193 178 sea by the coast guard. Further, these inspections are performed for checking not only the species caught, but also that the correct gear were used, the vessels were on the right fishing grounds, and that the fish were not dumped (Skaret & Pitcher, 2006). Namibia s success in achieving the best score for controlling access to stop illegal fishing rests in its ability to control not only landing of illegally caught fish by using its ports, but also not allowing their ports to be used for any transshipments of illegally caught fish (Pramod & Pitcher, 2006). Moreover, Namibia is one of the very few countries in the world, along with Australia, Canada and Chile, that has one of the highest penalties for illegal fishing, (Pramod & Pitcher, 2006), thus significantly discouraging the activity within its waters. Iceland s success in earning the best score on vessel monitoring schemes lies in its use of the TrackWell vessel monitoring system, which is an application used by the country s monitoring centers to control the fishing operations at sea. The program provides real-time graphical updates of vessel locations on a computerized map, handles catch and activity reports and gives easy access to information on each vessel (Varkey & Pitcher, 2006: 21). These best measures fall fairly well within the theoretical frameworks of rational choice theory and situational crime prevention, the theories that present a unique approach to addressing the problem of illegal fishing, and, therefore, should serve as exemplary measures and be replicated by other countries. Increase the effort: Enhance international cooperation to address the problem of ports of convenience The 25 techniques of situational crime prevention provide a useful point of reference and can be employed in devising practical response strategies on both the
194 179 national and international levels. Among these, several are particularly relevant and applicable to addressing the problem of illegal fishing. For example, this research has shown that Ports of Convenience are especially important facilitators of illegal fishing. The 10 Ports of Convenience examined in the current research accounted for 37% of all the port visits by detectable IUU blacklisted vessels during the study period. Therefore screening the exits, i.e. the ports of the countries that have significant fishing within their waters should be employed more rigorously to achieve success in reducing illegal fishing activity within their territorial waters. Most importantly, the international community should raise awareness and encourage the countries that are not necessarily fishing countries but, nevertheless, have Ports of Convenience (e.g. Singapore), to strengthen their port controls. These can be achieved by providing resources and incentives to these countries to improve their control measures in these identified ports. In fact, this technique may prove most important, as these ports are vital for transporting the illegally-caught fish to the target international markets. Reduce the reward: Safeguard the highly commercial species While many species may be threatened due to illegal fishing, only few species are significantly affected by it, as demonstrated by the current study. Strengthening regulations, international trade controls on these hot products, as well as devising wellplanned and focused enforcement measures, will prove vital in achieving global reductions in illegal fishing activities. If CITES or other international and regional organizations focus on closely monitoring the international trade in the species identified
195 180 in the current research, success in achieving global reductions in illegal fishing activities will be inevitable. Unlike prior research, which focused on the species that are prohibited from being caught due to their threatened status, this research shed light on species that are, indeed, widely available and marketed. The threatened fishes are monitored most closely (such as bluefin tuna), and, coupled with trade bans and regulatory mechanisms available to safeguard these species, they may not be the primary targets for illegal fishing. That is, illegal fishing of these species may be far less than that of the highly commercial species merely due to the effort that must be made to get to these species, and due to their scarcity. Meanwhile, highly commercial species are far more abundant, accessible and easily disposable, therefore, fishing vessel owners would profit more from the international trade of these commercial species in the long run. Prioritize response strategies based on your geographic location The findings from the geographic analyses proved especially useful in understanding which effort is most important given the geographic location of a country. For example, monitoring, control and surveillance measures, while having the strongest effect on illegal fishing, varied regionally, and had strongest impact in North and South Americas, while was weakest in South East and Eastern Asia. As such, strengthening these measures in the former would prove more effective than attempting to make other changes, such as spending more resources on safeguarding the highly commercial species found within their territorial waters (where the latter had weakest impact). Meanwhile, safeguarding the highly commercial species needs to be a priority for countries on the
196 181 South East and Eastern Asia, as it was the availability of these species within their territorial waters that made these countries especially vulnerable to illegal fishing. Additionally, efforts in blocking access to Ports of Convenience should be much more rigorous in South and South East Asia, than, for example, in South America, where, in fact, while such port exists, as in the latter, Access to Ports of Convenience had the weakest impact on the overall degree of illegal fishing in the region. Considerations on Displacement and Diffusion of Benefits While it was found that strengthening surveillance capacity, focusing on highly commercial species, as well as addressing the problem of Ports of Convenience will result in significant reductions of illegal fishing activities, one may argue that offenders will resort to spatial displacement by carrying out their illegal operations in other countries territorial waters or smuggling the illegally harvested fish through other ports. Moreover, highly commercial species may be replaced by those that, while not highly commercial, are nevertheless commercial fishes and can also be traded in both local and international markets. The 54 countries that were examined in the current study together comprise 96% of the world fish production, and to say that moving to nearby countries would be equally beneficial may not necessarily be true. Illegal fishing vessels operate in these 54 countries specifically because they are major global suppliers of fish, and, therefore, it is highly unlikely that these vessel operators would move their operations elsewhere if they are unable to carry out their illegal operation within the country that has the resource. These
197 182 areas possess the features (such as lack of MCS capacity, resources sought) that facilitate illegal fishing within their waters, and it is due to these characteristics that illegal fishing activities occur where they do. Neither is it viable to say that imposing strong controls on known Ports of Convenience would lead to the emergence of new Ports of Convenience. There is a reason why these ports are where they are, and one country s decision to start closely monitoring a weak port will not affect another country s decision to become more lax on their port control policies. Lastly, while there are many more commercial fishes that can replace these highly commercial ones, it may not necessarily happen for two reasons. Firstly, these highly commercial species are the hot products and can be easily sold in any markets they are taken. With the lack of that quality, it may not be possible to easily dispose of fishes that are not highly sought after in international markets. Secondly, species are caught with a distinct set of gear, technology and vessels, and to say that one would move to another species would mean that these illegal fishing vessel operators are willing to make major changes to the vessels they own and invest in a new set of gear and technology, an adaptation that may not necessarily be cost-effective. In fact, increasing MCS capacity, patrol surveillance capacity, controls over highly commercial species, as well as monitoring of known weak ports may result in diffusion of benefits. Improved MCS will result in the reduction of illegal fishing of not only the highly sought-after fish, but also other commercial fishes that may be targeted by illegal fishing vessel operators. Increased patrol surveillance is likely to result in the reduction of other maritime crimes. For example, instances of human trafficking and
198 183 migrant smuggling by using fishing vessels are widespread across the globe. These have been well-recorded by a study conducted by the United Nations Office on Drugs and Crime (2011) which found that while fishers may not be directly engaged in organized trafficking or smuggling activities, they are known to accept bribes to bring migrants from developing countries to Europe and the United States. The same study found that the use of fishing vessels in the illicit traffic in drugs (such as cocaine, heroin, cannabis, and amphetamine-type stimulants) is also widespread. During a three-year period, from , a total of 52.3 tons of cocaine were seized from vessels, of which 44.5% were seized from fishing vessels (UNODC, 2011). Consequently, increasing patrol surveillance will not only deter the fishing vessel operators from engaging in illegal fishing activities, but it will also discourage them from engaging in other illegal activities, such as the ones discussed above. Lastly, strengthening port controls and security will have beneficial impacts on reducing the smuggling of illegal products transported via sea. Study Limitations and Suggestions for Future Research While the findings of the current research provide valuable explanations pertaining to the decision to engage in illegal fishing, some important limitations still remain. This limitations are discussed below. This study was confined to 54 countries, as many of the variables examined here were impossible to obtain for other countries. This small sample size precluded the examination of the effects of the independent variables examined in the current research
199 184 while simultaneously controlling for the effects of the macro-level variables previously identified in other research studies. Particularly relevant to the formal surveillance effort and MCS capacity were the macro-level predictors that included governance capacity, degree of corruption and rule of law, all found to be significantly predicting IUU fishing in prior studies. Without measuring these predictors, concerns remain about the possible impact of these formal surveillance measures on the overall degree of illegal fishing within the countries exclusive economic zones. This study was also not able to control for other factors that may affect the fishing decision, as identified by prior research. Ethnographic studies that looked at modeling fishing decisions identified many factors that affected the fishers decisions pertaining to all fishing decisions, regardless it is made by legal or illegal fishing vessel operators. Among these are the consideration of uncertainty and risk aversion (Holland and Sutinen, 2000; Holland, 2008); the mitigation of loss and target income (Holland, 2008); familiarity with fishing locations (Bockstael and Opaluch, 1983; Holland and Sutinen, 2000); and the knowledge of currents, the behavior of fish and their breeding and feeding patterns (Durrenberger and Palsson, 1986). An examination of such factors would necessitate a more in-depth ethnographic analysis, which is an impractical task given the scope of the current research. Closely related to the factors discussed above are those pertaining to the identity of individuals making such decisions. If fishing vessels are owned and operated by fishers, the decisions pertaining to their operations, whether legal or illegal, are made by these fishers. Fishing vessels may also be owned by an organization that employs fishers to carry out the harvesting of fish. In that case, the decision to engage in illegal fishing
200 185 may be that of the owner, rather than the fishers who work for the individual or organization. Lastly, the vessels may be operated by captains who are not the direct owners of the vessel, but who are nevertheless in the position to make fish harvesting decisions on behalf of the owners. It is unclear to what extent the decision to engage in illegal fishing can be attributed to these captains. Such detailed information may be possible to obtain through conducting an ethnographic study where the role of each of these actors is explored in more depth. Research has shown that illegal fishing may be conducted both by foreign vessels within a country s EEZ and by the vessels originating in the country. One important limitation of this study is its inability to explain this variation. This is due to the fact that there is no reliable vessel-specific database in any country, neither is there a breakdown of the percentages of illegal fishing activities conducted within a country by foreign or local vessels 21. Future research should look into obtaining such information in order to be able to understand the problem in more detail. Closely related to this limitation is the inability to specify the exact locations and numbers of vessels fishing illegally within the territorial waters of these countries. This was mainly due to the difficulty of obtaining such data internationally from a single reliable source. Resources allowed, gathering more vessel-specific information would not only help to identify the specific locations and degree of illegal fishing activity within countries exclusive economic zones, but it would also allow for further analyses, such as examining the global patterns of illegal fishing activity, and identifying the countries most likely to be engaged in illegal fishing 21 Several European Union Countries have reported vessel-specific information on the illegal fishing activities in the Reports to the Commission of the European Communities prepared for the years 2000 through However, this information is limited to several categories, which include infringements by national, third party and EU countries, and don t provide further detail.
201 186 activities either within their or foreign EEZs. A study that would make a distinction between illegal fishing activities conducted by large commercial and small-scale fishing vessels would also shed light on the different aspects of the problem. Although this research identified the significance of the role of highly commercial fishes in affecting an offender s decision to engage in illegal fishing, it nevertheless did not provide any guidance as to which species specifically may have that impact. Given the design of the current study, more variables, although desirable, could not be added to the multivariate models. Future research could, therefore, focus on looking specifically at conducting species-specific analyses to both confirm the findings of the current study, and provide further detail on the issue. Other limitations pertain to the measurement of a variable examined in the current study. Derived from one of the techniques of situational crime prevention, increase the effort was measured by looking at the distance of the target fishing grounds from a port of convenience. This distance was conceptualized as being within a close geographic proximity if such port was found within 1500 nautical miles. Although informed by calculations that take into account the average speed of the fishing vessels and days it would take to travel this distance, some may critique that such cut-off point is arbitrary. Even so, this research provides valuable information, as it identifies this very cut-off point at which the presence of Ports of Convenience becomes a significant factor in the decision to engage in illegal fishing. It is important to also note that the calculation of the presence of detectable fishing vessels involved only those vessels classified as Class A, which are vessels that can operate both within and beyond 200 nautical miles seaward of the coast. This
202 187 research lacks information about Class B fishing vessels that can only operate within 200 nautical miles off the coast, and that are also required to carry vessel monitoring systems, neither does it calculate the number of small-scale vessels or artisanal vessels present within the territorial waters of these countries. The latter are impossible to measure, as, to date, no database exists that tracks the locations or operations of such vessels. But it should also be noted that these vessels are limited in range, and it is highly unlikely that they would appear within the same range as large commercial vessels that are capable of traveling farther distances. More so, these vessels lack the technology to report the infringements, even if they witnessed any. To address the problem of the lack of data on Class B vessels, live marine traffic data were examined through a site that provides live marine traffic data on all vessel types. An examination of the archives of this site revealed that, at any given time, more than 84% of all vessels within the range are Class A, and the other major type of vessels, Class B vessels, comprises only between 10-13%. Further, of all the active marine traffic, only about 7% are fishing vessels. For example, on March 7, 2012, a randomly selected date, a total of 39,857 vessels were in range, of which only 3081 were fishing vessels. The overall statistics for that date indicated that only 13.37% were Class B vessels, while 84.86% of the vessels were classified as Class A. Assuming that 13.37% of the 3081 fishing vessels (i.e. about vessels) were Class B, then this research is only underestimating the presence of other detectable fishing vessels by a very small amount. Consequently, the inability to account for Class B vessels does not significantly underestimate the presence of detectable fishing vessels within the countries EEZs.
203 188 Lastly, this research examined the factors contributing to illegal fishing activities in 54 countries that together account for the 96% of the world fish exports. Given the unique characteristics of countries across the globe, of which 150 are coastal, it is unclear whether the findings from these 54 countries can be equally applied to other locations. The countries that have not been examined may be less desirable simply because they don t possess the same characteristics as the countries examined, such as target resources or the role in the global fish markets. As such, these countries vulnerabilities to illegal fishing may be different from what has been identified in the current research, and, consequently, caution must be taken when generalizing the findings from the current study to other locations. Therefore, some of the conclusions derived from this study are, in a sense, limited to these 54 countries. Concluding Remarks Despite the growing international awareness pertaining to the problem of illegal fishing, the issue has received little attention from criminologists. Many academic journals on marine science, conservation, and the protection of the environment have continuously published on the topic, exploring its different aspects; however, criminologists are yet to study the problem. Among the primary purposes of the current study was the testing of the applicability of the principles of environmental criminology, more specifically, rational choice and situational crime prevention theories, in understanding the phenomenon. This study showed that these criminological theories are, indeed, useful in understanding
204 189 illegal fishing behavior. As such, this study lent support to the few studies conducted by criminologists who sought to explain the utility of applying situational crime prevention techniques in understanding wildlife crimes (Lemieux and Clarke, 2009; Pires and Clarke, 2011a; Pires and Clarke, 2011b). Consequently, future studies should make a more extensive use of these criminological theories when examining similar problems, and criminologists should be encouraged to take the initiative to do so. Second, this study was the first to analyze the illegal fishing problem carried out globally by using a situational approach. The review of studies conducted on the regional- and country-levels revealed many important situational factors that played a role in the decision to engage in illegal fishing. This study was able to pull together the knowledge obtained from these regional and local studies, and examine these factors globally. As such, it emphasized the importance and applicability of focusing on microlevel measures when examining the correlates of illegal fishing globally. These findings are important in developing international policies, as well as policies devised and implemented by local governments. Given the implications of the findings of the current research, small situational changes are likely to lead to significant global impact. Any global research is likely to encounter the difficulties discussed in this study. Most of these limitations pertain to the necessity to gather more detailed information about the patterns of illegal fishing, which is currently not available. One such useful information could be the creation of a global database on all illegal fishing arrests, their locations, vessel types, target fish and identity of the owners. As more information becomes available, it should serve as a source for further academic inquiry.
205 190 BIBLIOGRAPHY Agnew, D.J, Pearce, J., Pramod, G., Peatman, T., Watson, R, Beddington, J.R. and Pitcher, T. J. (2009). Estimating the worldwide extent of illegal fishing. PLoS ONE 4(2): e4570. Doi: /journal.pone Alverson D L, Freeberg M K, Murawski S A and Pope J G. (1994) A global assessment of fisheries bycatch and discards. FAO Fisheries Technical Paper No 339 Rome, FAO. Anon (2002). Assessment report on fisheries and fisheries related species and habitat issues. North Sea Conference, 2002, Bergen, Norway. Anon. (2001). Significant trade review of 10 species of Acipenseriformes. Sixteenth meeting of the CITES Animals Committee, December 2000, Shepherdstown, USA. APO, Asian Productivity Organization (1988). Fishing industry in Asia and Pacific. Medical International Limited. Hong Kong, China. Asada, Y., Hirasawa, Y & Nagasaki, F. (1983). Fisheries management in Japan. FAO Fisheries Technical Paper 238. FAO, Rome. Asia-Pacific Economic Cooperation (2008a). Case study on illegal, unreported and unregulated fishing off the East Coast of Peninsular Malaysia. Final Report submitted by Sea Resources Management Sdn Bhd. APEC Publication Number: APEC#208-FS Asia-Pacific Economic Cooperation (2008b). Assessment of impacts of illegal, unreported and unregulated fishing in the Asia-Pacific. Asia-Pacific Economic Cooperation Fisheries Working Group. Bean C. (1990) An economic analysis of compliance and enforcement in the Quahaug fishery of Narragansett Bay. Unpublished Master s Thesis, University of Rhode Island. Beckett, J.S. (1998). World marine fisheries : Fifty years of change. Journal of Northwestern Atlantic Fisheries Science, 23, pp Bochstael, N. & Opaluch, J. (1983). Discrete modeling of supply response under uncertainty: The case of the fishery. Journal of Environmental Economics and Management, 10(2), pp Borsky, S. & Raschky, P.A. (2011). A spatial econometric analysis of compliance with an international environmental agreement on open access resources. Monash University. Available at
206 191 Boto, I., La Peccerella, C., Scalco, S., Tsamenyi, M. (2009). A reader: Resources in illegal, unreported and unregulated fishing. Brussels Rural Development Briefings. Briefing session No. 10-Fighting against illegal, unreported and unregulated (IUU) fishing: Impacts and challenges for ACP countries. Brussels. Brandt, A.V. (1972). Fish catching methods of the world. Revised and enlarged. Fishing news (books) Ltd. London. Brian, R. (1985). Recent developments in Australian fishing industry. In B.C. Clevelmand (Ed.). Adjustments to changes in fisheries law and economics. FAO Fisheries Technical Paper 269. Suppl. FAO, Rome, pp Brothers, N.P. (1991). Albatross mortality and associated bait loss in the Japanese longline fishery in the southern ocean. Biological Conservation, 55, pp Bryant, D., L. Burke, J. McManus, and M. Spalding Reefs at Risk: A Map-based Indicator of Threats to the World s Coral Reefs. World Resources Institute. 56 pp. Cacaud, P., Kuruc, M. and Spreij, M. (2003). Administrative sanctions in fisheries law. Food and Agriculture Organization of the United Nations, Legislative Study No. 82. Caldwell. R. & Fox, H. (2006). Recovery from blast fishing on coral reefs: A tale of two scales. Ecological Applications, 16(5), pp Catarci, C. (2004). World markets and industry of selected commercially-exploited aquatic species with an international conservation profile. FAO Fisheries Circular No. C990. Chidambaram, K. (1963). Development of mechanized fishing fleets in the Indo-Pacific council region. In L.B. Nui and J-O. Jan-Old Trrmg (Eds), Indo-Pacific fisheries council proceedings. Section II, Symposium Papers. IPFC Secretariat, FAO regional office for Asia and the Far East, Bangkok, pp Clarke, R.V. (1980). Situational crime prevention: Theory and practice. British Journal of Criminology, 20 (2), pp Clarke, R.V. (1983). Situational crime prevention: Its theoretical basis and practical scope. Crime and Justice, 4, pp Clarke, R.V. (1997). Introduction. In Clarke, R.V. (Ed). Situational crime prevention: Successful case studies (2 nd Ed), pp Albany, NY: Harrow and Heston Publisher. Clarke, R.V. & Cornish, D.B. (2001). Rational choice. In Raymond Paternoster and Ronet Bachman (Eds), Explaining criminals and crime. Roxbury, Los Angeles. Clarke, S. (2007). Illegal fishing in the Exclusive Economic Zone of Japan. Marine MRAG, Ltd. London, UK.
207 192 Clarke, S. C., McAllister, M.K., Milner-Gulland, E.J., Kirwood, G.P., Michielsens, C.G.J., Agnew, D.J., Pikitch, E.K., Nakano, H., & Shivji, M.S. (2006). Global estimates of shark catches using trade records from commercial markets. Ecology Letters, 9 (10), pp: Clarke, R.V. & Eck, J. (2003). Crime analysis for problem solvers in 60 small steps. Center for Problem Oriented Policing. U.S. Department of Justice, Office of Community Oriented Policing Services. Available at Clarke, R.V. & Cornish, D. B. (2001). Rational choice. In R. Paternoster & R. Bachman (Eds). Explaining criminals and crime: Essays in contemporary criminological theory, pp Los Angeles: Roxbury. Charlton, M. & Fotheringham, A.S. (n.d.). Geographically Weighted Regression: A tutorial on using GWR in ArcGIS 9.3.National Centre for Geocomputation. National University of Ireland, Maynooth, County Kildare, Ireland. Available at: Charlton, M., Fotheringham, S. & Brunsdon, C. (2006). Geographically weighted regression. ESRC National Centre for Research Methods. NCRM Methods Review Papers, NCRM/006. Available at: aqmen.ac.uk/sites/default/files/focusgwr.pdf Chuenpagdee, R., Liguori, L, Palomares, M.L.D. & Pauly, D. (2006). Bottom-up, global estimates of small-scale marine fisheries catches. Fisheries Centre Research Reports, 14(8). Available at University of British Columbia, Fisheries Centre, Chuenpagdee, R., Morgan, L.E., Maxwell, S.M., Norse, E.A. and Pauly, D. (2003). Shifting gears: Assessing collateral impacts of fishing methods in the U.S. waters. Frontiers in Ecology and the Environment, 10(1), pp COFI (Committee On Fisheries, FAO) (2007) Progress in the implementation of the 1995 Code of Conduct for Responsible Fisheries, related International Plans of Action and strategy. Twenty-seventh Session Rome, Italy, 5-9 March COFI/2007/2. 13pp. Cohen, J. (1988). Statistical power and analysis for the behavioral sciences. 2 nd Edition. Hillsdale, NJ: Lawrence Erlbaum Associates. Cornish, D.B. & Clarke, R.V. (1986). Reasoning criminal: Rational choice perspectives on offending. Springer-Verlag, USA. Cullis-Suzuki, S. & Pauly, D. (2010). Failing the high seas: A global evaluation of regional fisheries management organizations. Marine Policy, 34, p Cushing, D.H. (1988). The provident ocean. Cambridge University Press. London.
208 193 Department of Agriculture, Fisheries and Forestry, Australian Government (2005). Effective export controls for illegally harvested abalone. Discussion Paper, Mach Available at Department of Commerce, NOAA Tech. Memo. NMFS-F/SPO-64, DFID (2007). Programme of support to tackling IUU fishing in Southern Africa. Programme Brief and Update, No. 1. The Department for International Development of the UK. DFID (2008). The impact of flags and ports of non compliance in the SADC region. Programme studies. Project No. 8. The Department for International Development of the UK. Doulman, D. (2001). A general overview of some aspects of illegal, unreported and unregulated fishing. FAO Fisheries Report, No Rome. Durrenberger, E.P. & Palsson, G. (1986). Finding fish: The tactics of Icelandic Skippers. American Ethnologist, 13(2), pp EFTEC (2008). Costs of illegal, unreported and unregulated fishing in EU fisheries. Economics for Environment Consultancy, Ltd. London, UK. Eiden, G. & Goldsmith, R. (2010). Performance of AIS sensors in space PASTA- MARE project final report executive summary. European Commission. EJF (2005). Pirates and profiteers: How pirate fishing fleets are robbing people and oceans. Environmental Justice Foundation, London, UK. EJF (2007). Pirate fish on your plate-tracking illegally-caught fish from West Africa into the European market. Environmental Justice Foundation, London, UK. EJF (2009). Lowering the flag Ending the use of Flags of Convenience by pirate fishing vessels. Environmental Justice Foundation. London, UK. EJF (2010). All at sea- the abuse of human rights aboard illegal fishing vessels. Environmental Justice Foundation, London, UK. Erceg, D. (2006). Deterring IUU fishing through state control of the nationals. Marine Policy, 30, pp ESRI (2010). Regression analysis basics in ArcGIS 9.3 Transcript. Available at training.esri.com/.../ts_reganalysis93/ts_reganalysis93slides1.pdf Eyiwunmi Falaye, A. (2008). Illegal, unreported, unregulated (IUU) fishing in West Africa (Nigeria & Ghana). Report of a Study prepared for Marine Resources Assessment Group, Ltd., United Kingdom. European Commission (2010). Combating illegal, unreported and unregulated fishing: Handbook on the practical application of council regulation (EC) No 1005/2008 of 29 September 2008 establishing a Community system to prevent, deter and
209 194 eliminate illegal, unreported and unregulated fishing (The IUU Regulation). Directorate-General for Maritime Affairs and Fisheries. European Communities (2009). Reform of the Common Fisheries Policy. Green Paper. Luxembourg: Office for Official Publications of the European Communities. Fabra, A., Gascon, V. and Werner, R. (X). The use of port state measures to improve fisheries compliance: Issues and instruments. Available at: Falaye, A. (2008) Illegal unreported unregulated (IUU) fishing in West Africa (Nigeria & Ghana). London: MRAG, Available: FAO (Food and Agriculture Organization of the United Nations) (n.d.) Fisheries Section: Glossary. Fishing industry. Available at: FAO (Food and Agriculture Organization of the United Nations) (2010). FAO Fisheries and Aquaculture Report No United Nations. FIRF/R932 (En). FAO (Food and Agriculture Organization of the United Nations) (2009). FAO Yearbook. Fisheries and Aquaculture Statistics. United Nations. FAO (Food and Agriculture Organization of the United Nations) (2007). FAO workshop on vulnerable ecosystems and destructive fishing in deep-sea fisheries. FAO Report No Rome, Italy. FAO (Food and Agriculture Organization of the United Nations) (2006). The state of world fisheries. FAO, Rome. Available at FAO (Food and Agriculture Organization of the United Nations) (2005). Review of the state of world marine fisheries resources. FAO Fisheries Technical Paper No FAO, Rome. FAO Fisheries Technical Paper. No. 433/2. Rome, FAO. Felson, M. & Clarke, R.V. (1998). Opportunity makes the thief: Practical theory for crime prevention. Home Office, London, UK. Policing and Reduction Crime Unit. Ferretti, F., Myers, R.A., Serena, F. & Lotze, H.K. (2008). Loss of large predatory sharks from the Mediterranean Sea. Conservation Biology, 22(4), pp Field, A. (2005). Discovering statistics using SPSS. Sage Publications. Fleming, A.E. (2003). Appraisal of world abalone markets: Australia s potential to compete for a share of the aquaculture market. Abalone Aquaculture Consultancy Pty Ltd., Australia.
210 195 Flewwelling, P. (1999). An introduction to monitoring, control and surveillances systems for capture fisheries. FAO Fisheries Technical Paper 338. Available at: Garcia, S.M. & Newton, C. (1997). Current situation, trends and prospects in world capture fisheries. In E.L. Pikitch, D.D. Huppert and M.P. Sissenwine (Eds.) Global trends: Fisheries management. American Fisheries Society Symposium 20, Seattle, Washington, June 1994, pp Gauvin J. (1988) An economic estimation of compliance behavior in the Massachusetts inshore lobster fishery. Unpublished Master s Thesis, University of Rhode Island. Gelchu, A. & Pauly, D. (2007). Growth and distribution of port-based global fishing effort within countries EEZs from 1970 to Fisheries Centre Research Reports, 15(4), pp Gianni, M. & Simpson, W. (2008). The changing nature of high seas fishing: How flags of convenience provide cover for illegal, unreported and unregulated fishing. Australian Government, Department of Agriculture, Fisheries and Forestry. Gordon, H.R. & Cook, P.A. (2003). World abalone supply, markets and pricing: Historical, current and future prospective. Opening Speech: 5 th International Abalone Symposium, Quingdao, China, October Gullard, J.A. (1974). The management of marine fisheries. Scientechnical (Publishers) Ltd. Bristol. Holland, D.S. (2008). Are fishermen rational? A fishing expedition. Marine Resource Economics, 23, pp Holland, D.S. & Sutinen, J.G. (2000). Location choice in New England trawl fisheries: Old habits die hard. Land Economics, 76(1), pp Hosch, G. (2009). Analysis of the implementation and impact of the FAO Code of Conduct for Responsible Fisheries since Food and Agriculture Organization of the United Nations. FAO Fisheries and Aquaculture Circular No FIEL/C1038. HSTF-High Seas Task Force (2006). Closing the net: Stopping illegal fishing on the high seas. Final report of the Ministerially-led Task Force on IUU Fishing on the High Seas. London, UK. Available at: IUCN, International Union for Conservation of Nature (2011). IUCN Red List of Threatened Species. Available at: IUCN, International Union for Conservation of Nature (2010). Sturgeon more critically endangered than any other group of species. International News Release. Available at
211 196 Jia, J. & Chen, J. (2001). Sea farming and sea ranching in China.FAO Fisheries Technical Paper 418. FAO, Rome. Johnson, V. (1992). Artisanal fishermen and intermediaries in Mozambique. In I. Tvedten and B. Hersoug (Eds.). Fishing for development: Small-scale fisheries in Africa. Nordiska Afrikainstituten (Scandinavian Institute of African Studies), Sweden, pp King, D.M., Price, E., Van Buren, A., Shearin, C., Mengerink, K., Porter, R.D., Sutinen, J.G., Rosenberg, A. & Swasey, J.H. (2009). An economic, legal and institutional assessment of enforcement and compliance in Federally-managed U.S. commercial fisheries. University of Maryland, Center for Environmental Science. Selected Reports and Publications. King, D.M. & Sutinen, J.G. (2010). Rational noncompliance and the liquidation of Northeast groundfish resources. Marine Policy, 34, pp Kuper, J. (X). Oceans in Crisis. Situation Status. Available at Lawson, R.M. & Kwei, E.R. (1974). African entrepreneurship and economic growth: A case study of the fishing industry of Ghana. Ghana Universities Press. Accra. Leech, N.L., Barrett, K.C., and Morgan, G.A. (2005). SPSS for intermediate statistics: Use and interpretation. 2 nd Edition. Lawrence Erlbaum Associates, Publishers. Mahwah, NJ, USA. Le Gallic, B. & Cox, A. (2005). An economic analysis of illegal, unreported and unregulated (IUU) fishing: Key driers and possible solutions. Marine Policy, 30, pp Lemieux, A.M. & Clarke, R.V. (2009). The international ban on ivory sales and its effects on elephant poaching in Africa. British Journal of Criminology, 49, pp Letts, D. J. (2010). The use of force in patrolling Australia s fishing zones. Marine Policy, 24, pp Lilly, J.R., Cullen, F.T. & Ball, R.A (2007). Criminological theory: Context and consequences. Fourth Edition. Sage Publications, Thousand Oaks, CA. Love, P. (2010). Fisheries: While stocks last. Organization for Economic Cooperation and Development. MacSweet, I.M. (1983). Markets for fish and fishery products in Eastern Europe. FAO Fisheries Technical Paper 241 FIIU/T241. FAO, Rome. Mak. K.K.W., Yanase, H. & Renneberg, R. (2005). Cyanide fishing and cyanide detection in coral reef fish using chemical tests and biosensors. Biosensors and Biolectronics, 20(12), pp
212 197 Marine Conservation Biology Institute (n.d.). Protecting marine ecosystems. Available at: Marine Conservation Society (n.d.) How fish are caught. Available at: Marine Stewardship Council (2010). Annual Report 2010/11. Available at: March, J.G. (1994). A primer on decision making: How decisions happen. The Free Press. A Division of Simon and Schuster, Inc. McLeod, W.J. (1964). The flags-of-convenience problem. South Carolina Law Review, 16, pp Meere, F. and Lack, M. (2008). Assessment of impacts of illegal, unreported and unregulated fishing in the Asia-Pacific. Asia-Pacific Economic Cooperation Fisheries Working Group. Miles, J. (no date). Getting the sample size right: A brief introduction to power analysis. Available at: Mitchell, A. (2005). The ESRI Guide to GIS Analysis: Volume 2: Spatial Measurements and Statistics. ESRI Press, Redlands, California. MRAG and UBC (2008). The global extent of illegal fishing. Available at: MRAG (2008). Study and analysis of the status of IUU fishing in the SADC region and an estimate of the economic, social and biological impacts. Volume 2-Main Report. A link to the full document is available at: MRAG (2005). Review of impacts of illegal, unreported and unregulated fishing on developing countries. Final Report. Report prepared for the UK s Department for International Development with support from the Norwegian Agency for Development Cooperation. Münster, G. (2007). Application of geographically weighted regression to investigate the impact of scale on prediction uncertainty by modeling relationship between vegetation and climate. International Journal of Spatial Data Infrastructures Research, 3, pp Neuwinger, H.D. (2004). Plants used for poison fishing in tropical Africa. Toxicon, 44(4), pp Nielsen, J.R. & Mathiesen, C. (2003). Important factors influencing rule compliance in fisheries: Lessons from Denmark. Marine Policy, 27, pp
213 198 Njofonjou, O. & Njock, J.C. (2000). African fisheries: Major trends and diagnostic of the 20 th century. Oregon State University, Corvallis. Available at: Norusis, M. (2006) SPSS 15.0: Statistical procedures companion. Prentice Hall, Upper Saddle River, NJ, USA. OceanLaw Information and Consultancy Services (2007). Current developments in international fisheries law and policy. International Fisheries Law and Policy Review, 0(1), pp OECD (2005). Why fish piracy persists: The economics of illegal, unreported and unregulated fishing. Paris: OECD. Osieke, E. (). Flags of convenience vessels: Recent developments. The American Journal of International Law, 73, pp Palma, M. A. and Tsamenyi, M. (2008). Case study on the impacts of illegal, unreported and unregulated fishing in the Sulawesi Sea. APEC Fisheries Working Group. Australian National Centre for Ocean Resources and Security. Pascoe, S.; Kirkley, J.E.; Gréboval, D.; Morrison-Paul, C.J. (2003). Measuring and assessing capacity in fisheries. 2. Issues and methods. Pauly, D., Christensen, V., Guenette, S., Pitcher, T.J, Sumaila, R., Walters, C.J., Watson, R. & Zeller, D. (2002). Towards sustainability in world fisheries. Nature, 418, pp Pauly, D. Christensen, F., Dalsgaard, J., Froese, R. & Torres, F. (1998). Fishing down marine food webs. Science, 279 (5352), pp Pauly, D. & McClean, J. (2004). In a perfect ocean. Island Press. PEW Environmental Group, The (2010). Port state performance report. Available at ean_life/port%20state%20performance%20report.pdf?n=6316. Pires, S.F. & Clarke, R.V. (2011a). Sequential foraging, itinerant fences and parrot poaching in Bolivia. British Journal of Criminology, 51, pp Pires, S.F. & Clarke, R.V. (2011b). Are parrots CRAVED? An analysis of parrot poaching in Mexico. Journal of Research in Crime and Delinquency, online, March 15, 2011, DOI: / Pitcher, T., Kalikoski, D., Pramod, G. & Short, K. (2009). Not honoring the code. Nature, 457(5), pp Pitcher, T., Kalikoski, D. and Pramod, G. (2006). Evaluations of compliance with the FAO (UN) Code of Conduct for Responsible Fisheries. Fisheries Centre Research Report 14(2), The Fisheries Centre, UBC.
214 199 Pitcher, T. J., Watson, R., Forrest, R., Valtysson, H. & Guenette, S. (2002). Estimating illegal and unreported catches from marine ecosystems: a basis for change. Fish and Fisheries, 3, pp Porter, R. (2010). Fisheries observers as enforcement assets: Lessons from the North Pacific. Marine Policy, 34, pp Pitcher, T., Kalikoski, D & Pramod, G. (Eds) (2006). Evaluations of compliance with the FAO (UN) Code of Conduct for Responsible Fisheries. Fisheries Centre Research Reports, 14(2), pp Pramod G. & Pitcher, T.J. (2006). An estimation of compliance of the fisheries of Namibia with Article 7 (Fisheries Management) of the UN Code of Conduct for Responsible Fishing. University of British Columbia, Fisheries Center Research Reports. Putt, J. and Anderson, K. (2007). A national study of crime in the Australian fishing industry. Australian Government, Australian Institute of Criminology. Research and Public Policy Series, No. 76. Rigg, K, Parmentier, R. & Currie, D., The Varda Group (2003). Halting IUU fishing: Enforcing international fisheries agreements. Report prepared for OCEANA. Schmidt, C. (2004). Addressing illegal, unreported and unregulated (IUU) fishing. Paper prepared for the International Fisheries Compliance 2004 Conference, September 2004, Brussels. Sea Around Us Project (2010). Sea around us: A Ten-year retrospective, Fisheries Centre, The University of British Columbia. Sheikh, P.A. and Corn, M.L. (2005). The Convention on International Trade in Endangered Species of Wild Fauna and Flora (CITES): Background and issues. Congressional Research Service, Library of Congress. Order Code: RL Skaret, G. & Pitcher, T.J. (2006). An estimation of compliance of the fisheries of Norway with Article 7 (Fisheries Management) of the UN Code of Conduct for Responsible Fishing. University of British Columbia, Fisheries Center Research Report. Solecki, J.J. (1979). A review of U.S.S.R. fishing industry. Ocean Management, 5, pp Solecki, J.J. (1966). Three economic aspects of the fishing industry in Mainland China. Institute of animal resource ecology laboratory. The University of British Columbia, Vancouver. Standing, A. (2008). Corruption and industrial fishing in Africa. Anti-Corruption Resource Center, Corruption and Governance Programme, Institute for Security Studies, South Africa.
215 200 Sumaila, U.R., Alder, J. and Keith, H. (2006). Global scope and economics of illegal fishing. Marine Policy, 30(6), p Swann, J. (2002). Fishing vessels operating under open registers and the exercise of flag state responsibilities: Information and options. FAO Fisheries Circular No. 980, Rome. Swan, J. (2004). International systems for monitoring and verifying fisheries agreements. Verification Yearbook. Available at Swartz, W., Sumaila, U.R., Watson, R. and Pauly, D. (2010). Sourcing seafood for the three major markets: The EU, Japan and the USA. Marine Policy, 34, pp Takayam, S. (1963). Mechanization of fishing fleets in Japan. In L.B. Nui and J-O Jan- Old Trrmg (Eds.). Indo-Pacific fisheries council proceedings. 10 th Session, Soul Republic of Korea, Section II Symposium Papers. IPFC Secretariat, FAO Regional Office for Asia and the Far East. Bangkok, pp Thiele, W. (1999). Global trends in fishing technology and their effects on fishing power and capacity. FAO Regional Workshop on the Effects of Globalization and Deregulation of Marine Capture Fisheries in Asia. Pusan, Republic of Korea. Tindall, C. (no date). Stop Illegal Fishing Situation Status: Themes and Issues: Fisheries Certification. Marine Resource Assessment Group, Ltd, United Kingdom. Available at To, A.W.L., Hau, B.C.H. & Lee, S.K.H. (2006). A study on the trade in dried abalone in Hong Kong. Traffic Bulletin, 21(1), pp Tsamenyi, M, Palma, M.A., Milligan, B. & Mfodwo, K. (2008). Development impact of the Council regulation establishing a European Community System to prevent, deter and eliminate illegal, unreported and unregulated fishing on Commonwealth ACP member countries. Final Report prepared for the Commonwealth Secretariat. Tvedten, I. & Hersoug, B. (Eds) (1992). Fishing for development: Small-scale fisheries in Africa. Nordiska Afrikainstituten (The Scandinavian Institute of African studies). Sweden. United Nations (2005). Convention on the High Seas. Done at Geneva on 29 April, Entered into force on 30 September, Treaty Series, Vol UNODC (United Nations Office on Drugs and Crime) (2011). Transnational organized crime in the fishing industry: Focus on trafficking in persons, smuggling of migrants and illicit drugs trafficking. United Nations, Vienna. Vaisman, A. & Raymakers C. (2001). The status of sturgeon resources in Russia. Traffic Bulletin, 19(1), pp
216 201 Varkey, D.A., Ainsworth, C.H., Pitcher, T.J, Goram, Y. & Sumaila, R. (2010). Illegal, unreported and unregulated fisheries catch in Raja Ampat Regency, Eastern Indonesia. Marine Policy, 34, pp Varkey, D. & Pitcher, T.J. (2006). An estimation of compliance of the fisheries of Iceland with Article 7 (Fisheries Management) of the UN Code of Conduct for Responsible Fishing. University of British Columbia, Fisheries Center Research Report. Vincent, A. (2004). Reconciling fisheries with conservation in marine waters: The coral reef example. Keynote Presentation at the 4 th World Fisheries Congress, Reconciling fisheries with conservation: the challenge of managing aquatic ecosystems. May 2-6, Vancouver, Canada. Walchol, G.L., Zupan, L.L. & Clack, W. (2003). Transnational criminality: An analysis of the illegal wildlife market in Southern Africa. International Criminal Justice Review, 13, pp Warner S. (2004) An analysis of the indirect effect of national marine fisheries service observers on the logbook reporting of prohibited species catch. In: NMFS. Proceedings of the third international fisheries observer conference. US Watson, R., Hoshino, E., Beblow, J., Revenga, C., Kura, Y. & Kitchingman, A. (2004). Fishing gear associated with global marine catches. Fisheries Centre Research Reports, 12(6), pp Watson, R., Revenga, G. & Kura, Y. (2006). Fishing gear associated with global marine catches II: Trends in trawling and dredging. Fisheries Research, 79, pp WWF (2008). Illegal fishing in Arctic waters: Catch of today-gone tomorrow? WWF International Arctic Programme, Oslo, Norway. Wertheim, E. (2007). Naval Institute guide to combat fleets of the world: Their ships, aircraft and systems. 15 th Edition. U.S. Naval Institute. World Fisheries Trust (2008). Subsistence fishing: Fishing methods fact card. Available at: Worm, B., Barbier, E.B., Beaumont, N., Emmett Duffy, J. Folke, C., Halpern, B.S., Jackson, J.B.C., Iotze, H.K, Micheli, F., Palumbi, S.R., Sala, E., Selkoe, K.A., Stachowicz, J.J. & Watson, R. (2006). Impacts of biodiversity loss on ocean ecosystem services. Science, 3(314), pp Xue, G. (2006). China s distant water fisheries and its response to flag state responsibilities. Marine Policy, 30, pp Zeller, D. & Pauly, D., (Eds.) (2007) Reconstruction of marine fisheries catches for key countries and regions, Fisheries Centre Research Reports, 15(2), pp. 163.
217 202 Zhu, T. (2004). Bao Yu: Mei Shi, Fu Gui Yu Quan Li (Abalone: Delicacies, wealth and power). Chinese National Geography, 519, pp (In Chinese). Zimmerman, M.E. (2003). The black market for wildlife: Combating transnational organized crime in the illegal wildlife trade. Vanderbilt Journal of Transnational Law, 36, pp
218 203 APPENDIX A: LIST OF THE COUNTRIES EXAMINED Angola Argentina Australia Bangladesh Brazil Canada Chile China Denmark Ecuador Egypt Faeroes France Germany Ghana Iceland India Indonesia Iran Ireland Italy Japan Korea, North Korea, South Latvia Malaysia Maldives Mexico Morocco Myanmar Namibia Netherlands New Zealand Nigeria Norway Pakistan Peru Philippines Poland Portugal Russia Senegal South Africa Spain Sri Lanka Sweden Taiwan Thailand Turkey UK Ukraine USA Vietnam Yemen

219 204 APPENDIX B: FAO STATISTICAL AREAS Adopted from FAO Website
220 205 APPENDIX C: LIST OF EIGHTEEN REGIONAL FISHERIES MANAGEMENT ORGANIZATIONS Acronym CCAMLR CCSBT CCBSP GFCM IATTC ICCAT IOTC IPHC IWC NAFO NASCO NEAFC NPAFC PSC SEAFO SIOFA SPRFMO WCPFC Full Name Convention on the Conservation of Antarctic Marine Living Resources Commission for the Conservation of Southern Bluefin Tuna Convention on the Conservation and Management of the Pollock Resources in the Central Bering Sea General Fisheries Commission for the Mediterranean Inter-American Tropical Tuna Commission International Commission for the Conservation of Atlantic Tunas Indian Ocean Tuna Commission International Pacific Halibut Commission International Whaling Commission Northwest Atlantic Fisheries Organization North Atlantic Salmon Conservation Organization North-East Atlantic Fisheries Commission North Pacific Anadromous Fish Commission Pacific Salmon Commission South East Atlantic Fisheries Organization South Indian Ocean Fisheries Organization South Pacific Regional Fisheries Management Organization Western and Central Pacific Fisheries Commission

221 206 APPENDIX D: RFMO CONVENTION AREAS Adapted from Botto, (2009)

222 207 APPENDIX E: TWENTY FIVE TECHNIQUES OF SITUATIONAL CRIME PREVENTION Adopted from
223 APPENDIX F: DISPUTED AND JOINT TERRITORIES EXCLUDED FROM THE CURRENT STUDY 208
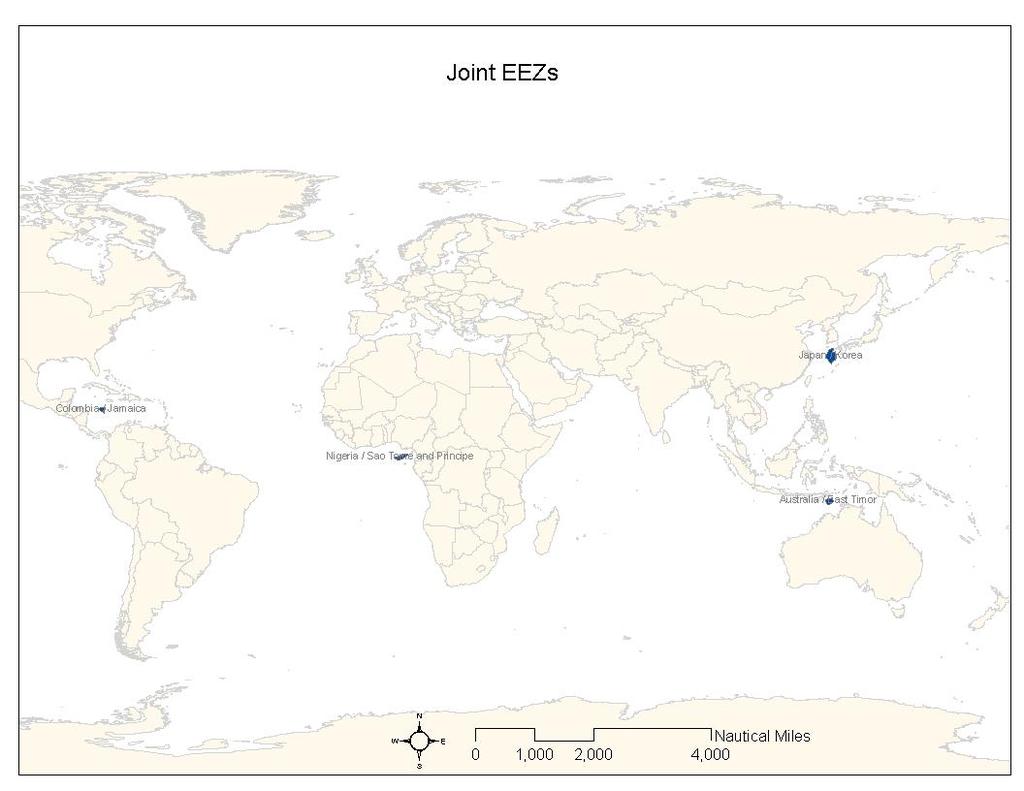
224 209


225 APPENDIX G: EXCLUDED OVERSEAS EEZs BELONGING TO THE COUNTRIES UNDER STUDY 210
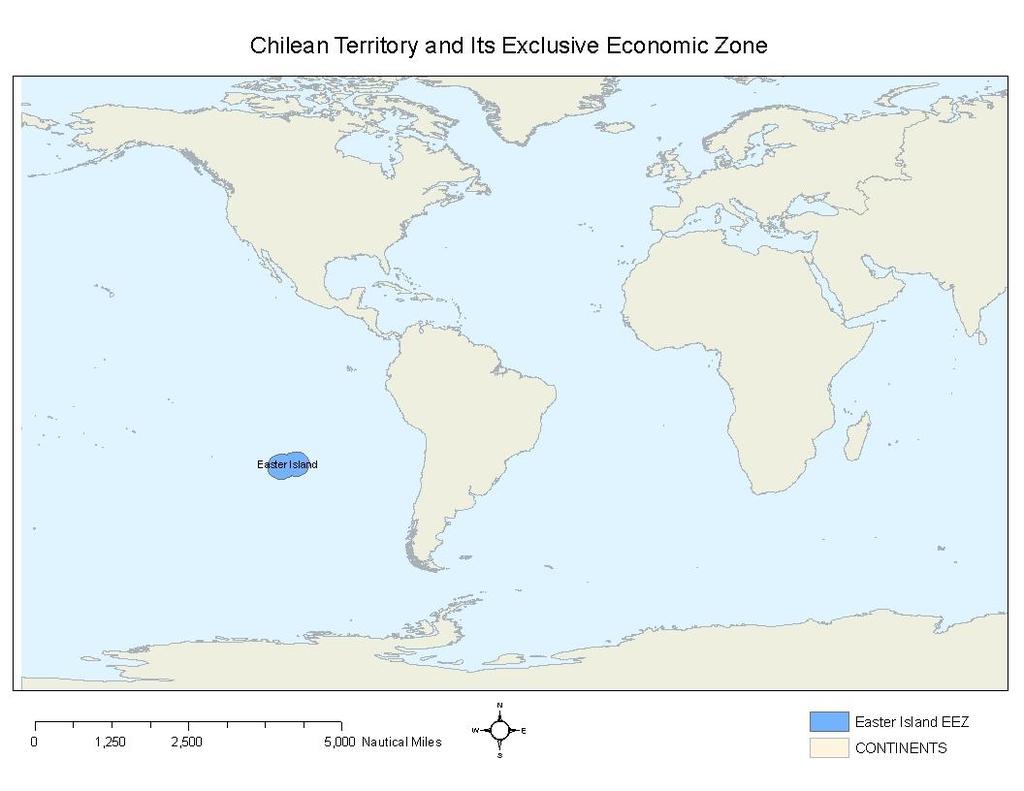
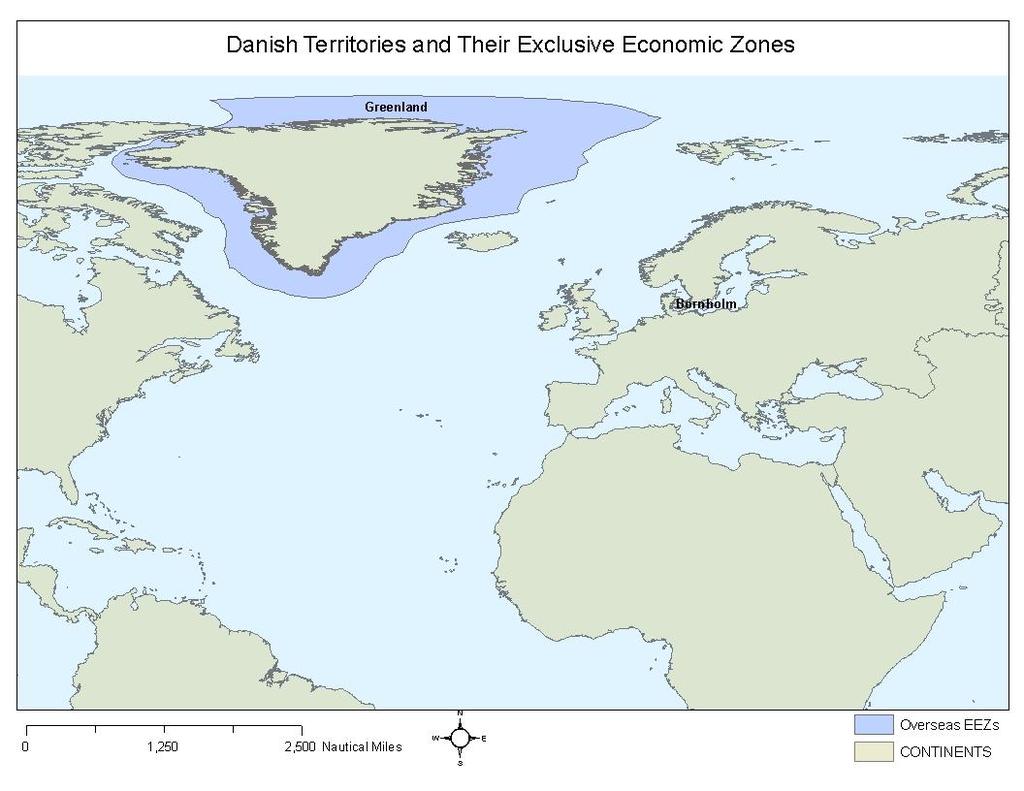
226 211
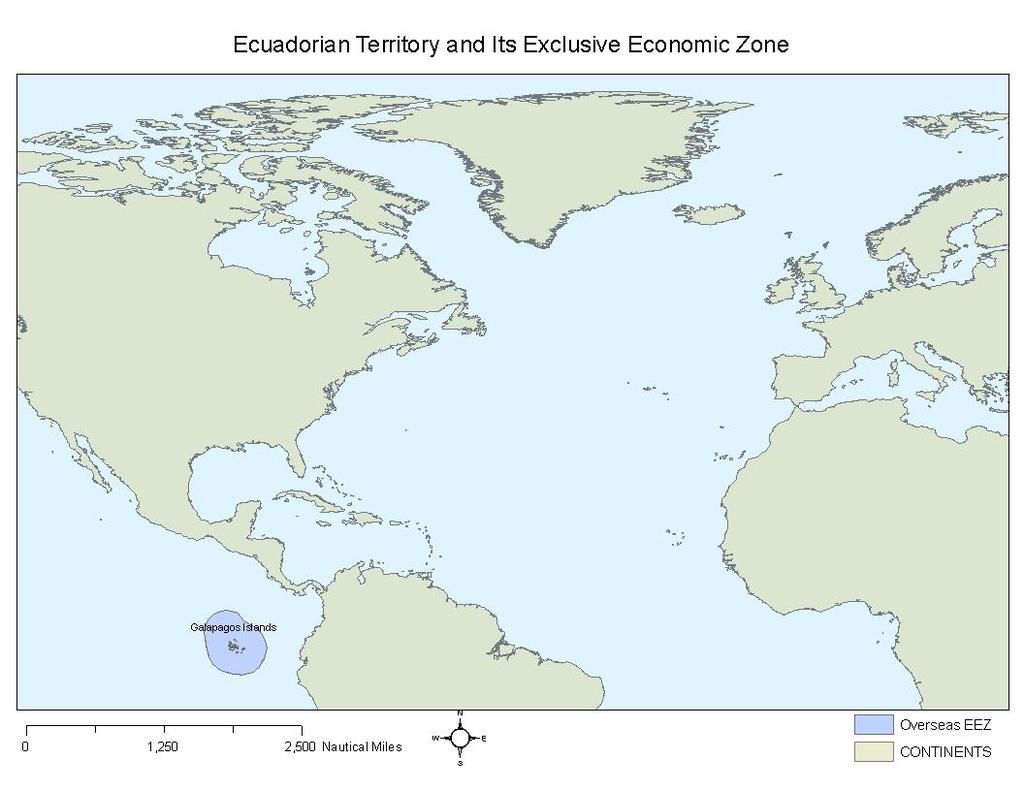
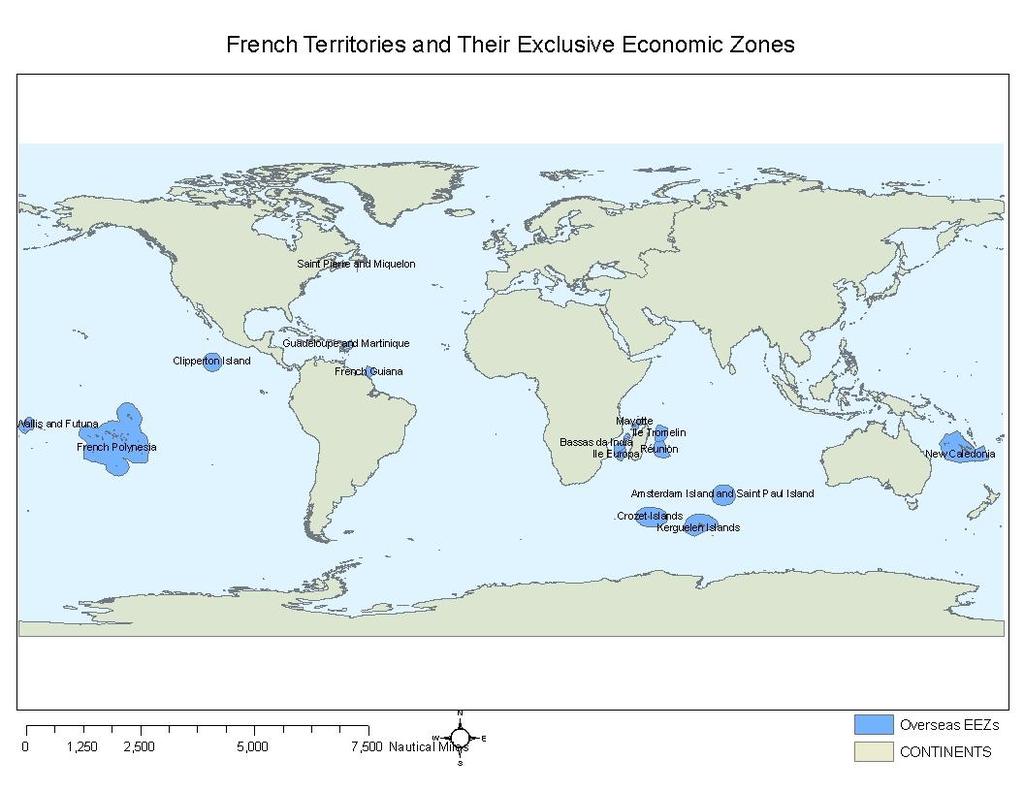
227 212
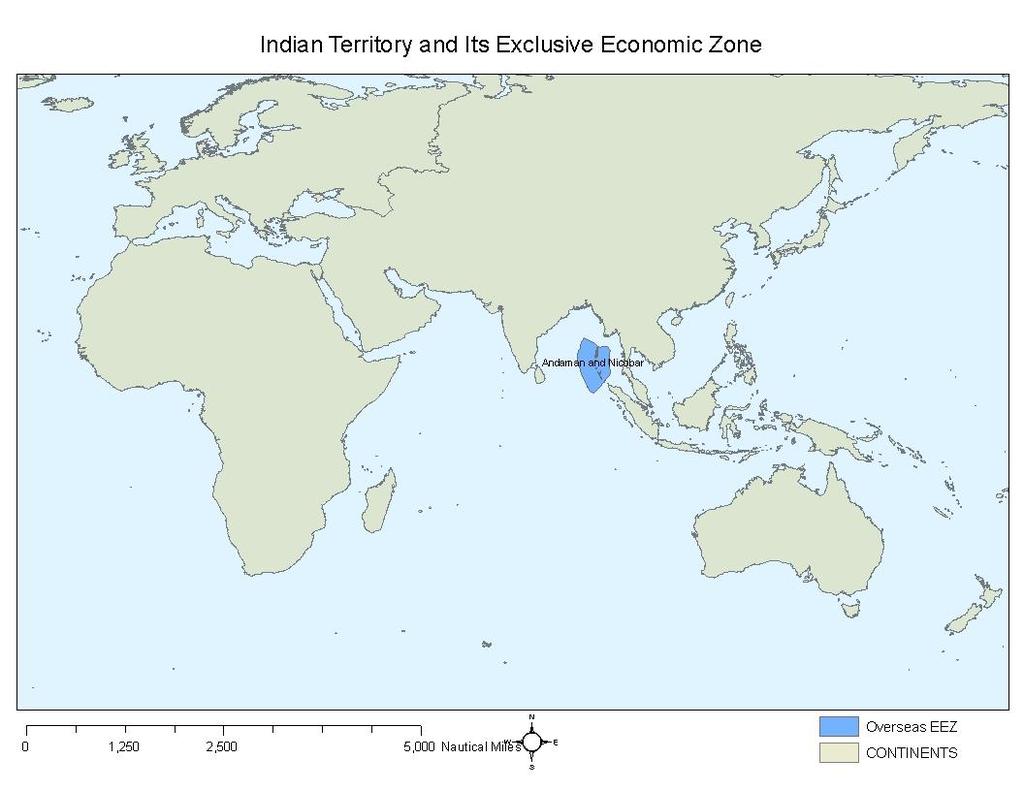
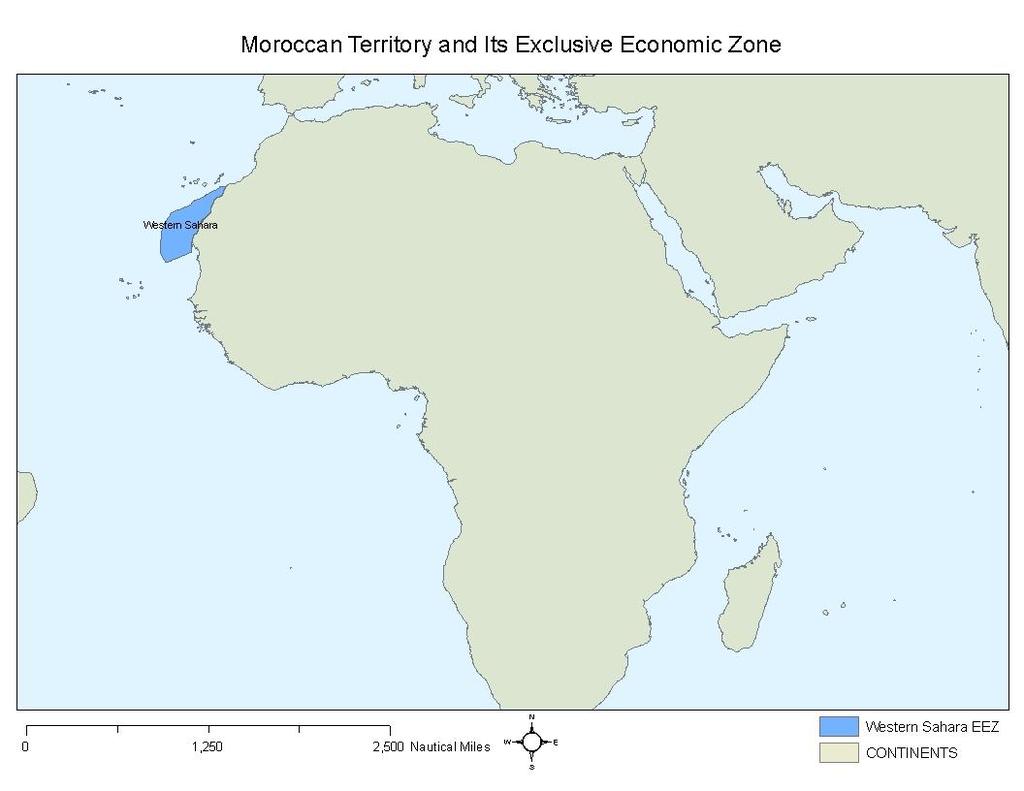
228 213
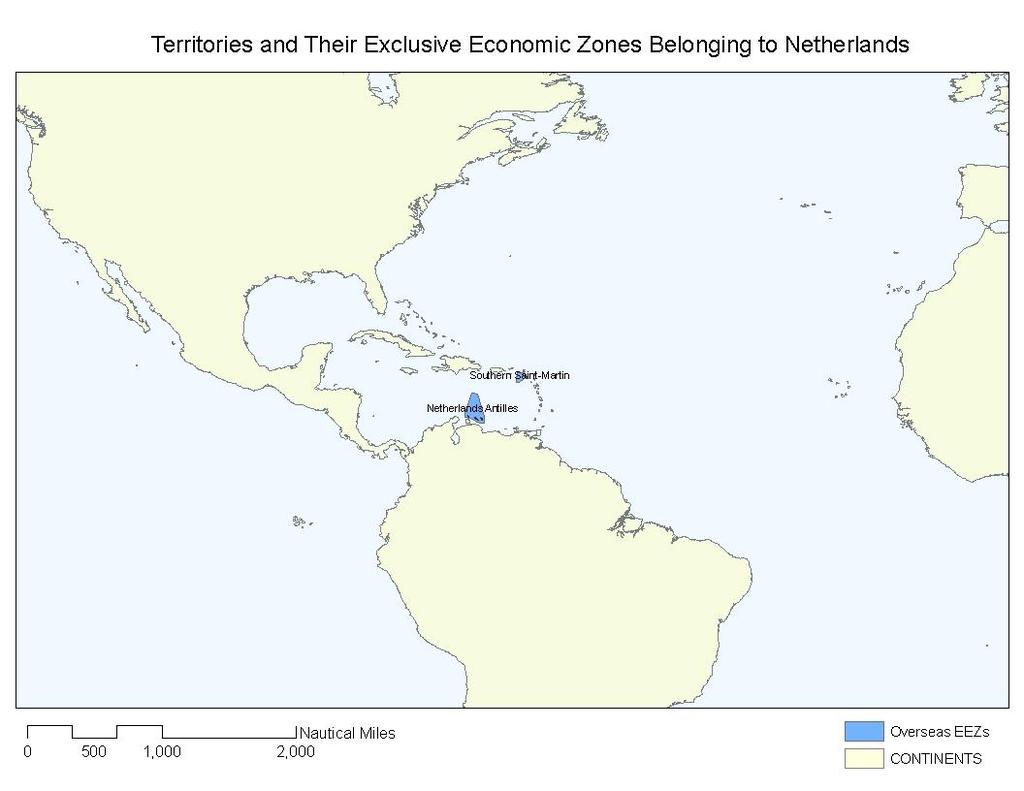
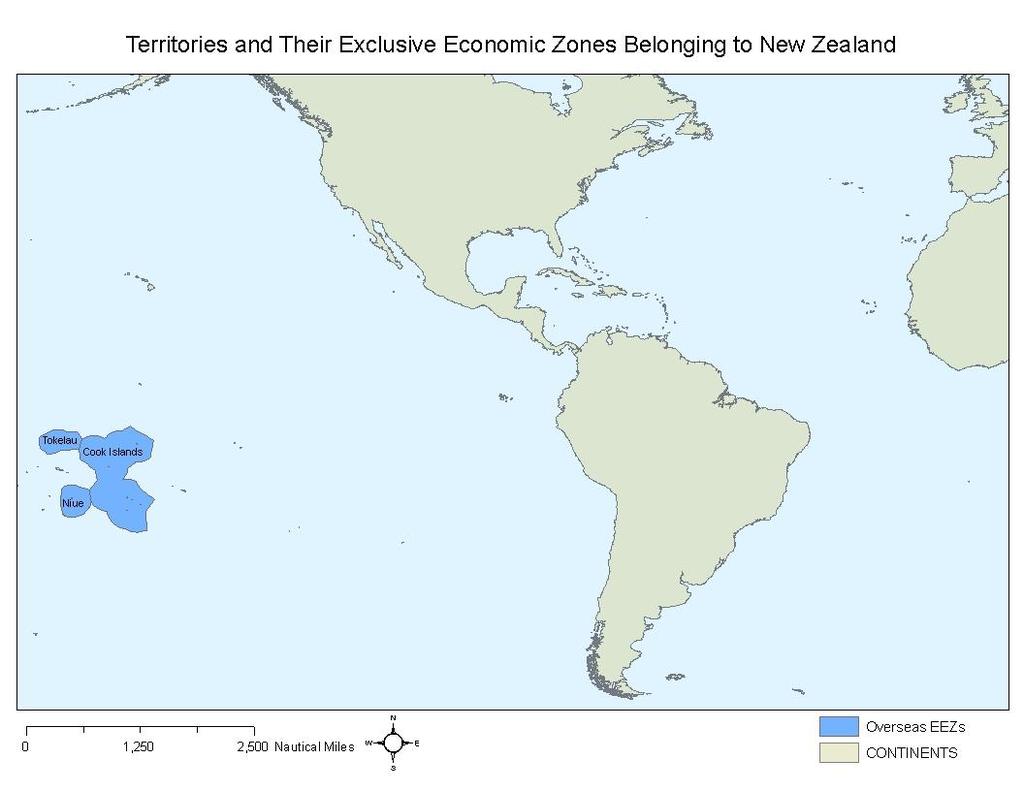
229 214
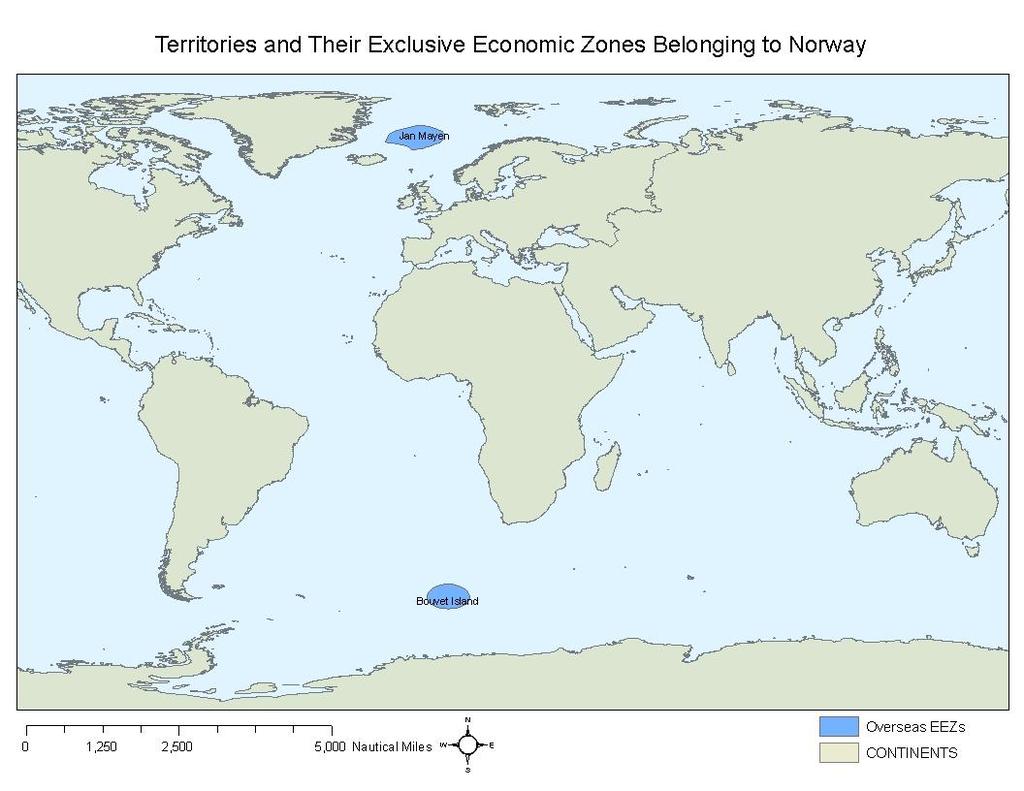
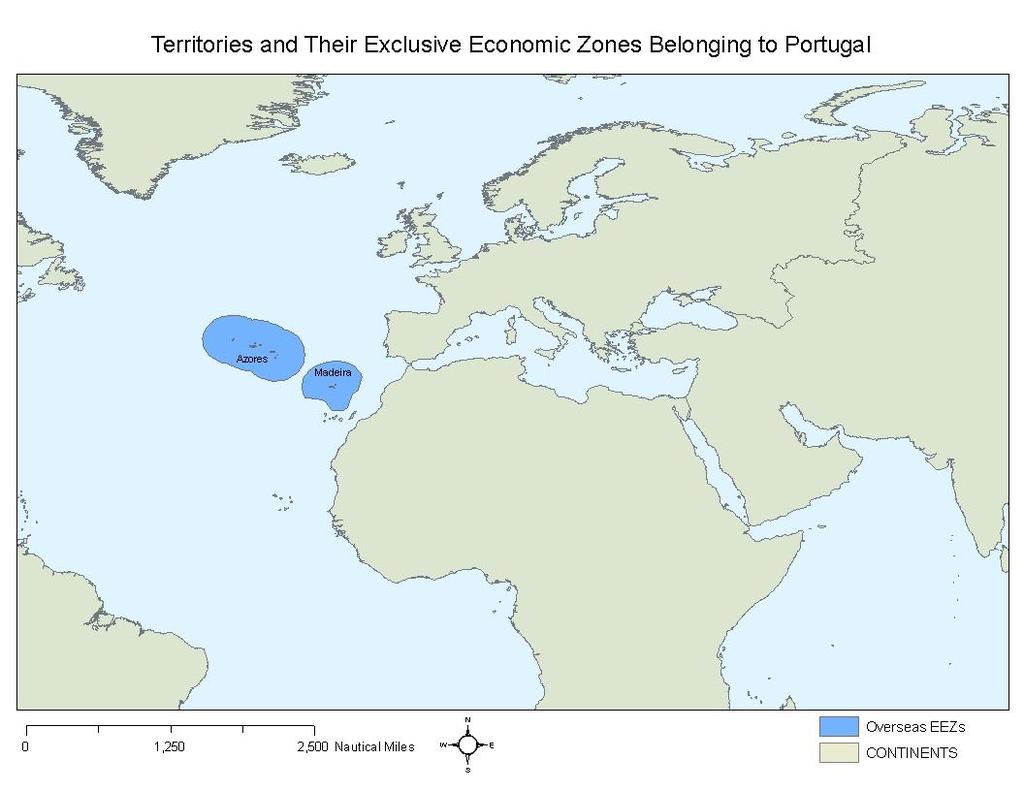
230 215
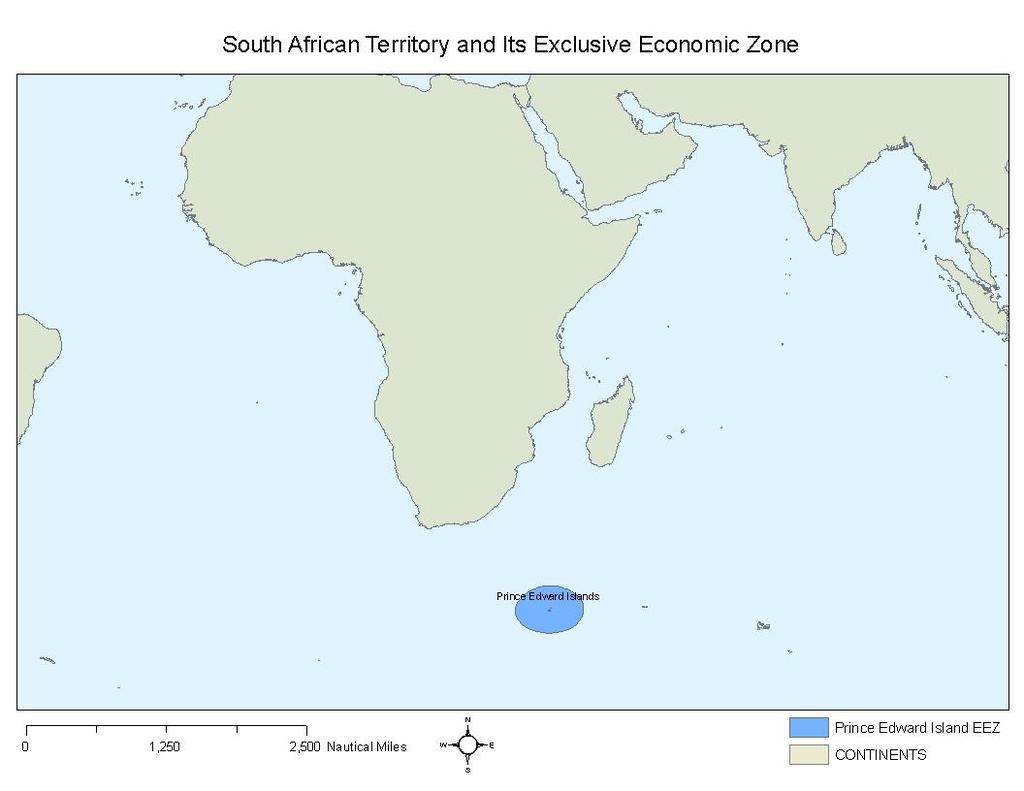
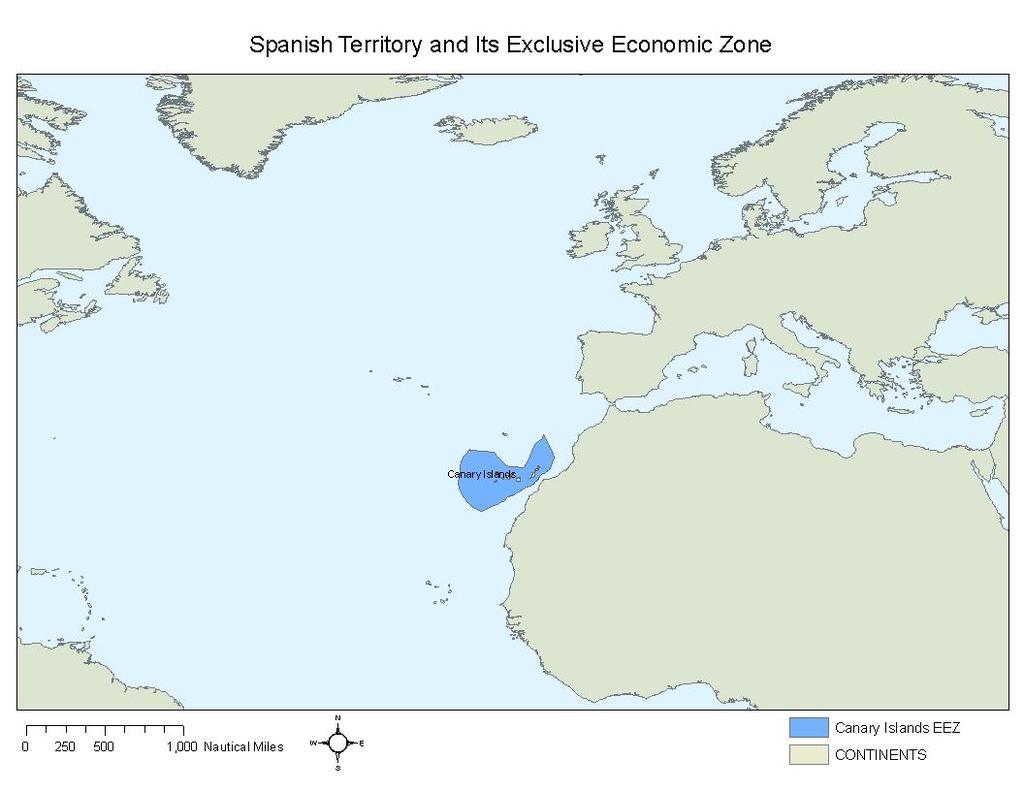
231 216
232 217 APPENDIX H: A COMPLETE LIST OF DETECTED PORT VISITS BY IUU BLACKLISTED VESSELS IN Country Name of Port Number of Visits Percent of Visits Cumulative Percent of Visits Cumulative Percent of Ports Singapore Singapore Ecuador Bahia de Manta Ukraine Sevastopol Mauritania Nouadhibou Russia Kaliningrad Colombia Cartagena Germany Rostock South Korea Pusan Ghana Tema Spain Las Palmas Cape Verde St. Vincent USA Dutch Harbour Cote D'Ivoire Abidjan Lithuania Klaipeda Panama Balboa China Dalian Morocco Agadir China Qingdao Copenhagen Anchorage No Denmark Latvia Liepaja Nigeria Apapa-Lagos Spain Caraminal China Hong Kong Ecuador Guayaquil Malta Valletta Aruba Outer Anchorage Netherlands Philippines Davao Russia St. Petersburg Spain Riveira Ecuador Puerto Bolivar Norway Kristiansund Panama Taboga Island Poland Swinoujscie South Africa Durban Spain Villagarcia Spain Coruna
233 218 Spain Vigo Taiwan Kaohsiung USA Akutan Colombia Buenaventura Torshavn Denmark Anchorage Kopli-Port of Tallinn Estonia Estonia Tallinn Morocco Casablanca Netherlands Eemshaven Nigeria Port Harcourt Norway Aalesund Panama Cristobal South Africa Cape Town South Korea Yosu UK Port of Gibraltar China unknown (China) Bayuqyan Small Craft Anchorage China China Yantai China Quanzhou China Changshu Costa Rica Puntarenas Costa Rica Isla Herradura Costa Rica Caldera Denmark Thorshavn Egypt Damietta Egypt Alexandria Egypt Port Said Estonia Bekkeri Germany Cuxhaven Germany Stralsund Japan Shimizu Japan Kashima Japan Sendai Japan Nagoya Japan Kobe Mauritania unknown (Mauritania) unknown (Morocco) Morocco Netherlands Ijmuiden Netherlands Rotterdam Netherlands Ymuiden
234 219 Norway Vadso Norway Kirkenes Norway Borg Hbr Panama Panama Canal Philippines Cebu Poland Szczecin Russia Vladivostok Spain Marin Spain Sta Crus de Tenerife Muelle de Oza - Spain Puerto de a Coruna Sta Eugenia de Riviera Spain Spain Santander Turkey Tuzia Ukraine Mariupol Sevastopol Anchorage No Ukraine United Kingdom Port William United Kingdom Stanley Harbour USA Captains Bay REMAINING COUNTRIES REMAINING PORTS

235 APPENDIX I: CENTRALLY LOCATED PORTS OF 54 COUNTRIES 220
Frank Meere. Sustainable Fisheries Management
 Polices to combat IUU Fishing in the Asia-Pacific Region Frank Meere Sustainable Fisheries Management Background Global IUU problem UNGA, FAO, HSTF, EC and US High priority of APEC - Bali Plan of Action
Combating IUU: China and the European Market
 Combating IUU: China and the European Market Tatjana Gerling Smart Fishing Global Initiative WWF International Light tower Tatjana Gerling/WWF International 22 nd September 2014 The European Parliament
Regional Plan of Action (RPOA) to Promote Responsible Fishing Practices including Combating IUU Fishing in the Region 1. Contents
 to Promote Responsible Fishing Practices including Combating IUU Fishing in the Region 1. Contents") Regional Plan of Action (RPOA) to Promote Responsible Fishing Practices including Combating IUU Fishing in the Region 1 Contents Current resource and management situation in the region...3 Implementation
Regional Plan of Action (RPOA) to Promote Responsible Fishing Practices including Combating IUU Fishing in the Region 1 Contents Current resource and management situation in the region...3 Implementation
SCIENTIFIC COMMITTEE NINTH REGULAR SESSION August 2013 Pohnpei, Federated States of Micronesia
 SCIENTIFIC COMMITTEE NINTH REGULAR SESSION 6-14 August 2013 Pohnpei, Federated States of Micronesia ANNUAL REPORT TO THE COMMISSION PART 1: INFORMATION ON FISHERIES, RESEARCH, AND STATISTICS WCPFC-SC9-AR/CNM-35
Counting the fish catch - why don t the numbers match?
 Counting the fish catch - why don t the numbers match? Authors: Daniel Pauly and Dirk Zeller Associate editor: Lindsey Hall Abstract Fish and marine animals like shrimp (we ll call them all fish here),
AGREEMENT ON PORT STATE MEASURES TO PREVENT, DETER AND ELIMINATE ILLEGAL, UNREPORTED AND UNREGULATED FISHING
 AGREEMENT ON PORT STATE MEASURES TO PREVENT, DETER AND ELIMINATE ILLEGAL, UNREPORTED AND UNREGULATED FISHING 1 Responsible for yearly catches reaching tens of millions of tonnes and depriving the global
ESSENTIAL REFERENCES
 ESSENTIAL REFERENCES INTERNATIONAL INSTRUMENTS 1982 United UN Convention on the Law of the Sea Ports are subject to the sovereignty of the coastal State because they are considered as internal waters.
Progress Made by Tuna Regional Fisheries Management Organizations (RFMOs)
") Progress Made by Tuna Regional Fisheries Management Organizations (RFMOs) Background Following the first joint meeting of the five tuna regional fisheries management organizations (RFMOs) in January 2007,
Progress Made by Tuna Regional Fisheries Management Organizations (RFMOs) Background Following the first joint meeting of the five tuna regional fisheries management organizations (RFMOs) in January 2007,
SUSTAINABILITY CRITERIA FOR FISHERIES SUBSIDIES: THE LATIN AMERICAN CONTEXT
 SUSTAINABILITY CRITERIA FOR FISHERIES SUBSIDIES: THE LATIN AMERICAN CONTEXT 29-30 July 2009, Guayaquil, Ecuador The Sunken Billions Kieran Kelleher Fisheries Team Leader The World Bank The Economic Justification
The State of the Ocean and the impact of subsidies. Daniel Pauly Sea Around Us project Fisheries Centre, UBC
 The State of the Ocean and the impact of subsidies Daniel Pauly Sea Around Us project Fisheries Centre, UBC World Trade Organization Geneva, September 30, 2010 Fisheries landings, despite (or because of
Protecting the Deep Sea Under International Law. Legal Options for Addressing High Seas Bottom Trawling
 Protecting the Deep Sea Under International Law Legal Options for Addressing High Seas Bottom Trawling Extract Only: Full Paper Full paper available at http://www.savethehighseas.org/publications.cfm or
COUNTRY NOTE ON NATIONAL FISHERIES MANAGEMENT SYSTEMS -- SPAIN
 COUNTRY NOTE ON NATIONAL FISHERIES MANAGEMENT SYSTEMS -- SPAIN Box 1. Short overview to the fisheries sector 2001 Production level: Landings Aquaculture Canned fish 929 933 tonnes 313 175 tonnes 260 280
( ) Page: 1/5 PROPOSED DISCIPLINES ON PROHIBITIONS AND SPECIAL AND DIFFERENTIAL TREATMENT FOR FISHERIES SUBSIDIES. Proposal from Indonesia
 Page: 1/5 PROPOSED DISCIPLINES ON PROHIBITIONS AND SPECIAL AND DIFFERENTIAL TREATMENT FOR FISHERIES SUBSIDIES. Proposal from Indonesia") 6 June 2017 (17-2986) Page: 1/5 Negotiating Group on Rules Original: English PROPOSED DISCIPLINES ON PROHIBITIONS AND SPECIAL AND DIFFERENTIAL TREATMENT FOR FISHERIES SUBSIDIES Proposal from Indonesia
6 June 2017 (17-2986) Page: 1/5 Negotiating Group on Rules Original: English PROPOSED DISCIPLINES ON PROHIBITIONS AND SPECIAL AND DIFFERENTIAL TREATMENT FOR FISHERIES SUBSIDIES Proposal from Indonesia
THE FOURTH GLOBAL FISHERIES ENFORCEMENT TRAINING WORKSHOP
 The decorated oxcart is an internationally recognized symbol of Costa Rica THE FOURTH GLOBAL FISHERIES ENFORCEMENT TRAINING WORKSHOP Protecting Artisanal and Regional Fishing Communities through the Promotion
OPRT s Work to Restrict and Reduce Tuna Longline Fishing Capacity (IATTC Workshop, October 10 12, San Diego) Presented by OPRT
 Presented by OPRT") OPRT s Work to Restrict and Reduce Tuna Longline Fishing Capacity (IATTC Workshop, October 10 12, San Diego) Presented by OPRT 1. Introduction Organization for the Promotion of Responsible Tuna Fisheries
OPRT s Work to Restrict and Reduce Tuna Longline Fishing Capacity (IATTC Workshop, October 10 12, San Diego) Presented by OPRT 1. Introduction Organization for the Promotion of Responsible Tuna Fisheries
Chapter 12: Food from the Oceans (pg )
") Chapter 12: Food from the Oceans (pg. 197 213) Introduction: It s estimated 100 million people in developing countries depend on fishing for livelihood. Issue of sustainable development of marine resources
Chapter 12: Food from the Oceans (pg. 197 213) Introduction: It s estimated 100 million people in developing countries depend on fishing for livelihood. Issue of sustainable development of marine resources
Western Fishboat Owners Association (WFOA) Informational Report
 Informational Report") Agenda Item H.2.e Supplemental Public Comment March 2015 The entry of the Chinese fleet into Pacific Ocean tuna fisheries and the economic impact to the U.S. albacore fleet from this large subsidized and
Agenda Item H.2.e Supplemental Public Comment March 2015 The entry of the Chinese fleet into Pacific Ocean tuna fisheries and the economic impact to the U.S. albacore fleet from this large subsidized and
Challenges, Prospects & Opportunities. Seychelles Fisheries Sector
 Challenges, Prospects & Opportunities Seychelles Fisheries Sector Geographical Location General information Total population: 94,000 people Total territory: 1,374,000 km 2 Land/Ocean territory:459 km 2
State of Small pelagic Fish resources and its implications for Food Security and Nutrition
 State of Small pelagic Fish resources and its implications for Food Security and Nutrition Manuel Barange, Stefania Vannuccini, Yimin Ye, Malcolm Beveridge Food and Agriculture Organization of the UN,
THE DEVELOPMENT AND PROSPECT OF THE AQUACULTURE IN ASIA. Chen Sun, Shanghai Fisheries University, Economy and Trade College,
 THE DEVELOPMENT AND PROSPECT OF THE AQUACULTURE IN ASIA Chen Sun, Shanghai Fisheries University, Economy and Trade College, chensun@shfu.edu.cn ABSTRACT Asia has made and is making great contribution to
IOTC-2016-WPTT18-INFO3 Received: 4 November 2016
 Status of Tropical Tuna Gillnet fisheries in Pakistan Muhammad Farhan Khan Assistant Fisheries Development Commissioner Ministry of Ports and Shipping Government of Pakistan IOTC-2016-WPTT18-INFO3 Received:
GENERAL INFORMATION ON TOGO RELATED TO FISHERIES
 51 TOGO 1. INTRODUCTION This document is aimed at providing reference information on the present status of fishery information and data collection in Togo for the discussion during the FAO FishCode- STF/CECAF/FCWC
Delivering on Seafood Traceability Under the Seafood Import Monitoring Program
 Delivering on Seafood Traceability Under the Seafood Import Monitoring Program Steven Wilson Director, Seafood Commerce and Certification Office of International Affairs and Seafood Inspection Illegal,
Global State of IUU. Evidence-based risk assessments (sustainability, legality and traceability). John Pearce
. John Pearce") Global State of IUU Evidence-based risk assessments (sustainability, legality and traceability). John Pearce Global State of IUU IUU is a global problem. Illegal and unreported fishing losses worldwide
Global State of IUU Evidence-based risk assessments (sustainability, legality and traceability). John Pearce Global State of IUU IUU is a global problem. Illegal and unreported fishing losses worldwide
SOUTH PACIFIC COMMISSION. TWENTY-SECOND REGIONAL TECHNICAL MEETING ON FISHERIES (Noumea, New Caledonia, 6-10 August 1990)
") Page 1 ORIGINAL : ENGLISH SOUTH PACIFIC COMMISSION TWENTY-SECOND REGIONAL TECHNICAL MEETING ON FISHERIES (Noumea, New Caledonia, 6-10 August 1990) STOCK STATUS OF SKIPJACK TUNA IN THE WESTERN TROPICAL
Page 1 ORIGINAL : ENGLISH SOUTH PACIFIC COMMISSION TWENTY-SECOND REGIONAL TECHNICAL MEETING ON FISHERIES (Noumea, New Caledonia, 6-10 August 1990) STOCK STATUS OF SKIPJACK TUNA IN THE WESTERN TROPICAL
Sustainable Fisheries for Future Generations The Fisheries White Paper
 Sustainable Fisheries for Future Generations The Fisheries White Paper Key messages The Fisheries White Paper Sustainable Fisheries for Future Generations charts the course for a sustainable and profitable
FishSA: Presentation Jeremy Marillier Executive Director
 FishSA: Presentation Jeremy Marillier Executive Director Economic Overview 600 000 tons harvested per year 22 fishing sectors some optimally exploited and some over - exploited Wild capture fisheries contribute
SUSTAINABILITY F.A.Q
 SUSTAINABILITY F.A.Q 1. 1.1 1.2 Sustainable Seafood What is sustainable seafood? Why is sustainable seafood important? 2. 2.1 2.2 2.3 2.4 2.5 2.6 2.7 2.8 2.9 2.10 2.11 2.12 2.13 About WWF and John Wests
COORDINATING WORKING PARTY ON FISHERY STATISTICS. Nineteenth Session. Noumea, New Caledonia, July 2001 AGENCY REPORT.
 June 2001 CWP/19/SPC E COORDINATING WORKING PARTY ON FISHERY STATISTICS Nineteenth Session Noumea, New Caledonia, 10-13 July 2001 AGENCY REPORT Author: SPC W0000 3 AGENCY PROGRAMMES IN FISHERY STATISTICS:
Why the International Community Needs to Help Create Marine Reserves
 Why the International Community Needs to Help Create Marine Reserves by Daniel Pauly Sea Around Us Project Fisheries Centre, University of British Columbia Vancouver, Canada United Nations Open-ended Informal
The State of World Fishery
 The State of World Fishery Takashi Matsuishi At SERD, AIT, Thailand 24Feb-14Mar, 2014 1 The State of World Fisheries and Aquacurture 2012 SOFIA 2012 Published from FAO Food and Agriculture Organization
2018 COM Doc. No. COC-303_Appendix 1 / oct.-18 (11:37 )
") Original: English/French ALGERIA REPORTS ON THE IMPLEMENTATION OF CLOSED SEASONS FOR MEDITERREAN SWORDFISH As regards SWO 3006, concerning the submission of information Algeria on the implementation of
Original: English/French ALGERIA REPORTS ON THE IMPLEMENTATION OF CLOSED SEASONS FOR MEDITERREAN SWORDFISH As regards SWO 3006, concerning the submission of information Algeria on the implementation of
Outline. 1. Selected indicators 2. Selected issues 3. Societal response 4. Outlook
 ICP. June 2005 Outline 1. Selected indicators 2. Selected issues 3. Societal response 4. Outlook 1. Selected indicators Reported landings Food Employment State of stocks Trade Fleet size Reported marine
REC.CM-GFCM/40/2016/4
 REC.CM-GFCM/40/2016/4 establishing a multiannual management plan for the fisheries exploiting European hake and deep-water rose shrimp in the Strait of Sicily (GSA 12 to 16) The General Fisheries Commission
Management advisory for the Bay of Bengal Indian mackerel fishery
 Management advisory for the Bay of Bengal Indian mackerel fishery What is the BOBLME RFMAC The BOBLME Project is supporting countries to implement an ecosystem approach to fisheries management of shared
COMMISSION THIRTEENTH REGULAR SESSION Denarau Island, Fiji 5 9 December, 2016
 COMMISSION THIRTEENTH REGULAR SESSION Denarau Island, Fiji 5 9 December, 2016 INFORMATION PAPER ON INDONESIAN COMPLIANCE WITH CONSERVATION AND MANAGEMENT MEASURE 2015 01 WCPFC13-2016-DP30 2 December 2016
The Transformation Status of Marine Commercial Fisheries. and Marine Aquaculture in South Africa
 The Transformation Status of Marine Commercial Fisheries and Marine Aquaculture in South Africa Introduction Fishing rights have always been a contentious issue. In Offshore fisheries such as the demersal
International Initiatives Illegal Fishing (IUU Fishing)
") International Initiatives Illegal Fishing (IUU Fishing) Per Erik Bergh pebergh@nfds.info www.stopillegalfishing.com Targeting policy process and partnerships Pan African Programme Both inland and marine
International Initiatives Illegal Fishing (IUU Fishing) Per Erik Bergh pebergh@nfds.info www.stopillegalfishing.com Targeting policy process and partnerships Pan African Programme Both inland and marine
Yellowfin Tuna, Indian Ocean, Troll/ pole and line
 Yellowfin Tuna, Indian Ocean, Troll/ pole and line Yellowfin Tuna, Indian Ocean, Troll/ pole and line Content last updated 7th Mar 2017 Stock: Indian Ocean Management: Indian Ocean Tuna Commission Overview
Japan s report on Paragraph 13, CMM
 Japan s report on Paragraph 13, CMM2016-04 1 Introduction: Overview of Japanese PBF fisheries 2 PBF Catch by fishing gear in Japan 1952 1954 1956 1958 1960 1962 1964 1966 1968 1970 1972 1974 1976 1978
The Implications of Illegal, Unreported and Unregulated (IUU) Fishing in Production cost for Marine water small-scale fisheries: A Case
 Fishing in Production cost for Marine water small-scale fisheries: A Case") The Implications of Illegal, Unreported and Unregulated (IUU) Fishing in Production cost for Marine water small-scale fisheries: A Case Study of Mafia Island, Mainland Tanzania. Upendo Hamidu, Fatma Sobo
The Implications of Illegal, Unreported and Unregulated (IUU) Fishing in Production cost for Marine water small-scale fisheries: A Case Study of Mafia Island, Mainland Tanzania. Upendo Hamidu, Fatma Sobo
5. purse seines 3 000
 Sea Bass Q and A Latest News What have the 28 Member States decided on 2 July? The EU has today taken another step to protect sea bass. The 28 EU member states agreed to the Commission's proposal to increase
Sustainable Fisheries and the 1982 UN Convention on the Law of the Sea. Introduction
 Sustainable Fisheries and the 1982 UN Convention on the Law of the Sea UNITAR/DOALOS Briefing 17 October 2007 Liza Gall and Michael Shewchuk Introduction General character of the UN Convention on the Law
WTO Fisheries Subsidies Negotiations
 WTO Fisheries Subsidies Negotiations The PACIFIC PERSPECTIVES SECOND OCEANS CONFERENCE 16 17 July 2018 UNCTAD, Geneva Pacific Islands Forum Geneva Office Fish at MC 11 Outcome incorporates SDG Target 14.6
Kuan-Hsiung WANG, Prof. Graduate Institute of Political Science Taiwan Normal University Taipei, TAIWAN
 International Symposium on The Belt and Road Initiative and the Common Development in the South China Sea Rim Haikou, Hainan, CHINA, 2016/12/08 Kuan-Hsiung WANG, Prof. Graduate Institute of Political Science
Genetically modified salmon is fit for the table
 Genetically modified salmon is fit for the table GENETIC ENGINEERING September 22, 2010 By Yonathan Zohar, Special to CNN The debate over genetically engineered salmon should be put in the proper context:
IOTC Agreement Article X. Report of Implementation for the year 2016
 IOTC Agreement Article X Report of Implementation for the year 2016 DEADLINE FOR SUBMISSION OF THE REPORT 17 MARCH 2017 Reporting CPC: MALAYSIA Date of submission: 28/02/2017 Please NOTE: this document
U.N. Gen. Ass. Doc. A/CONF.164/37 (8 September 1995) <http://daccessdds.un.org/doc/undoc/gen/n95/274/67/pdf/n pdf?openelement>.
 <http://daccessdds.un.org/doc/undoc/gen/n95/274/67/pdf/n pdf?openelement>.") Agreement for the Implementation of the Provisions of the United Nations Convention on the Law of the Sea Of 10 December 1982 Relating to the Conservation and Management of Straddling Fish Stocks and Highly
Agreement for the Implementation of the Provisions of the United Nations Convention on the Law of the Sea Of 10 December 1982 Relating to the Conservation and Management of Straddling Fish Stocks and Highly
RESOLUTION 15/04 CONCERNING THE IOTC RECORD OF VESSELS AUTHORISED TO OPERATE IN THE IOTC AREA OF
 RESOLUTION 15/04 CONCERNING THE IOTC RECORD OF VESSELS AUTHORISED TO OPERATE IN THE IOTC AREA OF COMPETENCE Keywords: Authorised vessels; active vessels; auxiliary, supply and support vessels; IMO number;
Summary of Preliminary Results of Transboundary Diagnostic Analysis, 2018
 1 Western And Central Pacific Oceanic Fisheries Management Summary of Preliminary Results of Transboundary Diagnostic Analysis, 2018 Fact sheet for the Oceanic Fisheries Management Project (OFMP2). OFMP2
SEAFOOD SUMMIT 2016 SENEGAL ESE SUSTAINABLE FISHERIES POLICY Dr. Mamadou Goudiaby, Director of Maritime Fisheries, Senegal
 SEAFOOD SUMMIT 2016 SENEGAL ESE SUSTAINABLE FISHERIES POLICY Dr. Mamadou Goudiaby, Director of Maritime Fisheries, Senegal Coastline of 718 km and an Exclusive Economic Zone (EEZ) of 200 nautical miles;
Arctic Fisheries and International Law
 Arctic Fisheries and International Law Erik J. Molenaar Netherlands Institute for the Law of the Sea (NILOS), Utrecht University & Faculty of Law, University of Tromsø Arctic Summer College, 20 Aug. 2012
Official Journal of the European Union
 L 3/34 COMMISSION IMPLEMTING DECISION (EU) 2017/10 of 5 January 2017 amending Implementing Decision 2013/328/EU and Implementing Decision 2012/807/EU establishing specific control and inspection programmes
Inter-RAC Conference Decision-making within a reformed Common Fisheries Policy (CFP)
") Inter-RAC Conference Decision-making within a reformed Common Fisheries Policy (CFP) Wider Environmental Perspective to Fisheries Management and the NEAFC model of regional cooperation Kjartan Hoydal,
Inter-RAC Conference Decision-making within a reformed Common Fisheries Policy (CFP) Wider Environmental Perspective to Fisheries Management and the NEAFC model of regional cooperation Kjartan Hoydal,
L 198/8 Official Journal of the European Union
 L 198/8 Official Journal of the European Union 26.7.2008 COUNCIL REGULATION (EC) No 718/2008 of 24 July 2008 amending Regulations (EC) No 2015/2006 and (EC) No 40/2008, as regards fishing opportunities
AREAS BEYOND NATIONAL JURISDICTION: INDIAN OCEAN DEVELOPING COASTAL STATES TUNA MANAGEMENT WORKSHOP
 AREAS BEYOND NATIONAL JURISDICTION: INDIAN OCEAN DEVELOPING COASTAL STATES TUNA MANAGEMENT WORKSHOP The goal of this workshop is to create a better understanding of among Indian Ocean Developing Coastal
Rio+20 and Agenda 21
 Rio+20 and Agenda 21 The Known Bad News The Unknown Bad News Outcome of Rio+20 for fisheries stress the importance of the conservation and sustainable use of the oceans and seas urge all [LOS and Straddling
Fisheries sector comprised oceanic and coastal resources which are exploited at subsistence, artisanal and industrial levels
 1 Background Fisheries sector comprised oceanic and coastal resources which are exploited at subsistence, artisanal and industrial levels Subsistence fisheries activities are conducted on coastal and nearshore
Japan's National Plan of Action for Conservation and Management of Sharks. Revised Version
 Japan's National Plan of Action for Conservation and Management of Sharks Revised Version March 2009 Fisheries Agency Government of Japan Japan's National Plan of Action for Conservation and Management
Blue Economy Forum November, Bangkok
 Blue Economy Forum 2017 14-15 November, Bangkok WPEA Project Area (Indonesia, Philippines, Vietnam) http://www.wcpfc.int/west-pacific-east-asia-oceanic-fisheries-management-project WPEA Region in the WCPFC
Wild caught sustainable seafood
 Wild caught sustainable seafood Published November 2012 Responsible sourcing We are committed to the quality, integrity and long-term sustainability of the seafood we sell. Founded in 1880, initially trading
HOW CAN WE HELP TO SUSTAIN AQUATIC BIODIVERSITY?
 HOW CAN WE HELP TO SUSTAIN AQUATIC BIODIVERSITY? Marine Biodiversity The most marine biodiversity is found: 1. Coral reefs 2. Estuaries 3. Deep-ocean floor Biodiversity is higher near coasts than in the
Fisheries data collection of Thai oversea fishing fleet
 Fisheries data collection of Thai oversea fishing fleet Pattira Lirdwitayaprasit* Aekkarat Wongkeaw and Prasit Luesrithawornsin Oversea Fisheries and Transshipment Control Division, Department of Fisheries,
ACTION TO COMBAT ILLEGAL FISHING AND PROTECTING THE ENDANGERED FISH SPECIES IN AFRICA
 ACTION TO COMBAT ILLEGAL FISHING AND PROTECTING THE ENDANGERED FISH SPECIES IN AFRICA The African component of the ACP Capacity Building Program related to Multilateral Environmental Agreements (MEAs)
Economics of (un-)sustainability in global fisheries
sustainability in global fisheries") Economics of (un-)sustainability in global fisheries U. Rashid Sumaila Fisheries Economics Research Unit Sea Around Us project UBC Fisheries Centre r.sumaila@fisheries.ubc.ca World Oceans Day Panel Presentation,
Economics of (un-)sustainability in global fisheries U. Rashid Sumaila Fisheries Economics Research Unit Sea Around Us project UBC Fisheries Centre r.sumaila@fisheries.ubc.ca World Oceans Day Panel Presentation,
LEGAL BASIS OBJECTIVES ACHIEVEMENTS
 INTERNATIONAL FISHERIES RELATIONS With the aim of promoting legal, environmental, economic and social governance frameworks for sustainable fisheries, of gaining access to key fishing areas of the world
THE FOURTH GLOBAL FISHERIES ENFORCEMENT TRAINING WORKSHOP
 Photo courtesy INCOPESCA THE FOURTH GLOBAL FISHERIES ENFORCEMENT TRAINING WORKSHOP Protecting Artisanal and Regional Fishing Communities through the Promotion of Legal, Reported and Regulated Fisheries
West Coast Rock Lobster. Description of sector. History of the fishery: Catch history
 West Coast Rock Lobster Description of sector History of the fishery: The commercial harvesting of West Coast rock lobster commenced in the late 1800s, and peaked in the early 1950s, yielding an annual
A reformed CFP needs to be based on sustainability, and use the principle of caution
 Response from the North-Norwegian county councils of Troms and Nordland to the EU Commission s Green Paper on the Reform of the Common Fisheries Policy (CFP) Introduction Troms and Nordland are two coastal
Report on Biology, Stock Status and Management of Southern Bluefin Tuna: 2017
 Attachment 11 Report on Biology, Stock Status and Management of Southern Bluefin Tuna: 2017 The CCSBT Extended Scientific Committee (ESC) updated the stock assessment and conducted a review of fisheries
Feeding fish to fish is this a responsible practice?
 Feeding fish to fish is this a responsible practice? Andrew Jackson Technical Director International Fishmeal & Fish Oil Organisation Humber Seafood Summit 15 July 2010 IFFO International Fishmeal and
2018 COM Doc. No. PA4_810 / 2018 November 7, 2018 (11:44 AM)
") EXPLANATORY NOTE FOR A DRAFT RECOMMENDATION BY ICCAT TO ESTABLISH THE FOUNDATION FOR REBUILDING PROGRAMS FOR BLUE MARLIN AND WHITE MARLIN/SPEARFISH Proposal submitted by United States Page 1 of 6 Original:
EXPLANATORY NOTE FOR A DRAFT RECOMMENDATION BY ICCAT TO ESTABLISH THE FOUNDATION FOR REBUILDING PROGRAMS FOR BLUE MARLIN AND WHITE MARLIN/SPEARFISH Proposal submitted by United States Page 1 of 6 Original:
The State of the World Marine Fisheries (II): Solutions for the World and Brazil Daniel Pauly Sea Around Us Fisheries Centre, UBC
: Solutions for the World and Brazil Daniel Pauly Sea Around Us Fisheries Centre, UBC") The State of the World Marine Fisheries (II): Solutions for the World and Brazil Daniel Pauly Sea Around Us Fisheries Centre, UBC First International Symposium on Marine Fisheries Management in Brazil.
The State of the World Marine Fisheries (II): Solutions for the World and Brazil Daniel Pauly Sea Around Us Fisheries Centre, UBC First International Symposium on Marine Fisheries Management in Brazil.
SCIENTIFIC COMMITTEE NINTH REGULAR SESSION August 2013 Pohnpei, Federated States of Micronesia
 SCIENTIFIC COMMITTEE NINTH REGULAR SESSION 6-14 August 2013 Pohnpei, Federated States of Micronesia ANNUAL REPORT TO THE COMMISSION PART 1: INFORMATION ON FISHERIES, RESEARCH, AND STATISTICS WCPFC-SC9-AR/CCM-10
PRESENTATION ON WILD CAUGHT SHRIMP OF INDIA BY MR. A.J. THARAKAN PRESIDENT OF THE SEAFOOD EXPORTERS ASSOCIATION OF INDIA
 PRESENTATION ON WILD CAUGHT SHRIMP OF INDIA BY MR. A.J. THARAKAN PRESIDENT OF THE SEAFOOD EXPORTERS ASSOCIATION OF INDIA 1 INDIAN COASTLINE SHOWING SEAFOOD PROCESSING CLUSTERS Indian Union 29 states, 9
PROPOSAL IATTC-92 B-4 REVISED SUBMITTED BY BELIZE, GUATEMALA, NICARAGUA, COSTA RICA AND PANAMA
 INTER-AMERICAN TROPICAL TUNA COMMISSION 92 ND MEETING Mexico City, Mexico 24-28 July 2017 PROPOSAL IATTC-92 B-4 REVISED SUBMITTED BY BELIZE, GUATEMALA, NICARAGUA, COSTA RICA AND PANAMA COMPENDIUM OF CONSERVATION
Wild caught sustainable seafood
 Wild caught sustainable seafood Version March 2017 Responsible sourcing We are committed to the quality, integrity and long-term sustainability of the seafood we sell. Founded in 1880, initially trading
Sustainable Seas - Marine Fisheries Fisheries and Fishing
 Sustainable Seas - Marine Fisheries Fisheries and Fishing Maximum Sustainable Yield and Fishery Management Mariculture Reading: Ch 9: 9.12 Ch 14: 14.7-14.9 Ch 17: 17.1, 17.17-17.21,17.25 Graphic: Chub
PRESIDENCY WORKING DOCUMENT
 COUNCIL OF THE EUROPEAN UNION Brussels, 28 May 2003 DS 208/03 LIMITE PRESIDCY WORKING DOCUMT Proposal for a COUNCIL REGULATION on the management of the fishing effort relating to certain Community fishing
The Salmon Industry: Twenty-Five Predictions for the Future
 The Salmon Industry: Twenty-Five Predictions for the Future by Gunnar Knapp Professor of Economics Institute of Social and Economic Research University of Alaska Anchorage 3211 Providence Drive Anchorage,
FISHERIES CO-OPERATION ICELAND AND NORWAY WITH. Presented by Philip Rodgers ERINSHORE ECONOMICS
 FISHERIES CO-OPERATION WITH ICELAND AND NORWAY Presented by Philip Rodgers 17/12/2013 Fisheries Cooperation with Norway and Iceland 1 Objective To consider the current situation in the fishery for highly
Screening report Serbia
 ORIGIN: COMMISSION WP ENLARGEMENT + COUNTRIES NEGOTIATING ACCESSION TO EU MD 103/15 20.05.15 Screening report Serbia Chapter 13 Fisheries Date of screening meetings: Explanatory meeting: 30 September 2014
NEW WTO DISCIPLINES ON FISHING SUBSIDIES: OUTLINE OF A ROBUST SOLUTION (WWF DISCUSSION PAPER 29 APRIL 2003)
") NEW WTO DISCIPLINES ON FISHING SUBSIDIES: OUTLINE OF A ROBUST SOLUTION (WWF DISCUSSION PAPER 29 APRIL 2003) The WTO negotiations on fishing subsidies have entered a critical period during which the parameters
NEW WTO DISCIPLINES ON FISHING SUBSIDIES: OUTLINE OF A ROBUST SOLUTION (WWF DISCUSSION PAPER 29 APRIL 2003) The WTO negotiations on fishing subsidies have entered a critical period during which the parameters
Fishery. Harvesting. Snow Crab Professional Fish Harvesters Certification Board
 Fishery T he Newfoundland and Labrador fishery faced several challenges in 8, including continued competition from low-cost producers, as well as high fuel costs and unfavourable exchange rates for most
Fisheries Management Standard. Version 2.0
 Enacted in Japanese: 2017.10.03 Effective in Japanese: 2018.02.01 Fisheries Management Standard Version 2.0 Marine Eco-Label Japan Council (2018) Introduction Marine Eco-Label Japan (MEL) Council have
WORLD. Geographic Trend Report for GMAT Examinees
 2012 WORLD Geographic Trend Report for GMAT Examinees WORLD Geographic Trend Report for GMAT Examinees The World Geographic Trend Report for GMAT Examinees identifies mobility trends among candidates applying
OCEAN2012 Fish Dependence Day - UK
 OCEAN2012 Fish Dependence Day - UK Europeans are now so dependent on fish products originating from external waters that half the fish they consume are sourced outside the EU Fish dependence: The EU s
OUTLINES. From Fishing Rights to Right Fisheries: The Development of International Fisheries Law and Its Practices
 The 3 rd Program of China-ASEAN Academy on Ocean Law and Governance, Haikou, Hainan, CHINA November 7, 2017 From Fishing Rights to Right Fisheries: The Development of International Fisheries Law and Its
Explanatory Memorandum to the Scallop Fishing (Wales) Order 2010.
 Order 2010.") Explanatory Memorandum to the Scallop Fishing (Wales) Order 2010. This Explanatory Memorandum has been prepared by the Fisheries Policy Branch of the Department for Rural Affairs and is laid before the
Explanatory Memorandum to the Scallop Fishing (Wales) Order 2010. This Explanatory Memorandum has been prepared by the Fisheries Policy Branch of the Department for Rural Affairs and is laid before the
WORKING GROUP ON STOCK ASSESSMENTS 5 TH MEETING DOCUMENT SAR-5-08 TARGET SIZE FOR THE TUNA FLEET IN THE EASTERN PACIFIC OCEAN
 INTER-AMERICAN TROPICAL TUNA COMMISSION COMISIÓN INTERAMERICANA DEL ATÚN TROPICAL WORKING GROUP ON STOCK ASSESSMENTS 5 TH MEETING LA JOLLA, CALIFORNIA (USA) 11-13 MAY 2004 DOCUMENT SAR-5-08 TARGET SIZE
FAO Global Capture Production database updated to 2015 Summary information Fisheries and Aquaculture Department
 FAO Global Capture Production database updated to Summary information Fisheries and Aquaculture Department Table 1. World capture production in and million million Inland capture 11.3 11.5 1.1% Marine
Introducing Friend of the Sea. Certification of seafood products from sustainable fisheries and aquaculture
 Introducing Friend of the Sea Certification of seafood products from sustainable fisheries and aquaculture The organisation Founded in 2008, Friend of the Sea is committed to improving the global sustainability
Present Status of Off-shore Fishery Resources and Information on Tuna Fishery in MYANMAR.
 Special Meeting on Improvement of Tuna Information and Data Collection in the Southeast Asia 7-9 September, 2011. Songkhla Province, Thailand. Present Status of Off-shore Fishery Resources and Information
SCIENTIFIC COMMITTEE SECOND REGULAR SESSION August 2006 Manila, Philippines
 SCIENTIFIC COMMITTEE SECOND REGULAR SESSION 7-18 August 2006 Manila, Philippines ANNUAL REPORT, Part I Information on Fisheries, Research and Statistics FIJI ISLANDS August, 2006 WP X-SC2 Fiji tuna fisheries
First Ever Estimate of Cod Fishery in 1850s Reveals 96% Decline on Scotian Shelf
 Tuesday, March 1, 2005 www.coml.org Contacts: Terry Collins, +1-416-538-8712 Darlene Trew Crist, +1-401-295-1356, Sara Hickox, +1-401-874-6277 First Ever Estimate of Cod Fishery in 1850s Reveals 96% Decline
DRAFT REPORT. EN United in diversity EN. European Parliament 2017/2120(INI)
") European Parliament 2014-2019 Committee on Fisheries 2017/2120(INI) 19.12.2017 DRAFT REPORT on the state of play of recreational fisheries in the European Union (2017/2120(INI)) Committee on Fisheries
European Parliament 2014-2019 Committee on Fisheries 2017/2120(INI) 19.12.2017 DRAFT REPORT on the state of play of recreational fisheries in the European Union (2017/2120(INI)) Committee on Fisheries
EFFECTS OF IMPORT AND INVENTORY AMOUNTS ON CHANGES IN WHOLESALE PRICES OF SALMON IN JAPAN
 EFFECTS OF IMPORT AND INVENTORY AMOUNTS ON CHANGES IN WHOLESALE PRICES OF SALMON IN JAPAN Ikutaro Shimizu National Salmon Resources Center, ikutaro@salmon.affrc.go.jp ABSTRACT Japanese salmon fishery is
SOMALIA National Report to the Scientific Committee of the Indian Ocean Tuna Commission, 2015
 SOMALIA National Report to the Scientific Committee of the Indian Ocean Tuna Commission, 2015 Authors Ministry of Fisheries & Marine Resources Federal Republic of Somalia INFORMATION ON FISHERIES, RESEARCH
YELLOWFIN TUNA (Thunnus albacares)
") WETJENS DIMMLICH / W FACTSHEET APRIL 2015 WF SFI Smart Fishing Initiative (SFI): species overview YELLOWFIN TUNA (Thunnus albacares) Region: Indian Ocean IOTC status 2014: not subject to overfishing [1]
WETJENS DIMMLICH / W FACTSHEET APRIL 2015 WF SFI Smart Fishing Initiative (SFI): species overview YELLOWFIN TUNA (Thunnus albacares) Region: Indian Ocean IOTC status 2014: not subject to overfishing [1]
Change, Challenges and Opportunities for Wild Fisheries
 Change, Challenges and Opportunities for Wild Fisheries Gunnar Knapp Professor of Economics University of Alaska Anchorage September 2002 This is a slightly modified version of a presentation which I gave