The Marine Economy & the Regional District of Mt. Waddington in BC
|
|
|
- Shannon Bruce
- 6 years ago
- Views:
Transcription
1 The Marine Economy & the Regional District of Mt. Waddington in BC Prepared for: Living Oceans Society & Regional District of Mt. Waddington Funded by: Environment Canada Under the Project K5A Quantifying Nature s Bounty: The Contribution of Marine Ecosystems to Local Communities Prepared by: Vancouver, Canada March 2011
2 Introduction Summary the study identifies the economic importance of a wide range of private sector marinebased activities on the economy of the Regional District of Mount Waddington (RDMW) which is located on the Northern portion of Vancouver Island. The study demonstrates the linkages between the economic livelihoods of people, businesses and communities to the marine environment. the study involved interviews with 87 individuals - 54 from a special Marine Recreation Business Survey (23 sport fishing, 31 other businesses) and 33 from targeted interviews with other business, government & First Nations - as well as review & synthesis of existing information/data. the focus is the economic measures and employment accruing to individuals living in RDMW i.e., RDMW residents. Results the marine industries generate $48 million in wages & benefits and 1,160 person-years of employment directly to RDMW residents from the following activities (see Exhibit A). Direct Industry Impacts* Wages & Benefits $ million Employment person-years or PYs Commercial Fisheries Aquaculture Marine Recreation - Sport Fishing Other Marine Transport Total ,160 multiplier effects from indirect supplier impacts and from induced consumer respending impacts on the retail sector add another $7.2 million in wages & benefits and another 180 person-years of employment to the tally - total impacts therefore are $55.2 million in wages and 1,340 person years employment. 2 in 7 private sector person years of employment in the RDMW is attributable to the marine sector. the influence of the ocean on the lives and livelihoods of RDMW residents is more pervasive than indicated by these market-based economic measures. The ocean is integral not just to the economy, but also to the culture, way of life, and collective identity of the region. The ocean environment provides significant benefits to First Nations through seafood harvesting activities. The ocean also provides key ecosystem services that underpin many of the identified industries and make coastal life as we know it possible. Conclusion clearly the influence of the marine environment on the lives and livelihoods of residents of the RDMW is profound. this is an important study as, for the first time, the wages & employment accruing to local residents alone from the marine environment are identified for a particular region in British Columbia. Page i
3 Exhibit A: Direct Contribution of Marine Sectors to RDMW Economy 2009 Aquaculture $3.3 $11.1 $4.8 $19.2 million wages person-years employment Commercial Fisheries $ $2.6 $3.1 $8.3 million wages person-years employment Marine Recreation $7.2 $8.0 million wages person-years employment Marine Transport 110 $7.5 $7.5 million wages 110 person-years employment Sport Fishing $4.6 $5.0 million wages person-years employment Primary Activity Secondary Processing Direct Supplier Note: 1. Total BC direct impacts - $48.0 million in wages & 1160 person-years of employment. 2. Marine Recreation - excludes sport fishing. 3. Marine Transport - includes ferries, tugs & water taxis, and forest sector ship loading etc. Page ii
4 Preface The Living Oceans Society (LOS) and the Regional District of Mount Waddington (RDMW) retained to analyze economic impacts of certain ocean-related activities on the economy of the Regional District. The consultant has benefited from discussions with industry, government, and others. Notwithstanding this assistance, the analysis and conclusions are those of the consultant alone. The Living Oceans Society and the Regional District of Mount Waddington provided the seven maps included as Appendix E of the report. The first four maps by the LOS were based on spatial information collected during the study. Page iii
5 Acronyms AHRT - Additional Hotel Room Tax BC - British Columbia DFO - Canada Department of Fisheries & Oceans FN - First Nation FSC - Food Social Ceremonial LOS - Living Oceans Society MOE - BC Ministry of Environment PY - person-year RD - Regional District RDMW - Regional District of Mount Waddington SWOT - Strengths, Weaknesses, Opportunities, Threats Page iv
6 Table of Contents Summary... ii Preface... iii Acronyms... iv 1.0 Introduction Food, Social & Ceremonial Aboriginal Fisheries Commercial Fishery Aquaculture Ocean Recreational Fishing Ocean Recreation/Leisure Ocean Transport Synthesis & Conclusions Bibliography Appendix A: Interviews & Surveys Appendix B: Background - Commercial Fishing Appendix C: Background - Sport Fishing Appendix D: 2006 Census Data Appendix E: Maps Table of Contents
7 1.0 Introduction The economy of the Regional District of Mount Waddington (RDMW) on Northern Vancouver Island is highly dependent on the marine environment. This fact, however, is not well known. The result is that the people, businesses and communities dependent on the ocean for livelihoods can get eclipsed by other economic sectors that can more coherently assert their importance. This study identifies the economic importance of a wide range of private sector marine-based activities such as the seafood industry, marine recreation and the like. Such analysis can help engender understanding of the importance of these sectors and the underlying ocean environment to the wellbeing of Mount Waddington residents. The RDMW Study Area The map at the end of this section gives the RDMW land area including the northern portion of Vancouver Island, the adjacent mainland area plus intermediary islands. The marine environment around the RDMW corresponds to Canada Department of Fisheries & Oceans (DFO) Statistical Areas 11, 12 and 27. The total 2006 population of the RDMW, according to the 2006 Census of Canada, was 11,650 people with 23% or 2,730 comprising aboriginal people. The employment base or level in the Regional District (RD) was 5,890. Study Objectives & Focus The study objective is to identify the contribution of particular marine-based businesses to the economy of the RDMW thereby demonstrating the linkages between the economic livelihoods of people, businesses and communities to the marine environment. The particular sectors identified for analysis are: aboriginal fisheries; commercial fisheries (harvesting, processing plus certain supply sector activities); aquaculture (growout processing plus certain supply sector activities); recreational fishing (lodges plus charters plus independent angling); marine recreation (marine tourism operators plus independent marine recreation); marine transport (the ferry system plus tugs/barges plus forest sector transport). For each sector, the study produces three economic indicators: 1) revenues, 2) wages, and 3) employment in person years for the year 2009 (although some variance from this is required for aboriginal fisheries). A person-year is adopted as the employment measure so that seasonal employment can be converted to an annual basis equivalent to year-round jobs e.g., one 8-month job plus one 4- month job equals one person-year of employment. The focus of the study is the economic measures accruing to Mt. Waddington interests. For example, if a marine business operating in the RDMW has workers drawn from outside the RD then these workers are not included in the local employment figures. Only employment to RDMW residents is included. Page 1
8 Information Sources The study involved both primary (interview) and secondary (literature review) research including: a review of studies & data sources profiling the marine sectors under consideration including spatial data e.g., salmon farm site location special tabulations of commercial fisheries data by Canada Department of Fisheries and Oceans (DFO) and of aquaculture data by BC Ministry of Environment (MOE) farmed salmon company purchase records for businesses located in RDMW an interview program with 33 representatives of marine businesses, government, and First Nations including a four day trip to conduct interviews in Port Hardy, Port McNeill, Campbell River, and Victoria The Marine Tourism Survey In addition, a key information source was a special survey of sports fishing and other marine tourism businesses. This survey was needed because, unlike the commercial fishing and aquaculture sectors for example, administrative data to profile marine sector output and revenues do not exist. The Living Oceans Society (LOS) provided an initial list of businesses - then we eliminated businesses that were closed or non-tourism businesses and added several other businesses. Marine Tourism Survey No. Identified No. Interviewed Sport Fishing Charters & Lodges % Other Marine Tourism* % % e.g., whale watching, scuba diving, sea kayaking, marine resorts, water taxis, etc. Cooperation to the survey was exceptional with interviews completed for 92% or 54 of the 59 businesses identified - there were no refusals. Those not interviewed were individuals that could not be contacted e.g., some resorts in the Broughton Archipelago area could not be contacted as they operate only seasonally with the owner-operators moving to Southern Canada in winter. Appendix A presents lists of those interviewed - both the 33 general marine businesses plus the 54 marine tourism businesses (as well as the Interview Guide for the marine tourism survey). Report Outline The next section presents an analysis of aboriginal fisheries by bands located in the RDMW Study Area. It is the first of the remaining six (6) sector profiles in the report. Each profile follows a similar format, 2 pages of text following by a data table or exhibit. Several appendices provide supplemental material e.g., Appendix D compares the RDMW economy to the provincial economy, Appendix E gives several maps provided by the LOS and the RDMW that document region of activity. The terms ocean and marine are used interchangeably in the report. All dollar figures are presented in nominal or current dollars and refer to activity for the year 2009 unless otherwise stated. Page 2
9 Mount Waddington B Mount Waddington B Mount Waddington C Mount Waddington D Mount Waddington A Mount Waddington Regional District X-X Fisheries and Oceans Canada Statistical Areas km
10 2.0 Food, Social & Ceremonial Aboriginal Fisheries The aboriginal people of British Columbia use the fish and shellfish resources from the marine environment for Food, Social & Ceremonial (FSC) use. Harvests of fish and shellfish provide an important source of food to aboriginal people. The harvesting activities also provide very important social and cultural benefits: Distribution - sharing of food among an extended family and the economy Cultural expression and continuity - providing linkages to traditional lifestyles and ancestors, providing intergenerational transfer of knowledge Socialization - integrating young people into work roles and the economy The ensuing analysis focuses on the food value alone of FSC activities in the RDMW. Activities in the RDMW Ten aboriginal bands with a 2009 population of 5,062 people - 2,403 on reserve and 2,659 off reserve - are located in the RDMW (see Exhibit 1). The bands harvest a variety of salmon, groundfish and shellfish using net, hook & line, trap and hand gear. Often a large boat, for example a seine boat, will harvest the fish on behalf of the band. The band then will distribute the fish to elders and others in the communities. Some bands without access to suitable fishing vessels will arrange for another band to harvest fish on their behalf. The FSC fish is used for home consumption as well as community feasts. The fish can be consumed canned or jarred, fresh, smoked, dried or frozen. As well, band members will ship jarred fish, and sometimes fresh fish, to band members living off reserve in southern BC. Output & Values Fisheries & Oceans Canada provided, on a confidential basis, FSC catch information for several bands in the RDMW (primarily the larger bands) - the population of these bands comprise over three quarters of the RDMW band population total. We then made adjustments to the data to extrapolate the information to a reasonable RD total for FSC catch for all bands. The harvest of FSC fish can vary greatly from year to year depending on the availability of fish particularly salmon. For example, the total weight of FSC fish harvested in 2010 was more than three times that in 2009 due to a huge 2010 return of sockeye salmon. We value the FSC catch at the wholesale value of equivalent fish caught in the commercial fishery. Our interviews suggest that, in times of FSC harvest shortages, some First Nation people will purchase fish directly from commercial fishermen or purchase fish from retail stores - the wholesale value lies partway between the fishermen or landed value and the retail value. Page 3
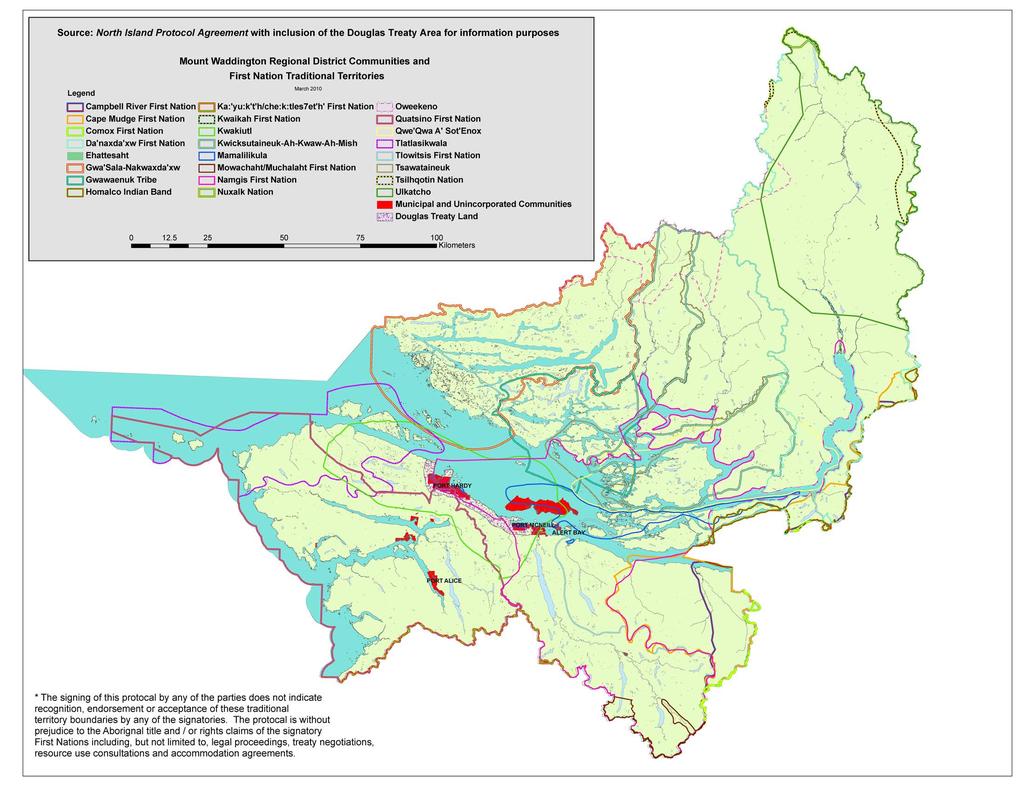
11 The FSC catch and equivalent food value then is (see Exhibit 1): approximately 59,600 kg of fish & shellfish in 2009 and 219,800 kg of fish & shellfish in 2010 approximately $0.4 million of food value in 2009 and $1.8 million of food value in 2010 Species Group Weight kg Food Value $ Salmon 27, , ,547 Groundfish 26,600 18, Shellfish 5,500 4, , , ,753 The figures represent kg of fish, depending on the year, for each on reserve aboriginal person. No employment or wages are ascribed to FSC activities since these activities are not commercial in nature. However, we note that the majority of aboriginal people living in the RDMW, numbering about 2,500, benefit through the distribution of fish and participation in community feasts. We emphasize that the value is an incomplete value as it does not include the important social and cultural benefits of FSC harvesting and processing activities. We also emphasize that the above estimates should be viewed as illustrative - there is considerable uncertainty and data issues as to FSC catch reporting. Subregional Activity The majority of FSC harvesting activities occur in Statistical Area 12 although harvests are drawn from Statistical Areas 11 and 27 as well - see Exhibit 1. We note that other bands located outside the RDMW, such as the A-tlegay Fisheries Society based in Campbell River, can conduct FSC harvesting activities in Statistical Areas 11 and 12 (i.e., the FSC catch figures reported do not comprise total FSC harvests by all BC bands in Statistical Areas 11, 12 and 27). The first and last maps of Appendix E document the location of First Nations and their traditional territories respectively. Page 4
12 Exhibit 1: Local RDMW Marine Related Activity - FSC Fisheries A) Aboriginal Bands in RDMW 2009 Population Band & Number Nearby On Reserve & Statistical Location on Crown Land Off Reserve Total Areas Fished 1. Da Naxda xw FN (635) Alert Bay Gwa Sala-Nakwaxda xw (724) Port Hardy ,11,12 3. Gwawaenuk Tribe (627) Port Hardy <20 <20 < Kwakiutl (626) Fort Rupert Kwicksutaineuk (625) Alert Bay Mamalilikulla (629) Village Island Namgis FN (631) Alert Bay , Quatsino (633) Coal Harbour ,12,27 9. Tlatlasikwala (632) Port Hardy Tsawataineuk (632) Kingcome Inlet ,403 2,659 5,062 Source: Indian & Northern Affairs Canada, Registered Indian Population by Sex and Residence 2009, B) Estimated Weight & Food Value of FSC Catch by RDMW Aboriginal Bands Weight round kg Food Value $000 $ per kg Species Salmon - Chinook Sockeye 8, , ,513 - Coho 1, Pink 16,800 5, Chum 500 1, Groundfish - Halibut 18,500 14, Yelloweye 6,100 2, Other 2,000 2, Shellfish Clams 2, Crabs 2,600 2, Prawns Total 59, , ,753 Source: Weight - GSGislason estimates based on raw, incomplete FSC harvest data reported to DFO. $ per kg - GSGislason estimates based on MOE Seafood Industry Year in Review data. Page 5
13 3.0 Commercial Fishery The commercial (wild) fishery is a renewable resource extraction, processing, and food distribution industry that produces a variety of protein products that are distributed throughout the world. The industry is diverse in terms of the species harvested, harvesting gear employed, products, and domestic and export markets penetrated. Activities in the RDMW RDMW residents hold a total of 403 commercial fishing licences for salmon, herring, groundfish and shellfish - see Exhibit B.1, Appendix B - with close to a quarter of these comprising clam hand harvesting licences. The commercial fishing industry involves several linkages or activities between the aquatic environment and the final consumer. Our definition of the industry includes: Harvesting - commercial fishermen harvest salmon, herring, groundfish, and shellfish using a variety of nets (seine, gillnet, trawl), hooks and lines (troll, longline), traps, diving techniques, or other gear Processing - raw fish and shellfish reach commercial processors via packing by sea to processing plants, custom unloading at transhipment points, and trucking. Commercial processors then transform raw fish and shellfish into a variety of live, fresh whole, frozen whole, fillet, steak, smoked, canned, roe, and other products Marketing - the selling and distribution of processed products through wholesale and retail food channels The value of the product at the time of harvest, but before processing, is called landed value. The value of the product after processing is called wholesale value. The value of the product at the retail level for product sold domestically, or at the border for product exported, is called market value. Almost all the fish landed or processed in RDMW is sold to southern BC, other Canadian, or international markets i.e., only a small amount is consumed within the RDMW. For this reason, we concentrate on RDMW economic activity tied to fishing and processing operations. Keltic Seafoods in Port Hardy has a large processing facility - the plant does primarily custom unloading but also does some custom processing. The Keltic plant also has a reduction plant for conversion of fish offal into meal and oil. Hardy Buoys of Port Hardy also does some custom processing of wild-caught fish. And Scarlett Point Seafoods with an office in Port Hardy is a fish broker. Port Hardy is a major landing point for commercially caught fish - especially for trawl-caught groundfish. The fish is offloaded from vessels and trucked to Southern BC destinations for processing (see GSGislason 2010). Page 6
14 Revenues The local fishing fleet in 2009 caught $7 million worth of fish, had a wage bill of $2.0 million and generated 90 person-years of employment (see Exhibit 2 at end of this Section). More fishing jobs and wages were generated by local residents gaining positions on non-rdmw owned vessels, an estimated 20 person-years of employment and $0.6 million in wages. The 110 person-years of fishing employment is much less than the total number of fishing jobs in the RDMW due to the seasonal nature of the vocation (DFO reports that 322 RDMW residents had a Fisher Registration Card in see Exhibit B.1, Appendix B). As discussed before, fishing employment is augmented significantly by processing plant employment and by employment in businesses supplying goods & services to fishing vessels and processing plants. Local Economic Impacts The local RDMW economic impacts from the commercial fishing industry in 2009 are: $8.3 million in local wages & benefits, and 305 person-years of employment Two out of every three wage dollars and two out of every three person-years of employment come from processing and supplier activities as opposed to fishing activities (see Exhibit 2). Employment in fishing and fish processing is about 3-4% of the provincial totals. Commercial Fishing Businesses Wages & Benefits $ million Employment PYs Seafood Companies - Fishing Processing Supplier Companies TOTAL The wage bill and employment figures for the fishing component would have been higher in 2010 due to a huge return of sockeye salmon. Subregional Activity Fishing by RDMW licence holders occur along the whole coast e.g., a RDMW commercial roe herring licence holder may fish in the Strait of Georgia near Comox (there are no roe herring fisheries in Statistical Areas 11, 12 or 27). Most of the fish caught by local boats, except for salmon, would be caught in waters outside Statistical Areas 11, 12 or 27. The community location of commercial licence holders is given in Exhibit B.1, Appendix B and displayed visually in the second map of Appendix E. Industry suppliers are located primarily in Port Hardy. Page 7
15 Exhibit 2: Local RDMW Marine Related Activity - The Commercial Fishery A) Fishing 2009 Landed Value $000 Wages $000 Employment PYs Local Boats Salmon 1, Herring Groundfish & Other Finfish 3, Shellfish 1, Total 7,000 2, B) Local RDMW Activity 2009 Local Activity Value/Exp $000 Wages $000 Employment PYs Direct Industry Fishing - Local Boats 7,000 2, Southern Boats NA Processing (inc. offloading at Keltic) NA 2, Subtotal NA 5, Direct Suppliers Offloading (exc. Keltic) 1, Trucking 2, Fuel 4, Supply & Services* 3,000 1, Subtotal 10,800 3, Total Local Activity NA 8, Source: Estimates based on interviews, material in Appendix B and Economic Impacts from a Reduced Groundfish Trawl Fishery in British Columbia, June * Marine hardware, electronics, food stores, engine repair etc. Page 8
16 4.0 Aquaculture Aquaculture is the growing of fish or shellfish in a controlled aquatic environment. Farmed fish and shellfish are reared from the egg/seed stage to a market-sized product. Akin to other farming industries, the aquaculture industry has significant control over the timing and quantity of product shipped to market. Activities in the RDMW The farmed finfish in the RDMW is almost exclusively Atlantic salmon - there is a very small amount of sablefish farmed (and no other species of salmon are farmed in the RDMW). In the RDMW there presently is no commercial shellfish farming although there is potential. The farmed salmon industry involves several linkages or activities between the aquatic environment and the final consumer. Our definition of the industry includes: egg to juvenile phase - the hatching and rearing of finfish from egg to juvenile phase growout phase - the rearing of product in the ocean to market size i.e., farming harvesting & processing - the harvesting and processing of grown fish into gutted whole fish, fillets, portions etc. marketing - the selling and distribution of the processed products The value of the product at the time of harvest, but before processing, is called farm gate value. The value of the product after processing is called wholesale value. The value at the retail level for product sold domestically, or at the border for product exported, is called market value. Almost all the farmed salmon grown or processed in RDMW is sold to southern BC, other Canadian, or international markets i.e., only a minute amount is consumed within the RDMW. For this reason, we concentrate on RDMW economic activity tied to growout and processing operations. Three companies grow Atlantic salmon in the ocean environment surrounding the Regional District of Mount Waddington - the companies are Marine Harvest, Mainstream Canada and Grieg Seafood. All three companies have provincial headquarters in the city of Campbell River which lies south of the RDMW on Vancouver Island. Live farmed salmon is loaded onto a marine transport or harvest boat, stunned and bled and delivered to the processing plant. Marine Harvest processes the output from RDMW farms as well as Campbell River area farms at the Port Hardy Processing Plant (PHPP), which they own, into gutted head-on whole fish and fillets. Some of this primary-processed fish is sold to Hardy Buoys, a smoking and value-added seafood processor in Port Hardy - but the vast majority of PHPP output is trucked to southern markets. Mainstream Canada and Grieg Seafood process their RDMW-grown salmon in Campbell River area plants. Foenix Forest Technologies Inc. in Port McNeill produces a compost for garden use from PHPP fish waste and forest bark (called Sea Soil ). Page 9
17 Output & Revenues In 2009 the three companies harvested 19,500 tonnes whole bled fish worth $100 million at the farm gate from 16 farm sites - see Exhibit 1. This 2009 production level was substantially less than in previous years due to biophysical conditions, corporate strategies as to the optimal time to harvest etc. The production level from the RDMW rebounded to 30,000 plus tonnes in The RDMW typically produces about 40 to 50% of total Atlantic salmon production in the Province. Including the added value from processing - the farm fish from the RDMW, the farm fish from sites near Campbell River outside the RD, and the Foenix composting operation - results in a value of $178 million for processed farmed fish in RDMW (figures derived from BC Ministry of Environment data). The farmed salmon companies spent $13.6 million directly at supply businesses located in RDMW - see Exhibit 3 (figures derived from purchase order data provided by the companies). Local Economic Impacts The local economic impacts of the aquaculture (farmed salmon) sector to RDMW in 2009 are: $178.3 million in revenues, $19.2 million in local wages & benefits, and 400 person-years of local employment. Farmed Salmon Business Revenue/ Expenditures $ million Wages &Benefits $ million Employment PYs Farmed Salmon Companies Supplier Companies 13.6* TOTAL NA * inc. in farmed salmon company revenues The farmed salmon company employment of 295 PYs refers to jobs filled by RDMW residents only (and excludes the approximately 140 jobs located in the RDMW but filled by workers who commute from Campbell River, Comox etc. outside the RD, and excludes head office jobs in Campbell River). Most farmed salmon jobs are full-time year round jobs. Subregional Activity Two thirds or more of growout activity occurs in the Broughton Archipelago area (Statistical Area 12) see fifth map of Appendix E for growout locations. All local processing occurs in Port Hardy. The breakdown of the local farmed salmon company workforce by community residence is approximately - 60% Port Hardy, 30% Port McNeill & Telegraph Cove and 10% other e.g., Alert Bay, Coal Harbour, Port Alice, Sointula. James Walkus Fishing and Cards Aquaculture, both located in Port Hardy, are significant marine transport and equipment suppliers respectively to the industry. Page 10
18 Exhibit 3: Local RDMW Marine Related Activity - Aquaculture A) Farm Production in RDMW Number of Farm Sites Number of Sites with Production Farm Production tonnes round 38,500 28,500 36,800 19,500 2 Farm Gate Value $ , , ,200 99,500 2 B) Local RDMW Activity 2009 Local Activity Value/Exp $000 Wages $000 Employment PYs Farming & Processing 178, , ,6 Supply Expenditures $000 5 Marine Transport & Trucking 5,750 1, Fuel R&M Supplies 3,800 1, Services 3,000 1, TOTAL 13,550 4, Total Local Activity NA 19, Source: MOE information plus salmon farming industry list of local RDMW suppliers plus interviews with salmon farming companies as to local employment levels. 1 Value at farm site before processing. 2 Farm production from RDMW was down & farm production from the Campbell River area was up in Wholesale value for farm product processed in RDMW (inc. farm production from Campbell River area), farm gate otherwise value. 4 Person-years (PY) employment - 50 hatchery & growout, 230 processing (inc. employment at Hardy Buoys and at Foenix), 15 logistics/other. 5 Expenditures/activities to business located in the RDMW. 6 Includes wages & employment accruing to RDMW residents only. Page 11
19 5.0 Ocean Recreational Fishing Angling is a form of outdoor recreation. Most anglers fish not only to catch fish but also to enjoy the broader recreational experience - the expectation and opportunity of angling. Activities in the RDMW The quality of the angling experience is affected by fish availability, fishing success rates, fish species and size, and several non-fish related factors, such as the environmental setting and camaraderie with other anglers. Angling activity is measured not in units of fish caught or harvested, but in angler-days - defined as one angler fishing for any part of a single day. Anglers may access a range of services to enhance their experience, or they may rely on their own resources. Despite its diversity, the angling experience can be classified into the following major categories: Lodges typically offer all-inclusive packages comprising accommodation, meals, boat and fuel, fishing equipment, and sometimes a fishing guide. Charters are angling packages that include boat, equipment and guide, but not usually accommodation or meals. Independent anglers are responsible for their own fishing gear, boat and fuel, accommodation, meals, and transportation. The RDMW is a prime angling location for local residents and visitors alike. The region offshore offers exceptional opportunities for salmon (chinook, coho, pink) and bottom fish (halibut, lingcod, yelloweye). With the decline in salmon abundance, specifically coho, in Georgia Strait many anglers have moved to the north end of Vancouver Island. And several new charter fishing and lodge operations have started in the region. Output & Revenues DFO Pacific Region has conducted a sport fishing creel survey in the RDMW Study Area for several years. However, the survey does not cover all months of the year, all parts of the study area and all types of recreational fishing - shore angling and shellfish harvesting are excluded, the survey covers only June through August. DFO also conducts a logbook program for lodges and charters but compliance is less than 100%. DFO Pacific Region estimates of RDMW Study Area angling effort has been about 24,000 angling boat trips in recent years for the June to August period (Exhibit C.1, Appendix C). This suggests an annual effort level of about 100,000 angler-days based on: 1) average of three anglers per boat, and 2) the 3 month period comprising 75% of annual activity i.e., sport fishing is very seasonal (but this 100,000 angler-day figure still does not cover all study area regions, and does not cover shore angling and shellfish harvesting). Page 12
20 DFO Ottawa conducts a comprehensive mail survey of licenced anglers every 5 years. Results for 2005 suggest total angling effort for the Johnstone Strait area of Vancouver Island of about 200,000 angler-days (Exhibit C.2, Appendix C), or double the annual activity level inferred from the DFO Creel Survey. For the purpose of our analysis we employ a 2009 activity figure for the RDMW of 175,000 angler-days which lies closer to the DFO mail survey estimate - we view this latter estimate as more reliable. Using the data in Appendix C, we generated the RDMW sport fishing sector profile of Exhibit 4 i.e., $55 million spent in BC from the 175,000 angler days in RDMW (the amount spent in the RD would be much less than this). For lodge and charter anglers, the figures include angler expenditures on travel, meals, accommodation, etc that do not flow through the tills of lodges and charters. Local Economic Impacts The local RDMW economic impacts from the sport fishery in 2009 are (Exhibit 4): $25.0 million in local expenditures, $5.0 million in local wages & benefits, and 120 person-years of employment (most sport fishing jobs are seasonal jobs). Sport Fishing Businesses Revenue/ Expenditures $ million Wages &Benefits $ million Employment PYs Direct Angler Suppliers to Lodges & Charters 2.0* TOTAL NA * inc. in lodges & charter revenues The figures were derived from the fishing lodge & charter survey conducted for this study (Exhibit 5 in Section 6 to follow), the background information in Appendix C, and professional judgement. The estimates include an allowance for economic activity related to local purchases by lodges and charters. The $25 million in local expenditures is about 4% of the BC total. Subregional Activity Fishing for salmon generally occurs closer to shore than fishing for halibut, lingcod or yelloweye groundfish. Area 27 off Quatsino Sound has exceptional fishing for halibut and other groundfish. Exhibit C.1, Appendix C displays the relative distribution of catch by species among Statistical Areas 11, 12 and 27 - over 60% of angling effort appears to occur in Statistical Area 12. The lodge & charter survey identified several specific fishing locations e.g., the North side of Malcolm Island, Blackfish Sound, Triangle Island, Double Bay, Cape Caution, offshore from Port Hardy Airport, Cracroft Point (see third map of Appendix E). Page 13
21 Exhibit 4: Local RDMW Marine Related Activity - The Sport Fishery A) RDMW Angler Activity Type of Angling Lodge Charter Independent All Angler-Days Angler Purchases in BC $ million Boats & Equipment Lodges & Charters Other Direct Costs All B) Local RDMW Economic Benefits Type of Angling Lodge Charter Independent All Local Expenditures $000 Boats & Equipment 0 0 5,000 5,000 Lodges & Charters 8,000 2, ,000 Other Direct Costs 2,000 1,000 7,000 10,000 All 10,000 3,000 12,000 25,000 Local Wages $000 Boats & Equipment Lodges & Charters ,200 Other Direct Costs ,800 2,600 All 1,000 1,000 2,600 4,600 Local Employment PYs Boats & Equipment Lodges & Charters Other Direct Costs All Source: Derived from Marine Tourism Survey (reported in Exhibit 5, Section 6) and information in Appendix C. Page 14
22 6.0 Ocean Recreation/Leisure The ocean-based recreation sector is very difficult to analyze in that it does not fit into a grouping of (supply side) industries - rather the recreation sector encompasses a variety of consumer (demand side) activities/expenditures that are tied to the ocean environment. These activities include whale watching, ocean boating and sailing, surfing, scuba diving, kayaking, guided kayak trips, beach activities, marine park visitation and the like. Ocean-based recreation should not be restricted only to tourists. Non-tourists or locals comprise an important component of the overall ocean-based recreation sector. Activities in the RDMW The RDMW is a world class tourism and recreation destination. The region offers a variety of active and passive recreation opportunities ranging from kayaking, scuba diving, surfing and hiking to beachcombing & nature viewing. The region draws tourists from around the world including the US and Europe as well as Canada. Cape Scott Provincial Park located on the NW top of Vancouver Island is 22,200 hectares in size. In 2008 the North Coast Trail - a 43 km trail in the park from Shushartie Bay to Nissen Bight - opened. The U Mista Cultural Centre in Alert Bay provides museum tours, First Nations cultural performances and traditional First Nations meals for the visitors from the 4-5 pocket cruise ship arrivals each year. Individuals may use package operators who can provide transport, equipment, instruction/education, and sometimes meals and accommodation for recreation activities, or can undertake self-directed activities e.g. tourists undertaking activities on their own or local residents undertaking boating or other activities. Output & Revenues Unfortunately there are no figures available as to ocean-related recreation user days for the RDMW Study Area. In fact, there are no overall tourism statistics, ocean related or non-ocean related, for the region. However, a recent study indicated that outdoor recreation participation rates for Vancouver Island residents 18 years of age or older were - 47% oceanside beach activities, 32% whale watching/other marine wildlife viewing, and 30% motorized boating in the ocean (BC Tourism Trade & Investment pers. comm.). The economic study of the importance of the ocean to the BC economy suggested that: 1) the revenue/value of ocean-related recreation for total BC in 2005 was $3.8 billion (this included saltwater angling, cruise ship and ferries spending), and 2) the Vancouver-Island share of the total was approximately 50% or $1.9 billion (GSGislason 2007 p.26-27). Our discussions with tourism representatives and our professional judgement suggest that the RDMW Study Area should comprise about 4% of the Vancouver Island total or $75 million (4% is about double the RDMW share of Vancouver Island population - see Exhibit D.1, Appendix D). This figure includes saltwater angling in the area as well as ferries and cruise tourism - angling expenditures are estimated at $25 million (see Section 5), ferry expenditures are estimated at $5 million (see Section 7 following), and cruise tourism to Alert Bay is less than $0.1 million. Page 15
23 The remaining ocean recreation expenditures then are $45 million broken out as: marine tourism package businesses - $20 million other recreation expenditures - $25 million The $20 million package figure comes from our Marine Tourism Survey (see Exhibit 5 next page), with a 30% allowance for additional businesses not covered by our interview program. The other $25 million in expenditures represent self-directed ocean recreation activities. Local Economic Impacts The local RDMW economic impacts from the ocean or marine recreation sector then is: $45 million in local expenditures, $8.0 million in local wages & benefits, and 225 person-years of employment (most marine recreation jobs are seasonal). The $45 million is 2% of the provincial total of $2.4 billion that excludes angling, ferries and cruise. Sector Type Revenue/ Expenditures $ million Wages &Benefits $ million Employment PYs Ocean Recreation - Packages Other Suppliers to Package Providers 4.0* TOTAL NA * inc. in package operator revenues The figures were derived from the Marine Tourism Survey conducted for this study (Exhibit 5) as well as information from the provincial report on ocean recreation (GSGislason 2007) and professional judgement. We also added an estimate for local activity arising from suppliers to package operators (20% of package operator revenue). Subregional Activity The Marine Tourism Survey identified some specific regions for ocean recreation activities. Activity Location Activity Location Activity Location 1. Whale watching Robson Bight entrance to Knight Inlet Malcolm Island 2. Bear watching 3. General viewing Glendale Cove (in Knight Inlet) Scott Islands Group Kelsey Bay Hope Island 4. Kayaking Echo Bay Nigei Island God s Pocket Nuchatlitz Inlet 5. Diving Browning Wall Hurst Island Stubbs Island 6. Surfing Cape Scott 7. Marine Resorts Telegraph Cove Sullivan Bay Echo Bay Kwatsi Bay Jennis Bay Tribune Channel The above regions are illustrative as there are literally hundreds or even thousands of locations for recreation opportunities in the RDMW (see fourth map of Appendix E for some locations). Page 16
24 Exhibit 5: RDMW Marine Tourism Survey Sport Fishing Businesses Other Marine Tourism Businesses Lodges Charters Resorts Viewing 1 Activities 2 Resorts 3 Transport 4 No. Respondents Revenues $000 4,000 1,100 2,300 7,500 1,300 3,900 2,600 Wages & Employment Wages $000 1, , Jobs Employment PYs Local Wages & Employment Local Wages $ Local Jobs Local Employment PYs Season Main Months mid June to Sept May to Sept May to Sept Whales - late June to Sept Kayak - June to Sept May to Sept May to Sept Bears & Other - May to Sept Scuba - Mar to Oct Source: Marine Tourism Survey conducted for this study (see Interview Guide in Appendix A). 1 3 whale watching, 3 bear viewing & 4 general nature viewing businesses. 2 3 kayaking, 4 scuba diving & 1 surfing businesses. 3 1 Vancouver Island resort, 3 small marine resorts in Broughton Archipelago plus 1 large resort complex in Port Hardy. 4 5 water taxi & 3 air charter businesses. Page 17
25 7.0 Ocean Transport The ocean transport sector in principle, includes ferry services, international ports & shipping as well as coastal shipping. The sector also includes the wide variety of ocean transport support services required such as tugboats and water taxis. Activities in the RDMW There are two important marine transport activities within the RDMW: 1) an extensive ferry system, and 2) a group of tugboats, water taxis etc. that move supplies and people. We also include marinerelated operations of the forest industry in the ocean transport sector. The ferry system in the RDMW operated by BC Ferries has three routes (BC Ferries 2009/10 Annual Report): Route #10: Bear Cove in Port Hardy to Bella Bella to Prince Rupert /10 tariff revenue of $9.5 million from 13,600 vehicles and 42,800 passengers Route #25: Alert Bay to Sointula to Port McNeill /10 tariff revenue of $1.6 million from 91,200 vehicles and 247,100 passengers Route #40: (seasonal) from Bear Cove in Port Hardy to Mid Coast /10 tariff revenue of $1.5 million from 2,500 vehicles and 7,700 passengers The Route #25 ferry travels exclusively within RDMW waters whereas the other two routes have Port Hardy as the southern terminus. A group of tugboat/barge and water taxi companies provide service to the forest industry, to other business sectors, and for community resupply in remote locations such as the aboriginal community in Kingcome Inlet. The Neucel Specialty Cellulose Ltd. plant in Port Alice has part of its workforce devoted to loading and unloading ships. Revenues We ascribe the following revenues to RDMW from ferry, tugboat/water taxi, and forestry operations: $5 million from ferry tariff revenue, and another, $4 million from tugboat & water taxis, and $14 million from the marine component of forestry operations. The $5 million ferry tariff revenue total is less than the sum of the route revenues above since, apart from the local Route #25, the revenue needs to be split among different regions of the coast. We estimate a $4 million tug & water taxi revenue base from our interviews (this figure excludes tug & water taxi revenues attributable to salmon farming and ocean recreation sectors). Page 18
26 The $14 million revenue from forestry is derived from the assumption that revenue per employee is $350,000 (per GSGislason 2007a, p. C-2). Local Economic Impacts The local RDMW economic impacts from the marine transport sector are: $23 million in local revenues, $7.5 million in local wages & benefits, and 110 person-years in local employment. RDMW impacts are about 3% of the provincial totals. Marine Transport Sector Revenues $ million Wages &Benefits $ million Employment PYs Ferries Tugs & Water Taxis Forestry TOTAL The Route #10 and #40 ferries have a shift rotation of 2 weeks on-2 weeks off and accordingly workers can come from all over coastal BC. We estimate that 50 person-years of local RDMW employment is attributable to the three ferry routes in total. The figures for tugs & water taxis - predominantly attributable to tugs - are estimates derived from the general interviews conducted for this study. Forest sector employment tied to the marine environment is estimated at 40 person-years - 2% of about 900 logging jobs (for log sort), 5% of about 100 wood products manufacturing jobs (for dewatering functions and loading vessels), and 5% of 400 pulp & paper manufacturing jobs at Neucel (for loading ships). The logging and wood products job counts come from the 2006 Census for RDMW - see Appendix D. Subregional Activity The region of operation for the ferries is defined from the ferry routes. Tugs and barges serving the forest industry can operate throughout the RDMW. As well, some operators serve Central Coast forestry operations which are outside the RDMW. The Neucel pulp plant is located in Port Alice. Page 19
27 Exhibit 6: Ferry System Profile North Island 2009/10 #10 Year Round Bear Cove to Prince Rupert 2009/10 Ferry Routes #25 Year Round Alert Bay-Sointula-Port McNeill #40 Seasonal Bear Cove to Mid Coast Traffic Counts No. of Vehicles 13,600 91,200 2,500 No. of Passengers 42, ,100 7,700 Financial $ million Operating Revenue* Operating Costs Total Employment** Ferry Crew* 40/ Relief/Casual/Seasonal inc. under Route #10 Ground 2 2 inc. under Route #10 Source: BC Ferries Annual Report 2009/10 plus interviews with BC Ferries. * operating revenue = tariff revenue + ancillary revenue + social program fees + contracted routes fees. ** employment is not necessarily RDMW residents (we estimate RDMW employment to be 50 person-years). Route #10-40 (2 watches of 20) in winter & 60 (2 watches of 30) in summer. Route #25-3 watches of 7 people. Route #40-2 watches of 29 people. Page 20
28 8.0 Synthesis & Conclusions This study has documented the important linkages between the marine environment and the economy of the RDMW of Northern Vancouver Island. The study has demonstrated that the contribution of the ocean to the economic livelihoods of the people, businesses and communities of the area is large and broadly based. The Exhibit 7 following can be summarized as: RDMW Marine Sector Impacts Wages & Benefits $ millions Employment person-years Direct Industry Impacts ,160 Multiplier Impacts* Total Impacts ,340 * indirect suppliers & induced consumer respending. The 1,340 employment count does not include local DFO and other public sector employees with ocean-related duties (including these likely would add less than 5% to the count). Significant information gaps existed in analyzing each marine sector, but problems were most acute for the ocean recreation sector. The Marine Tourism Survey provided valuable data and insight. The 2006 total employment level of the RD from the Census of Canada was 5,890 - split approximately 20% public sector on education, health care, governments, and 80% private sector (see Appendix D). The marine-based economy of RDMW with its 1,340 person-years of employment therefore generates approximately 28% of all private sector employment, or 2 in 7 jobs, in the RD. The economies of Port Hardy, Port McNeill, Telegraph Cove, Alert Bay and Sointula are intimately tied to the ocean environment. The influence of the ocean on the lives and livelihoods of RDMW residents is more pervasive than indicated by these market-based economic measures. The ocean is integral not just to the economy, but also to the culture, way of life, and collective identity of the region. The ocean environment provides significant benefits to First Nations through seafood harvesting activities. The ocean also provides key ecosystem services that underpin many of the identified industries and make coastal life as we know it possible. For example, in our interviews and in the Marine Tourism Survey we asked individuals the importance of a healthy marine environment to their business. The view was unanimous, except for certain businesses servicing the forest industry, that a healthy ocean was critical to business viability. In conclusion, the influence of the marine environment on the lives and livelihoods of residents of the Regional District of Mount Waddington is profound. Finally, one should note that this study is groundbreaking and unique in that, for the first time, the contribution of the marine economy to a region s actual employment level has been estimated i.e., the employment includes only permanent residents of the region. The study therefore can serve as a prototype for future regional marine sector studies in the Province. Page 21
29 Exhibit 7: Local RDMW Nature Related Activity - Summary Wages & Benefits $ million Employment person-years or PYs Direct Industry Impacts* Commercial Fisheries Aquaculture Marine Recreation - Sport Fishing Other Marine Transport Total ,160 Indirect & Induced Multiplier Impacts** Total Impacts ,340 * this report. ** indirect supplier & induced consumer spending - GSGislason estimates based on Horne (2009) and judgement. Page 22
30 Bibliography BC Ministry of Environment, Seafood Industry Year in Review, Annual. BC Stats, Census of Canada. British Columbia Ferry Services Inc., Annual Report to the British Columbia Ferries Commission - Year Ended March 31, 2010., British Columbia Seafood Sector and Tidal Water Recreational Fishing: A Strengths, Weaknesses, Opportunities and Threats Assessment (SWOT), Prepared for BC Ministry of Agriculture, Food & Fisheries, February Gislason, Gordon and David Egan, The British Columbia Farmed Salmon Industry - Regional Economic Impacts, Prepared by the ARA Consulting Group Inc., December 1994., Regional Benefits of Small Craft Harbours - North Vancouver Island, Prepared for DFO Pacific Region Small Craft Harbours Branch, March 2005., Economic Contribution of the Oceans Sector in British Columbia, Prepared for the Canada/British Columbia Oceans Coordinating Committee, April 2007., Economic Impacts from a Reduced Groundfish Trawl Fishery in British Columbia, Prepared for BC Ministry of Environment, June Horne, Garry, British Columbia Local Area Economic Dependencies 2006, Prepared for BC Stats, March Indian and Northern Affairs Canada, Registered Indian Population by Sex and Residence Nelson Bros Fisheries Ltd., Pacific Commercial Fishing Fleet - Financial Profiles for 2007, Prepared for Canada Fisheries & Oceans, 29 April Page 23
31 Appendix A Interviews & Surveys Page 24
32 Exhibit A.1: Interviews - Marine-Related Business, Government & First Nations Name Activity/Affiliation Business Location 1. Alert Bay Harbour Authority harbour Alert Bay 2. Alert Bay Towing tugboats & barges Alert Bay 3. Archipelago Marine Research Ltd. commercial catch monitoring Victoria 4. Aquatrans trucking Greater Vancouver 5. BC Ferries-Headquarters ferries Victoria 6. BC Ferries-North Island ferries Port McNeill 7. BC Ministry of Environment seafood statistics Victoria 8. BC Tourism Trade & Inv marine recreation Victoria 9. Cards Aquaculture farmed salmon equipment Port Hardy 10. DFO-North Island FSC catch statistics Port Hardy 11. DFO-Pacific Region commercial fishing licences Vancouver 12. Foenix Forest Technologies Inc. fish waste - forest bark compost Port McNeill 13. Fort Rupert Band FSC fisheries Port Hardy 14. Grieg Seafood farmed salmon growout Campbell River 15. Hardy Buoys seafood processor Port Hardy 16. James Walkus Fishing Ltd. farmed fish transport Port Hardy 17. Keltic Seafoods seafood processor Port Hardy 18. Mainstream Canada farmed salmon growout Campbell River 19. Marine Harvest-Headquarters farmed salmon growout & processing Campbell River 20. Marine Harvest-Operations farmed salmon growout Telegraph Cove 21. Namgis Band fisheries Alert Bay 22. Namgis Band FSC fisheries Alert Bay 23. Neucel Specialty Cellulose cellulose wood pulp Port Alice 24. Oban Ventures Ltd. farmed fish transport Victoria 25. Odd Grydeland Consulting farmed salmon consultant Campbell River 26. Petrocan fuel Port Hardy 27. Port Hardy Chamber of Commerce tourism Port Hardy 28. Port McNeill Chamber of Commerce tourism Port McNeill 29. Port McNeill Harbour Authority harbour Port McNeill 30. Ramsay, David hook & line groundfish fishermen Port McNeill 31. Scarlett Point Seafoods fish broker Port Hardy 32. Tourism Vancouver Island tourism Nanaimo 33. U Mista Cultural Centre museum Alert Bay Page 25
33 Exhibit A.2: Survey Interviews - Sport Fishing Operations Name Owner Location Type 1. Old Skipper Fishing Charters Coal Harbour charter 2. Castaway Marine Charters Port Alice 3. Rumble Beach Fishing Charters Port Alice 4. Bear Cove Cottages Port Hardy 5. Castle Point Charters Port Hardy 6. Free Spirit Charters Port Hardy 7. Sea Otter Charters Port Hardy 8. Starfish Charters Greater Vancouver 9. Tides & Tales Sport Fishing Port Hardy 10. Code 3 Charters Port McNeill 11. Leisure Suit Charters Port McNeill 12. North Island Fishing Adventures Port McNeill 13. Oli s Fishing Charters Comox 14. Timberland Fishing Charters Port McNeill 15. Codfather Charters Port Hardy 16. Chad s Coastwide Sport Fishing Greater Vancouver 17. Quatsino Lodge Comox lodge 18. Pacific Outback Resort Greater Vancouver 19. Sund s Lodge USA 20. Qualicum Rivers Winter Harbour Fishing Qualicum Beach 21. Alder Bay Resort Port McNeill resort 22. Telegraph Cove Resort Telegraph Cove 23. Cluxewe Resort Port McNeill Page 26
34 Exhibit A.3: Survey Interviews - Marine Tourism Operations (Non-Sport Fishing) Name Owner Location Type 1. Seasmoke Whale Watching Alert Bay whale watching 2. McKay Whale Watching Port McNeill whale watching 3. Stubbs Island Whale Watching Telegraph Cove whale watching 4. Knight Inlet Lodge Black Creek bear watching 5. Great Bear Nature Tours Port Hardy bear watching 6. Tide Rip Tours Comox bear watching 7. Quatsino Sound Tours Coal Harbour nature observation 8. Ocean Rose Coastal Adventures Coal Harbour nature observation 9. Nimmo Bay Resort Port McNeill nature observation 10. Hidden Cove Lodge Coal Harbour nature observation 11. Kingfisher Wilderness Adventures Port McNeill kayaking 12. Broughton Paddlers Inn Sointula kayaking 13. North Island Kayak Telegraph Cove kayaking 14. Browning Pass Hideaway Port Hardy diving 15. God s Pocket Resort Greater Vancouver diving 16. North Island Dive & Kayak Centre Port Hardy diving 17. Sun Fun Divers Port McNeill diving 18. Surf Nawalakw Port Hardy surfing 19. Greenway Sound Marine Resort Port McNeill marine resort 20. Jennis Bay Resort Jennis Bay marine resort 21. Kwatsi Bay Marina Kwatsi Bay marine resort 22. Cape Scott Water Taxi Port Hardy water taxi 23. Catala Charters Port Hardy water taxi 24. Palyn Water Taxi Port McNeill water taxi 25. Port McNeill Water Taxi Port McNeill water taxi 26. Silver Bay Ventures Port McNeill water taxi 27. Grizzly Helicopters Ltd. Port McNeill air tours 28. Pacific Eagle Aviation Port McNeill air tours 29. West Coast Helicopters Port McNeill air tours 30. Quarterdeck Marina & Hotel Port Hardy marina complex 31. Telegraph Cove Marina USA marina complex Page 27
 to assess the importance of marine businesses to the economy of the Regional District. Any information that you provide will be kept strictly confidential. A. Your Operation 1.")

35 Company: Location: Name: PH: Mt. Waddington Marine Sector - Interview Guide Gordon Gislason and Edna Lam of have been retained by Living Oceans Society and Mt. Waddington Regional District (RD) to assess the importance of marine businesses to the economy of the Regional District. Any information that you provide will be kept strictly confidential. A. Your Operation 1. Briefly describe the service that your business provides. In which marine areas does your business operate? (describe particular channels, banks etc or use the map e.g near Telegraph Cove). 2. How much employment & labour does your business involve? people for e.g., 2 people for 12 months plus person-months 4 people for 4 months = 6 people for 40 months in total 3. What share of workers live in the RD? % or workers from RD B. Your Revenue Base & Wage Bill 4. Approximately what was your revenue base (before taxes levied on sales)? in 2009 $ in 2010 $ projected 5. Approximately what share of this revenue goes to pay labour (including a draw for yourself and working owners/partners)? roughly % goes to labour inc. benefits or $ per year C. Importance of a Healthy Marine Environment? 6. Is a healthy marine environment important to your operation? If Yes, what aspects of the marine environment do you utilize in your operation? (e.g., particular species, geographic features). THANK YOU Gordon Gislason PH: 604/ Edna Lam PH: 604/ gsg@gsg.bc.ca Fax: 604/ ednalam@lynx.net Fax: 604/ Page 28
36 Appendix B Background - Commercial Fishing Page 29
37 Exhibit B.1 Commercial Fishing Licences Regional District of Mt. Waddington 2009 A. FISHING LICENCES Quatsino Port Hardy Port McNeill RDMW Alert Bay Sointula All BC Total Licences SALMON Seine AS Gillnet AG & N ,406 Troll AT Subtotal ,220 HERRING Roe Herring - Seine HS Gillnet HG ,268 Spawn-on-Kelp J Subtotal ,556 GROUNDFISH & OTHER FISH Halibut L Sablefish K Groundfish Trawl T Rockfish Hook & Line ZN Sardine by Seine ZS Eulachon ZU Category C /Schedule II US Tuna Subtotal ,586 SHELLFISH Crab R Prawn W Geoduck G Red Urchin ZC Green Urchin ZA Sea Cucumber ZD Shrimp Trawl S Euphausid ZF Clam by Hand ZF ,102 Subtotal ,136 TOTAL ,498 B. OTHER LICENCES Fisher Registration Cards (FRCs) ,072 Note: Alert Bay includes Simoon Sound & Kingcome Inlet Quatsino includes Coal Harbour Source: Derived from data provided by DFO Licensing (based on residence of owner). Page 30
38 Exhibit B.2: Commercial Licence Counts and Landed Value Total Licences 2009 Landed Value $000 $000 per Licence SALMON Seine AS 276 9, Gillnet AG & N 1,406 5,400 4 Troll AT 538 8, Subtotal 2,220 23,700 NA HERRING Roe Herring - Seine HS 252 5, Gillnet HG 1,268 10,500 8 Spawn-on-Kelp J 36 1, Subtotal 1,556 17,400 NA GROUNDFISH & OTHER FISH Halibut L , Sablefish K 48 24, Groundfish Trawl T , Rockfish Hook & Line ZN 262 2,000 8 Sardine by Seine ZS 25 3, Eulachon ZU Category C /Schedule II 479 2,000 4 US Tuna , Subtotal 1, ,500 NA SHELLFISH Crab R , Prawn W , Geoduck G 55 31, Red Urchin ZC 110 3, Green Urchin ZA Sea Cucumber ZD 85 3, Shrimp Trawl S 243 1,300 5 Euphausid ZF Clam by Hand ZF 1,102 2,200 2 Subtotal 2, ,000 NA TOTAL 7,498 NA NA Source: DFO Licencing and MOE SYIR. Page 31
39 Appendix C Background - Sport Fishing Page 32
40 Exhibit C.1: DFO Sport Fishing Estimates - RDMW Marine Areas 2009 Statistical Areas All Boat Trips* 1,200 15,080 7,550 23,830 Kept Catch* Chinook 2,320 8,450 6,220 16,990 Sockeye - 50 <10 50 Coho 1,150 7,410 14,910 23,470 Pink 90 13, ,510 Chum Halibut 1,580 3,390 6,000 10,970 Lingcod ,720 4,920 Rockfish 2,080 2,270 6,930 11,280 Other Finfish 70 1, ,330 * activity refers to June to August period only. Source: DFO Pacific Region. Page 33
41 Exhibit C.2: Days Fished by Region in BC Saltwater 2005 Angler Origin BC Other Canada Outside Canada All Region of Fishing Queen Charlotte Islands 85,400 32,700 42, ,600 North Coast 72,500 21,900 17, ,500 Central Coast 66,800 16,700 36, ,200 Johnstone Strait* 140,100 16,200 42, ,700 Georgia Strait 949,700 40,800 46,900 1,037,400 Barkley Sound 297,200 24,600 39, ,700 WCVI** 164,700 14,900 47, ,900 Total 1,776, , ,800 2,217,000 Source: DFO Ottawa, Results from 2005 Survey of Recreational Fishing, May * includes Statistical Areas 11, 12 and part of 13. ** includes Statistical Area 27. Page 34
42 Exhibit C.3: BC Saltwater Recreational Fishing Profile 2002 Lodge Charter Independent All Angler-Days ,800 2,100 Angler Purchases $ millions Boats & Equipment Lodges/Charters Other Direct Costs Source:, British Columbia Seafood Sector and Tidal Water Recreational Fishing - A Strengths, Weaknesses, Opportunities and Threats (SWOT) Assessment, Prepared for BC Ministry of Agriculture Food & Fisheries, Victoria BC, February 2004 p.176. Page 35
43 Appendix D 2006 Census Data Page 36
44 Exhibit D.1: 2006 Census - RDMW Population & Labour Force RDMW Quatsino Port Alice Port Hardy Port McNeill Alert Bay Sointula Total Population Total ,530 3,665 1,195 1,050 11, Years of Age ,525 2, ,290 Aboriginal , ,730 Work Labour Force - Total ,485 2, ,615 - Employed ,135 2, ,890 - Unemployed Participation Rate % 67.8% 63.4% 70.5% 79.3% 69.2% 56.7% 71.2% Unemployment Rate % 15.0% 10.0% 13.3% 3.9% 18.8% 20.8% 10.9% Source: BC Stats 2006 Census of Canada. Note: 1. Quatsino inc. Hope Island (IR), Mt. Waddington B (SRD), Quatsino Subdivision 18 (IR). 2. Port Alice is the Village of Port Alice. 3. Port Hardy inc. Port Rupert 1 (IR), Kippase 2 (IR), Port Hardy (DM), Tsulquate 4 (IR). 4. Port McNeill inc. Mt. Waddington C (SRD), Mt. Waddington D (SRD), Port McNeill (T). 5. Sointula is Mt. Waddington A (SRD). 6. Total populations of the Province and Vancouver Island are 4,113,485 and 704,635 respectively from the 2006 Census. Page 37
45 Exhibit D.2: 2006 Census - Labour Force by Industry RDMW Number BC % RDMW Industry Primary - Farms , % - Forestry & Logging , % - Fishing & Hunting 275 5, % - Support to Farms & Forestry 85 9, % Mining, Oil & Gas 25 20, % Utilities 20 11, % Construction , % Manufacturing - Seafood 280 5, % - Wood Products , % - Paper , % - Other , % Wholesale Trade , % Retail Trade , % Transportation - Water & Support 80 10, % - Other , % Information & Culture 50 58, % Finance & Insurance , % Real Estate etc 70 50, % Professional, Technical, Scientific , % Mgt of Companies - 3,105 - Admin & Support, Waste Mgt , % Education , % Health Care & Social Assistance , % Arts, Entertainment, Recreation , % Accommodation Services , % Food Services , % Public Admin , % Other Services , % Unclassified/ Not Applicable , % TOTAL 6,610 2,226, % Source: BC Stats & Statistics Canada 2006 Census of Canada. Page 38
46 Appendix E Maps Provided by Living Oceans Society & Regional District of Mt. Waddington Page 39
47 Mount Waddington A Tlatlasikwala Gwawaenuk Gwa Sala-Nakwaxda xw Mount Waddington B Kwakiutl Quatsino Mount Waddington B Mount Waddington C Tsawataineuk Kwicksutaineuk-ah-kwaw-ah-mish Namgis Mamalilikulla-Qwe'Qwa'Sot'Em Da Naxda xw / A waetla la Mount Waddington D Count of First Nations using each Statistical Area Mount Waddington Regional District km 60 First Nations Communities Current X-X Traditional Fisheries and Oceans Canada Statistical Areas
48 Mount Waddington B Port Hardy Quatsino ** Mount Waddington B Port McNeill Mount Waddington C Sointula Alert Bay * Mount Waddington D Mount Waddington A Number of fishing licenses by port Mount Waddington Regional District km X-X Data: DFO Licensing * Alert Bay includes Simoom Sound and Kingcome Inlet. ** Quatsino includes Coal Harbour. Fisheries and Oceans Canada Statistical Areas
49 Mount Waddington B Mount Waddington B Mount Waddington C Mount Waddington D Mount Waddington A Mount Waddington Regional District km Legend Areas used by recreational fishing tour operators Fisheries and Oceans X-X Canada Statistical Areas
50 Mount Waddington B Mount Waddington B Mount Waddington C Mount Waddington D Mount Waddington A Mount Waddington Regional District km Count of Recreational Activities by Statistical Area Activities include: kayaking, scuba diving, surfing, whale watching, wildlife viewing. X-X Fisheries and Oceans Canada Statistical Areas
51 Aquaculture Regions Fin Fish Location of licensed aquaculture activity in the Regional District of Mount Waddington Municipal Boundary Lakes Ocean Land 2010 BCA Property Assessment Value: All aquaculture industry properties in the Regional District of Mount Waddington. Assessed Land Value ($) Assessed Improvements Value ($) Area A 1,540,047 15,075,600 Area B 502,619 1,697,900 Area C 109, ,400 Area D All Unincorporated 2,133,121 17,327,100 Port Hardy 472,200 4,816,000 TOTAL 2,605,321 22,143,100 Source: Regional District of Mount Waddington
52
53
MUNICIPAL POLICY MANUAL
 POLICY NUMBER: 16-8700-3 REFERENCE: Ucluelet Harbour Public Fish Sales ADOPTED BY: Council July 14, 2015 AMENDED DATE: SUPERSEDES: N/A #003/95 DEPARTMENT: EFFECTIVE DATE: Finance July 14, 2015 Policy Statement:
British Columbia's Fisheries & Aquaculture Sector May 2001
 British Columbia's Fisheries & Aquaculture Sector May 2001 Ministry of Finance and Corporate Relations Table of Contents Introduction... 1 What s new in this report?... 1 Highlights... 3 1. Defining the
Fishery. Fishing vessels (Dept. of Finance)
") Fishery Fishing vessels (Dept. of Finance) The Newfoundland and Labrador fishery recorded a difficult year in 29 due to low market prices, continued pressure from low-cost producers, and an appreciating
Fishery Fishing vessels (Dept. of Finance) The Newfoundland and Labrador fishery recorded a difficult year in 29 due to low market prices, continued pressure from low-cost producers, and an appreciating
BRITISH COLUMBIA SEAFOOD INDUSTRY YEAR IN REVIEW
 BRITISH COLUMBIA SEAFOOD INDUSTRY YEAR IN REVIEW ii British Columbia Seafood Industry 2012 YEAR IN REVIEW TABLE of CONTENTS A MESSAGE from The B.C. MINISTER of AGRICULTURE....1 British Columbia SEAFOOD
The 2001 Economic Benefits of Hunting, Fishing and Wildlife Watching in MISSOURI. Prepared by:
 The 2001 Economic Benefits of Hunting, Fishing and Wildlife Watching in MISSOURI Prepared by: Southwick Associates, Inc. PO Box 6435 Fernandina Beach, FL 32035 Ph (904) 277-9765 Fax (904) 261-1145 Email:
THE ECONOMIC CONTRIBUTION FROM HORSES
 THE ECONOMIC CONTRIBUTION FROM HORSES ECONOMIC CONTRIBUTION FROM HORSES HIGHLIGHTS The horse industry contributes more than $19 billion annually to the Canadian economy On-farm activities with horses generate
Hunter and Angler Expenditures, Characteristics, and Economic Effects, North Dakota,
 Agribusiness and Applied Economics Report No. 507-S January 2003 Hunter and Angler Expenditures, Characteristics, and Economic Effects, North Dakota, 2001-2002 Dean A. Bangsund and F. Larry Leistritz*
The 2006 Economic Benefits of Hunting, Fishing and Wildlife Watching in TEXAS. Prepared by:
 The 2006 Economic Benefits of Hunting, Fishing and Wildlife Watching in TEXAS Prepared by: Southwick Associates, Inc. P.O. Box 6435 Fernandina Beach, FL 32035 Ph (904) 277-9765 Fax (904) 261-1145 Email:
Fishing Industry in Prince Edward Island January 2009
 Fishing Industry in Prince Edward Island January 2009 INDUSTRY HIGHLIGHTS Did you know??? There are two lobster seasons in PEI: the Spring season and the Fall fishery. There were 22.9 million pounds of
The 2006 Economic Benefits of Hunting, Fishing and Wildlife Watching in NORTH CAROLINA. Prepared by:
 The 2006 Economic Benefits of Hunting, Fishing and Wildlife Watching in NORTH CAROLINA Prepared by: Southwick Associates, Inc. P.O. Box 6435 Fernandina Beach, FL 32035 Ph (904) 277-9765 Fax (904) 261-1145
Angling in Manitoba (2000)
") Angling in Manitoba (2000) TABLE OF CONTENTS Page Introduction 1 Angler Profile 2 Angling Effort 7 Catch and Harvest 10 Angling Expenditures 13 Bait Use 16 Nonresident Trip Characteristics 18 Angling in
Angling in Manitoba (2000) TABLE OF CONTENTS Page Introduction 1 Angler Profile 2 Angling Effort 7 Catch and Harvest 10 Angling Expenditures 13 Bait Use 16 Nonresident Trip Characteristics 18 Angling in
Seafood Industry. The 2012 Juneau and Southeast Alaska Economic Indicators 11/1/12 Page 60
 Seafood Industry In 2011, fishermen in Southeast landed 395,628,268 pounds of fish with an ex vessel value of $391,091,684. This harvest resulted in 272.6 million pounds of product, with a wholesale value
Prince William Sound Aquaculture Corporation Economic Impact Update for 2010
 Prince William Sound Aquaculture Corporation Economic Impact Update for 2010 PWSAC has a Significant Impact on Alaska Salmon Fisheries During the past four seasons, salmon reared and released by the Prince
Final Report, October 19, Socioeconomic characteristics of reef users
 Socioeconomic Study of Reefs in Southeast Florida - Executive Summary By Hazen and Sawyer in association with Florida State University and National Oceanic and Atmospheric Administration, October 19, 2001
Coastal and marine recreation in New England is ingrained in the region s economic and
 RECREATION Coastal and marine recreation in New England is ingrained in the region s economic and social fabric. Recreation on the ocean and coast includes many of New Englanders most time-honored and
Appendix G Coastal Demographic and Economic Trends Additional Figures
 Appendix G Coastal Demographic and Economic Trends Additional Figures Figure 1. Unemployment Rate in 1970-2004 18.0 16.0 14.0 12.0 10.0 8.0 6.0 4.0 1970 1972 1974 1976 1978 1980 1982 1984 1986 1988 1990
Recreational Saltwater Fishing Industry Trends and Economic Impact January 2007
 Document was created exclusively for RISAA and the information contained herein is not to be disclosed without their expressed permission Recreational Saltwater Fishing Industry Trends and Economic Impact
British Columbia s. Johnstone Strait & Blackfish Sound. Encounter Orcas, humpback whales, dolphins, porpoises, seals and sea lions
 British Columbia s Johnstone Strait & Blackfish Sound 6-days sailing with the spectacular marine mammal populations of Northern Vancouver Island One of the best places on the planet to observe killer whales
PRESENTATION TO THE BRITISH COLUMBIA LEGISALTIVE STANDING COMMITTEE ON FINANCE September 26, 2013
 PRESENTATION TO THE BRITISH COLUMBIA LEGISALTIVE STANDING COMMITTEE ON FINANCE September 26, 2013 On behalf of its 40,000 plus members, The BC Wildlife Federation welcomes the opportunity to address the
Angling in Manitoba Survey of Recreational Angling
 Angling in Manitoba 2005 Survey of Recreational Angling TABLE OF CONTENTS Page Introduction 1 Angler Profile 2 Angling Effort 6 Catch and Harvest 9 Angling Expenditures 11 Bait Use 14 Canadian and Nonresident
Economic Contribution of the 2018 Recreational Red Snapper Season in the South Atlantic
 Economic Contribution of the 2018 Recreational Red Snapper Season in the South Atlantic Produced for the: American Sportfishing Association (ASA) PO Box 6435 Fernandina Beach, FL 32035 Office (904) 277-9765
The Power of Outdoor Recreation Spending in Pennsylvania:
 The Power of Outdoor Recreation Spending in Pennsylvania: How hunting, fishing, and outdoor activities help support a healthy state economy November, 2018 Prepared for the Theodore Roosevelt Conservation
Independent Economic Analysis Board. Review of the Estimated Economic Impacts of Salmon Fishing in Idaho. Task Number 99
 IEAB Independent Economic Analysis Board Roger Mann, Chair Noelwah R. Netusil, Vice-Chair Kenneth L. Casavant Daniel D. Huppert Joel R. Hamilton Lon L. Peters Susan S. Hanna Hans Radtke Review of the Estimated
2018 Fraser River Fishery Summary to Accompany December 2018 Presentation for FORUM
 2018 Fraser River Fishery Summary to Accompany December 2018 Presentation for FORUM Chinook... 1 Coho... 3 Chum... 4 Sockeye... 5 Pink... 6 Chinook FSC Chinook directed fisheries were open year round Below
Marine Recreational and Commercial Industries and Activities in Lee and Charlotte Counties: Economic Consequences and Impacts
 Marine Recreational and Commercial Industries and Activities in Lee and Charlotte Counties: Economic Consequences and Impacts Betty Staugler Florida Sea Grant Extension Marine Agent & Chuck Adams Florida
Rivers Inlet Salmon Initiative
 Rivers Inlet Salmon Initiative 5-YEAR BUSINESS PLAN C AS E F O R S U P P O R T M AR C H 2 0 1 5 Dedication Rick Hansen had been inspired to go to Rivers Inlet in July 2010 by his good friend, and fellow
Impacts of Nonresident Sportfishing on the Ketchikan Economy. Prepared for: Ketchikan Visitors Bureau
 Impacts of Nonresident Sportfishing on the Ketchikan Economy Prepared for: Ketchikan Visitors Bureau February 2010 Impacts of Nonresident Sportfishing on the Ketchikan Economy Prepared for: Ketchikan Visitors
There are two types of selective commercial fisheries conducted by Talok Fisheries:
 Lake Babine Nation Inland Fishery The inland commercial fishery on Lake Babine is operated by a private fishing company named Talok that is owned by the Lake Babine Nation (LBN). This company is governed
Sustainable Fisheries for Future Generations The Fisheries White Paper
 Sustainable Fisheries for Future Generations The Fisheries White Paper Key messages The Fisheries White Paper Sustainable Fisheries for Future Generations charts the course for a sustainable and profitable
Economic Impact of Lobster Sector - Province of New Brunswick and Its Counties
 Economic Impact of Lobster Sector - Province of New Brunswick and Its Counties Pierre-Marcel Desjardins Economist February 2007 Introduction This assessment seeks to quantify the economic impact of the
Prepared by: McDowell Group, Inc. Andy Wink CAP Meeting
 Prepared by: McDowell Group, Inc. Andy Wink CAP Meeting 7.28.15 Alaska Seafood Overview Fishery & Market Update Key Issues Ketchikan Seafood Industry Who and What is Alaska Seafood? About 60,000 fishermen,
The University of Georgia
 The University of Georgia Center for Agribusiness and Economic Development College of Agricultural and Environmental Sciences Economic Impacts of Alabama Quail Hunting Prepared by: Archie Flanders and
Top Ten Arguments. against the Strait of Georgia commercial seine and gill net herring fishery. # BIGlittleFISH. PacificWild.org
 Top Ten Arguments against the Strait of Georgia commercial seine and gill net herring fishery # BIGlittleFISH PacificWild.org #1 ecology For thousands of years, herring were abundant on the B.C. coast.
A Threatened Bay: Challenges to the Future of the Penobscot Bay Region and its Communities
 A Threatened Bay: Challenges to the Future of the Penobscot Bay Region and its Communities 1 A A Threatened Bay: Challenges to the Future of the Penobscot Bay Region and its Communities In 1996 the Island
Press Release New Bilateral Agreement May 22, 2008
 Informational Report 3 June 2008 Press Release New Bilateral Agreement May 22, 2008 The Pacific Salmon Commission is pleased to announce that it has recommended a new bilateral agreement for the conservation
California s North Coast Fishing Communities Historical Perspective and Recent Trends
 California s North Coast Fishing Communities Historical Perspective and Recent Trends Appendix C: Methodological Detail Customization of PacFIN Landings Receipt Data to Characterize Commercial Fisheries
The Economic Benefits of Hunting and Fishing Activities in Alberta in 2008
 The Economic Benefits of Hunting and Fishing Activities in Alberta in 2008 Submitted to Hunting For Tomorrow Foundation Submitted by May, 2009 Introduction Hunting and Fishing related expenditures by Alberta
The Role of the NPAFC in Conservation and Protection of Pacific Salmon
 The Role of the NPAFC in Conservation and Protection of Pacific Salmon Vladimir Fedorenko Executive Director and Shigehiko Urawa Deputy Director North Pacific Anadromous Fish Commission Vancouver, Canada
Fishery. Harvesting. Snow Crab Professional Fish Harvesters Certification Board
 Fishery T he Newfoundland and Labrador fishery faced several challenges in 8, including continued competition from low-cost producers, as well as high fuel costs and unfavourable exchange rates for most
We recommend that whenever possible you use the following guidelines for choosing the most sustainable options in 2010.
 Ocean Wise Seasonal salmon report 2010 NOTE: THE FOLLOWING RECOMMENDATIONS ARE BASED ON EARLY TEST FISHERY RESULTS. ACTUAL IN-SEASON RUN STRENGTH CAN CHANGE AND WILL BE UPDATED AS NECESSARY. Returns of
In the Supreme Court of British Columbia
 No. Vancouver Registry In the Supreme Court of British Columbia BETWEEN: CHIEF ROBERT CHAMBERLIN, Chief of the Kwicksutaineuk/Ah-Kwa-Mish First Nation, on his own behalf and on behalf of all members of
Re: Algae/Cyanobacteria Bloom in St. Lucie, Martin, Palm Beach and Lee Counties.
 July 18, 2016 Richard L. Scott Governor, State of Florida 400 S Monroe St Tallahassee, FL 32399 Re: Algae/Cyanobacteria Bloom in St. Lucie, Martin, Palm Beach and Lee Counties. Dear Governor Scott: I am
The Economic Impact of Colonial Downs in Virginia
 The Economic Impact of Colonial Downs in Virginia Prepared for Revolutionary Racing January 31, 2018 1309 E Cary Street, Richmond, VA 23219 1025 Huron Road East, Cleveland, OH 44115 chmuraecon.com Table
Listuguj First Nation Listuguj Fisheries, the Driving Force behind Economic Development
 Listuguj First Nation Listuguj Fisheries, the Driving Force behind Economic Development Written by Michael W. McDonald J.D. Director of Economic Development with the Atlantic Policy Congress (APC) Listuguj
Economic Values of Sport, Personal Use, and Commercial Salmon Fishing in Upper Cook Inlet. (Executive Summary)
") Economic Values of Sport, Personal Use, and Commercial Salmon Fishing in Upper Cook Inlet (Executive Summary) Kenai river sportfishing association p.o. box 1228 Soldotna, alaska 99669 January 2008 Kenai
Economic Values of Sport, Personal Use, and Commercial Salmon Fishing in Upper Cook Inlet (Executive Summary) Kenai river sportfishing association p.o. box 1228 Soldotna, alaska 99669 January 2008 Kenai
2017 CONSERVATION HARVESTING PLAN Atlantic Halibut (4RST) Prince Edward Island fixed gear fleet Less than meters
 Prince Edward Island fixed gear fleet Less than meters") Approved on July 13, 2017 APPLICATION This Conservation Harvesting Plan (CHP) applies to all Prince Edward Island (PEI) fixed gear licence holders fishing Atlantic halibut in NAFO Divisions 4RST with vessels
Approved on July 13, 2017 APPLICATION This Conservation Harvesting Plan (CHP) applies to all Prince Edward Island (PEI) fixed gear licence holders fishing Atlantic halibut in NAFO Divisions 4RST with vessels
The Economic Gains from Reallocating Specific Saltwater Fisheries
 The Economic Gains from Reallocating Specific Saltwater Fisheries Produced for the: American Sportfishing Association By: Southwick Associates May 12, 2015 Executive Summary Allocation arrangements between
CXC geo Question 6 Economic Development
 CXC geo 2015 Question 6 Economic Development Define the term secondary industry and give one example of a secondary industry that you have studied. 3marks Secondary industries are those industries which
Pacific Pilotage Authority. submission to the. Canada Transportation Act Review Panel. January 2015
 Pacific Pilotage Authority submission to the Canada Transportation Act Review Panel January 2015 This submission is respectfully submitted to the Canada Transportation Act Review Panel by the Pacific Pilotage
Gulf of Mexico Oil Spill
 Bulletin 1204 May 2013 Estimation of the Baseline for Assessment of Economic Impacts of the Gulf of Mexico Oil Spill on Mississippi s Commercial Fishing Sector Discrimination based upon race, color, religion,
The Economic Impact of Recreational Fishing in the Everglades Region
 The Economic Impact of Recreational Fishing in the Everglades Region Prepared for: The Everglades Foundation Prepared by: Tony Fedler, Ph.D. For the Bonefish and Tarpon Trust December 2009 Table of Contents
Economic Impact Analysis BOONE DOCKS RESORT AND MARINA, LLC
 Economic Impact Analysis BOONE DOCKS RESORT AND MARINA, LLC Analysis conducted using the on-line Boating Economic Impact Model developed by Drs. Ed Mahoney (mahoneye@msu.edu), Dan Stynes (stynes@msu.edu)
COOPERATIVE EXTENSION Bringing the University to You
 COOPERATIVE EXTENSION Bringing the University to You Special Publication - 06-16 ECONOMIC IMPACT OF TOURISM ON COLORADO RIVER COMMUNITIES INCLUDING: LAUGHLIN BULLHEAD CITY FORT MOHAVE MOHAVE VALLEY GOLDEN
Eastern Shore Islands Area of Interest Community Newsletter
 Eastern Shore Islands Area of Interest Community Newsletter Fall 2018 1ỊNTRODUCTION In addition to information on our Fisheries and Oceans Canada (DFO) website, we have now created a seasonal, community
HIGH YIELD ANGLERS IN RTO13: A SITUATION ANALYSIS EXECUTIVE SUMMARY
 HIGH YIELD ANGLERS IN RTO13: A SITUATION ANALYSIS EXECUTIVE SUMMARY PREPARED FOR TOURISM NORTHERN ONTARIO BY Research Resolutions & Consulting Ltd. MARCH 2013 2 INTRODUCTION As one of the ways to increase
OR DUNGENESS CRAB FISHERY:
 E 55 OR DUNGENESS CRAB FISHERY: an economic analysis of productivity and profitability David S. Liao Joe B. Stevens OREGON STATE UNIVERSITY SEA GRANT COLLEGE PROGRAM Publication no. ORESU-T-75-005 AGRICULTURAL
Commercial Net Pen Salmon Farming in Washington State
 Commercial Net Pen Salmon Farming in Washington State Icicle SeafoodsOverivew at a glance Icicle Seafoods Icicle is a leading harvester, producer and processor of diversified seafood products in North
Discussion Paper: Consideration of a Registration for Self-Guided Halibut Rental Boats
 Discussion Paper: Consideration of a Registration for Self-Guided Halibut Rental Boats December 2017 1 1 Introduction... 1 2 Description of the Problem... 1 2.1 Definition of self-guided halibut rental
The Implications of Illegal, Unreported and Unregulated (IUU) Fishing in Production cost for Marine water small-scale fisheries: A Case
 Fishing in Production cost for Marine water small-scale fisheries: A Case") The Implications of Illegal, Unreported and Unregulated (IUU) Fishing in Production cost for Marine water small-scale fisheries: A Case Study of Mafia Island, Mainland Tanzania. Upendo Hamidu, Fatma Sobo
The Implications of Illegal, Unreported and Unregulated (IUU) Fishing in Production cost for Marine water small-scale fisheries: A Case Study of Mafia Island, Mainland Tanzania. Upendo Hamidu, Fatma Sobo
Figure 1. Structure of Estonian commercial fishing and fish farming in 2010 (% of the total volume)
") Estonia FISHERIES Estonia is a sea and coastal country on the Eastern shore of the Baltic Sea. The territory of Estonia is small 45 227 km 2 the length of our coastline, however, is 3794 km. Good location
Estonia FISHERIES Estonia is a sea and coastal country on the Eastern shore of the Baltic Sea. The territory of Estonia is small 45 227 km 2 the length of our coastline, however, is 3794 km. Good location
Recreational Boating Industry
 Recreational Boating Industry Powering the Canadian Economy 2017 policy agenda 2 Table of Contents A Note from NMMA Canada s Executive Director A Note from NMMA Canada s Executive Director...3 What is
Energy Consumption of Small Scale Fishing Vessel Operations in Indonesia A Case Study in Palabuhanratu, Indonesia
 Energy Consumption of Small Scale Fishing Vessel Operations in Indonesia A Case Study in Palabuhanratu, Indonesia Vita R KURNIAWATI Richard W BIRMINGHAM Alan J MURPHY School of Marine Science and Technology
Sport Fishing Expenditures and Economic Impacts on Public Lands in Washington
 Sport Fishing Expenditures and Economic Impacts on Public Lands in Washington For: Northwest Sportfishing Industry Association By: Southwick Associates Released June 2015 PO Box 6435 Fernandina Beach,
Marine fishing tourism in Norway. Structure and economic effects
 Marine fishing tourism in Norway Structure and economic effects 29.09.2015 1 Icelandic friends Claudia master thesis «Warm» friendships 29.09.2015 5 Coastal tourism in Norway Marine tourism in Norway
British Columbia Seafood Industry YEAR IN REVIEW 2016
 British Columbia Seafood Industry YEAR IN REVIEW 2016 Table of Contents A MESSAGE FROM THE MINISTER OF AGRICULTURE.................. 1 BRITISH COLUMBIA S AGRIFOOD AND SEAFOOD SECTOR......... 2 BRITISH
Monitoring Surfing Quality below the Jordan River Generating Station (Year 2)
") Jordan River Project Water Use Plan Monitoring Surfing Quality below the Jordan River Generating Station (Year 2) Reference: JORMON#5 Monitoring Surfing Quality Below the Jordan River Generating Station
Jordan River Project Water Use Plan Monitoring Surfing Quality below the Jordan River Generating Station (Year 2) Reference: JORMON#5 Monitoring Surfing Quality Below the Jordan River Generating Station
Management of American Eel Fisheries in Canada. Laura Hussey-Bondt Senior Advisor, Resource Management Fisheries and Oceans Canada Maritimes Region
 Management of American Eel Fisheries in Canada Laura Hussey-Bondt Senior Advisor, Resource Management Fisheries and Oceans Canada Maritimes Region DFO Regions 2 Overview: Management of American Eel Fisheries
ECONOMIC DEVELOPMENT ELEMENT
 ECONOMIC DEVELOPMENT ELEMENT Background The Economic Development Element considers labor force and labor force characteristics, employment by place of work and residence, and analysis of the community
The Economic Impacts of Recreational Fishing in the Matagorda Bay System
 The Economic Impacts of Recreational Fishing in the Matagorda Bay System Prepared by Andrew Ropicki 1 Daniel Hanselka 2 Rebekka Dudensing 3 Rhonda Cummins 4 Bill Balboa 5 December 12, 2016 1 Assistant
ATLANTIC SALMON NEWFOUNDLAND AND LABRADOR, SALMON FISHING AREAS 1-14B. The Fisheries. Newfoundland Region Stock Status Report D2-01
 Fisheries Pêches and Oceans et Océans DFO Science Newfoundland Region Stock Status Report D2-01 ATLANTIC SALMON NEWFOUNDLAND AND LABRADOR, SALMON FISHING AREAS 1-14B Background There are 15 Atlantic salmon
The Economic Impacts of Recreational Fishing in the San Antonio Bay System
 The Economic Impacts of Recreational Fishing in the San Antonio Bay System Prepared by Andrew Ropicki 1 Daniel Hanselka 2 Rebekka Dudensing 3 Rhonda Cummins 4 December 12, 2016 1 Assistant Professor and
GERMANY IN THE WORLD AND IN THE EU (2015, source: FAO and Eurostat) FISHING FLEET (2015, source: JRC and Annual Economic Report)
 FISHING FLEET (2015, source: JRC and Annual Economic Report)") GERMANY IN THE WORLD AND IN THE EU (2015, source: FAO and Eurostat) Germany is the EU s 6th largest producer of fisheries and 10th largest of aquaculture products. (1000 tonnes) World EU-28 Germany % World
GERMANY IN THE WORLD AND IN THE EU (2015, source: FAO and Eurostat) Germany is the EU s 6th largest producer of fisheries and 10th largest of aquaculture products. (1000 tonnes) World EU-28 Germany % World
ECONOMIC IMPACTS AND CONTRIBUTIONS OF SPORTFISHING IN ALASKA
 ECONOMIC IMPACTS AND CONTRIBUTIONS OF SPORTFISHING IN ALASKA 2 0 0 7 R E P O R T A Message from the Director CHARLIE SWANTON, DIRECTOR ADF&G, DIVISION OF SPORT FISH Alaska supports arguably some of the
Economic Impact of Recreational Fishing for Bonefish, Permit and Tarpon in Belize for 2007
 Economic Impact of Recreational Fishing for Bonefish, Permit and Tarpon in Belize for 2007 Prepared by: Anthony J. Fedler, Ph.D. Human Dimensions Consulting 9707 SW 55 th Road Gainesville, Florida 32608
Charter Boat Fishing in Lake Michigan: 2017 Illinois Reported Harvest
 Illinois Department of Natural Resources Division of Fisheries Charter Boat Fishing in Lake Michigan: 2017 Illinois Reported Harvest Steven R. Robillard Illinois Department of Natural Resources Lake Michigan
The Fisheries and Aquaculture Sector in LITHUANIA
 The Fisheries and Aquaculture Sector in LITHUANIA Introduction Source: Baltlanta Lithuania has a relatively short coastline of 90 km, and its territorial waters and exclusive economic zone in the Baltic
Maintaining biodiversity in mixed-stock salmon fisheries in the Skeena watershed
 Maintaining biodiversity in mixed-stock salmon fisheries in the Skeena watershed A 130-year history Chris C. Wood Principle: Mixed-stock transboundary fisheries impose special requirements on management
Sport Fishing Expenditures and Economic Impacts on Public Lands in Oregon
 Sport Fishing Expenditures and Economic Impacts on Public Lands in Oregon For: Northwest Sportfishing Industry Association By: Southwick Associates October 2013 PO Box 6435 Fernandina Beach, FL32035 Tel
15, 2015 EXECUTIVE SUMMARY
 Economic Contribution, Impacts, and Economic Benefits of Deer, Waterfowl and Upland Game Bird Hunting in North and South Dakota: Relationship to CRP Lands Dr. John Loomis and Dr. Michelle Haefele in cooperation
A reformed CFP needs to be based on sustainability, and use the principle of caution
 Response from the North-Norwegian county councils of Troms and Nordland to the EU Commission s Green Paper on the Reform of the Common Fisheries Policy (CFP) Introduction Troms and Nordland are two coastal
THE ECONOMIC IMPACT OF RECREATIONAL SALTWATER FISHING ON THE LOUISIANA ECONOMY
 THE ECONOMIC IMPACT OF RECREATIONAL SALTWATER FISHING ON THE LOUISIANA ECONOMY By Loren C. Scott & Associates, Inc. 743 Woodview Court Baton Rouge, LA 70810 225-751-1707 lorencscott@aol.com for The Coastal
Socioeconomic Profile and Spatial Analysis of Fisheries in the three central California National Marine Sanctuaries
 Socioeconomic Profile and Spatial Analysis of Fisheries in the three central California National Marine Sanctuaries Overview and Assessment of CDFG Fisheries Data for use in the Joint Management Plan Review
COMMISSION FOR THE CONSERVATION AND MANAGEMENT OF HIGHLY MIGRATORY FISH STOCKS IN THE WESTERN AND CENTRAL PACIFIC OCEAN
 COMMISSION FOR THE CONSERVATION AND MANAGEMENT OF HIGHLY MIGRATORY FISH STOCKS IN THE WESTERN AND CENTRAL PACIFIC OCEAN FIRST MEETING OF THE TECHNICAL AND COMPLIANCE COMMITTEE [5-9 December 2005] and SECOND
Tuesday, April 10, 2018, 5:08 PM
 TABLE 2. 2018 Recreational management measures for non-indian ocean salmon fisheries - Council adopted. (Page 1 of 5) North of Cape Falcon Supplemental Management Information 1. Overall non-indian TAC:
Freshwater Sport Fishing in British Columbia
 Freshwater Sport Fishing in British Columbia Sending Ripples through the Provincial Economy Prepared for: Freshwater Fisheries Society of BC Victoria, BC Prepared by: Vancouver In Association with: Edna
Maintenance of Ontario s Aquaculture Statistics Program: AQUASTATS. Final Report submitted to: Ontario Ministry of Natural Resources
 Maintenance of Ontario s Aquaculture Statistics Program: AQUASTATS Final Report submitted to: Ontario Ministry of Natural Resources Submitted by: Richard D. Moccia and David J. Bevan Aquaculture Centre
2016 Fraser River Stock Assessment and Fishery Summary Chinook, Coho and Chum
 2016 Fraser River Stock Assessment and Fishery Summary Chinook, Coho and Chum 1 Background and Stock Assessment 2 Fraser River Chinook - Background Diverse group of populations exhibit a wide range of
YEAR IN REVIEW BRITISH COLUMBIA SEAFOOD INDUSTRY
 YEAR IN REVIEW BRITISH COLUMBIA SEAFOOD INDUSTRY A Message From The Minister of Agriculture Welcome to the 2010 B.C. Seafood Year in Review, a statistical summary of British Columbia s seafood production
Southeast Alaska Transboundary Watersheds
 OCTOBER 2016 Economic Impact Analysis Southeast Alaska Transboundary Watersheds PREPARED FOR SalmonState PREPARED BY Southeast Alaska Transboundary Watersheds: Economic Impact Analysis Prepared for: SalmonState
CHAPTER 4 DESIRED OUTCOMES: VISION, GOALS, AND OBJECTIVES
 CHAPTER 4 DESIRED OUTCOMES: VISION, GOALS, AND OBJECTIVES Vision One of the first steps in developing this Plan was articulating a vision - a clear statement of what the Plan strives to achieve and what
5. purse seines 3 000
 Sea Bass Q and A Latest News What have the 28 Member States decided on 2 July? The EU has today taken another step to protect sea bass. The 28 EU member states agreed to the Commission's proposal to increase
SUSTAINABLE FISHING. Labor s plan for fishing in Queensland
 SUSTAINABLE FISHING Labor s plan for fishing in Queensland Published January 2015 Authorised A Chisholm 16 Peel Street South Brisbane Qld 4101 for the Australian Labor Party A message from Annastacia Fishing
Risk Assessments in the Pacific Fisheries for BC & Yukon
 Risk Assessments in the Pacific Fisheries for BC & Yukon MARCH, 2017 CONTENTS Introduction to Risk Assessments... 2 Q&As on the Risk Assessment Process... 3 Overview of the Risk Assessment Tool... 4 Example
Ohio Sea Grant ECONOMIC IMPACT OF LAKE ERIE ON NORTHERN OHIO. Ohio State University Sea Grant Program. AGI HDlOl. no.604. c.6
 Ohio Sea Grant ECONOMIC IMPACT OF LAKE ERIE ON NORTHERN OHIO LEROY J. HUSHAK, Ph.D. KOFI K. APRAKU, Ph.D. GEORGE W. MORSE, Ph.D. Department of Agricultural Economics and Rural Sociology The Ohio Agricultural
Commercial Fisheries in the South Coast s Marine Protected Areas
 STATE OF THE CALIFORNIA SOUTH COAST SUPPLEMENTAL REPORT COMMERCIAL FISHERIES Researchers from the California Department of Fish and Wildlife (CDFW) used landings data from CDFW s Commercial Fisheries Information
NATIONAL MARINE FISHERIES SERVICE REPORT ON PACIFIC HALIBUT CATCH SHARING PLAN CHANGES FOR 2015
 Agenda Item G.1.b Supplemental NMFS Report 1 November 2014 NATIONAL MARINE FISHERIES SERVICE REPORT ON PACIFIC HALIBUT CATCH SHARING PLAN CHANGES FOR 2015 Table of Contents Purpose of the document... 2
DRAFT REPORT. EN United in diversity EN. European Parliament 2017/2120(INI)
") European Parliament 2014-2019 Committee on Fisheries 2017/2120(INI) 19.12.2017 DRAFT REPORT on the state of play of recreational fisheries in the European Union (2017/2120(INI)) Committee on Fisheries
European Parliament 2014-2019 Committee on Fisheries 2017/2120(INI) 19.12.2017 DRAFT REPORT on the state of play of recreational fisheries in the European Union (2017/2120(INI)) Committee on Fisheries
POLAND IN THE WORLD AND IN THE EU (2015, source: FAO and Eurostat)
") POLAND IN THE WORLD AND IN THE EU (2015, source: FAO and Eurostat) Poland is the EU s 10th largest producer of fisheries and 9th largest of aquaculture products. (1.000 tonnes) World EU-28 Poland % World
POLAND IN THE WORLD AND IN THE EU (2015, source: FAO and Eurostat) Poland is the EU s 10th largest producer of fisheries and 9th largest of aquaculture products. (1.000 tonnes) World EU-28 Poland % World
Cook Inlet Habitat Conservation Strategy
 Cook Inlet Habitat Conservation Strategy What is the Cook Inlet Habitat Conservation Strategy? It s a new effort to tie together all of NOAA Fisheries habitat-related science and management activities
Commercial fisheries 1+1. Fisheries and Oceans Pacific Region. Canada Catch Total- 309,000 Tonnes (Round Weight)
") Fisheries and Oceans Pacific Region 1991 Catch Total- 309,000 Tonnes (Round Weight) 160,000 lannes -Includes Other SpecIes She llfis h 24.000 tonnes 1991 Landed Value Total - $363 million Shellfish $46
Fisheries and Oceans Pacific Region 1991 Catch Total- 309,000 Tonnes (Round Weight) 160,000 lannes -Includes Other SpecIes She llfis h 24.000 tonnes 1991 Landed Value Total - $363 million Shellfish $46