ICES WGHANSA REPORT
|
|
|
- Marcus Morgan
- 6 years ago
- Views:
Transcription
1 ICES WGHANSA REPORT Annex A.5 - Stock Annexes 5.1 Stock Annex Bay of Biscay Anchovy (Subarea VIII) Quality Handbook Annex:A.5.1 Stock specific documentation of standard assessment procedures used by ICES Stock: Working Group: Bay of Biscay Anchovy (Subarea VIII) WGANSA (working group on the assessment of anchovy and sardine) Date: 15 th to 20 th of June, 2009 Revised at: WGANSA2009, WKSHORT2009 and WGANSA2010 Authors by alphabetic order: E. Duhamel, L. Ibaibarriaga, J. Massé, L. Pawlowski, M. Santos and A. Uriarte. A. General A.1. Stock definition Anchovy (Engrulis encrasicolus, L) stock in Subarea VIII (Bay of Biscay) is considered to be isolated from a small population in the English Channel and from the population in the area IXa. No subpopulations have been defined, although morfometrics and meristic studies suggest some heterogeneity at least in morphotipes (Prouzet and Metuzals, 1994; Junquera and Perez-Gandaras, 1993). Some genetic heterogeneity based on proteins allocime loci have been found between the Garonne spawning regions and southern regions in the Bay of Biscay (Adour and Cantabrian shores) (Sanz et al., 2008). Nevertheless, the evident inter connection of fisheries and rather homogenous recruitment pulses occurring in the Bay of Biscay lead ICES to consider that the anchovy in this area should be dealt as a single stock for assessment and management (ICES 2007). A.2. Fishery The fisheries were closed since June 2006 to December 2009 due to poor condition of the stock. It was reopened in January 2010 with a TAC of 7,000t. The fisheries for anchovy are targeted by purse-seiners and pelagic trawlers. The Spanish and French fleets fishing for anchovy in Subarea VIII are spatially and temporally quite well separated. The Spanish fleet (purse seine fleet) operates mainly in Divisions VIIIc and VIIIb in spring, while the French fleet (mainly pelagic trawlers) operates in Division VIIIa in summer and autumn and in Division VIIIb in winter and summer. A small fleet of French purse seiners operates in the South of the Bay of Biscay (VIIIb) in spring and in the North (VIIIa) during the autumn. An overview of the history of the fishery until the mid nineties and its spatial behaviour is found in Junquera (1986) and Uriarte et al. (1996) and for more recent perspective see ICES 2007 & 2008 or STECF 2008 for the international fishery and Uriarte et al. (2008) Villamor et al. (2008) for the Spanish fishery and Duhamel (2004) and Vermard et al. (2008) for the French pelagic trawlers. A recent updated information (2009) provided by the SWW RAC
2 534 ICES WGHANSA REPORT 2013 shows a 18% decrease in the fleet size operating on anchovy since the closure of the fishery (2005). This decrease is much more important for the pelagic trawlers fleet (- 39%) than for the purse seiners (-11%). Since the fishery closure, the fleets have redeployed their effort mainly towards other small pelagic species (57%) and tunas (29%) (Table A.2.2). Table A.2.1: Evolution of the French and Spanish fleets on anchovy in Sub-area VIII. Fishery closed in 2006, 2007 and Units: numbers of boats. France Spain * Year P. seiner P. trawl Total P. seiner Total (1,2) (1,2) (1,2) (1,2) (1,2) (1,2) (1,2) (1,2) (1,2) (1,2,3) (1,2) (1,2) (1,2) (1,2) (1,2) (1,2) (1,2,4) ** 6 ** (1,2,4) 7 ** (2) 32 * Spanish purse seiners are those with licences that landed anchovy (1) Only purse seiners having catch anchovy at least once a year but fishing sardine most of the time (2) only trawlers that targeted anchovy (annual catch > 50 t) (3) doubtful in terms of separation between gears because of misreporting (4) Provisional estimate ** French number of boats involved in the experimental fishery; not the actual size of the fleet

3 ICES WGHANSA REPORT Table A.2.2. Approximate figures for the anchovy fleet and fishing effort displacement for the the period (based on reports from stakeholders 28 th August 2009, provided by the SWW RAC). Report vers = report to add; bolincheurs sud bretagne = purse seiners in southern Brittany; chinchard = horse mackerel; maquerau = mackerel; thon rouge = bluefin tuna; thon blanc = albacore; Autres = others 2010 St jena de luz 2 Lorient 2 La Turbballe 20 St Gilles 6 (15 pairs of pair pelagic trawlers) A.3. Ecosystem aspects Anchovy is a prey species for other pelagic and demersal species in the Bay of Biscay, and also for cetaceans and birds. The recruitment depends strongly on environmental factors. Two environmental recruitment indices have been considered during the last 10 years: i) Borja s et al. (1998) index, which is an upwelling index, and ii) Allain s et al. (2001) index, which is a combination of upwelling and stratification breakdown. Allain s model was reviewed by Huret & Petitgas (WD 2007 in ICES2008) including a) the previous "upwelling" index, plus a new "stratification" index according to a new hydrodynamic model and b) an adult spatial indicator. The role of the Eastern Atlantic pattern in relation to the Upwelling index and the recruitment of anchovy have also been recently pointed out (Borja et al., 2008). Other approaches based on coupling spawning habitat with hydrodynamic and production models are being tried for this anchovy population with promising results (Allain et al., 2007). The significance and reliability of all these indices is considered still insufficient for their consideration in the provision of management advice and no update was provided on their performance for the meeting in 2010 of WGANSA. Recent reviews have suggested that comparison with global indexes and correlation analysis may not be the best approach to understand and consequently predict recruitment in small pelagic fish (Barange et al., 2009). Fernandes et al (2010) presents an alternative to attempt to relate environmental indices with recruitment by means of linear models. It uses machine-learning techniques to obtain the probability of having a recruitment discretized into low, medium and high classes depending on environmental variables. The proposed methodology consists of performing supervised predictors discretization, carrying out supervised predictors selection and learning a naive Bayes classifier. The approach can be applied to a dataset where the values of the recruitment have been discretized by the enduser, or the recruitment discretization can be part of the proposed model-building process in a bootstrap scheme. The results up to now are promising.
4 536 ICES WGHANSA REPORT 2013 B. Data B.1. Commercial catches: Fishery closed from July 2006 to December reopened with 7,000t the 1 st of March 2010 Annual Landings are available since The fishing statistics are considered accurate. Discards are not measured and hence not included in the assessment, but nowadays they are considered not relevant for the two fleets. In the past (late eighties and early nineties for the French Pelagic trawlers and sixties and seventies for the Spanish Purse seine fleet) they seemed to be more relevant (according to disputes among fishermen), but were never quantified. B.2. Biological B.3. Surveys Catches at length and catches at age are known since 1984 for Spain and since 1987 for France. They are obtained by applying to the monthly Length distributions half year or quarterly ALKs (and when possible monthly ALKs, as for the Spanish fishery in spring). Biological sampling of the catches has been generally sufficient, except for 2000 and 2001, when an increase of the sampling effort seemed useful to have a better knowledge of the age structure of the catches during the second semester in the North of the Bay of Biscay. Complete age composition and mean weight at age on half year basis, were reported in ICES (2008- WGANC report). Age reading is considered accurate. The most recent cross reading exchanges and workshop between Spain and France took place in 2005 and 2006 respectively (Uriarte et al., 2006 and 2007). The overall level of agreement and precision in anchovy age reading determinations seems to be satisfactory: Most of the anchovy otoliths were well classified by most of the readers during the 2006 workshop (with an average agreement of 92.7 % and a CV of 9.2%). CVs were on average smaller than 15% for any age, although individual CVs for ages or readers might be 30-35%. A new otolith exchange and age reading workshop took place in November Anchovies are mature at their 1 st year of life. Growth in weight and length are well known from Surveys and from the monitoring of the fishery (Uriarte et al., 1996). Natural mortality is fixed at 1.2 as an average of varying values obtained under the assumption of past DEPM providing absolute estimates of the population in numbers at age (Uriarte et al., 1996). This parameter is considered to vary between years, but it is assumed to be constant for the assessment of the stock. In the Bayesian Biomass Model, the parameter g describes the annual change in mass of the population by encapsulating the growth in weight (G) and the natural Mortality (M) of the population as G-M ( =-0.68) Spring surveys: series of DEPM(Daily egg production method) and acoustic surveys in Spring every year.
5 ICES WGHANSA REPORT The population is monitored by the two annual surveys carried out in spring on the spawning stock, namely, the Daily Egg Production Method (since 1987 with a gap in 1993) (Santiago and Sanz, 1992; Motos et al., 2005) and the Acoustics surveys (regularly since 1989, although surveys were also conducted in 1983, 1984 and some in the seventies) (Massé 1988, 1994, 1996). Both surveys provide spawning biomass and population at age estimates. The surveys have shown pronounced inter-annual variability of biomass according to the pulse of recruitments, since one year old anchovies can conform up to more than 75% of the spawning population. Spawning area and biomass are positive and closely related, revealing expansion of the area occupied by the population when SSB increases (Uriarte et al., 1996, Somarakis et al., 2004). This survey based monitoring system provides population estimates by the middle of the year, when about half of the annual catches have been already taken; and provide very little information about the anchovy population in the next year, since the bulk of it will consist of 1 year old anchovies being born at the time the surveys take place. Spawning Biomass in spring equals total stock biomass since all anchovies are mature (the youngest being 1 year old by then). B.3.1 Anchovy Daily Egg Production Method B The DEPM model The anchovy spawning stock biomass estimates is derived according to Parker (1980) and Stauffer & Picquelle (1980) from the ratio between daily production of eggs in the sea and the daily specific fecundity of the adult population: Equation 1 Where, SSB P P A + = DF k R F S W = tot 0 SSB = Spawning stock biomass in metric tons Ptot P0 = Total daily egg production in the sampled area = daily egg production per surface unit in the sampled area A+ = Spawning area, in sampling units DF = Daily specific fecundity. k R F S DF = W W = Average weight of mature females in grams, R = Sex ratio, fraction of population that are mature females, by weight. F = Batch fecundity, numbers of eggs spawned per mature females per batch S = Fraction of mature females spawning per day k = Conversion factor from gram to metric tons (10 6 ) An estimate of an approximate variance and bias for the biomass estimator derived using the delta method (Seber, 1982, in Stauffer & Picquelle, op. cit.) was also developed by the latter authors. Population estimates of numbers at age are derived as follows:
6 538 ICES WGHANSA REPORT 2013 Equation 2 N a = N E a = SSB Ea W t Where, Na = Population estimate of numbers at age a. N = Total spawning stock estimate in numbers. B = spawning stock biomass estimate. SSB N = W t Wt = average weight of anchovies in the population. Ea = Relative frequency (in numbers) of age a in the population. Variance estimate of the anchovy stock in numbers at age and total is derived applying the delta method. B Collection of plankton samples Every year the area covered to collect the plankton samples is the southeast of the Bay of Biscay which corresponds to the main spawning area and season of anchovy. Predetermined distributions of the vertical hauls that will be performed with the PairoVET net are shown in Figure B The strategy of egg sampling is as follow: a systematic central sampling scheme with random origin and sampling intensity depending on the egg abundance found. Stations are located every 3 miles, along 15-mile-apart transects perpendicular to the coast. The sampling strategy is adaptive. When the egg abundances found are relatively high, additional transects separated by 7.5 nm are completed. NANTES Figure B : Predetermined stations of the vertical hauls (PairoVET) that could be performed during the survey The Continuous Underway Fish Egg Sampler (CUFES) is also used to record the eggs found at 3m depth. The samples obtained are immediately checked under the microscope so that presence/absence of anchovy eggs is detected in real time. This allowed
7 ICES WGHANSA REPORT knowing whether there were anchovy eggs in the area. When anchovy eggs are not found in 6 consecutive CUFES samples in the oceanic area, transect is left. A vertical plankton haul is performed in each sampling station, using a PairoVET net (2-Calvet nets, Smith et al., 1985 in Lasker, 1985) with a mouth aperture of 0.05 m² each CalVET. The frame was equipped with nets of 150 μm. The net is lowered to a maximum depth of 100 m or 5 m above the bottom in shallower waters. After allowing 10 seconds at the maximum depth for stabilisation, the net is retrieved to the surface at a speed of 1 m s -1. A 45 kg depressor was used to allow for correctly deploying the net. "G.O. 2030" flowmeters were used to know the amount of water filtered during the tow. Immediately after the haul, the net is washed and the samples obtained are fixed in formaldehyde 4% buffered with sodium tetra borate in sea water. After 6h of fixing, anchovy, sardine and other species eggs are identified and sorted out on board. Afterwards, in the laboratory a percentage of the samples are checked to assess the quality of the sorting made at sea. According to that a portion of the samples are sorted again to assure no eggs are left. In the laboratory the anchovy eggs are staged (Moser and Alshtrom, 1985). During the survey, the presence/absence of eggs was recorded per PairoVET station and the area where anchovy eggs occurred was quantified. The spawning area was delimited with the outer zero anchovy egg stations. It contains some inner zero egg stations embedded on it (Picquelle and Stauffer, 1985). Following the systematic central sampling scheme (Cochran, 1977) each station was located in the centre of a rectangle. Egg Abundance found at a particular station was assumed to represent the abundance in the whole rectangle. The area represented by each station was measured. A standard station has a surface of 45 squared nautical miles (154 km 2 ) = 3 (distance between two consecutive stations) x 15 (distance between tow consecutive transects) nautical miles. Since sampling was adaptive, station area changed according to sampling intensity. Real depth, temperature, salinity and chlorophyll profiles are obtained in every station using a CTD RBR-XR420 coupled to the PairoVET. In addition, surface temperature and salinity is recorded in each station with a manual termosalinometer WTW LF197.Moreover current data are obtained all along the survey with an ADCP(Acoustic Doppler Current Profiles).In some point determinate previously to the survey, water is filtered from the surface to obtain chlorophyll samples. B Collection of adult samples In 1987 and 1988 the samples were obtained from commercial purse seines, the adult sampling was opportunistic. From years 1989 to 2005 the adult samples were obtained both from commercial purse seines and a research vessel with pelagic trawl so the adult sampling was both opportunistic and directed. Since 2006 the samples are obtained from a research vessel with pelagic trawl but not from the purse seines due to the closure of the fishery so the adult sampling is only directed not opportunistic. Since the reopening of the fisheries in March 2010 the commercial purse seines are providing again samples for the analysis apart from the ones from the research vessels. The research vessel pelagic trawler covers the same area as the plankton vessel. When the plankton vessel encountered areas with anchovy eggs, the pelagic trawler is directed to those areas to fish. In each haul 100 individuals of each species are measure. Immediately after fishing, anchovy is sorted from the bulk of the catch and a
8 540 ICES WGHANSA REPORT 2013 sample of near 2 Kg is selected at random. Sampling finished as soon as a minimum of 1 kg or 60 anchovies are sexed, and from those, 25 non-hydrated females (NHF) are preserved. Sampling is also stopped when more than 120 anchovies have to be sexed to achieve the target of 25 NHF. Moreover, otoliths are extracted to obtain the age composition per sample. In the case the sample are obtained from the purse seines a sample of near 2kg is selected from the fishing and are directly kept in 4% formaldehyde. Afterwards, in the laboratory the samples are process in the same way as explained above. B Total daily egg production estimates When all the anchovy eggs are sorted and staged, it is possible to estimate total daily egg production (Ptot). This is calculated as the product between the daily egg production (P0) and the spawning area (SA) P tot = P A standard sampling station represents a surface of 45 nm 2 (i.e. 154 km 2 ). Since the sampling was adaptive, area per station changes according to the sampling intensity and the cut of the coast. The total area is calculated as the sum of the area represented by each station. The spawning area (SA) is delimited with the outer zero anchovy egg stations but it can contain some inner zero stations embedded. The spawning area is computed as the sum of the area represented by the stations within the spawning area. The staged eggs are transformed into daily cohort abundances using the Bayesian ageing method (ICES 2004) Daily egg production (P0) and daily mortality rates (Z) are estimated by fitting an exponential mortality model to the egg abundance by cohorts and corresponding mean age. The model is fitted as a Generalised Linear Model (GLM) with Negative Binomial distribution and log link. The ageing process and the model fitting are repeated until convergence. Eggs younger than 4 hours and older than 90% of the incubation time are removed from the model fitting to avoid any possible bias. 0 SA B3.1.5 Adult parameters and Daily Fecundity estimates The DF estimate for this WGANSA in June is obtained from a linear regression model between DF and sea surface temperature (SST). Two weeks after arriving from the survey the adult parameters are not processed yet, uniquely the anchovies were weighted, measured, sexed and the otoliths were extracted, consequently Daly Fecundity has to be derived from the past historical series. Afterwards in the ICES WGACEGG in November the complete DEPM with all the adult parameters estimates is presented and approval. This occurred since 2005 when the advice started demanding SSB estimates in June, however the historical series of DF is being revised within WGACEGG (ICES 2009). Until DF is fully revised and its relationship with temperature corroborated by WGACEGG, the WGANSA decided to use the historical mean of DF (63.39 egg/ g per day) to obtain the preliminary SSB estimate for June. From the whole set of adult samples gathered during the survey, a subset is chosen for final processing with the criterion of collection within ±5 days of the egg sampling in the same particular area. In the last years the samples are collected within the same day as the egg sampling. These samples are used to obtain adult parameters estimates leading to the estimate of Daily Fecundity, i.e. batch fecundity, spawning frac-
9 ICES WGHANSA REPORT tion, average female weight and sex ratio. These adult parameters are estimates for November as follows: Sex Ratio (R): Given the large variability among samples of the sex ratio and taking into account that for most of the years when the DEPM has been applied to this population the final estimate has come out to be not significantly different from 50 % for each sex (in numbers), since 1994 the proportion of mature females per sample is being assumed to be equal to 1:1 in numbers. This leads to adopt as R the value of the average sample ratio between the average female weight and the sum of the average female and male weights of the anchovies in each of the samples. Total weight of hydrated females is corrected for the increase of weight due to hydration. Data on gonad-free-weight (Wgf) and correspondent total weight (W) of non hydrated females is fitted by a linear regression model. Gonad-free-weight of hydrated anchovies is then transformed to total weight by applying the following equation: W = a + b For the Batch fecundity (F) estimates i.e. number of eggs laid per batch and female, the hydrated egg method was followed (Hunter et al, 1985). The number of hydrated oocytes in gonads of a set of hydrated females is counted. This number is deduced from a sub-sampling of the hydrated ovary: Three pieces of approximately 50 mg are removed from different parts of each ovary, weighted with precision of 0.1 mg and the number of hydrated oocytes counted. Sanz & Uriarte (1989) showed that 3 tissue samples per ovary are adequate to get good precision in the final batch fecundity estimate and the location of sub-samples within the ovary do not affect it. Finally the number of hydrated oocytes in the sub-sample is raised to the total gonad of the female according to the ratio between the weights of the gonad and the weight subsampled. A linear regression between female weight and batch fecundity is established for the subset of hydrated females and used to calculate the batch fecundity of all mature females. The average of the batch fecundity estimates for the females of each sample as derived from the gonad free weight eggs per batch relationship is then used as the sample estimate of batch fecundity. Moreover, an analysis is conducted to verify if there are differences in the batch fecundity if strata are defined to estimate SSB. To estimate Spawning Frequency (S), i.e. the proportion of females spawning per day, until the new series of spawning frequency (S) is accepted a model based on the historical series was considered. This model relates S linearly with Sea Surface Temperature (SST). Mean and variance of the adult parameters are estimated following equations for cluster sampling (as suggested by Picquelle & Stauffer, 1985): Equation 3 Equation 4 Y = n i=1 n i=1 M i M n W gf y i 2 M i ( yi - Y) i=1 Var(Y) = 2 M n (n - 1) i 2
10 542 ICES WGHANSA REPORT 2013 Where, Yi is an estimate of whatever adult parameter from sample i and Mi is the size of the cluster corresponding to sample i. occasionally a station produced a very small catch, resulting in a small sub-sample size. To reflect the actual size of the station and its lower reliability, small samples were given less weight in the estimate. For the estimation of W, F and S, a weighting factor was used, which equalled to 1 when the number of mature females in station i (Mi) was 20 or greater and it equalled to Mi/20 otherwise. In the case of R when the total weight of the sample was less than 800 g then the weighting factor was equal to total weight of the sample divided by 800g, otherwise it was set equal to 1. In summary for the estimation of the parameters of the Daily Fecundity we are using a threshold-weighting factor (TWF) under the assumption of homogeneous fecundity parameters within each stratum. B SSB estimates In the WGANSA during June the Spawning Stock Biomass is preliminary estimates as the ratio between the total egg production (Ptot) and Daily Fecundity (DF) estimates and its variance is computed using the Delta method (Seber, 1982): Var ˆ [ Ptot] P Var ˆ [ SSB] = + 2 DF 2 tot Var ˆ [ DF] 4 DF The definitive SSB estimate with all the adult parameters is presented and approval at the WGACEGG during November. B Numbers at age For the purposes of producing population at age estimates, the age readings based on otoliths from the adult samples collected were available. Estimates of anchovy mean weights and proportions at age in the adult population were computed as a weighted average of the mean weight and age composition per samples where the weights were proportional to the population (in numbers) in each stratum. These weighting factors are proportional to the egg abundance per stratum divided by the numbers of samples in the stratum and the mean weight of anchovy per sample. Weighting factors were allocated according to the relative egg abundance and to the amount of samples in the strata defined for the proposed of the estimation of the numbers at age. These strata are defined each year depending on the distribution of the adult samples i.e. size, weight, age and the distribution of the anchovy eggs. Mean and variance of the adult parameters of the Population in numbers at age and the Population length distribution (total weight, proportion by ages and length distribution) are estimated following equations 4 and 5 for cluster sampling. B.3.2. Anchovy acoustic indices Acoustic surveys are carried out every year in the Bay of Biscay in spring on board the French research vessel Thalassa. The objective of PELGAS surveys is to study the abundance and distribution of pelagic fish in the Bay of Biscay. The main target species is anchovy but it will be considered in a multi-specific context as species located in the centre of ecosystem. These surveys are connected with IFREMER programs on data collection for monitoring and management of fisheries and ecosystemic approach for fisheries. This task is
11 ICES WGHANSA REPORT formally included in the first priorities defined by the Commission regulation EU N 199/2008 of 06 November 2008 establishing the minimum and extended Community programmes for the collection of data in the fisheries sector and laying down detailed rules for the application of Council Regulation (EC) No 1543/2000. These surveys must be considered in the frame of the Ifremer fisheries ecology action "resources variability" which is the French contribution to the international Globec programme. It is planned with Spain and Portugal in order to have most of the potential area to be covered from Gibraltar to Brest with the same protocol for sampling strategy. Data are available for the ICES working groups WGANSA, WGWIDE and WGACEGG. B Method and sampling strategy In the frame of an ecosystemic approach, the pelagic ecosystem is characterized at each trophic level. In this objective, to assess an optimum horizontal and vertical description of the area, two types of actions are combined: Continuous acquisition by storing acoustic data from five different frequencies and pumping sea-water under the surface in order to evaluate the number of fish eggs using a CUFES system (Continuous Under-water Fish Eggs Sampler), and Discrete sampling at stations (by trawls, plankton nets, CTD). Satellite imagery (temperature and sea colour) and modelisation will be also used before and during the cruise to recognise the main physical and biological structures and to improve the sampling strategy. Concurrently, a visual counting and identification of cetaceans (from board) and of birds (by plane) will be carried out in order to characterise the higher level predators of the pelagic ecosystem. Satellite imagery (temperature and sea colour) and modelisation are also used before and during the cruise to recognise the main physical and biological structures and to improve the sampling strategy. Concurrently, a visual counting and identification of cetaceans and of birds (from board) is carried out in order to characterise the top predators of the pelagic ecosystem. The strategy was the identical to previous surveys (2000 to 2009): - Acoustic data were collected along systematic parallel transects perpendicular to the French coast (figure 1.1.1). The length of the ESDU (Elementary Sampling Distance Unit) was 1 mile and the transects were uniformly spaced by 12 nautical miles covering the continental shelf from 20 m depth to the shelf break. - Acoustic data were collected only during the day because of pelagic fish behaviour in this area. These species are usually dispersed very close to the surface during the night and so "disappear" in the blind layer for the echo sounder between the surface and 8 m depth. Two echo-sounders are usually used during surveys (SIMRAD EK60 for vertical echo-sounding and OSSIAN 500 on the pelagic trawl). In 2009 the SIMRAD ME70 has been used for multi-beam visualisation. Energies and samples provided by split beam transducers (5 frequencies EK60, 18, 38, 70, 120 and 200 khz), simple beam (OSSIAN 49 khz) and multibeam echo-sounder were simultaneously visualised, stored using the MOVIES+ software and at the same standard HAC format.
12 544 ICES WGHANSA REPORT 2013 The calibration method is the same that the one described for the previous years (see W.D. 2001) with a tungsten sphere hanged up 20 m below the transducer and is generally performed at anchorage in front of Machichaco cap or in the Douarnenez bay, in the west side of Brittany, in optimum meteorological conditions. Acoustic data are collected by Thalassa along the totality of the daylight route from which about 2000 nautical miles on one way transect are usable for assessment. Fish are measured on board (for all species) and otoliths (for anchovy and sardine) are collected for age determinations. B Echoes scrutinizing Most of the acoustic data along the transects are processed and scrutinised during the survey and are generally available one week after the end of the survey (figure 2.2.1). Acoustic energies (Sa) are cleaned by sorting only fish energies (excluding bottom echoes, parasites, plankton, etc.) and classified into several categories of echo-traces according to the year fish (species) structures. Some categories are standard such as: D1 energies attributed to mackerel, horse mackerel, blue whiting, divers demersal fish, corresponding to cloudy schools or layers (sometimes small dispersed points) close to the bottom or of small drops in a 10m height layer close to the bottom. D2 energies attributed to anchovy, sprat, sardine corresponding to the usual echotraces observed in this area since more than 15 years, constituted by schools well designed, mainly situated between the bottom and 50 meters above. These echoes are typical of clupeids in coastal areas and sometime more offshore. D3 energies attributed to blue whiting and myctophids offshore, just closed to the shelf-break. D4 energies attributed to sardine, mackerel or anchovy corresponding to small and dense echoes, very close to the surface. D6 energies attributed to a mix, usually between 50 and 100 m depth when D1 and D2 were not separable Some particular categories are usually specifically designed according to several identifications during the survey (when Thalassa and/or commercial vessels hauls are available), such as: D7 energies attributed exclusively to sardine (big and very dense schools). D5 energies attributed to small horse mackerel only when they are gathered in very dense schools this category is usually used for typical echoes which occur along particular surveys. In the case of 2010, it was used to gather energies which occurred all along the transects in the. northern platform where a continuous cover of mainly blue whiting was observed. B Data processing The global area is split into several strata where coherent communities are observed (species associations) in order to minimise the variability due to the variable mixing of species. For each stratum, a mean energy is calculated for each type of echoes and the area measured. A mean haul for the strata is calculated to get the proportion of species into the strata. This is obtained by estimating the average of species proportions weighted by the energy surrounding haul positions. Energies are therefore con-
13 ICES WGHANSA REPORT verted into biomass by applying catch ratio, length distributions and TS relationships. The calculation procedure for biomass estimate and variance is described in Petitgas et.al The TS relationships used since 2000 are still the same and as following: Sardine, anchovy & sprat : TS = 20 Log L 71.2 Horse-mackerel : TS = 20 Log L 68.7 Blue whiting : TS = 20 Log L 67.0 Mackerel : TS = 20 Log L 86.0 The mean abundance per species in a stratum (tons m.n. -2 ) is calculated as: M e( k) = s A ( D, k) X e( D, k) D and total biomass (tons) by : Be A( k) Me( k) where, k : strata index D : echo type e : species = k SA : Average SA (NASC) in the strata (m2/n.mi.2) Xe : species proportion coefficient (weighted by energy around each haul) (tons m -2 ) A : area of the strata (m.n. 2 ) Then variance estimate is: Var. M ( k) = 2 e sa ( D, k) Var[ X e( D, k)] n. cha( k) + D Var. Be = A2( k) Var. Me( k) k X 2 e var[ s A ( D, k)] n. esu( D, k) cv = Var. Be Be At the end, density in numbers and biomass by length and age are calculated for each species in each ESDU according to the nearest haul length composition. These numbers and biomass are weighted by the biomass in each stratum and data are used for spatial distributions by length and age. The detailed protocol for these surveys (strategy and processing) is described in annex 6 of WGACEGG report in 2009
14 546 ICES WGHANSA REPORT 2013 B.3.3 Historical series DEPM and acoustic surveys Nantes MAY - 3 JUN R/V AGORRETA, GAMIN & EXPLORADOR La Rochelle La Rochelle Bordeaux Bordeaux Santander Bi Santander SS Bi SS Nantes Nantes BIOMAN MAY La Rochelle R/V EXPLORADOR BIOMAN MAY R/V INVESTIGADOR La Rochelle Anchovy eggs/0.1m² Bordeaux Arcachon Santander Bi Santander SS Bi SS Nantes Nantes BIOMAN 1998 La Rochelle R/V INVESTIGADOR BIOMAN R/V INVESTIGADOR La Rochelle Bordeaux Anchovy eggs/0.1m² Bordeaux Arcachon Santander 6 Bi Santander SS Arcachon Anchovy eggs/0.1m² MAY - 5 JUN MAY - 8 JUN Arcachon Bordeaux Anchovy eggs/0.1m² Arcachon Arcachon Anchovy egg/0.1m² MAY BIOMAN 1994 Nantes BIOMAN Bi SS
15 ICES WGHANSA REPORT Nantes Nantes BIOMAN MAY R/V INVESTIGADOR MAY - 8 JUN La Rochelle R/V INVESTIGADOR Anchovy eggs/0.1m² Arcachon Bordeaux 38 Anchovy eggs/0.1m² Santander Bi Santander SS Bi SS Nantes 1 Nantes BIOMAN MAY R/V INVESTIGADOR MAY - 9 JUN La Rochelle R/V INVESTIGADOR Anchovy eggs/0.1m² Bordeaux Arcachon Santander 6 Bi Santander 1 6 Bi SS Nantes 1 Nantes BIOMAN 2004 La Rochelle R/V VIZCONDE DE EZA MAY La Rochelle R/V VIZCONDE DE EZA Anchovy eggs/0.1m² Santander 6 Bi Santander SS Arcachon Bordeaux 38 Anchovy eggs/0.1m² Arcachon Bordeaux BIOMAN MAY SS Arcachon Bordeaux BIOMAN La Rochelle Anchovy eggs/0.1m² Arcachon Bordeaux BIOMAN La Rochelle Bi SS


16 548 ICES WGHANSA REPORT BIOMAN MAY La Rochelle R/V VIZCONDE DE EZA Anchovy eggs/0.1m² Arcachon BIOMAN May R/V Investigador La Rochelle Bordeaux Santander Bi Arcachon Spawning area = 34,449Km² Santander SS Bi SS Nantes BIOMAN May R/V Investigador La Rochelle Anchovy eggs/0.1m Bordeaux Arcachon Stations with 0 anchovy eggs Santander 6 Bi SS Total area surveyed = 56,079Km² Plankton stations (n = 420) Nantes anchovy eggs/0.1m² Bordeaux m 200m Nantes 1 Figure B.3.3.1: Anchovy egg distribution from 1998 to 2009.The circles represent the anchovy egg abundance /0.1m2 encountered in each plankton station. 1 44
17 ICES WGHANSA REPORT nb (^1000) nb (^1000) nb (^1000) length class (cm) length class (cm) length class (cm) nb (^1000) nb (^1000) nb (^1000) length class (cm) length class (cm) length class (cm) nb (^1000) nb (^1000) nb (^1000) length class (cm) length class (cm) length class (cm) nb (^1000) nb (^1000) length class (cm) length class (cm) Length composition of adults of anchovy as estimated by acoustics since 2000 during PELGAS surveys.
18 550 ICES WGHANSA REPORT age 1 age 2 age 3 age PEL00 PEL01 PEL02 PEL03 PEL04 PEL05 PEL06 PEL07 PEL08 PEL09 PEL Number of eggs observed during PELGAS surveys with CUFES from 2000 to 2010


19 ICES WGHANSA REPORT 2013 Distribution of anchovy eggs observed with CUFES during PELGAS surveys from 2000 to 2010 (number for 10m3). 551
20 552 ICES WGHANSA REPORT 2013 B.3.4 Autumn surveys on Juveniles, still under testing period In recent years two series of acoustic surveys on juvenile anchovy (JUVENA and PELACUS10) have been launched in September-October, expecting that in the future the estimates can allow forecasting the strength of the anchovy recruitment which will enter the fishery the next year (ICES 2008 WGACEGG report). Both surveys were coordinated with WGACEGG and are being merged nowadays. These surveys are expected to provide further insights on the recruitment process and additional knowledge on the biology and ecology of the juveniles Despite the encouraging results obtained with the series of 6 years of data available, the lack of sufficient contrast in the recent levels of recruitments prevents a proper evaluation of its performance as a predictor and the series are therefore not yet used for improving the management advice for the population (ICES WGANC report). B Juvena survey B Data acquisition JUVENA surveys take place annually since 2003, around September. In the period 2003 to 2005, the area was covered onboard commercial purse seiners. Since 2006 in addition to purse seiners, an oceanographic vessel, the R/V Emma Bardán, was incorporated to the survey. The abundance estimation is obtained by means of acoustic methodology (MacLennan and Simmonds, 1992). The acoustic equipment includes split beam echo sounders Simrad EK60 (Kongsberg Simrad AS, Kongsberg, Norway). The transducers of 38 khz and 120 khz (and 200kHz since 2006) were installed looking vertically downwards, about 2.5 m deep, at the end of a tube attached to the side of the purse seiners and at the hull in the case of the R/V Emma Bardan. The transducers were calibrated using standard procedures (Foote et al. 1987). Fishing was based on purse seining up to 2005 but since then onwards both pelagic trawling and purse seines are being used for species identification and biological sampling, along with hydrological recordings. In addition, the spatial distribution of the juvenile population is studied along with their growth condition. Two boats have been used since 2005 and therefore some extension of the northern limits of the surveys thus facilitated. The water column was sampled to depths of 200 m. A threshold of -100 db was applied for data collection. Acoustic back-scattered energy by surface unit (SA, MacLennan et al. 2002) was recorded for each geo-referenced ESDU (Echointegration Sampling Distance Unit) of 0.1 nautical mile (185.2 m). Fish identity and population size structure was obtained from fishing hauls and echotrace characteristics. The commercial vessels used a purse seine of about 400 m of perimeter and 75 m height to fish the samples to depths of 50 m and the R/V Emma Bardan used a pelagic trawl. Acoustic data, thresholded to -60 db, was processed using Movies+ software (Ifremer) for biomass estimation and the processed data was represented in maps using Surfer (Golden Software Inc., CO, USA) and ArcView GIS. Hydrographic recording was made with CTD casts. B Sampling strategy The sampling area covered the waters of the Bay of Biscay (being 5º W and 47º45 N the limits). Sampling was started from the Southern part of the sampling area, the Cantabrian Sea, moving gradually to the North to cover the waters in front of the French Coast. The acoustic sampling was performed during the daytime, when the
21 ICES WGHANSA REPORT juveniles are supposed to aggregate in schools (Uriarte 2002 FAIR CT ) and can be distinguished from plankton structures. The vessels followed parallel transects, spaced 15 nm., perpendicular to the coast along the sampling area, taking into account the expected spatial distribution of anchovy juveniles for these dates, that is, crossing the continental shelf in their way to the coast from offshore waters (Uriarte et al. 2001). B Other sources of information During the summer, information from the commercial live bait tuna fishery was collected, in order to have knowledge about the spatial distribution and relative abundance of anchovy previous to the beginning of the survey. We continued collecting this information about the captures of the fleet during the survey itself. In addition we maintained a constant communication with the responsible of the survey Pelacus- 10, conducted by the IEO and Ifremer, survey performed onboard R/V Thalassa with a double objective: juvenile abundance estimation and ecologic studies. B Biological processing Each fishing haul was classified to species and a random sample of each species was measured to produce size frequencies of the communities under study. A complete biological sampling of the anchovy juveniles collected is performed in order to analyze biological parameters of the anchovy juvenile population, as the age, size or sizeweight ratio. Using these and other environmental parameters we will try to obtain, in a long term, indexes of the state of condition of the juvenile population, in order to be able to improve the prediction of the strength of the recruitment. B Acoustic data processing Acoustic data processing was performed by layer echo-integration by 0.1 nautical mile ( s A ) of the first 65 m of the water column with Movies+ software, after noise filtering and bottom correction, increasing or decreasing this range when the vertical distribution of juveniles made it necessary. The hauls were grouped by strata of homogeneous species and size composition. Inside each of these homogeneous strata, the echo-integrated acoustic energy s A was assigned to species according to the composition of the hauls. Afterwards, the energy corresponding to each specie-size was converted to biomass using their corresponding conversion factor. Each fish species has a different acoustic response, defined by its scattering cross section that measures the amount of the acoustic energy incident to the target that is scattered backwards. This scattering cross section depends upon specie i and the size of the target j, according to: TS /10 {( a + b log L )/10} σ = 10 ij j = 10 Here, Lj represents the size class, and the constants ai and bi are determined empirically for each species. For anchovy, we have used the following TS to length relationship: TS = log j L j The composition by size and species of each homogeneous stratum is obtained by averaging the composition of the individual hauls contained in the stratum, being the i i j
22 554 ICES WGHANSA REPORT 2013 contribution of each haul weighted to the acoustic energy found in its vicinity (2 nm of diameter). Thus, given a homogeneous stratum with M hauls, if Ek is the mean acoustic energy in the vicinity of the haul k, wi, the proportion of species i in the total capture of the stratum, is calculated as follows: w i = j w ij = j M k = 1 q ijk M k = 1 E E k k Q k. Being qijk the quantity (in mass) of species i and length j in the haul k; and Qk, the total quantity of any species and size in the haul k. In order to distinguish their own contribution, anchovy juveniles and adults were separated and treated as different species. Thus, the proportion of anchovy in the hauls of each stratum ( w ij ) was multiplied by a age-length key to separate the proportion of adults and juveniles. Then, separated w i were obtained for each. Inside each homogeneous stratum, we calculated a mean scattering cross section for each species, by means of the size distribution of such specie obtained in the hauls of the stratum: i wijσ ij j = w σ. Let s A be the calibration-corrected, echo-integrated energy by ESDU (0.1 nautical mile). The mean energy in each homogeneous stratum, E m =< s A >, is divided in terms of the size-species composition of the haul of the stratum. Thus, the energy for each species, Ei, is calculated as: E i wi σ i E = wi σ i i Here, the term inside the parenthesis sums over all the species in the stratum. Finally, the number of individuals Fi of each species is calculated as: i i m Ei Fi = H l σ Where l is the length of the transect or semi-transect under the influence of the stratum and H is the distance between transect (about 15 nm.). To convert the number of juveniles to biomass, the size-length ratio obtained in each stratum is applied to obtain the average weight of the juveniles in the stratum: i L i < W >= a < > Thus, the biomass is obtained by multiplying Fi times < W i >. b
23 ICES WGHANSA REPORT B Commercial CPUE According to literature, CPUE indices have been considered, as not reliable indicators of abundance for small pelagic fishes (Ulltang, 1982, Csirke 1988, Pitcher 1995, Mackinson et al. 1997). Current series of CPUE available for the Spanish Purse seine are not considered of utility for the monitoring of the fishery (Uriarte et al., 2008). C. Stock assessment method Model used: The assessment for the Bay of Biscay anchovy population is a Bayesian two-stage biomass-based model (BBM) (Ibaibarriaga et al., 2008), where the population dynamics are described in terms of biomass with two distinct age groups, recruits or fish aged 1 year, and fish that are 2 or more years old. The biomass decreases exponentially on time by a factor g accounting for intrinsic rates of growth (G) and natural mortality (M) which are assumed year- and age-invariant. Two periods are distinguished within each year. The first begins on 1 January, when it is assumed that age incrementing occurs and age 1 recruit enter the exploitable population, and runs to the date when the monitoring research surveys (acoustics and DEPM) take place. The second period covers the rest of the year (from 15 th May to 31 st December). Catch is assumed to be taken instantaneously within each of these periods. The observation equations consist on log-normally distributed spawning stock biomass from the acoustics and DEPM surveys, where the biomass observed is proportional to the true population biomass by the catchability coefficient of each of the surveys, and the beta distributed age 1 biomass proportion from the acoustics and DEPM surveys, with mean given by the true age 1 biomass proportion in the population. The model unknowns are the initial population biomass (in 1987), the recruitment each year, the catchability of the surveys and the variance related parameters of the observation equations. The model can be cast into a Bayesian state-space model framework where inference on the unknowns is done using Markov Chain Monte Carlo (MCMC). Software used: The model is implemented in BUGS ( and it is run from R ( using the package R2WinBUGS. Model Options chosen: Catchability for the DEPM SSB is set to 1 because it is assumed to be an absolute indicator of Biomass and for consistency with the past practice in the assessment of this stock. Catchability of the acoustic SSB is estimated. DEPM and acoustic surveys are assumed to provide unbiased proportion of age 1 biomass estimates in the stock. The first set of priors as defined in Ibaibarriaga et al is used. The length of the MCMC run, the burn-in period (removal of the first draws to avoid dependency on the initial values) and the thinning to diminish autocorrelation should be enough to ensure convergence and obtain a representative joint posterior distribution of the parameters.
24 556 ICES WGHANSA REPORT 2013 Input data types and characteristics: Type Name Year range Age range Variable from year to year. Yes/No Caton Catch in tonnes by periods to 2+ Yes Canum Weca Mprop Fprop Catch at age in numbers by periods Weight at age in the commercial catch by periods Proportion of natural mortality before spawning Proportion of fishing mortality before spawning & 2+ Yes to 2+ Yes Not applicable Not applicable Matprop Proportion mature at age Not applicable Natmor Natural mortality M= to 2+ No G Intrinsic growth rate G= to 2+ No Tuning data: Type Name Year range Age range Tuning fleet 1 DEPM SSB spring series (with gap in 1993) Tuning fleet 2 Acoustic SSB spring series (with gaps) Tuning fleet 3 DEPM P1 (B1/SSB) spring series (with gaps) Tuning fleet 4 Acoustic P1 (B1/SSB) spring series (with gaps)
25 ICES WGHANSA REPORT Prior distributions of the parameters: The current prior distributions (see table below) are described and justified in Ibaibarriaga et al. (2008) and ICES WGANC (2008) The benchmark workshop recommended to conduct some sensitivity analysis on the prior distributions. In particular, to test the effect of having more informative priors on the surveys' catchability and precision and on the g parameter. If this is done, any changes in the prior distributions of the parameters should be documented and justified in the ICES anchovy assessment working group report (WGANSA). D. Short-Term Projection Model used: The Bayesian two-stage biomass-based model (Ibaibarriaga et al. 2008) used for the assessment of the stock is used to project the population one year forward from the current state and to analyse the probability of the population in the next year of being below the biological reference point Blim ( tonnes) under a recruitment scenario based on the past recruitment series and under alternative catch options for the second half of the current year and the first half of next year. The predictive distribution of recruitment at age 1 (in mass) in January next year is defined as a mixture of the past series of posterior distributions of recruitments as follows: R 2008 = 2007 y= 1987 wy p(r y ), where p( ) R y denotes the posterior distribution of recruitment in year y and are the weights of the mixture distribution, such that w y =1 wy. These weights can
26 558 ICES WGHANSA REPORT 2013 be based on information about incoming recruitment or on assumptions regarding different scenarios. Software used: The projections are implemented in R ( Projection period: One year ahead from the spawning period (15 th May) in the last assessment year Initial stock size: Posterior distribution of SSB in the last assessment year Maturity: NA F and M before spawning: NA Weight at age in the stock: NA Weight at age in the catch: NA Intrinsic growth rate (G): Assumed constant same as in the assessment (G=0.52) Natural mortality rate (M): Assumed constant same as in the assessment (M=1.2) Exploitation pattern: Alternative options for splitting catches by periods are tested Intermediate year assumptions: NA Stock recruitment model used: No implicit S/R model is used. Recruitment is sampled from the posterior distributions of past series recruitments. Different recruitment scenarios are constructed by giving different weights to the past series recruitments. Procedures used for splitting projected catches: NA E. Medium-Term Projections No Medium term projections are applied to this fishery for the provision of advice by ICES. Long term projections (10 years ahead) were run by STECF in 2008 to set the basis of a management plan on anchovy to the EC, based on a Ricker stock recruitment relationship. F. Long-Term Projections No Long term projections are applied to this fishery for the provision of advice by ICES. Long term projections (10 years ahead) were run by STECF in 2008 to set the basis of a management plan on anchovy to the EC, based on a Ricker stock recruitment relationship. G. Biological Reference Points A stock/recruitment relationship is not explicitly used.
27 ICES WGHANSA REPORT Current biological reference points for the Bay of Biscay anchovy were defined by ICES ACFM in October 2003 as follows: H. Other Issues I. References Allain, G., Petitgas, P. and Lazure, P The influence of mesoscale ocean processes on anchovy (Engraulis encrasicolus) recruitment in the Bay of Biscay estimated with a threedimensional hydrodynamic model. Fisheries Oceanography, 10: Allain, G., Petitgas, P., Lazure, P. and Grellier, P., Biophysical modelling of larval drift, growth and survival for the prediction of anchovy recruitment in the Bay of Biscay (NE Atlantic). Fisheries Oceanography, 16(6), Barange, M., Bernal, M., Cercole, M.C., Cubillos, L.A., Cunningham, C.L., Daskalov, G.M., De Oliveira, J.A.A., Dickey-Collas, M., Hill, K., Jacobson, L.D., Köster, F.W., Masse, J., Nishida, H., Ñiquen, M., Oozeki, Y., Palomera, I., Saccardo, S.A., Santojanni, A., Serra, R., Somarakis, S., Stratoudakis, Y., van der Lingen, C.D., Uriarte, A. and Yatsu, A. (2009). Current trends in the assessment and management of small pelagic fish stocks. Chapter 10 in: Checkley, D.M. Jr, Roy, C., Oozeki, Y. and Alheit J. (Eds.) Climate Change and Small Pelagic Fish. Cambridge University Press. Borja, A. Uriarte, A., Egana, J., Motos, L. and Valencia, V Relationships between anchovy (Engraulis encrasicolus) recruitment and environment in the Bay of Biscay ( ). Fisheries Oceanography, 7(3-4), Borja, A. Fontán, A., Saez, J. and Valencia, V. 2008: Climate, oceanography, and recruitment: the case of the Bay of Biscay anchovy (Engraulis encrasicolus). Fish. Oceanogr. 17:6, , 2008 Cochran, W.G., Sampling techniques. John Wiley and sons (ed,.) 428 pp, N.Y. Csirke J Small shoaling pelagic fish stocks. In Fish Population Dynamics (Second Edition). Edited by J.A. Gulland. John Wiley & Sons Ltd. Duhamel, E., Biseau, A., Massé, J. and Villalobos, H The French fishery. Working document to the ICES Working Group on the Assessment of Mackerel, Horse Mackerel, Sardine
28 560 ICES WGHANSA REPORT 2013 and Anchovy (WGMHSA), 7-16 September 2004, ICES Headquarters, ICES CM 2005/ACFM:08. Fernandes, J. A., Irigoien, X., Goikoetxea, N., Lozano, J. A., Inza, I., Pérez, A., Bode, A Fish recruitment prediction, using robust supervised classification methods. Ecological modelling, 221: Hunter, J. R., et al. Batch fecundity in multiple spawning fishes, R. Lasker (ed.), p U. S. Dep. Commer., NOAA Tech. Rep. NMFS 36. Huret, M., and Petitgas, P Anchovy recruitment forecasting and environment. Working document to ICES WGMHMSA Ibaibarriaga, L., Fernández, C., Uriarte, A., and Roel, B. A A two-stage biomass dynamic model for Bay of Biscay anchovy: a Bayesian approach. ICES Journal of Marine Science, 65: ICES Report of the Working Group on the Assessment of Mackerel, Horse Mackerel, Sardine and Anchovy (WGMHSA), 4-13 September 2007, ICES Headquarters. ICES CM 2007/ACFM: pp. ICES. 2008a. Report of the Working Group on Anchovy (WGANC), June 2008, ICES Headquarters, Copenhagen. ICES CM 2008 ACOM: pp. ICES. 2008b. Report of the ICES Advisory Committee, ICES Advice, Book 7, 122 pp. Junquera, S., Pêche de l'anchois (Engraulis encrasicholus) dans le golfe de Gascogne et sur le littoral atlantique de Galice depuis Variations quantitatives. Rev. Trav. Inst. Pêches Marit., 483-4: Junquera, S. and Perez-Gandaras, G Population diversity in Bay of Biscay anchovy (Engraulis engrasicholus, L. 1758) as revealed by multivariate analisis of morphometric and meristic characters. ICES J. mar. Sci., 50:383:396. Lasker, R., An Egg Production Method for Estimating Spawning Biomass of pelagic fish: Application to the Northen Anchovy, Engraulis Mordax. NOAA Technical report NMFS 36:100p. Mackinson, S., Sumaila, U. R. and T. J. Pitcher Bioeconomics and catchability: fish and fishers behaviour during stock collapse. Fisheries Research 31: Massé, J Utilisation de l'echo-integration en recherche halieutique (analyse des campagnes effectuées dans le Golfe de Gascogne de 1983 à 1987). Direction des Ressources Vivantes, IFREMER. Massé J Acoustic Surveys DAAG 90, DAAG 91, DAAG 92. Annex to: Orestes (editor): Improvement of stock assessment by direct methods, its application to the anchovy (Engraulis encrasicholus) in the Bay of Biscay. Report of the EC FAR Project ( ) (Contract No. MA 2495 EF), 90 pp. + annexes. Massé, J. (1996). "Acoustics observation in the Bay of Biscay: schooling, vertical distribution, species assemblages and behaviour." Scientia Marina 60(Suppl. 2): Moser, H.G. and E. H. Ahlstrom, Staging anchovy eggs. In: "An egg production method for estimating spawning biomass of pelagic fish: Application to the northern anchovy, Engraulis mordax, R. Lasker (ed.), p U. S. Dep. Commer., NOAA Tech. Rep. NMFS 36. Motos L., A. Uriarte, P. Prouzet, M. Santos, P. Alvarez and Y. Sagarminaga. 2005: Assessing the Bay of Biscay anchovy population by DEPM: a review In Castro, LR, P. Fréon, C.D. Petitgas, P., Massé, J., Beillois, P., Lebarbier, E. and Le Cann, A. (2003) Sampling variance of species identification in fisheries acoustic surveys based on automated procedures associating acoustic images and trawl hauls ICES Journal of Marine Science 60: (1)
29 ICES WGHANSA REPORT Pitcher, T. J., 1995 : The impact of pelagic fish behaviour on fisheries. Sci. Mar., 59 (3-4): Prouzet, P. and Metuzals, K Phenotypic and genetic studies on the Bay of Biscay anchovy. InCendrero (Eds) Final report of the EC FAR project ( ). Santiago, J. and A. Sanz, Egg production estimates of the Bay of Biscay anchovy, Engraulis encrasicolus (L.), spawning stock in 1987 and 1988 (Estimaciones de la producción de huevos de l stock reproductor de anchoa, Engraulis encrasicolus (L.), del Golfo de Vizcaya en 1987 y 1988). Bol. Inst. Esp. Oceanogr. 8 (1): Sanz, N., García-Marín, J-L., Viñas, J., Roldán, M., and Pla, C Spawning groups of European anchovy: population structure and management implications. ICES Journal of Marine Science, 65. Sanz, A. & A. Uriarte, Reproductive cycle and batch fecundity of the Bay of Biscay anchovy (Engraulis encrasicholus L.) in CalCOFI Rep., vol. 30: Stauffer, G. and S. J. Picquelle, Estimates of the 1980spawning biomass of the of the central subpopulation of northern anchovy. Natl. Mar. Fish. Serv., NOAA. Southw. Fish. Cent. Admin. Rep. LJ-80-09, 41 p. Picquelle, S. J. and G. Stauffer, Parameter estimation for an egg production method of anchovy biomass assessment. In R. Lasker (editor), An egg production method for estimating spawning biomass of pelagic fish: Application to the northern anchovy, Engraulis mordax, p U.S. Dep. Commer., NOAA Tech. Rep. NMFS36. STECF-SGRST 2008: Report of the Meeting to inform the Commission on a long-term management plan for the stock of anchovy in the Bay of Biscay (ICES Sub-area VIII). Held in Hamburg, April 2008 STECF/SGBRE-08-01: Working Group Report on the long term management of Bay of Biscay anchovy. San Sebastian, 2-6 June Seber, G.A.F., Estimation of animal abundance and related parameters. Macmillan, New York. Somarakis, S., Palomera, I., Garcia, A., Quintanilla, L., Koutsikopoulos, C. Uriarte, A. and L. Motos, 2004: Daily egg production of anchovy in European waters. ICES Journal of Marine Science, 61: Ulltang, O Factors affecting the reaction of pelagic fish stocks to exploitation and requiring a new approach to assessment and management, Rapp. Procès-Verb. Réun. Cons. Int. Explor. Mer Uriarte, A. 2005: Assessment of the Bay of Biscay anchovy by means of a seasonal separable VPA. Working Document to the ICES Working Group on the assessment of mackerel, horse mackerel, sardine and anchovy, held in Vigo from 06 to 15 September Uriarte, A., Prellezo, R., Punzón, A., Aranda, M. and Villamor, B The Spanish fishery on anchovy in the Bay of Biscay: Analysis of the relationship between fishing Capacity, Effort and mortality. ICES CM 2008/I:18. Uriarte A. Prouzet, P. and B. Villamor 1996: Bay of Biscay and Ibero atlantic anchovy populations and their fisheries. Sci. Mar. 60 (Supl.2): Uriarte A (Coordinator), M. Blanco, E. Duhamel, P. Grellier, I. Rico, B. Villamor 2006: 2005 Anchovy otolith exchange programme from subarea VIII: Working Document to the 2006 IC- ES Planning Group on Commercial Catch, Discards and Biological Sampling (PGCCDBS) 24 February 2006 Uriarte, A. C. Dueñas, E. Duhamel, P. Grellier, I. Rico, B. Villamor, 2007: 2006 Anchovy Otolith Workshop. Working Document to the 2007 ICES Planning Group on Commercial Catch, Discards and Biological Sampling (PGCCDBS) (5-9 March)
30 562 ICES WGHANSA REPORT 2013 Vermard, Y., Marchal, P., Mahevas, S. and Thebaud, O A dynamic model of the Bay of Biscay pelagic fleet simulating fishing trip choice: the response to the closure of the European anchovy (Engraulis encrasicolus) fishery in Can. J. Fish. Aquat. Sci. 65: Villamor B., Aranda M., Punzón A., Uriarte A., Báez J. C., (2008): The Anchovy fishery in the Bay of Biscay I: Description and Analysis of the Spanish Fleet ( ). ICES CM 2008/ I:30 (Theme session I).

31 ICES WGHANSA REPORT Stock Annex Anchovy in Division IXa Quality Handbook ANNEX: A.5.2 Stock specific documentation of standard assessment procedures used by IC- ES. Stock Working Group: Anchovy in Division IXa Date: 24 th June 2011 WGANSA (Working Group on the Assessment of Anchovy and Sardine) Revised by Fernando Ramos A. General A.1. Stock definition The distribution of anchovy in the Division IXa is nowadays mainly concentrated in the Spanish waters of the Gulf of Cádiz (Sub-division IXa-South, Figure A.1.1). Outside the main nucleus of the Gulf of Cádiz, resilient anchovy populations have been detected in all fishery independent surveys (ICES, 2007 b) and previous records on large catches in ICES areas IXa North, Central North and South (Algarve) suggest that abundance in those areas have been high in early years of the time series. In the south, outside the Gulf of Cádiz anchovy is abundant to the East of the Strait of Gibraltar, in the Mediterranean Sea (GFCM, 2002) as well as in northern Africa, where a combined Spanish-Morocco fishery produces landings of up to tn (Millán, 1992; García-Isarch et al., 2008). Figure A.1.1. Distribution of acoustic energy allocated to anchovy from the combined 2007 acoustic surveys off Iberia and the Armorican shelf (from ICES, 2009b).
32 564 ICES WGHANSA REPORT 2013 A.2. Fishery Anchovy harvesting along the Division IXa is at present carried out by the following fleets: o o o o o Portuguese purse-seine fleet Portuguese trawl fleet Portuguese artisanal fleet (although fishing with artisanal purseseines) Spanish purse-seine fleet Spanish trawl fleet (in Subarea IXa-South (Cádiz)) Purse-seine fleets are the main responsibles for the anchovy fishery in the Division (usually more than 90% of total annual landings in the Division). Spanish fleets operate in Sub-divisions IXa-North (Southern Galicia) and IXa-South (Gulf of Cadiz), and the Portuguese ones along its national peninsular fishing grounds (Sub-divisions IXa- Central North, -Central South and South (Algarve)). Most of the fishery for this anchovy stock in the Division takes place in Sub-division IXa-South (C), where anchovy is the target species. The fleets in the northern part of Division IXa (targeting sardine) occasionally target anchovy when abundant, as occurred in Data on number and technical characteristics for the Portuguese fleets are available for 2006 (ICES, 2007 a). The Portuguese purse- seine fleet (n =121 in 2006) presently ranges in size from 10.5 to 27 m (mean vessel length = 20 m) and between 71 to 447 HP (mean = 249) in vessel engine power. Portuguese producers organisations traditionally agree a voluntary closure of the purse-seine fishery in the northern part (north of the 39º 42 North) of the Portuguese coast. This closure usually lasted from the 1 st of February to 31 of March. Since 2006, the closure, also lasting 2 months, may however be selected between 1 st of February and 30 th of April (i.e. boats stopped fishing in February to March or in March to April). Since 1999 the number of Gulf of Cadiz purse-seiners operated by Spain has oscillated between 145 (in 2004) and 84 (in 2010) vessels, and the vessels within this fleet targeting anchovy between 76 (2010) and 135 (2004) vessels. As it has been previously reported (ICES, 2007 a), the observed fluctuations during this period were mainly motivated by the ending of the fifth EU-Morocco Fishery Agreement (in 1999, which affected the heavy-tonnage fleet in the following two years: acceptation of tie-up scheme in 2000 and 2001), the rising of the light-tonnage purse seiners on those dates, and the fluctuations showed by the multipurpose vessels. These vessels fishing for anchovy account for more than 85% of the whole fleet during the available series, evidencing the importance of anchovy as a target species in the Gulf of Cadiz purseseine fishery. Since 2008 the EU Morocco Fishery Agreement was renewed, and part of the fleet (the heavier/larger vessels) devoted to the anchovy fishing in the Moroccan grounds, which entailed an important reduction of the fishing effort in the Gulf of Cadiz. A first attempt of identifying métiers in this last fleet/fishery was presented in the 2007 WGMHSA meeting (ICES, 2007 a). This study (see also Silva et al., 2007, for details) focused on the application of a non-hierarchical clustering data-mining technique (CLARA, Clustering LARge Applications) for classifying the fishing trips from 2003 to The classification of individual trips was only based on the species composition of landings from logbooks, hence the preliminary character of this study. Up to four clusters (catch profiles) were identified from each of the annual datasets according to the targeted species: 1) trips targeting anchovy, 2) trips targeting sardine; 3) trips tar-
33 ICES WGHANSA REPORT geting a mackerel (Scomber spp.) species mixture; and 4) trips targeting an anchovy and sardine mixture. The first three groupings were considered as clearly identifiable métiers according to the knowledge on the fishery. At present no comparable information on Portuguese métiers is available. The regulatory measures in place for the Spanish anchovy purse-seine fishing in this Division were the same as for the previous years and are summarized as follows: Minimum landing size: 10 cm total length; Minimum vessel tonnage of 20 GRT with temporary exemption; Maximum engine power: 450 h.p; Purse-seine maximum length: 450 m; Purse-seine maximum depth: 80 m; Minimum mesh size: 14 mm; Fishing time limited to 5 days per week, from Monday to Friday; Cessation of fishing activities from Saturday 00:00 hrs to Sunday 12:00 hrs; Fishing prohibition inside bays and estuaries. Until 1997, the Spanish purse-seine fleet voluntary closed the fishery each year from December to February in the Gulf of Cadiz (Sub-division IXa-South(C)). Since 2004, two complementary sets of management measures have been in force in this part of the Sub-division. The first one is the new Plan for the conservation and sustainable management of the purse-seine fishery in the Gulf of Cadiz National Fishing Ground. This plan is in force during 12 months from 30 th October and includes a fishery closure (basically aimed to protect the anchovy recruitment) of either 45 days (between 17 th of November to the 31 st of December in 2004 and 2005), two months (November and December in 2006) or three months (mid November 2007 to mid February 2008; 1 st December 2008 to 28 th February 2009), accompanied by a subsidized tie-up scheme for the purse-seine fleet. The expected subsidized 3-month closure from 2009 midautumn to the 2010 mid-winter was restricted to one month only, in December 2009, although the fishery was practically closed since November 2009 until February 2010 for persistent bad sea conditions during all these months. This same scheme was accomplished for the autumn/winter closure. This plan also includes additional regulatory measures on the fishing effort (200 fishing days/vessel/year as a maximum) and daily catch quotas per vessel (6000 kg of sardine-anchovy mixing, but the catch of each of these species cannot exceed 3000 kg). A new regulation approved in October 2006 establishes that up to 10% of the total catch weight may contain fish below the established minimum landing size (10 cm), but fish must always be 9 cm. The effort exerted by the entire purse-seine fleet since 1997 has been high (even with the fishing closures since 2004 on). While the effects of the fishery closures have not been formally evaluated, it appears that they have limited a further expansion of effort.
 and crustacean decapods in the Gulf (Figure A.2.1).")
34 566 ICES WGHANSA REPORT 2013 The second management action in force since 15 th of July 2004 is the delimitation of a marine protected area (fishing reserve) in the mouth and surrounding waters of the Guadalquivir river, a zone that plays a fundamental role as nursery area of fish (including anchovy) and crustacean decapods in the Gulf (Figure A.2.1). Fishing in the reserve is only allowed (with pertinent regulatory measures) to gill-nets and trammel-nets, although in those waters outside the riverbed. Neither purse-seine nor bottom trawl fishing is allowed all over this MPA. The effects of such closures and MPA in the Gulf of Cádiz anchovy recruitment are not still possible to be directly assessed. In any case, the implementation of both of these measures should benefit the stock. Figure A.2.1. Anchovy in Division IXa. Limits of the Fishing Reserve off the Guadalquivir river mouth (Spanish Gulf of Cadiz. Sub-division IXa South). A.3. Ecosystem aspects Anchovy is a prey species for other pelagic and demersal species, and for cetaceans and sea-birds. The recruitment depends strongly on environmental factors. Ruíz et al. (2006, 2007) evidenced the clear influence that meteorological and oceanographic factors have on the distribution of anchovy early life stages in shelf waters of the northeastern sector of the Gulf of Cadiz. The shallowness of the water column, the influence of the Guadalquivir River, and the local topography favor the existence of warm and chlorophyll-rich waters in the area, thus offering a favorable environment for the development of eggs and larvae. However, spring and early summer easterlies bursts may cause: a) a decrease of the water temperature by several degrees, b) generate oligotrophic conditions in the area, and c) force the offshore transport of waters over this portion of the shelf, advecting early life stages away from favorable conditions. These negative influences on the development conditions of anchovy eggs and larvae can impact on the recruitment of this species in the Gulf of Cadiz and subsequently in the anchovy fishery. The anchovy population in Subdivision IXa-South appears to be well established and relatively independent of populations in other parts of the Division. These other populations seem to be abundant only when suitable environmental conditions occur.
35 ICES WGHANSA REPORT B. Data B.1. Commercial catch Portuguese annual landings from their respective Sub-divisions are available since Spanish landings started to be available since No information on anchovy discarding in the Division IXa has been available until That year several pilot surveys for estimating discards in the Gulf of Cadiz Spanish fisheries (trawl, purse-seine and artisanal) were conducted by an IEO observer s programme onboard commercial vessels lasting five months and covering the whole study area. Preliminary results (average estimates from 6 purse-seine trips 13 hauls, not raised to total annual landings) from these pilot surveys were described in ICES (2006 a) although there were concerns about the reliability of such estimates and the ratios derived from them due to their extremely high associated CVs. On the other hand, discarded anchovies were of commercial and legal size, between 10 and 15 cm (mode at 12.5 cm), but reasons for discarding anchovy were not reported to that WG. Anchovy catches in sampled trips from the bottom otter-trawl fleet were negligible. Slipping practices are probable but not directly evidenced by sampling onboard. New data on anchovy discarding have started to be gathered since 2009 on within the Spanish National Sampling Scheme framed into the EC Data Collection Regulation (DCR). B.2. Biological Annual and quarterly length compositions of anchovy landings in Division IXa are routinely provided by Spain for its Sub-division IXa-South(C). This series dates back to Length distributions for the Spanish fishery in Sub-division IXa-North are only available for the period and they were characterized, with the exception of 1998, by fish larger than 12.5 cm (ICES, 2007 a). At present, Portugal does not provide either length distributions or catches at age of their anchovy landings in Division IXa due to their scarce catches. Catches at age from the whole Division IXa are only available from the Spanish Gulf of Cadiz fishery (Sub-division IXa South (C)). Problems with ageing/reading Gulf of Cádiz anchovy otoliths still persist. The age composition of the Gulf of Cadiz anchovy in Spanish landings is available since 1988 (see ICES, 2007 a, for tabulated data from years not shown in this report). The catch-at-age series shows that 0, 1 and 2 age groups support the Gulf of Cadiz anchovy fishery and that the success of this fishery largely depends on the abundance of 1 year-old anchovies. The contribution of age-2 anchovies usually accounts for less than 1% of the total annual catch (except in 1997, 1999, the period and since 2008 on, with contributions oscillating between 2% and 14%). Likewise, age-3 anchovies only occurred in the first quarter in 1992 and since 2008 on, but the importance of this age class in the total annual catch those years was insignificant. Inter-annual variations in the contribution of each age group in landings throughout the historical series are described in ICES (2007 a, 2008 a). Weights at age in the stock for the Gulf of Cádiz anchovy correspond to yearly estimates calculated as the weighted mean weights-at-age in the catches for the second and third quarters (throughout the spawning season). Catches at age from the Spanish fishery in Sub-division IXa North are presently not available since commercial landings used to be negligible. Mean length- and mean
36 568 ICES WGHANSA REPORT 2013 weight-at-age data are only available for Gulf of Cadiz anchovy catches. The analysis of small samples of otoliths from Subdivision IXa North in 1998 and 1999 rendered estimates of mean sizes at ages 1, 2 and 3 of 15.5 cm, 17.6 cm and 17.9 cm respectively (ICES, 2000, 2001). A sample of 78 otoliths from the same area was collected during the PELACUS 0402 acoustic survey. Mean lengths at age 1 and 2+ were 13.7 cm and 17.0 cm (Begoña Villamor, pers. comm.). Comparisons of these estimates with the ones from the Gulf of Cadiz anchovy indicate that southern anchovies attain smaller sizes at age. Previous biological studies based on commercial samples of Gulf of Cadiz anchovy (Millán, 1999) indicate that its spawning season extends from late winter to early autumn with a peak spawning time for the whole population occurring from June to August. Length at maturity was estimated in that study at cm in males and cm in females. However, it was evidenced that size at maturity may vary between years, suggesting a high plasticity in the reproductive process in response to environmental changes. Annual maturity ogives for Gulf of Cadiz anchovy are routinely provided to ICES. They represent the estimated proportion of mature fish at age in the total catch during the spawning period (second and third quarters) after raising the ratio of mature-at-age by size class in monthly samples to the monthly catch numbers-at-age by size class. Natural mortality is unknown for this stock. By analogy with anchovy in Sub-area VIII, natural mortality is probably high (M=1.2 is used for the data exploration). B.3. Surveys B.3.1. Acoustic surveys The IPIMAR s Portuguese surveys series (SAR and SARNOV series, carried mainly out with the R/V Noruega) correspond to those ones routinely performed for the acoustic estimation of the sardine abundance in Division IXa off the Portuguese continental shelf and Gulf of Cadiz, during March-April (sardine late spawning season) and November (early spawning and recruitment season). Since 2007 on, the Spring surveys are being planned as pelagic community surveys. This shift in planning mainly entailed, as compared with previous years, a substantial increase in the number of fishing stations in the Sub-division IXa-South, where the species diversity is higher, changing the series its former name by the one of PELAGO surveys. Anchovy estimates from these survey series started to be available since November Spanish pelagic community acoustic surveys have been conducted by IEO in Subdivision IXa North and Division VIIIc since 1983 (the spring PELACUS series with the R/V Thalassa). Results from these surveys for the Sub-division IXa North have shown the scarce presence or even the absence of anchovy in this area (Carrera, 1999, 2001; Carrera et al., 1999). This situation still continues in the most recent years (surveys in the period, see Porteiro et al., 2005; Iglesias et al., 2007). Spanish acoustic surveys in the Gulf of Cadiz waters (Sub-division IXa-South) have been sporadically conducted by IEO from 1993 to A consistent yearly series of early summer acoustic surveys (ECOCÁDIZ series) estimating the anchovy abundance in the Subdivision IXa South (Algarve and Gulf of Cadiz) started in Surveys in this new series are also planned under the pelagic community approach. Unfortunately, this series may show some gaps in those years coinciding (same dates and surveyed area) with the conduction of the (initially triennial) anchovy DEPM survey because of the available ship time (R/V Cornide de Saavedra). In 2009 two addi-
37 ICES WGHANSA REPORT tional surveys to the conventional one were also conducted, but mainly restricted to the Spanish waters. So, in July 2009 a complementary and almost synchronous survey to the ECOCÁDIZ 0609 conventional survey was carried out with a small-draught vessel, R/V Francisco de Paula Navarro, aiming to survey shallower waters than 20 m depth not sampled by no vessel, either Spanish or Portuguese, routinely surveying the study area (ECOCÁDIZ-COSTA 0709 survey). The acoustic estimates from this survey were separately given in the 2010 WG report from its conventional survey awaiting an intercalibration of data for a further merging of estimates if possible. In October 2009 a new autumn survey (ECOCÁDIZ-RECLUTAS 1009, R/V Emma Bardán), aimed to acoustically estimate the abundance and biomass of Gulf of Cádiz anchovy recruits, was planned to be conducted throughout the easternmost Portuguese waters and those waters off the central part of the Spanish Gulf of Cádiz, waters that supposedly include the main Gulf of Cádiz anchovy recruitment area. Unfortunately, the shortness of the available ship-time to cover a more intensive acoustic sampling grid (i.e. 4 nm spaced transects from 100 to 7-10 m depth) than the conventionally planned in standard surveys and some other unforeseen circumstances (e.g., a one-day technical stop for crew replacement, 2-day military manoeuvres just in the middle of both the survey area and calendar) prevented finally from covering the whole survey area. For the above reasons, the surveyed area was restricted to a relatively small central area in front the Guadalquivir river mouth rendering a very probable underestimation of the recruits abundance. Continuity of this survey in following years will necessarily depend on external (EC) funding. All these surveys followed the standard methodology adopted by the Planning Group for Acoustic Surveys in ICES Subareas VIII and IX (ICES, 1986; 1998) and recommendations given by the WGACEGG (ICES, 2006 b,c). The methodological differences between these recent surveys are not considered by the WGACEGG as important as to prevent from any comparison between their results, such differences being basically due to: The echo-sounder and working frequencies used (IPIMAR surveys: Simrad EK 500 working at 38 and 120 KHz; IEO surveys since 2007 onwards: Simrad EK 60 working at 18, 38, 70, 120, and 200 KHz). The fishing gear used as sampler for echo-trace identification/confirmation and gathering biological data (IPIMAR surveys: bottom and pelagic trawl gears; IEO surveys: pelagic trawl). The software used for data storage and post-processing (IPIMAR surveys: Movies+ software; IEO surveys: SonarData EchoView software). The set of species-specific TS-length relationships: at present, the new IPIMAR spring survey series, PELAGOS, takes into account the same agreed species-specific TS values than the IEO surveys, but for mackerel (b20 IPIMAR= 82.0 vs b20 IEO= 84.9). Regarding their respective objectives, the SAR Portuguese November surveys, as presently planned, are mainly aimed at the mapping of the spatial distribution of sardine Sardina pilchardus, and anchovy Engraulis encrasicolus, and the provision of acoustic estimates of their abundance and biomass by length class and age groups, speciallly the computation of a sardine recruitment index (for the time being agestructured estimates are only available for sardine). Although the main objective of the ECOCÁDIZ Spanish surveys was formerly the mapping and the size-based and age-structured acoustic assessment of the anchovy
 are also obtained.")
38 570 ICES WGHANSA REPORT 2013 SSB, and hence the survey s dates, mapping and acoustic estimates of all of those species susceptible of being assessed (according to their occurrence frequency and abundance levels in fishing stations) are also obtained. This same multi-species or pelagic community approach has also been adopted in the new PELAGO Spring Portuguese survey series, at least, for the time being, for the southern area (Subarea IXa South), which has involved a substantial increase in the number of fishing stations as compared with previous surveys. In any case, the progressive inclusion of alternative (continuous and discrete) samplers for collecting ancillary information on the physical and biological environment (including top predators) are shaping these surveys as true pelagic ecosystem surveys. Figure B Transects surveyed by the Spring PELAGO, PELACUS and PELGAS surveys. The early Summer ECOCÁDIZ surveys samples the same area that the PELAGO one in the Gulf of Cádiz waters (from Cape San Vicente to Cape Trafalgar). B.3.2. DEPM Surveys The Daily Egg Production Method (DEPM) for estimation of anchovy spawning biomass of the Gulf of Cádiz (South-Atlantic Iberian waters) is conducted every three years by IEO (Spain) since The first survey of this series was in 2005 (BOCADE- VA 0605) and the second one in 2008 (BOCADEVA 0608). As described for the acoustic surveys, methods adopted for Gulf of Cádiz anchovy DEPM surveys follow the standards and recommendations given. Figure B shows the grid of egg sampling with the PairoVET sampler. Table B summarises the methodology used in these surveys (BOCADEVA 0608 used as example) in order to obtain the eggs and adults samples.

39 ICES WGHANSA REPORT Table B BOCADEVA 0608 Gulf of Cádiz anchovy DEPM survey. General sampling PORTUGAL SPAIN 36.5 Sagres Portimao Faro Guadiana River Isla Cristina HUELVA Chipiona CÁDIZ Guadalquivir River Sanlúcar de Barrameda Barbate Tarifa MAROCCO Figure B Sampling grid adopted in the BOCADEVA anchovy DEPM surveys series. Anchovy biomass estimation from these surveys was based on procedures and software adapted and developed during the WKRESTIM that took place between 27-30/04/2009 in Madrid (with e-participation of IPIMAR members from Lisbon), and validated by the WGACEGG. All calculations for area delimitation, egg ageing and model fitting for egg production (P0) estimation were carried out using the R packages (geofun, eggsplore and shachar) available at ichthyoanalysis ( The surveyed area (A) was calculated as the sum of the area represented by each station. The spawning area (A+) was delimited with the outer zero anchovy egg stations, and was calculated as the sum of the area represented by those stations. The model of egg development with temperature was derived from the incubation experiment carried out in Cádiz in July 2007
40 572 ICES WGHANSA REPORT 2013 (Duarte et al., 2007). A multinomial model was applied (Ibaibarriaga et al., 2007, Bernal et al. 2008) considering only the interaction Age*Temp (other interactions were not significant). Egg ageing was achieved by a multinomial Bayesian approach described by Bernal et al. (2008) and using in situ SST; a normal probability distribution was used with peak spawning assumed to be at 22:00h with 2h standard deviation. This method uses the multinomial development model and the assumption of probabilistic synchronicity (assuming a normal distribution). Daily egg production (P0) and mortality (z) rates were estimated by fitting an exponential mortality model to the egg abundance by cohorts and corresponding mean age. The model was fitted using a generalized linear model (GLM) with negative binomial distribution. The ageing process and the GLM fitting were iterative until the value of z converged. Finally, the total egg production was calculated as: Ptot = P0 A+ The adult parameters estimated for each fishing haul considered only the mature fraction of the population (determined by the fish macroscopic maturity data). Before the estimation of the mean female weight per haul (W), the individual total weight of the hydrated females was corrected by a linear regression between the total weight of non-hydrated females and their corresponding gonad-free weight (Wnov). The sex ratio (R) in weight per haul was obtained as the quotient between the total weight of females on the total weight of males and females. The expected individual batch fecundity for all mature females (hydrated and non-hydrated) was estimated by modelling the individual batch fecundity observed (Fobs) in the sampled hydrated females and their gonad-free weight (Wnov) by a GLM. The fraction of females spawning per day (S) was determined, for each haul, as the average number of females with Day-1 or Day-2 POF, divided by the total number of mature females (the number of females with Day-0 POF was corrected by the average number of females with Day-1 or Day- 2 POF, and the hydrated females were not included). The mean and variance of the adult parameters for all the samples collected was then obtained using the methodology from Picquelle and Stauffer (1985; i.e., weighted means and variances). All estimations and statistical analysis were performed using the R software. The spawning biomass was computed according to: P0 * Area + SSB = ( F * S * R) / W The high uncertainty associated to the estimates (especially to those ones related to the egg sampling in the 2005 survey) was matter of concern for the 2009 WGANSA and it was recommended that the appropriateness of the egg sampling scheme were revised in the 2009 WGACEGG. It was concluded by this last working group that reducing the variance in future surveys can probably be attained by increasing the number of stations in the actual positive spawning areas (adaptive sampling) and perhaps by applying GAM based estimators. B.4. Commercial CPUE The annual series of both nominal fishing effort (number of fishing trips) and CPUE indices of anchovy in Division IXa are available for the Gulf of Cadiz Spanish purseseine fishery since The data series from the Spanish purse-seine fishery off southern Galician waters (Sub-division IXa North) only comprise the period whereas no data from the Portuguese purse-seine fisheries along the Division are available. Causes for this scarcity or even absence of data from the later fisheries must be found in their low anchovy annual catches during the last 3-4 decades and mainly by the fact that these fisheries target sardine.
41 ICES WGHANSA REPORT Regarding the Gulf of Cadiz anchovy Spanish fishery, data on annual values of nominal effort (fishing trips targeting on anchovy) and CPUE by fleet type have routinely been provided to ICES. The series of effective effort and CPUE from all of the Spanish fleets exploiting the Gulf of Cadiz anchovy were provided for the first time to the WGMHSA in For such a purpose, vessels from single-purpose fleets were additionally differentiated according to their tonnage in heavy- ( 30 GRT) and light- (<30 GRT) tonnage vessels, rendering a total of 11 fleet types. The standardisation procedure was performed in the last years by fitting quarterly log-transformed CPUE s from fleet types composing the fishery to a GLM (Robson, 1966; Gavaris, 1980) which only included the effects of quarter and fleet type (without any interaction), (ICES, 2007 a). Since 2008 the GLM fitting is performed with the following modifications to the original version: (a) the effect of missing values in the nominal CPUE data was smoothed by adding a constant value to data before their log-transformation (ICES, 2008 b). In this case, this constant was computed as the 10% of the average value for the whole nominal CPUE series resulting in log(cpue adjusted) data. (b) the model includes year, quarter, fleet type and first order interaction effects. Reference fleet (métier or fleet type), year and season used in the standardisation were the Barbate s single-purpose high-tonnage fleet, the first year in the series, 1988, and the first quarter in the year, respectively. The updated series of standardised effort and CPUE from all of the fleets exploiting the fishery is provided to the WG each year. Annual and half-year standardised CPUE series for the whole fleet are computed from the quotient between the sum of raw quarterly catches and that of standardised quarterly efforts within each of the respective time periods. According to literature, CPUE indices have been considered, as not reliable indicators of abundance for small pelagic fishes (Ulltang, 1982, Csirke 1988, Pitcher 1995, Mackinson et al. 1997). At present, the series of CPUE indices is only used for interpreting the fleet s dynamics. B.5. Other relevant data C. Historical Stock Development Model used: For the time being, no analytical assessment model has been successfully applied. An exploratory assessment was under development until This exploratory assessment carried out so far was only performed for the anchovy population nucleus in the Gulf of Cádiz (Sub-division IXa-South: Algarve + Cádiz zones), the remaining resilient anchovy populations along the Atlantic Iberian façade of the Division being out of the scope of this assessment. The model used was an ad hoc seasonal separable model implemented and run on a spreadsheet for data exploration of anchovy catchat-age data in IXa South since 1995 onwards. Given the nature of stock, short-lived, data in this model were analysed by half-year-periods, those from the Algarvian anchovy being previously compiled by applying Gulf of Cadiz ALKs. Weights at age in the catches were estimated as usual, whereas weights at age in the stock corresponded to yearly estimates calculated as the weighted mean weights-at-age in the catches for the second and third quarters (reproductive season). The model was fitted to the updated half-year catch-at-age data until the assessment s last year and to the available acoustic estimates of anchovy aggregated biomass from the spring Portuguese surveys series only (including the acoustic estimate one year ahead of the assessment s last year).
42 574 ICES WGHANSA REPORT 2013 Reasons for the choice of the above tuning index were: (a) the Spanish acoustic survey series (2004, 2006, 2007), was not used as a tuning index because of its shortness; (b) neither the DEPM-based anchovy SSB was considered since it has only 1 data point until the last year, but it was provided for comparison with the acoustic and model-predicted biomass estimates; (c) both Portuguese acoustic surveys series (spring and autumn surveys) were used as tuning indices in the past, assuming the same catchability coefficient. However, each survey series cover different fractions of the population so, the assumption of same catchability is probably inappropriate. Given that the model is unlikely to be able to estimate the extra parameter and that the spring survey series has a better coverage both in space and time, only this survey series was recently used. The exploratory runs were recently performed under the following assumptions: Assessment only tuned by Spring Portuguese acoustic surveys (for the reasons above). Catches at age are assumed by the model to be linked by the Baranov catch equations. The relationship between the index series and the stock sizes is assumed linear. A constant selection pattern is assumed for the whole period. F values for 1995 (assessment s first year) are computed as an average of the Fs in subsequent years. F in the 2nd half-year in the assessment s last year estimated as a ratio of the F estimated in the 1st half by applying the ratio of seasonal Fs in the previous year (affected by a closure as well in the last years). No available Cages for the first half in the year ahead of the assessment s last year: assumed as the same ones that in first half in the assessment s last year. Wagesstock in the year ahead of the assessment s last year: average of the estimates in the 3 last years in the assessment. F in the 1st half year of the assessment s last year: average of estimated 1st half-year Fs counterparts for the same period of years. Log-residuals of Cages in the year ahead of the assessment s last year excluded from the minimisation routine whereas the residuals from the biomass acoustic estimate in the year ahead of the assessment s last year are included in the model fitting. Runs explored last years consisted in: RUN 1: Acoustic surveys as a relative tuning index and a weighting factor= 1. RUN 2: Acoustic surveys as a relative tuning index and a weighting factor= 6. RUN 3: Acoustic surveys as an absolute tuning index and a weighting factor= 1. An upweighting factor of 6 for the acoustic estimates in RUN 2 was selected in order to balance the influence of their annual residuals in relation to those from catches at age (3 age groups x 2 semesters in a year). The rational for RUN 3 is the similarity between the estimates by the Portuguese survey and the Spanish DEPM in 2005 (around 14,000 tonnes).
43 ICES WGHANSA REPORT Parameters estimated are selectivity at age for both half-year-periods in relation to the reference age (age 1), recruitment, an average SSB, survey catchability (Q) and annual F values per half-year-period. Parameters are estimated by minimising the sum of squares of the log-residuals from the catch-at-age and the acoustics biomass data. The exploratory assessments performed so far with this ad hoc model have not been recommended as a basis for predictions or advice. The immediate reason is that it usually estimated a large drop in fishing mortality and rapid increase in stock abundance in recent years, which is not supported by the data or the development of the fishery. The residuals showed large clusters over time, indicating that the selection may not be constant, one of the model s assumptions. Migration between the main nucleus in the Gulf of Cádiz and adjacent areas might be one of the causes explaining the discrepancies found in the assessment and it should be properly studied. The exploratory model utilised so far does not provide any reliable information about the true levels of both the stock, F and Catch/SSB ratios since the assessment is not still properly scaled. For all the above reasons in 2009 was preferred to do not perform any exploratory assessment with this model. Instead of this, the provision of advice relies in an update of the qualitative assessment carried out in 2008 and accepted by the Review Groups of the 2008 and 2009 WGANC (RGANC). This qualitative assessment is based on the joint analysis of trends showed by the available data, both fishery-dependent and independent information (i.e., landings, fishing effort, cpue, survey estimates). Advice is framed in a precautionary manner to limit exploitation and, accordingly, the basis for advice is average catches over a reference period. Software used: the exploratory model was implemented and run in a MicroSoft Excel spreadshet. Model Options chosen: Input data types and characteristics: Type Name Year range Age range Variable from year to year Yes/No Caton Catch in tonnes Canum Catch at age in numbers Weca Weight at age in the commercial catch West Weight at age of the spawning stock at spawning time. Mprop Proportion of natural mortality before spawning Fprop Proportion of fishing mortality before spawning Matprop Proportion mature at age Natmor Natural mortality
44 576 ICES WGHANSA REPORT 2013 Tuning data: Type Name Year range Age range Tuning fleet 1 Tuning fleet 2 Tuning fleet 3. D. Short-Term Projection Model used: Software used: Initial stock size: Maturity: F and M before spawning: Weight at age in the stock: Weight at age in the catch: Exploitation pattern: Intermediate year assumptions: Stock recruitment model used: Procedures used for splitting projected catches: E. Medium-Term Projections Model used: Software used: Initial stock size: Natural mortality: Maturity: F and M before spawning: Weight at age in the stock: Weight at age in the catch: Exploitation pattern: Intermediate year assumptions: Stock recruitment model used: Uncertainty models used:
45 ICES WGHANSA REPORT Initial stock size: 2. Natural mortality: 3. Maturity: 4. F and M before spawning: 5. Weight at age in the stock: 6. Weight at age in the catch: 7. Exploitation pattern: 8. Intermediate year assumptions: 9. Stock recruitment model used: F. Long-Term Projections Model used: Software used: Maturity: F and M before spawning: Weight at age in the stock: Weight at age in the catch: Exploitation pattern: Procedures used for splitting projected catches: G. Biological Reference Points H. Other Issues I. References Bernal, M., Ibaibarriaga, L., Lago de Lanzos, A., Lonergan, M.E., Hernandez, C., Franco, C., Rasines, I., Valdes, L. and Borchers, D.L., Using multinomial models to analyse data from Iberian sardine egg incubation experiments: a comparison with traditional techniques. ICES J. Mar. Sci., 65: Carrera, P Acoustic survey JUVESU 0899: preliminary results. Working Document presented to the ICES Working Group on the Assessment of Mackerel, Horse Mackerel, Sardine and Anchovy. ICES, C.M. 2000/ACFM:05.
46 578 ICES WGHANSA REPORT 2013 Carrera, P Acoustic abundance estimates from the multidisciplinary survey PELACUS Working Document presented to the ICES Working Group on the Assessment of Mackerel, Horse Mackerel, Sardine and Anchovy. ICES, C.M. 2002/ACFM:06. Carrera, P., Villamor, B., Abaunza, P Report of the acoustic survey PELACUS 0399: results on sardine, mackerel, horse mackerel and anchovy. Working Document presented to the ICES Working Group on the Assessment of Mackerel, Horse Mackerel, Sardine and Anchovy. ICES, C.M. 2000/ACFM:05. Duarte, J, M. Bernal, M.P. Jiménez, J. Canoura, E. García, A. Juárez, I. Muñoz, Egg development model for anchovy (Engraulis encrasicolus) in the Gulf of Cádiz. ICES Working Group on Acoustic and Egg Surveys for Sardine and Anchovy in ICES areas VIII and IX (WGACEGG). García-Isarch, E., Millán, M., Ramos, F., García-Santamaría, T and Burgos, C Science and the Challenge of Managing Small Pelagic Fisheries on Shared Stocks in Northwest Africa. Science and the Challenge of Managing Small Pelagic Fisheries on Shared Stocks in Northwest Africa, available at Gavaris, S., Use of a multiplicative model to estimate catch rate and effort from commercial data. Can. J. Fish. Aquat. Sci., 37: Ibaibarriaga, L., Bernal, M., Motos, L., Uriarte, A., Borchers, D.L., Lonergan, M.E., and Wood, S.N Characterization of stage-classified biological processes using multinomial models: a case study of anchovy (Engraulis encrasicolus) eggs in the Bay of Biscay. Canadian Journal of Fisheries and Aquatic Sciences, 64: ICES, Report of the Planning Group for Acoustic Surveys in ICES Sub-Areas VIII and IX. Lisbon, 1-4 April ICES CM 1986/H:27. 7 pp. ICES, Report of the Planning Group for Acoustic Surveys in ICES Sub-Areas VIII and IX. A Coruña, January ICES CM 1998/G:2. 17 pp. ICES Report of the Working Group on the Assessment of Mackerel, Horse Mackerel, Sardine and Anchovy (WGMHSA). ICES, C.M. 2000/ACFM:05. ICES Report of the Working Group on the Assessment of Mackerel, Horse Mackerel, Sardine and Anchovy (WGMHSA). ICES, C.M. 2001/ACFM:06. ICES, 2006 a. Report of the Working Group on the Assessment of Mackerel, Horse Mackerel, Sardine, and Anchovy. ICES CM 2006/ ACFM: 36. ICES, 2006 b. Report of the Working Group on Acoustic and Egg Surveys for Sardine and Anchovy in ICES areas VIII and IX (WGACEGG), October 2005, Vigo, Spain. ICES, C.M. 2006/LRC: pp. ICES, 2006 c. Report of the Working Group on Acoustic and Egg Surveys for Sardine and Anchovy in ICES Areas VIII and IX (WGACEGG), 27 November-1 December 2006, Lisbon, Portugal. ICES C.M. 2006/LRC: pp. ICES 2007 a. Report of the Working Group on the Assessment of Mackerel, Horse Mackerel, Sardine and Anchovy (WGMHSA). ICES CM 2007/ACFM:31 ICES 2007 b. Report of the Working Group on Acoustic and Egg Surveys for Sardine and Anchovyin ICES areas VIII and IX (WGACEGG). ICES CM 2007/LRC:16 ICES a. Report of the Working Group on Anchovy (WGANC), June 2008, ICES Headquarters, Copenhagen. ICES CM 2008 ACOM: pp. ICES b. Report of the Working Group on Acoustic and Egg Surveys for Sardine and Anchovy in ICES Areas VIII and IX (WGACEGG), November 2008, Nantes, France. IC- ES CM 2008/LRC: pp. ICES b. Report of the Working Group on Acoustic and Egg Surveys for Sardine and Anchovy in ICES Areas VIII and IX (WGACEGG), November 2009, Lisboa, Portugal. ICES CM 2009/LRC: pp.
47 ICES WGHANSA REPORT Millán, M., Descripción de la pesquería de cerco en la Región Sur-atlántica Española y Atlántico-Norte Marroquí. Informes Técnicos Instituto Español Oceanografía 136, 70pp. Millán, M Reproductive characteristics and condition status of anchovy (Engraulis encrasicolus, L.) from the Bay of Cadiz (S.W. Spain). Fish. Res., 41: Picquelle, S., Stauffer, G., Parameter estimation for an egg production method of northern anchovy biomass assessment. In: Lasker (ed.) An Egg Production Method for Estimating Spawning Biomass of Pelagic Fish: application to the northern anchovy, Engraulis mordax. NOAA Tech. Rep. NMFS 36: pp. Robson, D.S., Estimation of the relative fishing power of individual ships. ICNAF Research Bulletin, 3:5-14. Silva, L., Castro J., Ramos, F. and Punzón A., Identification of métiers in the Gulf of Cadiz Spanish purse-seine fishery (ICES Subdivision IXa-South). Working document presented to the ICES Working Group on the Assessment of Mackerel, Horse Mackerel, Sardine and Anchovy. ICES, C.M. 2007/ACFM:31.
48 580 ICES WGHANSA REPORT 2013 A.5.3 Stock Annex Sardine in Division VIIIc and IXa (Sar-Soth) Stock specific documentation of standard assessment procedures used by ICES. Stock: Working Group: Sardine in Divisions VIIIc and IXa (sar-soth). WGHANSA Date: February 2012 Revised by: WKPELA 2012 A. General A.1. Stock definition European sardine (Sardine pilchardus Walbaum, 1792) has a wide distribution extending in the Northeast Atlantic from the Celtic Sea and North Sea in the north to Mauritania in the south. Populations of Madeira, the Azores and the Canary Islands are at the western limit of the distribution (Parrish et al., 1989). Sardine is also found in the Mediterranean and the Black Seas. Changing environmental conditions affect sardine distribution, with fish having been found as far south as Senegal during episodes of low water temperature (Corten and van Kamp, 1996; Binet et al., 1998). The sardine stock assessed by ICES covers the Atlantic waters of the Iberian Peninsula (ICES Areas VIIIc and IXa), extending from the Strait of Gibraltar in the south to the border with France in the Inner Bay of Biscay in the north. These limits are somewhat arbitrary in that they were set for management purposes (Figure A.1).
 it is likely that there could be movement of fish to and from the stock")
49 ICES WGHANSA REPORT Figure A.1. Map of the current Iberian sardine stock area showing (in orange) the ICES Divisions and subdivisions currently considered in the assessment of the stock. Because sardine distribution is continuous in the Northeast Atlantic (from the Agadir area in north Morocco to the North Sea) it is likely that there could be movement of fish to and from the stock area and it is the level and impact of this movement which is relevant for the assessment of sardine in Iberian waters. Several genetic studies have failed to demonstrate population differentiation inside the area, with only weak population structure being found using allozymes (Laurent et al., 2007, Figure 2) and microsatellite DNA (Kasapidis et al., 2012). These studies also reported that sardine taken from Azores and Madeira was genetically closer to Mediterranean samples than to those sampled in other areas of the Northeast Atlantic. Common genetic and life-history characters provide indication of the possibility of some mixing across the southern Iberian stock limit (Gulf of Cádiz) with sardine populations from southwest Mediterranean and northern Morocco. However, the absence of large sardine populations in these areas would limit the influence of such movements in the dynamics of the Iberian stock. There are also indications of spatial population substructuring across Iberian waters. Although sardine shows a nearly continuous spawning ground distribution along the Iberian and French Atlantic coasts (Bernal et al., 2007), there some evidence of distinct recruitment pulses off the two main recruitment areas in some years (northern Portugal and the Gulf of Cádiz) and observation that these mainly influence the demogra-
50 582 ICES WGHANSA REPORT 2013 phy of adjacent populations but not that of distant ones (Silva et al., 2009; Riveiro et al., 2012 WD). Persistent spatial differences in growth (Silva et al., 2008) and spawning temperature tolerance have also been found (Stratoudakis et al., 2007) and these together with the existence of a persistent gap (Bernal et al., 2007) in the spawning area corroborate the hypothesis of spatial heterogeneity of sardine populations. However, indirect evidence of movements from otolith chemistry (Castro, 2007) and cohort analyses (Sardyn project report) suggest that sardines recruiting on the western area move gradually north or south as they grow, crossing the above potential discontinuities. Catch and survey-at-age data appear to indicate that some strong year classes in the Cantabrian Sea (VIIIc East) originated from recruitment areas in the Gulf of Biscay (VIIIa,b) (Riveiro et al., 2012WD). Furthermore, the northern extent of this homogeneous population is still unclear. Sardine maturity-at-length seems to decline substantially in northern France while growth might increase in the English Channel (Silva et al., 2008a). Young sardine are not usually observed in this northern area (although juveniles have been recently sampled in the North Sea), suggesting that older (2+) spawning individuals from the English Channel possibly originate in the French coast. Microsatellite analyses revealed no significant genetic differentiation among sardines in Subarea VII and VIII (Shaw et al., 2012). The inner Bay of Biscay does not represent a barrier for other small pelagic fish populations either; as horse mackerel, anchovy and mackerel stocks are also considered to distribute across the Cantabrian Sea and Gulf of Biscay (Abaunza et al., 2008; Uriarte et al., 1996, 2001). No other barriers were evidenced within French Atlantic waters for any of these species. In recent years there has been an increase of sardine in both the commercial landings and in fishery-independent surveys in the Celtic Sea and western Channel (VIIe j) (Beare et al., 2004) and is forming the basis of a locally important fishery (Cornish sardine) (ICES, 2010). Further efforts should help to clarify sardine population structure in this area and their relationship with fish in the Bay of Biscay and the Iberian sardine stock, in order to take into account regional dynamics in the context of an area based assessment. A.2. Fishery The bulk of the landings in both Spain and Portugal (99%) are made by purse-seiners. The Spanish purse-seine fleet targets anchovy (Engraulis encrasicolus), mackerel (Scomber scombrus) and sardine, (which occur seasonally in the area) and horsemackerel (Trachurus trachurus) which is available all year-round (Uriarte et al., 1996; Villamor et al., 1997; Carrera and Porteiro, 2003). In summer, part of the fleet switches to trolling lines or bait boat for tuna fishing, a resource with a marked seasonal character. Since 2004, Spanish legislation requires that purse-seiners must have, at least, a length of 11 m in the Atlantic coast of Spain. Moreover, the gear must have a maximum length of 600 m, a maximum height of 130 m and minimum mesh size of 14 mm (see Table A.2.1). Because of this regulation, most of the effort and catches are registered in logbooks (which are mandatory for boats larger than 10 m). Analysis of these logbook data from 2003 to 2005 (Abad et al., 2008) showed that currently, sardine and horse-mackerel represent 75% of the total landings of the purse-seine fleet, which is in accordance with the values observed in historical series of purse-seine catch statistics, especially when the anchovy is scarce (ICES, 2007). Sardine catches show the highest values in summer and autumn and effort concentrates in southern Galician
51 ICES WGHANSA REPORT and western Bay of Biscay waters. Vessels can be characterized by 21 m length overall, 296 HP, and 57 gross tonnage. In Portugal, sardine is the main target species of the purse-seine fleet comprising 98% of the landings. The sardine fishery is of great social-economical importance for the fishing community and industry since it represents an important part of the fish production and a relevant supply for the canning sector. Other pelagic species such as chub mackerel (Scomber japonicus), horse mackerel and anchovy are also landed by the purse-seine fishery. Currently, purse-seiners in Portuguese waters have a length of about 20 m; an engine horsepower between 100 and 500 HP and use a minimum mesh size of 16 mm (see Table A.2.1). According to Stratoudakis and Marçalo (2002), fishing is usually close to the home port, on short (daily) trips where the net is set once or twice, usually around dawn. A large part of a typical fishing trip is spent searching for schools with echosounders and sonars. Once schools of pelagic fish have been detected, large nets (up to 800 m long and 150 m deep) are set rapidly with the help of an auxiliary small vessel, and hauled in a largely manual operation involving all members of the crew (usually between people) (Mesquita, 2008).
52 584 ICES WGHANSA REPORT 2013 Table B.2.1. Summary of the major existing regulatory mechanism for sardine. Species Technical measure National/European level Specification Note Source/date of implementation Sardine Minimum size European 11 cm 10% undersized allowed VIIIc,IXa: minimum vessel tonnage 20 GRT, maximum engine power 450 hp, max length purse-seine 450 m, max height purse-seine 80 m, Sardine/Anchovy Effort limitations National (ES) minimum mesh size 14 mm, max number of fishing days/week: 5, fishing prohibited in bays and estuaries Gulf of Cádiz: Maximum net length 450 m. Maximum net high 80 m. Max 7000 kg/day/boat fish >15 cm, max 2000 kg/day/boat fish Sardine Catch limitation National (ES) between 11 and 15 cm. IXaS Cádiz: 3000 kg/vessel day(<10% of small sardine (<9 cm)) IXaS Cádiz: fishing closures Sardine/anchovy Area closure National (ES) implemented annually between November February Sardine/Anchovy Effort limitations National (PT) IXa: max length of purse-seine 800 m, max height of purse-seine 150 m, max number of fishing days/week: 5, max number of fishing days/year: 180 Portaria n.o G/2000 de 22 de Novembro EU Reg 850/98 amended 1999, 2000, 2001,
53 ICES WGHANSA REPORT Species Technical measure National/European level Specification Note Source/date of implementation Sardine/Anchovy Area closure National (PT) Sardine Catch limitation National (PT) All species Mesh sizes European All species Mesh openings European No purse-seine fishing at depths lower than 20 m. For 2012, there is a 45 day fishing ban for sardine for all regional PO, in alternate periods between 15 February and 30 April. 55 thousand tons January May 2012: 9 thousand tons different specifications acc. to catch compositions different specifications acc. to catch compositions Despacho n.º 1521/2012, 1 February 2012 Applicable to vessels associated under PO (Producer Organization) which make 96% of the landings. Nonassociated vessels have equivalent restrictions. In Portugal, >16 mm, Portaria n.o G/2000 de 22 de Novembro EU Reg 850/98 amended 1999, 2000, 2001, 2004 EU Reg 850/98 amended 1999, 2000, 2001, 2004
54 586 ICES WGHANSA REPORT 2013 A.3. Ecosystem aspects There are a number of studies investigating the role of sardine in the ecosystem both as predator and prey. Sardine is widely distributed all along the Atlantic Iberian shelf in waters ranging from 10 to 100 m (e.g. Porteiro et al., 1996). Analysis of its stomach contents and stable isotope signature indicate an omnivorous feeding behaviour, related to its ability to feed by particle-feeding and filter-feeding (more common as fish grow older, Bode et al., 2003), and its exploitation of a wide range of prey (both phytoplankton and zooplankton have been found in its diet, e.g. Bode et al., 2004). In addition, sardines have been found to ingest their own eggs (and probably those of other species) and this cannibalism may act as a density control mechanism (Garrido et al., 2007). The composition of nitrogen isotopes in the muscle of sardine integrates fish diet over seasonal periods and reflects the composition of plankton over large shelf areas. A differential isotopic signature in high and low upwelling zones reflects low mobility of sardines during periods of low population size (Bode et al., 2007). Sardine is prey of a range of fish and marine mammal species which take advantage of its schooling behaviour and availability. Sardine has been found to be important in the diet of common dolphins (Delphinus delphis) in Galicia (NW Spain) (Santos et al., 2004), Portugal (Silva, 2003) and the Atlantic French coast (Meynier, 2004). Recent studies of consumption of common dolphins in Galician (Santos et al., 2011b) waters give figures ranging from almost 6000 tons to more than 9000 tons of sardine, which represents a rather small proportion of the combined Spanish and Portuguese annual landings of sardine from ICES Areas VIIIc and IXa (6 7%).There are also other species feeding on sardine, although to a lesser extent, such as: harbour porpoise (Phocoena phocoena), bottlenose dolphin (Tursiops truncatus), striped dolphin (Stenella coeruleoalba), and white-sided dolphin (Lagenorhynchus acutus) (e.g. Santos et al., 2007). Habitat modelling studies aim to identify which environmental processes could be defining the habitat of a species and eventually to be able to predict fish distribution. Zwolinski et al. (2008) analysed the relationship between data on sardine distribution obtained by the Portuguese acoustic surveys and four environmental variables (subsurface salinity, temperature, chlorophyll concentration and plankton presence). Sardine showed a preference for waters with low temperature and salinity, high chlorophyll content and low planktonic backscattering energy. Populations of planktivorous fish, such as the sardine, show large fluctuations in size and distribution over the Atlantic Iberian shelf (Carrera and Porteiro, 2003). Periods of good recruitments have helped develop new industries and led to the social and economic changes while periods of continuous low recruitments have brought economic hardship in many areas. This was the case of the Iberian sardine at the end of the 1990s, when several successive poor recruitments led to an all time low of the stock biomass. Sardine is a batch spawner producing batches of eggs over an extended period of time (October to May) in Iberian waters with different peaks between southern and northern regions. Although the survival of offspring is highly dependent on favourable environmental conditions (concentrations of egg/larvae in suitable areas), sardine appears to show a wide range of temperature tolerance for both habitat and spawning distribution (Bernal, 1998). Even more, the presence of sardine larvae has been recorded by a recent study (Morais et al., 2009) inside the Guadiana estuary. The authors suggest that this is not an accidental occurrence but that in order to migrate to that location and remain in the estuary, counteracting river inflow, these late larvae must have employed active migration and retention strategies.
55 ICES WGHANSA REPORT Upwelling intensity was shown to affect both positively and negatively sardine recruitment (Dickson et al., 1988; Roy et al., 1995) but the main direct effect was due to the transport of eggs and larvae offshore by northern winds (Guisande et al., 2001). In this way, strong upwelling during the recruitment season would decrease the probability of survival of sardine larvae as they are dispersed to outer shelf and oceanic zones. In contrast, southerly winds favour the progress of the poleward current, and tend to accumulate fish larvae near the coast where plankton biomass and production are high. At high population sizes, sardine spawning and distribution areas extend over the whole continental shelf and the adults display feeding migrations to the upwelling area off Galicia, while at low population sizes a reduction in the mobility of adult sardines between the Cantabrian Sea and Galicia is expected (Carrera and Porteiro, 2003). Santos et al. (2011a) analysed previous studies, on relationships between recruitment and environmental variables for the sardine around the Iberian Peninsula and carried out a new analysis of empirical relationships with environmental series, using dynamic factor analysis, generalized additive models, and mixed models. Relationships were identified between recruitment and global (number of sunspots), regional (NAOAutumn), and local winter wind strength, sea surface temperature (SST), and upwelling environmental variables. Separating these series into trend and noise components permitted further investigation of the nature of the relationships. Whereas the other three environmental variables were related to the trend in recruitment, SST was related to residual variation around the trend, providing stronger evidence for a causal link. After removal of trend and cyclic components, residual variation in recruitment was also weakly related to the previous year s spawning stock biomass. B. Data B.1. Commercial catch Commercial catch data are obtained from the national laboratories of both Spain and Portugal. Annual landings are available since 1940 (see Figure B.1). Landings are not considered to be significantly underreported.
56 588 ICES WGHANSA REPORT Portugal Spain Total Landings (t) Year VIIIc IXa North Landings (t) Cadiz Spain Year Landings (t) IXa-CN IXa-CS IXa-S Portugal Year Figure B.1. Annual landings of sardine, by country and area. Discards data on the fishery are not available and it is very difficult to measure. As with other pelagic fisheries that exploit schooling fish discarding occurs in a sporadic way and with often extreme fluctuation in discard rates (100% or null discards). Extreme discards occur especially when the entire catch is released ( slippage ) which tend to be related to quota limitations, illegal size and mixture with unmarketable bycatch. Quantifying such discards at a population level is extremely difficult because they vary considerably between years, seasons, species targeted and geographical region. A discard programme, sampling purse-seine vessels, has started in Portugal. Nevertheless, discard estimates are still not available. There is some slipping in northern
57 ICES WGHANSA REPORT Portugal (Division IXa) but mostly in years with high recruitment. During a twelve week lasting study, the sampled fleet (nine vessels) landed 2196 t and released an estimated 4979 t (CV 33.6%) (Stratoudakis and Marcalo, 2002). More than 95% of the total catch was sardine. Sardine constituted 97% of the landings in the trips observed and >99% of the total for the whole fleet, and some of the bycatch species caught in small quantities during the trips observed never reached the market. Since 1999 (catch data 1998), both Spanish and Portuguese laboratories have used a common spreadsheet to provide all necessary landing and sampling data developed originally for the Mackerel Working Group (WGMHSA). The stock co-ordinators collates data using the latest version of SALLOCL (Patterson, 1998) which produces a standard output file (Sam.out). However it should be noted that only sampled, official, WG catch and discards are available in this file. In addition, commercial catch and sampling data were stored and processed using the InterCatch software for the first time during the WGHMHSA in Comparisons were made between the SALLOCL and the InterCatch routines and a very good agreement was found (<0.3% discrepancies). These discrepancies are likely the results of the fact that for stocks where no allocations are required (as is the case of sardine), the SALLOCL application requires a dummy allocation to be made in order for the program to run successfully. While a very small value is used for the allocation, it is likely to have some impact on the results and so will have added to the discrepancy when compared with the InterCatch output. B.2. Biological Catch-at-age data (catch numbers-at-age, mean weights-at-age in the catch, mean length-at-age) are derived from the raised national figures routinely provided by both Spain and Portugal. These data are obtained either by market sampling or by onboard observers. In Spain, samples for age length keys are pooled on a half year basis for each subdivision while length weight relationships are calculated quarterly. In Portugal, both age length keys and length weight relationships are compiled on a quarterly and subdivision basis. Mean weights-at-age in the stock are derived from March/April acoustic surveys and maturity ogive comes from DEPM surveys, whilst for the years without DEPM surveys, a constant value of 80% full maturity-at-age 1 and a 100% for ages 2 and older is adopted. The 80% maturity-at-age 1 is about a median of former DEPM estimates.
58 590 ICES WGHANSA REPORT 2013 Table B.2.1. Summary of the overall sampling intensity over recent years on the catches of the sardine stock in VIIIc and IXa. Year Total catch Nº samples Nº fish measured Nº fish aged B.3. Surveys At present, the surveys used in the sardine assessment are the Spanish and Portuguese DEPM surveys and the spring acoustic surveys which jointly provide a full coverage of the stock area (ICES Areas VIIIc and IXa). Surveys not used in the assessment, which cover parts of the stock area or Areas VIIIa,b (considered to be a different stock unit) are also described below for completeness. B.3.1. DEPM surveys The Daily Egg Production Method started being applied to sardine in the Iberian Peninsula during the 1980s but surveys were interrupted for almost ten years. Current DEPM surveys started in 1997 for both Spain and Portugal and have been carried out triennially since Sampling design and methodology have been further standardized in 2002 in order to guarantee good coordination of the surveys and analyses of the data collected Since 2011 the coordinated surveys between Spain (IEO and AZTI) and Portugal (IPIMAR) do also cover the Bay of Biscay (Divisions VIIIa, b). The extension of the surveyed area almost up to Southern Brittany results in a complete coverage of the species over most of its European Atlantic distribution (Subareas IX and VIII), except for the top Northwestern limits. The methodology adopted for the processing of sardine adults data followed the general plan agreed for previous surveys (cf. ICES, 2005, 2006 and 2007) and a summary is presented in Table B.3.1.
59 ICES WGHANSA REPORT Table B.3.1. Processing and analysis for eggs and adults (The surveys carried out by IEO and AZ- TI cover Areas VIIIb and VIIIa,b, respectively). DEPM Portugal (IPIMAR) Spain (IEO) Spain (AZTI) EGGS PairoVET eggs staged sardine (Gamulin & Hure, 1955) CUFES egg staged sardine (Gamulin & Hure, 1955) Temperature for egg ageing All All Sample size 50/75 or all eggs In the lab, all or subsample if more than 100 per sample Surface (continuous underway CTF at 3 m) No No 10 m 10 m Peak spawning hour 21:00 (Sd=3 hh) 21:00 (Sd=3 hh) 21:00 (Sd=3 hh) Egg ageing Egg production Bayesian (Bernal et al., 2008) GLM (and GAMs available) Bayesian (Bernal et al., 2008) GLM (and GAMs available) Bayesian (Bernal et al., 2008) GLM (and GAMs available) ADULTS Histology Paraffin Resin Resin -Embedding material -Stain Haematoxilin-Eosin Haematoxilin-Eosin Haematoxilin-Eosin S estimation Day 1 and Day 2 POFs (according to Pérez et al., 1992a and Ganias et al., 2007) R estimation The observed weight fraction of the females F estimation On hydrated females (without POFs), according to Pérez et al., 1992b Day 1 and Day 2 POFs (according to Pérez et al., 1992a and Ganias et al., 2007) The observed weight fraction of the females On hydrated females (without POFs), according to Pérez et al., 1992b Day 1 and Day 2 POFs (according to Pérez et al., 1992a and Ganias et al., 2007) The observed weight fraction of the females On hydrated females (without POFs), according to Pérez et al., 1992b B.3.2. Acoustic surveys B Spring acoustic Surveys Portuguese and Spanish acoustic surveys are coordinated within WGACEGG (ICES, 2011). Surveys are undertaken within the framework of the EU DG XIV project Data Directive. There are two spring annual surveys (one Portuguese and one Spanish) used in the assessment as a single index of abundance of the stock. During the benchmark assessment carried out in 2006, a joint survey dataseries was made as a weighted sum of the two spring surveys and results from the exploration of survey data provided some indication of similar catchabilities. In addition, preliminary runs with a range of weighting factors the Spanish surveys indicated that the actual catchability ratio made little difference to the final outcome of the assessment. Therefore, the stock was assessed with a joint spring survey derived by just adding the Spanish and the Portuguese results. In spite of this, the merging of data from these surveys remains an outstanding issue in the current assessment and in order to address this, two calibration exercises between the Spanish and Portuguese acoustic surveys have
60 592 ICES WGHANSA REPORT 2013 taken place in spring 2008 and again in 2009 with the simultaneous coverage of several transects by the RVs Thalassa (Spanish survey) and Noruega (Portuguese survey) off northern Portugal. Results from these exercises were inconclusive and therefore a new intercalibration is planned in Conclusions will be analysed within WGACEGG. In addition to the spring surveys, between 1984 and 2008 (gaps in and ) there was a Portuguese acoustic survey carried out in November and covering the Portuguese waters and, since 1997, the Gulf of Cádiz. This survey follows the same methodology as the spring surveys and is also coordinated by WGACEGG. Since it covers only part of the stock area and may not take into account changes in distribution between years, it is currently not used in the assessment model. However, it covers the main recruitment areas of the stock and is therefore used as additional information on recruitment strength. This survey-series could be potentially useful in the context of a future area-based assessment. Outside the assessed stock area, the spring acoustic survey PELGAS (run by Ifremer) covers the area from the south of the Bay of Biscay to south of Brittany (Figure B ). B Portuguese spring acoustic survey: PELAGOS The Portuguese acoustic surveys (on board the RV Noruega ) are mainly directed to sardine and anchovy. The survey track follow a parallel grid, with transects perpendicular to the coastline. The acoustic energy in the inter-transect track is not taken into account. The transects are spaced by 8 nautical miles in the West Coast, 6 nautical miles in Algarve and around 10 nautical miles in the Cádiz area. Acoustic data from 38 khz is stored with MOVIES+ software as standard HAC files along the transects. Trawl hauls are performed whenever significant amounts of fish are found but mainly targeting sardine and anchovy. Trawl data are used to: Identify the echotraces Obtain the length structure of the population Obtain the species proportion Get biologic samples The identification of the echotraces is made by eye, with the aid of the trawl hauls. If it is not possible to separate the species schools by eye, the energy of the ESDUs (Elementary Sampling Distance Unit) is split using the haul species proportion, in number, and taking into account the target strength and the species length compositions. The weight of the hauls is always the same, since a post stratification is made and the overall area is divided into small homogeneous areas, with similar length composition. To partition the acoustic energy by species, using the trawl species proportion, the hauls are not weighted by the energy around the haul, assuming that the species mixture is independent of the acoustic energy density. The acoustic energy is extracted from the EK500 echograms, school by school, using MOVIES+ software. Plankton and very small schools are rejected.
61 ICES WGHANSA REPORT Figure B Acoustic transects sampled during the PELAGOS acoustic survey in For each species, the acoustic energy is also partitioned by length classes according to the length structure found in the trawl hauls. The biomass is derived from the number of individuals, applying the weight length relationship obtained from the haul samples. B Spanish spring acoustic survey: PELACUS The spring acoustic survey PELACUS (on board the RV Thalassa ) covers the area between northern Portuguese waters and southern French waters. Acoustic sampling takes place during the day, over a grid of parallel transects separated by 8 nm and perpendicular to the coastline. The area covered by the survey extends from 30 to 200 m depth. The EDSU is fixed at 1 nm. Fish abundance estimation is only carried out with the 38 khz frequency of a Simrad EK60 scientific echosounder, although echograms from 120 khz are also used to help discrimination. No threshold is set for integration. Backscattering energy is allocated to fish species by visual scrutiny of the echograms and based on the information provided by the fishing trawls. Fishing stations are analysed and grouped according to depth and proximity criteria and their representativeness is assessed based on the continuity in the probability density function of the length distribution for all fish species in the haul. The main differences between surveys are related to the sampling strategy and the type of gear used. Noruega s main objective is estimating sardine and anchovy abundance while Thalassa samples all fish aggregations. Noruega s net is smaller than Thalassa s, which allows Noruega to carry out trawls closer to the shore while Thalassa can take advantage of a bigger pelagic trawl to sample schools in more offshore areas.
62 594 ICES WGHANSA REPORT 2013 Figure B Acoustic transects sampled during the PELACUS acoustic survey in B French spring acoustic survey: PELGAS The French acoustic survey (PELGAS) is routinely carried out each year in spring in the Bay of Biscay (on board the RV Thalassa) and information on pelagic fish species distribution and abundance is available since The main species targeted is anchovy but the survey is part of the Ifremer programmes on data collection for monitoring and management of fisheries with an ecosystemic approach for fisheries and information is therefore also collected on other pelagic species, on egg presence and abundance, on top predators abundance and distribution and on environmental variables such as temperature, salinity, plankton, etc. The survey is planned with Spain and Portugal in order to have most of the potential area to be covered from Gibraltar to Brest with the same protocol for sampling strategy. Data are made available to the ICES working groups WGHANSA, WGWIDE and WGACEGG. Acoustic data are collected along systematic parallel transects perpendicular to the French coast. The length of the ESDU (Elementary Sampling Distance Unit) was one mile and the transects were uniformly spaced by 12 nautical miles covering the continental shelf from 20 m depth to the shelf break. Acoustic data are collected only during the day because of pelagic fish behaviour in the area. These species are usually dispersed very close to the surface during the night and so "disappear" in the blind layer for the echosounder between the surface and 8 m depth. Since 2008, PELGAS survey has been accompanied by pelagic pairtrawlers that follow the RV Thalassa transects. Identification hauls were carried out both by the RV Thalassa and the commercial vessels being preferentially carried out by pairtrawlers which are more efficient (less avoidance to the vessels) and hauls close to the bottom being preferentially carried out by the RV Thalassa.
63 ICES WGHANSA REPORT Figure B Acoustic transects sampled during the PELGAS acoustic survey in B.4. Commercial cpue Cpue indices are not considered reliable indicators of abundance for small pelagic fish (Ulltang, 1982; Csirke, 1988; Mackinson et al., 1997) and are not used. B.5. Other relevant data C. Assessment: data and method Model used: Stock Synthesis (SS, Methot, 1990, 2005). SS is a generalized age- and length-based model that is very flexible with regard to the types of data that may be included, the functional forms that are used for various biological processes, the level of complexity and number of parameters that may be estimated. A description and discussion of the model can be found in ICES (2010). The sardine assessment is an age-based assessment assuming a single area, a single fishery, a yearly season and genders combined. Input data include catch (in biomass), age composition of the catch, total abundance (in numbers) and age composition from an annual acoustic survey and spawning stock biomass (SSB) from a triennial DEPM survey. Considering the current assessment calendar (annual assessment WG in June in year y+1), the assessment includes fishery data up to year y and acoustic data up to year y+1. According to the ICES terminology, year y is the final year of the assessment and year y+1 is termed the interim year. Software used: Stock Synthesis (SS) version 3.21d (Methot, 2011) Model Options chosen: The main model options are described below. A copy of the control file (sardine.ctl) including all model options is appended to the bottom of this section. Natural mortality are age specific input values as listed in the table below.
64 596 ICES WGHANSA REPORT 2013 Age Age Age Age Age Age Age Growth is not modelled explicitly. Weights-at-age in the beginning and mid of the year are input values and fecundity-at-age are input values, corresponding to the proportion mature-at-age * weight-at-age at the beginning of the year. Annual recruitments are parameters, defined as lognormal deviations from a constant mean value penalized by a sigma of 0.55 (the standard deviation of log(recruits) estimated in the 2011 assessment, ICES, 2011a). Recruitment for the interim year of the assessment is assumed to be the historic geometric mean. Fishing mortality is applied as the hybrid method. This method does a Pope s approximation to provide initial values for iterative adjustment of the continuous F values to closely approximate the observed catch. Total catch biomass by year is assumed to be accurate and precise. The F values are tuned to match this catch. Total catch biomass by year is assumed to be a median unbiased index of abundance. Both the acoustic survey and the DEPM survey are assumed to be relative indices of abundance. The corresponding catchability coefficients are considered to be mean unbiased. Age selectivity in the fishery and in the acoustic survey is such that the parameter for each age is estimated as a random walk from the previous age (however, this applies only to ages 1, 2, 3 and 6+ in the fishery and 2 and 6+ in the survey). In the fishery, selectivity-at-age 0 is not estimated and is used as the reference age against which subsequent changes occur. A similar assumption is considered for age 1 in the survey, the first observed age. Selectivities at ages 3 to 5 years in the fishery are bound, meaning that parameters for ages 4 and 5 are not estimated but assumed to be equal to the parameter estimated for age 3. A similar assumption is accepted for ages 2 to 5 years in the survey. The initial values for the fishery and survey selectivities mimic dome-shaped patterns with a decline at the 6+ group. However, the range of initial values is wide and almost any pattern can be estimated. The fishery selectivity is allowed to vary over time in part of the assessment period. Two periods are considered: with selectivity-at-age varying as a random walk and for which selectivity-at-age is fixed over time. In the random walk, log(sy) = log(sy-1 + delta(y)), with SD=0.1 as the penalty on the deltas, y being the year). The transition between periods is done as a random walk as well. In the interim year of the assessment, there is data from the acoustic survey but not from the fishery (catch and age composition). The model requires input fishery data for all assessment years. Catch biomass for the interim year is assumed to be equal to the ICES advised catch ( tons in 2011). Age composition data for the fishery in the interim year is included in the calculation of expected values but excluded from
65 ICES WGHANSA REPORT the objective function. Catch numbers-at-age in the interim year are derived from numbers-at-age in the previous year assuming the same fishing mortality, selectivity pattern and biological parameters. An arbitrary value of individuals was assumed as the interim recruitment. The objective function is a log likelihood combining components for: Catch biomass (lognormal); acoustic survey abundance index (lognormal); DEPM survey SSB (lognormal); fishery age composition (multinomial); survey age composition (multinomial); recruitment deviations (lognormal); random walk selectivity parameters (normal); initial equilibrium catch (normal). Estimates of data precision are included in the likelihood components for the abundance indices and age composition data as follows: a standard error of 0.25 is assumed for all years both for the acoustic index (total number of fish) and the DEPM index (SSB). In the likelihood components of each survey, annual log residuals are divided by the corresponding standard errors. Therefore, the two surveys and the years within each survey have equivalent weight in the objective function. The assumed standard error corresponds to a CV of 25% which is consistent with the average level of CVs estimated for the acoustic survey by geostatistics (range 12 43%, mean=23%) and GAM methods (Zwolinski et al., 2009) and with CVs estimated for the DEPM survey (range 14 32%, mean =22%). assumed sample sizes for annual age compositions in the fishery and acoustic survey are: Fishery Acoustic survey Sample size sets the precision of the age composition data. It should correspond to the actual number of fish in the age samples if the multinomial error model was strictly correct (i.e. the number of independent observations in a sample). In general, the levels of age sampling for the sardine stock are high in both the fishery and the acoustic survey (see Table B.1.2). Although input values for sample size can be calculated from the sampling data, it is difficult to obtain real values since there is often autocorrelation within age samples. Therefore, sample sizes were calculated approximately taking into account the harmonic mean of expected sample sizes provided by the model. The sample size for fishery age compositions was assumed to be lower in the period than afterwards to reflect the poorer regional coverage of stock landings (ICES, 2012; WKPELA Report); indices of ageing imprecision were obtained from the most recent age reading workshop (ICES, 2011b). Three sets of otoliths from different stock regions
66 598 ICES WGHANSA REPORT 2013 were aged by readers implicated in the preparation of ALKs. Standard deviations by age and reader were calculated relative to the modal age for each regional otolith set. These SDs were averaged over all readers and a weighted average for the three sets was calculated assuming the weights in the table below. Ageing imprecision was assumed to be constant over time and to be the same in the fishery and in the survey. Within the model, a transition matrix defines the expected distribution of observed ages for each true age assuming a normal distribution with mean equal to the true age and standard deviations as given in the table below. Age Portuguese coast Cantabrian Sea Gulf of Cadiz Weighted Average Weights The initial equilibrium catch was set at tons, the recent level of catches. The model uses the initial equilibrium catch to derive an initial fishing mortality. The population numbers-at-age in the initial year (the year before the first year of the assessment period) are calculated from the mean recruitment, the initial equilibrium catch and the selectivity in the first year. Numbers-at-age in the first year of the assessment are derived from those in the initial year assuming the mean recruitment. Minimization of the likelihood is implemented in phases using standard ADMB process. The phases in which estimation will begin for each parameter is shown in the control file appended to this section. Variance estimates for all estimated parameters are calculated from the Hessian matrix.
67 ICES WGHANSA REPORT Input data types and characteristics: Type Name Year range Age range Caton Catch in tonnes 1978 forward Ages 0 6+ Canum Weca West Matprop Catch-at-age in numbers Weight-at-age in the commercial catch Weight-at-age of the spawning stock at spawning time. Proportion matureat-age 1978 forward Ages 0 6+ Variable from year to year Yes/No 1978 forward Ages No 1992 forward Yes 1978 forward Ages No 1991 forward Yes 1978 forward Ages 0 6+ Estimated in DEPM years, else assumed constant Natmor Natural mortality 1978 forward Ages 0 6+ No Tuning data: Type Name Year range Age range Tuning fleet 1 Joint SP+PT Acoustics 1996 onwards Ages 1 6+ Tuning fleet 2 Joint SP+PT DEPM 1997, 1999, 2002, 2005, triennal Not age structured The model estimates spawning stock biomass (SSB) and summary biomass (B1+, biomass of age 1 and older) at the beginning of the year. The reference age range for output fishing mortality is 2 5 years. #C Sardine in VIIIc and IXa : Benchmark assessment #C growth parameters are estimated spawner-recruitment bias adjustment Not tuned For optimality #_data_and_control_files: sardine.dat // sardine.ctl 1 #_N_Growth_Patterns 1 #_N_Morphs_Within_GrowthPattern 1 #_Nblock_Patterns 1 #_blocks_per_pattern # begin and end years of blocks # 0.5 #_fracfemale 3 #_natm_type:_0=1parm; 1=N_breakpoints;_2=Lorenzen;_3=agespecific;_4=agespec_withseasinterpolate #_no additional input for selected M option; read 1P per morph 1 # GrowthModel: 1=vonBert with L1&L2; 2=Richards with L1&L2; 3=age_speciific_K; 4=not implemented 0 #_Growth_Age_for_L1
68 600 ICES WGHANSA REPORT #_Growth_Age_for_L2 (999 to use as Linf) 0 #_SD_add_to_LAA (set to 0.1 for SS2 V1.x compatibility) 0 #_CV_Growth_Pattern: 0 CV=f(LAA); 1 CV=F(A); 2 SD=F(LAA); 3 SD=F(A); 4 logsd=f(a) 5 #_maturity_option: 1=length logistic; 2=age logistic; 3=read age-maturity matrix by growth_pattern; 4=read age-fecundity; 5=read fec and wt from wtatage.ss #_placeholder for empirical age-maturity by growth pattern 1 #_First_Mature_Age 1 #_fecundity option:(1)eggs=wt*(a+b*wt);(2)eggs=a*l^b;(3)eggs=a*wt^b; (4)eggs=a+b*L; (5)eggs=a+b*W 0 #_hermaphroditism option: 0=none; 1=age-specific fxn 1 #_parameter_offset_approach (1=none, 2= M, G, CV_G as offset from female-gp1, 3=like SS2 V1.x) 2 #_env/block/dev_adjust_method (1=standard; 2=logistic transform keeps in base parm bounds; 3=standard w/ no bound check) # #_growth_parms #_LO HI INIT PRIOR PR_type SD PHASE env-var use_dev dev_minyr dev_maxyr dev_stddev Block Block_Fxn # L_at_Amin_Fem_GP_ # L_at_Amax_Fem_GP_ # VonBert_K_Fem_GP_ # CV_young_Fem_GP_ # CV_old_Fem_GP_ # Wtlen_1_Fem # Wtlen_2_Fem # Mat50%_Fem # Mat_slope_Fem # Eggs/kg_inter_Fem # Eggs/kg_slope_wt_Fem
69 ICES WGHANSA REPORT # RecrDist_GP_ # RecrDist_Area_ # RecrDist_Seas_ # CohortGrowDev #_Spawner-Recruitment 4 #_SR_function: 2=Ricker; 3=std_B-H; 4=SCAA; 5=Hockey; 6=B-H_flattop; 7=survival_3Parm #_LO HI INIT PRIOR PR_type SD PHASE # SR_LN(R0) # SR_SCAA_null # SR_sigmaR # SR_envlink # SR_R1_offset # SR_autocorr 0 #_SR_env_link 0 #_SR_env_target_0=none;1=devs;_2=R0;_3=steepness 1 #do_recdev: 0=none; 1=devvector; 2=simple deviations 1978 # first year of main recr_devs; early devs can preceed this era 2010 # last year of main recr_devs; forecast devs start in following year 2 #_recdev phase 1 # (0/1) to read 13 advanced options 0 #_recdev_early_start (0=none; neg value makes relative to recdev_start) -4 #_recdev_early_phase -1 #_forecast_recruitment phase (incl. late recr) (0 value resets to maxphase+1) 1 #_lambda for Fcast_recr_like occurring before endyr #_last_early_yr_nobias_adj_in_mpd 1900 #_first_yr_fullbias_adj_in_mpd 1900 #_last_yr_fullbias_adj_in_mpd
70 602 ICES WGHANSA REPORT #_first_recent_yr_nobias_adj_in_mpd 1 #_max_bias_adj_in_mpd (-1 to override ramp and set biasadj=1.0 for all estimated recdevs) 0 #_period of cycles in recruitment (N parms read below) -5 #min rec_dev 5 #max rec_dev 0 #_read_recdevs #_end of advanced SR options #Fishing Mortality info 0.3 # F ballpark for tuning early phases # F ballpark year (neg value to disable) 3 # F_Method: 1=Pope; 2=instan. F; 3=hybrid (hybrid is recommended) 2 # max F or harvest rate, depends on F_Method 4 # N iterations for tuning F in hybrid method (recommend 3 to 7) # #_initial_f_parms #_LO HI INIT PRIOR PR_type SD PHASE # InitF_1purse_seine # #_Q_setup # Q_type options: <0=mirror, 0=median_float, 1=mean_float, 2=parameter, 3=parm_w_random_dev, 4=parm_w_randwalk, 5=mean_unbiased_float_assign_to_parm #_for_env-var:_enter_index_of_the_env-var_to_be_linked #_Den-dep env-var extra_se Q_type # 1 purse_seine # 2 Acoustic_survey # 3 DEPM_survey # #_Cond 0 #_If q has random component, then 0=read one parm for each fleet with random q; 1=read a parm for each year of index #_Q_parms(if_any)
71 ICES WGHANSA REPORT # LO HI INIT PRIOR PR_type SD PHASE # Q_base_3_DEPM_survey #_age_selex_types #_Pattern Male Special # 1 purse_seine # 2 Acoustic_survey # 3 DEPM_survey #_LO HI INIT PRIOR PR_type SD PHASE env-var use_dev dev_minyr dev_maxyr dev_stddev Block Block_Fxn # AgeSel_1P_1_purse_seine # AgeSel_1P_2_purse_seine # AgeSel_1P_3_purse_seine # AgeSel_1P_4_purse_seine # AgeSel_1P_5_purse_seine # AgeSel_1P_6_purse_seine # AgeSel_1P_7_purse_seine # AgeSel_2P_1_Acoustic_survey # AgeSel_2P_2_Acoustic_survey # AgeSel_2P_3_Acoustic_survey # AgeSel_2P_4_Acoustic_survey # AgeSel_2P_5_Acoustic_survey # AgeSel_2P_6_Acoustic_survey # AgeSel_2P_7_Acoustic_survey
72 604 ICES WGHANSA REPORT #_custom_sel-blk_setup (0/1) # AgeSel_1P_2_purse_seine_BLK1delta_ # AgeSel_1P_3_purse_seine_BLK1delta_ # AgeSel_1P_4_purse_seine_BLK1delta_ # AgeSel_1P_7_purse_seine_BLK1delta_ #_selparmdev-phase 1 #_env/block/dev_adjust_method (1=standard; 2=logistic trans to keep in base parm bounds; 3=standard w/ no bound check) 1 #_Variance_adjustments_to_input_values #_fleet: #_add_to_survey_cv #_add_to_discard_stddev #_add_to_bodywt_cv #_mult_by_lencomp_n #_mult_by_agecomp_n #_mult_by_size-at-age_n 4 #_maxlambdaphase 1 #_sd_offset 3 # number of changes to make to default Lambdas (default value is 1.0) # Like_comp codes: 1=surv; 2=disc; 3=mnwt; 4=length; 5=age; 6=SizeFreq; 7=sizeage; 8=catch; # 9=init_equ_catch; 10=recrdev; 11=parm_prior; 12=parm_dev; 13=CrashPen; 14=Morphcomp; 15=Tag-comp; 16=Tagnegbin # like_comp fleet/survey phase value sizefreq_method
73 ICES WGHANSA REPORT D. Short-term projection Model and software used: Multi Fleet Deterministic Projection (MFDP) The initial stock size corresponds to the assessment estimates for ages 1 6+ at the final year. Recruitment (Age 0) estimated in the final year of the assessment is accepted for the projection since it is supported by data from the acoustic survey in the interim year. Recruitment in the interim year and forecast year will be set equal to a preagreed level of recruitment according to the update assessment. This level corresponds to the geometric mean recruitment of the last 15 years. The period selected does not cover the entire assessment period because there is a decreasing trend in recruitment throughout the historical period. A 15 year period will integrate some bad and good recruitments without being too much dependent to the most recent recruits estimated by the model. The maturity ogive corresponds to the ogive used in the assessment (in years with no DEPM survey), i.e. 0% mature at age 0, 80% mature at age 1 and 100% mature at age 2+. Input values for the proportion of F and M before spawning are zero, which correspond to the beginning of the year when the SSB is estimated by the model. Weights-at-age in the stock and in the catch are calculated as the arithmetic mean value of the last three years of the assessment. Natural mortality-at-age is equal to that used in the assessment. The exploitation pattern is the average of the last three years of the assessment. Predictions are carried out with an Fmultiplier (usually ranging from 0 to 2) assuming an Fsq equal to the average estimates of the last three years in the assessment. In the interim year, catches are constrained to be an agreed expected level (since data in not yet available), usually those corresponding to Fsq (0.36) or alternatively as duly justified by stock assessment scientists. Predicted population at the beginning and end of the forecast year will be shown according to preselected levels of fishing mortality in consonance with defined precautionary and target reference points. E. Medium-term projections Not carried out. F. Long-term projections Not carried out. G. Biological reference points Type Value Technical basis MSY MSY Btrigger xxx t Undefined Approach FMSY 0.35 FBPR50%, F at which the B1+/R is half of what it would have been in the absence of fishing Blim t Blim=Bloss (2000 B1+), Bloss being the lowest historical biomass which produced good recruitments Precautionary Bpa xxx t Undefined Approach Flim Xxx Undefined Fpa Xxx Undefined
74 606 ICES WGHANSA REPORT 2013 Reference points are expressed in terms of B1+, the biomass of age 1 and older individuals. B1+ corresponds to total-stock biomass at the beginning of the year. H. Other issues H.1. Historical overview of previous assessment methods From 2003 to the current benchmark, the sardine stock was assessed using the age structured model AMCI (Assessment Model Combining Information from various sources, Skagen, 2005). Because the program is not going to be maintained in the future, alternative programs have been explored. Stock Synthesis (SS3) has been chosen as the final assessment model in the 2012 benchmark since it offers the same level of flexibility of AMCI and additional features, such as the possibility to incorporate uncertainty of input data in the variance of final estimates. Other SS3 abilities which were not explored due to time limitation but might be useful in the future are: link to environmental data (e.g. to recruitment), include several fleets and areas (explain spatial differences in sardine demography) and use of the forecast module. Summary of data ranges used in recent assessments: Data 2006 assessment 2007 assessment 2008 assessment 2009 assessment Catch data Years: 1978 (AY- 1) Years: 1978 (AY- 1) Years: 1978 (AY- 1) Years: 1978 (AY-1) Ages: 1 8+ Ages: 1 8+ Ages: 1 8+ Ages: 1 8+ Survey: A_Q1 Years: 1985 AY Ages: 1 7 Years: 1985 AY Ages 1 7 Years: 1985 AY Ages 1 7 Years: 1985 AY Ages 1 7 Survey: B_Q4 Years: 1996 (AY- 1) Years: 1996 AY-1) Ages 1 7 Years: 1996 AY- 1) Years: 1996 AY-1) Ages 1 7 Ages: 1 5 Ages 1 7 Survey: C Not used Not used Not used Not used AY Assessment year I. References Abad, E., Castro, J., Punzón, A. and Abaunza, P Métiers of the Northern Spanish coastal fleet using purse-seine gears. WD presented to the ICES WGWIDE 2008 meeting. Abaunza et al Stock identity of horse mackerel (Trachurus trachurus) in the Northeast Atlantic and Mediterranean Sea: Integrating the results from different stock identification approaches. Fisheries Research 89, Beare DJ, Burns F, Greig A, Jones EG, Peach K, Kienzle M, McKenzie E, Reid DG Longterm increases in prevalence of North Sea fishes having southern biogeographic affinities. Mar Ecol Prog Ser 284: Bernal M, Stratoudakis Y, Coombs S, Angelico M, de Lanzos A, Porteiro C, Sagarminaga Y, Santos M, Uriarte A, Cunha E, Valdes L, Borchers D Sardine spawning off the European Atlantic coast: Characterization of and spatio-temporal variability in spawning habitat. Progress In Oceanography 74: Bernal, M Modelling the abundance, distribution and production of sardine (Sardina pilchardus, Walb.) eggs in the Iberian Peninsula. PhD Thesis, Universidad de Cádiz, Cádiz, Spain, 262pp. Binet D, Samb B, Sidi MT, Levenez JJ, Servain J Sardine and other pelagic fisheries associated with multi-year trade wind increases, pp Paris: ORSTOM.
75 ICES WGHANSA REPORT Bode, A., Alvarez-Ossorio, M.Y., Carreara, P. and Lorenzo, J Reconstruction of trophic pathways between plankton and the North Iberian sardine (Sardina pilchardus) using stable isotopes. Scientia Marina 68: Bode, A., Carrera, P. and Lens, S The pelagic foodweb in the upwelling ecosystem of Galicia (NW Spain) during spring: natural abundance of stable carbon and nitrogen isotopes. ICES Journal of Marine Science 60: Bode, A., Alvarez-Ossorio M.T., Cunha, M.E., Garrido, S., Peleteiro, J.B., Porteiro, C., Valdés, L. and Varela, M Stable nitrogen isotope studies of the pelagic food web on the Atlantic shelf of the Iberian Peninsula. Progress in Oceanography 74: Carrera and Porteiro, Corten A, van de Kamp G Variation in the abundance of southern fish species in the southern North Sea in relation to hydrography and wind. ICES J Mar Sci 53: Csirke, J Small shoaling pelagic fish stocks. In: Fish population dynamics, J.A. Gulland (Ed.), John Wiley y Sons., New York, Dickson, R.R., Kelly, P.M., Colebrook, J.M., Wooster, W.S. and Cushing, D.H North winds and production in the eastern North Atlantic. J. Plankton Res. 10: Gamulin and Hure, Ganias K., Nunes C., Stratoudakis Y Degeneration of sardine (Sardina pilchardus) postovulatory follicles: structural changes and factors affecting resorption. Fishery Bulletin, 105: Garrido S., Marçalo A., Zwolinski J. and van der Lingen C.D Laboratory investigations on the effect of prey size and concentration on the feeding behaviour of Sardina pilchardus. Marine Ecology Progress Series. 330: Guisande, C., Cabanas, J.M., Vergara, A.R., Riveiro, I Effect of climate on recruitment success of Atlantic Iberian sardine Sardina pilchardus. Marine Ecology Progress Series. 223: ICES Report of the Working Group on the Assessment of Mackerel, Horse Mackerel, Sardine and Anchovy. ICES CM 2007/ACFM: 31. ICES Report of the Workshop on Reviews of Recent Advances in Stock Assessment Models World-wide: "Around the World in AD Models" (WKADSAM). ICES CM 2010/SSGSUE:10. ICES. 2011a. Report of the Working Group on Anchovy and Sardine (WGANSA). ICES CM 2011/ACOM:16. ICES. 2011b. Report of the Workshop on Age Reading of European Atlantic Sardine (WKARAS). ICES CM 2011/ACOM:42. ICES WKPELA Report. Kasapidis P, Magoulas A, Silva A, Zampicinini G Evidence for microsatellite hitchhiking selection in European sardine (Sardina pilchardus) and implications in inferring stock structure. Scientia Marina, 76. Laurent V, Magoulas A, Caneco B, Planes S Isolation by distance and selection effects on genetic structure of sardines Sardina pilchardus Walbaum. Journal of Fish Biology 2007; 71:1 17. Mackinson, S., Vasconcellos, M. C., Pitcher, T. and Walters, C. J Ecosystem impacts of harvesting small pelagic fish in upwelling systems using a dynamic mass-balance model. Proceedings Forage Fishes in Marine Ecosystems. Fairbanks: Anchorage, Alaska. Alaska Sea Grant College Program. AK9701: Mesquita, C Application of Linear Mixed Models in the study of LPUE patterns in the Portuguese purse-seine fishery for sardine (Sardina pilchardus Walbaum, 1792). PhD Thesis. School of Biological Sciences, University of Aberdeen.
76 608 ICES WGHANSA REPORT 2013 Methot, R.D Synthesis model: an adaptable framework for the analysis of diverse stock assessment data. International North Pacific Fisheries Commission, Bulletin Number 50. Methot, R.D Technical description of the Stock Synthesis II Assessment program. Available with SS3 download at Methot, R.D User Manual for Stock Synthesis. Available with SS3 download at Meynier, L Food and feeding ecology of the common dolphin, Delphinus delphis, in the Bay of Biscay: intraspecific dietary variation and food transfer modelling. MSc report, University of Aberdeen, Aberdeen, 84 pp. Morais, P., Faria, A., Chícharo, M.A., Chícharo, L The unexpected occurrence of late Sardina pilchardus (Walbaum, 1792) (Osteichthyes: Clupeidae) larvae in a temperate estuary. Cahiers de Biologie Marine 50 (1), pp Parrish RH, Serra R, Grant WS The monotypic sardines, Sardina and Sardinops: their taxonomy, stock structure, and zoogeography. Can. J. Fish. Aquat. Sci. 46: Patterson, K.R A programme for calculating total international catch-at-age and weightat-age. WD to HAWG Pérez, N., I. Figueiredo, and B. J. Macewicz The spawning frequency of sardine, Sardina pilchardus (Walb.), off the Atlantic Iberian coast. Bol. Inst. Esp. Oceanogr. 8: Perez N Figueredo, I Lon C H Batch fecundity of Sardina pilchardus Walb., of the Atlantic Iberian Coast. Bol Inst Esp Oceanogr 8(1): Porteiro C., Carrera P., Miquel J Analysis of Spanish acoustic surveys for sardine, : abundance estimates and interannual variability. ICES Journal of Marine Science 53: Riveiro, I., Santos MB., Silva A Current knowledge on Iberian sardine (Sardine pilchardus) stock identity. Working Document to WKPELA (ICES Benchmark Workshop on Pelagic Stocks. February 2012). Roy C, Porteiro C, Cabanas J The optimal environmental window hypothesis in the ICES Area: the example of the Iberian sardine. ICES Cooperative Research Report, 206: Santos, M.B, Pierce, G.J., López, A., Martínez, J.A., Fernández, M.T., Ieno, E., Mente, E., Porteiro, C., Carrera, P. and Meixide M Variability in the diet of common dolphins (Delphinus delphis) in Galician waters and relationship with prey abundance. ICES CM 2004/Q:09. Santos, A.M.P., Chícharo, A., Dos Santos, A., Miota, T., Oliveira, P.B., Peliz, A., and Ré, P Physical-biological interactions in the life history of small pelagic fish in the Western Iberia Upwelling Ecosystem. Progress in Oceanography, 74: Santos MB, German I, Correia D, Martinez J, Caldas M, López A, Pierce GJ. 2011a. Predation on sardine by common dolphins (Delphinus delphis) in Galician waters (NW Spain) dolphins. Working Document for WKPELA, 25 26/10/2011 Copenhagen. Santos M B, González-Quirós R, Riveiro I, Cabanas J M, Porteiro C, Pierce G J. 2011b. Cycles, trends, and residual variation in the Iberian sardine (Sardina pilchardus) recruitment series and their relationship with the environment. ICES Journal of Marine Science, doi: /icesjms/fsr186. Shaw P, McKeown N, Van der Kooij J Analysis of genetic population structuring of Sardine (Sardina pilchardus) in Eastern Atlantic waters using nuclear microsatellite DNA markers Working Document for WKPELA, 13 17/02/2012 Copenhagen. Silva A Morphometric variation among sardine (Sardina pilchardus) populations from the northeastern Atlantic and the western Mediterranean. ICES J. Mar. Sci. 60 (6):
77 ICES WGHANSA REPORT Silva, A., Carrera, P., Massé, J., Uriarte, A. D., Santos, M. B., Oliveira, P. B., Soares, E., et al Geographic variability of sardine growth across the northeastern Atlantic and the Mediterranean Sea. Fisheries Research, 90: Silva A. 2008a. Geographic variation in sardine population traits: implications for stock assessment. PhD Thesis. Faro, Portugal. 243 pp. Silva A, Kasapidis P, Laurent V, Caneco B, Planes S, Magoulas A. 2008b. Integrating genetic and morphometric variation in the sardine (Sardina pilchardus, walb.) from the northeastern Atlantic and the Mediterranean Sea. Symposium Science and the challenge of managing small pelagic fisheries on shared stocks in Northwest Africa, Casablanca, Morocco, March Available at Silva, A., Skagen, D. W., Uriarte, A., Masse, J., Santos, M. B., Marques, V., Carrera, P., Beillois, P., Pestana, G., Porteiro, C., and Stratoudakis, Y Geographic variability of sardine dynamics in the Iberian Biscay region. ICES Journal of Marine Science, 66: Stratoudakis Y, Coombs S, Lanzós AL, Halliday N, Costas G, Caneco B, Franco C, Conway D, Santos MB, Silva A, Bernal M Sardine (Sardina pilchardus) spawning seasonality in European waters of the Northeast Atlantic. Marine Biology 152 (1): Stratoudakis Y, Marçalo A (2002) Sardine slipping during purse-seining off northern Portugal. ICES Journal of Marine Science 59: Uriarte, A., Prouzet, P. and Villamor, B Bay of Biscay and Ibero Atlantic anchovy populations and their fisheries. Scientia Marina, 60 (Suppl. 2): Uriarte A, Alvarez P, Iversen S, Molloy J, Villamor B, Martíns MM, Myklevoll S Spatial pattern of migration and recruitment of Northeast Atlantic mackerel. ICES CM 2001/O: 17. Villamor, B., Abaunza, P., Lucio, P. and Porteiro, C Distribution and age structure of mackerel (Scomber scombrus L.) and horse mackerel (Trachurus trachurus L.) in the north coast of Spain. Scientia Marina. 61: Zwolinski, J., Fernandes, P., Marques, V. And Stratoudakis, Y Estimating fish abundance from acoustic surveys: calculating variance due to acoustic backscatter and length distribution error. Can. J. Fish. Aquat. Sci, 66:
78 610 ICES WGHANSA REPORT 2013 A.5.4 Stock Annex: Stock Southern Horse Mackerel Horse Mackerel in Division IXa (Southern horse mackerel) Working Group: WGANSA Date: 30 January 2011 Revised by Alberto Murta, Pablo Abaunza, Jim Ianelli (WKBENCH, 2011) A. General A.1. Stock definition Stock units For many years the Working Group has considered the horse mackerel in the northeast Atlantic as separated into three stocks: the North Sea, the Southern and the Western stocks (ICES, 1990; ICES 1991). Until the results from the EU project (HOMSIR, QLK5-Ct ), were available, the separation into stocks was based on the observed egg distributions and the temporal and spatial distribution of the fishery. The extremely strong 1982 year class appeared for the first time in the eastern part of the North Sea in 1987, during the third and mainly the fourth quarter. This year class was the basis for the start of the Norwegian horse mackerel fishery in the eastern part of North Sea during the third and mainly the fourth quarter. Since Western horse mackerel are assumed to have broadly similar migration patterns as NEA mackerel the Norwegian catches have been considered to be fish of western origin migrating to this area to feed. In addition, there is a fishery further south in the North Sea which is considered to be fish of North Sea origin. These views were supported by results from the mentioned EU project which was reviewed in ICES (2004) which also concluded to include Division VIIIc as part of the distribution area of the western horse mackerel stock (see also Abaunza et al., 2008 for a comprehensive discussion of the results from the HOMSIR project). Horse mackerel off the west coast of the Iberian Peninsula have characteristics (morphometry, parasites, distribution and migratory circuit) that distinguish them from the rest of the samples collected in the northeast Atlantic. The border between southern and western horse mackerel stocks may therefore lie at the level of Cape Finisterre on the coasts of Galicia at 43 N, which is also the limit between Division VIIIc and IXa. The southern limit of the southern horse mackerel stock is not as evident due to the lack of samples from the north of Africa. Based on morphometric studies, Murta (2000) showed that the horse mackerel of the Portuguese coast was closer to the northwest coast of Morocco than to the Gulf of Cadiz in the south of Spain. However, the respective parasite composition suggests that the populations off the north of Africa and the west of the Iberian Peninsula are not part of a continuous stock. Data from bottom-trawl surveys carried out throughout the Atlantic waters of the Iberian Peninsula during the autumn supported the existence of ontogenic migrations (Murta et al., 2008). Analysis of the proportion of each year class in each area off the Portuguese coast indicated that most year classes recruit to the northwest area (close
79 ICES WGHANSA REPORT to Area 8) and then move progressively southwards. After six years of age, they return to the north. Allocation of catches to stocks Based on spatial and temporal distribution of the horse mackerel fishery, the catches were allocated to the three stocks as follows: Western stock: Divisions IIa, IIIa (western part), Vb, IVa (third and fourth quarter), VIa, VIIa c,e k and VIIIa e. Although it seems strange that only catches from western part of Division IIIa are allocated to this stock, the catches in the western part of this Division taken in the fourth quarter often are taken in neighbouring area of catches of western fish in Division IVa. The Working Group is not sure if catches in Divisions IIIa and IVa during the first two quarters are of western or North Sea origin. Usually this is a minor problem because the catches here during this period are small. However, in 2006 relatively larger catches were taken in this area during the first half of the year (3600 tons) and these catches were allocated to the North Sea stock. In 2007, 2100 tons were caught during the two first quarters in Divisions IVa and IIIa and were allocated to the North Sea stock. North Sea stock: Divisions IIIa (eastern part), IVa (first and second quarter), IVb,c and VIId. The catches in 3 4 quarters of Divisions IVa and IIIa and 1 4 quarters from Divisions IVb,c and VIId were allocated to the North Sea stock. In 2007, some small catches were reported from Divisions IIIb (4 tons) and IIIc (21.5 tons) and were allocated to the North Sea stock. Southern stock: Division IXa. All catches from these areas are allocated to the southern stock. A.2. Fishery The catches of horse mackerel in Division IXa (Subdivision IXa North, Subdivision IXa Central-North, Subdivision IXa Central-South and Subdivision IXa South) are allocated to the Southern horse mackerel stock. In the years before 2004 the catches from Subdivisions VIIIc West and VIIIc East, were also considered to belong to the southern horse mackerel stock. The Spanish catches in Subdivision IXa South (Gulf of Cádiz) are available since They will not be included in the assessment data until they are available for all assessment years, to avoid a possible bias in the assessment results. On the other hand, the total catches from the Gulf of Cádiz are scarce and represent less than the 5% of the total catch. Therefore, their exclusion should not affect the reliability of the assessment. The Prestige oil spill had also an effect on the fishery activities in the Spanish area (Division IXa North) in The Spanish catches increased markedly from 1991 until 1998, whereas the Portuguese catches were more stable, showing a smooth decreasing trend since the peak observed in 1992 (with a secondary peak in 1998). Catches in Subdivisions IXa Central-North showed a decreasing trend whereas in Subdivision IXa North they increased markedly until 1998, and since then, the catches always have been higher than 7000 t. The catches from bottom trawlers are the majority in both countries. The rest of the catches are taken by purse seiners, especially in the Spanish area and by the artisanal fleet which is much more important in the Portuguese area.
80 612 ICES WGHANSA REPORT 2013 Description of the Portuguese fishing fleets operating in Division IXa (data provided by the Portuguese Fisheries Directorate) and catch horse mackerel (only trawlers and purse seiners): Gear Length Storage Number of boats Trawl Freezer 2 Trawl Freezer 7 Trawl Freezer 5 Trawl 0-10 Other 259 Trawl Other 68 Trawl Other 60 Trawl Other 29 Purse seine 0-10 Other 79 Purse seine Other 103 Purse seine Other 79 Note that horse mackerel is also caught in all polyvalent and most small scale fisheries. Description of the Spanish fishing fleets operating in Division IXa including the Gulf of Cádiz (Southern stock) and Division VIIIc (Western stock) (Hernández, 2008): Gear Bottom trawl Purse seine Lgline Bottom Lgline surface Gillnet (big mesh size) Gillnet Other artisanal Number Construction year (mean) Length 9 35 (22.9) 8 38 (21) 6 28 (15.1) (27.6) (14) (17.2) 3 27 (7) Power (322.3) (302.5) (150.3) (141.8) (164.9) (32.6) (418.9) Tonnage (81.2) (56.6) (26) (116) (23.7) (27.6) (3.5) It is indicated the range and the arithmetic mean (in parenthesis). Data from official census (Hernández, 2008). Note that horse mackerel in the Spanish area is mainly fished by bottom trawlers and purse seiners. The Spanish bottom-trawl fleet operating in ICES Divisions VIIIc (Western stock) and Subdivision IXa north (Southern stock), historically relatively homogeneous, has evolved in the last decade (approximately since 1995) to incorporate several new fishing strategies. A classification analysis for this fleet between the years 2002 and 2004 was made based on the species composition of the individual trips (Castro and Punzón, 2005). The analysis resulted in the identification of five catch profiles in the bottom otter trawl fleet: 1) targeting horse mackerel (>70% in landings), 2) targeting mackerel (>73% in landings); 3) targeting blue whiting (>40% in landings); 4) targeting demersal species; and 5) a mixed métier. In the bottom pair trawl fleet the classification analysis showed two métiers: 1) targeting blue whiting; and 2) targeting hake. These results should help in obtaining standardized and more coherent cpue series from fishing fleets. In the Portuguese area (Division IXa) Silva and Murta (2007) classified trawl fleet in two main types: those targeting fish and cephalopods species and those fishing crustaceans. Looking at the fishing trips of those that catch fish and cephalopods, they
81 ICES WGHANSA REPORT identified three main clusters: 1) targeting horse mackerel, 2) targeting cephalopods, and 3) a poorly defined mixed cluster. In 2005, the landings of blue whiting increased, probably due to increased market demand and consequent reduction of discards, resulting in a fourth specific cluster. The Crustacean trawl clusters do not follow the same pattern every year, depending on the abundance of the two main target crustacean species, which are Norway lobster and deep-water rose shrimp. There can be one target species by cluster or mixed clusters with different percentages of these two species. A.3. Ecosystem aspects Influence of environmental drivers on the stock dynamic The southern horse mackerel stock is distributed along the western and southern Atlantic coasts of the Iberian Peninsula, which is an area subject to upwelling events. There is already evidence in the literature that horse mackerel recruitment is influenced by environmental drivers. The analysis carried out under the IN EX Fish project (Frid et al., 2009) showed that non-linear combinations of NAO and upwelling indices were able to explain the strength of past recruitments. The rise and fall of this horse mackerel stock was probably caused by a complex interaction of different factors, both human and natural. However, it is very likely that changes in recruitment due to upwelling and NAO events may have played an important role. Role of multispecies interactions Horse mackerel is a schooling species and often close to the sea floor. Shelf attachment is a predominant distributional pattern for this stock. Therefore, horse mackerel is in relation with other fish and invertebrate species that are usually caught during the bottom-trawl surveys and share the same habitat. These species are mainly: snipefish, boarfish, blue whiting, European hake, sardine, blue jack mackerel, squid and pelagic crabs (Sousa et al., 2006). Trophic interactions Young horse mackerel is a feeding resource consumed by several demersal, benthic and pelagic predators present in the distribution area like: hake, monkfish, John Dory, bluefin tuna and dolphins. Horse mackerel is mainly a zooplanktivorous species. Diet variations with fish length and water depth are correlated: small fish are closely associated with coastal areas where they feed on copepods and decapod larvae (Cabral and Murta, 2002). However, they can prey on fish as they grow. They become Ichthyophagous when they reach large sizes. B. Data B.1. Commercial catch Mean length-at-age and mean weight-at-age Both mean length-at-age and mean weight-at-age values are calculated by applying the mean, weighted by the catch, over the mean weights or mean lengths-at-age obtained by Subdivision. Taking in consideration that the spawning season is very long, from September to June, and that the whole length range of the species has commercial interest in the
82 614 ICES WGHANSA REPORT 2013 Iberian Peninsula, with probably very scarce discards, there is no special reason to consider that the mean weight in the catch is significantly different from the mean weight in the stock. Catch in numbers-at-age The sampling scheme is believed to achieve a good coverage of the fishery (above 95% of the total catch). The number of fish aged seems also to be sufficient through the historical series. Catch in numbers-at-age have been obtained by applying a quarterly ALK to each of the catch length distribution estimated from the samples of each subdivision. In the case of Subdivision IXa north, the catch in number estimates before 2003 have changed. In previous years the age length key applied to the length distributions from Subdivision IXa north had included otoliths from Division VIIIc, which has been defined recently as part of the western stock. Since 2003, the catch in numbers-at-age from Subdivision IXa north were estimated using age length keys which included only otoliths from Division IXa. B.2. Biological Maturity-at-age For multiple spawners, such as horse mackerel, macroscopical analysis of the gonads cannot provide a correct and precise means to follow the development of both ovaries and testes. Histological analysis has to be included because it provides precise information on oocyte developmental stages and it can distinguish between immature gonads and regressing ones, or those partly spawned (Abaunza et al., 2008). The HOMSIR project provided microscopical maturity ogives from the different IXa subdivisions. The maturity ogive from Subdivision IXa South is adopted here as the maturity-at-age for all years until 2006 of the southern stock, since it was based on a better sampling than in the others subdivisions. The percentage of mature female individuals per age group was adjusted to a logistic model. In 2007 a new estimate of maturity proportion by age was available for Division IXa for the application of the Daily Egg Production Method (DEPM). This maturity ogive was then adopted since 2007 and will be revised with new data collected in the DEPM to be carried out in Natural mortality Natural mortality has been considered to be This level of natural mortality was adopted for all horse mackerel stocks since However, the presence of very old horse mackerel specimens in the southern stock is much scarcer than in the western or North Sea stocks. On the other hand, the available references on natural mortality estimates for other Trachurus species (e.g. Trachurus capensis, Trachurus japonicus and Trachurus murphyi) show higher natural mortality values, being higher than 0.3 in the majority of cases (range from 0.1 to 0.5) (Cubillos et al., 2008; MFMR, 2006; Zhang, 2001). Also, the assumption that natural mortality is the same for all ages is highly unrealistic, given that the chances of a 10 cm fish of being predated are much higher than those of a 30 cm fish. As a conclusion, it is considered that the value of natural mortality (0.15) is an underestimation for southern horse mackerel stock. It is generally accepted that natural mortality is very high during larval stages and decreases as the age of the fish increases, approaching a steady rate (Jennings et al., 2001). The natural mortality adopted in the assessment (mean = 0.3) is dependent on age, being higher for younger ages. The adopted values are the following and are based in the estimates for other similar
83 ICES WGHANSA REPORT pelagic species, observed diet composition of fish predators in the area and taking into account the observed mean life span in southern horse mackerel. Age Nat Mor B.3. Surveys The only survey datasets currently available for the assessment of southern horse mackerel are those from the bottom-trawl surveys carried out in the 4th quarter (October) by Portugal (Pt-GFS-WIBTS-Q4) and Spain (Sp-GFS-WIBTS-Q4) in ICES Division IXa. These surveys cover contiguous areas at the same time but do not cover the southern part of the stock distribution area, corresponding to the Spanish part of the Gulf of Cadiz. In that area another bottom-trawl survey is carried out Sp-GFS-caut- WIBTS-Q4), usually in November, but the raw data were unavailable in time for this workshop to investigate the effect of merging it with the datasets from the other areas. This work is expected to be completed in time for the next assessment working group, in June As suggested in previous reviews of the assessment of this stock, the Spanish survey from Subdivision IXa North (Sp-GFS-WIBTS-Q4) and the Portuguese survey (Pt-GFS- WIBTS-Q4) are treated as a single survey, although they are carried out with different vessels and slightly different bottom-trawls. The catchability of these vessels (BO Cornide de Saavedra and NI Noruega) and fishing gears were compared for different fish species during project SESITS (EU Study Contract ) and no significant differences were found for horse mackerel. Thus, the raw data (number per hour and age in each haul, including zeros) of the two datasets were merged and treated as a single dataset. The abundance data by age and year do not follow a Normal distribution, having a big proportion of zeros and a few extreme values. This is explained by the patchiness in the distribution of horse mackerel and by its characteristic of forming large shoals. Therefore, it is questionable whether a simple average of the number-per-hour, by age and year, is an adequate abundance index for tuning the stock assessment. Different ways of obtaining an abundance index by age and year were explored, all of them based on the smoothing of the data assuming probability distributions other than the Normal one. For this, we fitted Generalized Additive Models (GAM) to the raw data using the package mgcv (Wood, 2006) in the R statistical computing language (R Core Development Team, 2010). Data smoothing was tried with four different strategies: by year class (one GAM for each year-class, with age as covariate), by age (one GAM by age with year as covariate), by year (one GAM by year with age as covariate), and by age and year (one GAM using a bi-dimensional smoother by age and year). A log link function was used in all cases, and the error was modelled with a binomial negative distribution. Other distributions and transformations of the data were tried, but with worse fittings than with these settings. An example of the GAM fitting diagnostics with each of these four strategies showed in all cases a poor fitting, with the residuals showing undesirable patterns. Looking at the differences between the indices matrix obtained with each of these strategies and the one obtained by a simple average of the raw data, it is clear that most of the attempted strategies to smooth the data would result in strong differences, especially for the youngest ages. Given that an acceptable fit could not be achieved with these
84 616 ICES WGHANSA REPORT 2013 GAMs, it was decided to use the simple averaged data as abundance indices for tuning the assessment. Further work must be carried out in the future to better address this problem. Two very clear features can be observed in the abundance indices dataset: a strong variability of age 0 and strong year effects (some years with higher abundance of all ages than others). The first feature may be explained by the greater aggregation tendency of these small fish in dense shoals and by their typically pelagic behaviour, which makes them less available to the bottom trawl. When, by chance, one or a few of those shoals are captured by the bottom trawl (e.g. at the end of a haul when the trawl is being towed at mid-water), it contributes to a high abundance estimate of that age class. The apparent year effects in the data are more difficult to explain, and are likely due to natural variations in the availability of the fish in that time of the year and small variations in sampling effort (e.g. due to bad weather). Both the variability in age 0 and the apparent year effects must be accounted for in the assessment model to be fitted to these data. Recent work suggests that horse mackerel has indeterminate fecundity (Gordo et al., 2008), which makes the Annual Egg Production Method (AEPM) unsuitable to estimate SSB for this species. For species with indeterminate fecundity, the Daily Egg Production Method (DEPM) must be used instead. The existence of different series of data from egg surveys covering the whole area of the southern horse mackerel stock makes it possible to obtain egg production estimates using DEPM. For this stock, a total of three SSB estimates, for the years 2002, 2005 and 2007, were made available. The SSB estimate and variance for 2007 was obtained from a DEPM egg survey directed at horse mackerel. Details of the sampling procedure, data obtained and methods followed are available from the 2008 report of the Working Group on Mackerel and Horse Mackerel Egg Surveys (ICES, ICES CM 2008/LRC:09). However, some details were corrected after the WGMEGS report, namely the total egg distribution area (which was corrected from 1.7e11 sq.meter to 7.1e11 sq.meter) and the fitting of the mortality curve to the egg abundance data, which was done using a GLM with a log link and assuming a Poisson distribution for the variance, instead of the non-linear regression described in the WGMEGS report. This resulted in a change of egg production from 13 eggs/sq.meter to 17 eggs/sq.meter. The 2002 and 2005 estimates were obtained with egg abundance data collected during the surveys directed at sardine in 2002 and 2005 and from horse mackerel adult samples collected at the same time of those surveys. The methodology followed to estimate SSB was the same as the one for 2007, although the area covered in the egg sampling, which corresponded to the sampling grid for sardine, was smaller than in There are different criteria that can be used to estimate the spawning fraction, such as the presence of migratory nucleus, hydrated oocytes or post-ovulatory follicles (POF). Estimates of SSB were obtained for the three years with all these criteria, and the obtained trends in SSB were parallel but with different levels. The POF criteria, assuming POF last for two days as in other species at similar temperatures (Ganias et al., 2003; Hunter and Macewicz, 1985) was the one providing the lowest CV, being therefore adopted to use in the assessment. However, given the uncertainty in the absolute value of SSB, partly due to the choice of the criteria for the spawning fraction, the SSB index for the assessment must be treated as relative and a corresponding catchability parameter has to be estimated.
85 ICES WGHANSA REPORT Still another source of uncertainty is the egg distribution area, which was roughly defined and kept fixed for the three years. In all these egg surveys, there are several transects with the presence of eggs in the most offshore station, which indicates that the area with egg presence must, in some cases, be extended further away from the coast. However, a good approximation of that area is impossible to obtain with the available data. B.4. Commercial cpue No commercial cpue data is used in the stock assessment. B.5. Other relevant data There were no other data considered at this time. C. Assessment: data and method Model used: AMISH (Assessment Method for the Ibero-Atlantic Stock of Horse- Mackerel). A model similar to the one adopted by the South Pacific Regional Fishery Management Organization (SPRFMO) for the assessment of Chilean jack mackerel (Trachurus murphyi) was modified for application with horse mackerel. This method (Lowe et al., 2009) models the population numbers-at-age as projections forward based on recruitment estimates leading up the initial population numbers-at-age (in 1992 for this case) and subsequent annual recruitment and fishing mortalities parameters. These underlying population numbers-at-age are fit through an observation model for parameter estimation via a penalized likelihood applied to a quasi-newton minimisation routine with partial derivatives calculated by automatic differentiation (Griewank and Corliss, 1991). The automatic differentiation and minimisation routines are those from the package AD Model Builder (ADMB). A similar model is currently used in many stock assessments in North American waters (e.g., Atka mackerel, eastern Bering Sea pollock, Pacific Ocean perch). It is a simple, well tested, and widely used methodology. The population equations, model fitting components, and model settings are listed in Tables 1 4. The approach differs from the XSA methods in that: calculations proceed from the initial conditions to the present and into the future, the catch-at-age is not assumed to be known exactly, the inclusion of annual estimates of sampling variability (for both age composition and survey index precision) is allowed, fishing mortality is separable but selection-at-age is allowed to change gradually over time, separate components of the fishery are treated independently, some parameters, which are assumed constant in XSA, such as the catchability coefficients associated with tuning indices, may be allowed to change over time, statistical basis allows for careful consideration of data quality and the impact on the uncertainty of estimates.
86 618 ICES WGHANSA REPORT 2013 The model begins in the first year of available data with an estimate of the population abundance-at-age. Recruitments are estimated for each year. In subsequent ages and years the abundance-at-age is reduced by the total mortality rate. This projection continues until the terminal year specified. If data are unavailable to estimate recruitment, the model will use the geometric mean value and hence can be projected to any arbitrary year (assuming specified catches). The fishing mortality rates for each sector in the fishery are assumed to be separable into an age component (called selectivity) and a year component (called the F multiplier). The selectivity patterns are allowed to change over time. Expected catches are computed according to the usual catch equation using the determined fishing mortality rate, the assumed natural mortality rate, and the estimated population abundance described above. The statistical fitting procedure used with the model will try to match the indices and the catch-at-age. The emphasis of each of these sources of information depends on the values of the relative weights assigned to each component by the user. The minimization processes proceeds in phases, in which groups of parameters are estimated simultaneously, while the remaining parameters are maintained at their initially assigned values. Once the objective function is minimized for a particular phase, more parameters are treated as unknown and added to those being estimated. This process of estimation in phases continues until all parameters to be estimated contribute to the objective function and the best set of all parameters that minimize the objective function value is determined. The software code and input files is available on request. Model Options chosen: The objective function is the sum of a number of negative log-likelihoods generally following two types of error distributions: the lognormal and multinomial and details are listed in Table 3. The specifications of input sampling levels (in terms of sample size or variance term) are provided in Table 4. The separability in the fishing mortality was allowed to vary according to a shift in fleet composition. An F multiplier was estimated for the first year, and was allowed to change in time by estimating deviations to this parameter for each year. The fishing mortality at each age, year and fleet resulted from the product of the F multipliers by the selectivity parameter at each age and fleet. Three selectivity vectors were estimated, corresponding to blocks of fleets sharing a similar selectivity-at-age. This is a useful feature of the model that helps to avoid overparameterisation. By looking at the plots of catch-at-age by fleet, it was decided to have a common selectivity for the purse-seine fleets, together with the Portuguese bottom-trawl fleet, another one for the artisanal fleets and a third one just for the Spanish bottom-trawl fleet. One catchability parameter for the abundance index was kept fixed over time. The model fitting is affected by statistical weights (lambdas or inverse variance functions) as part of the objective function. Specified input variance assumptions can influence the fitting of the model, by attributing a lower or higher importance to different data sources that contribute to the objective function. The variance assumption assumed the highest precision for landings data by year and fleet. The fishery proportions-at-age for the moment were assumed to have an effective sample size of 100 compared to the value of ten specified for the survey estimates of age composition. The survey index data was fit assuming that the coefficient of variation was 30%. These values are typical for this type of information and diagnostic plots of
87 ICES WGHANSA REPORT model fits confirmed that they are reasonable. As more data become available, these assumptions can be modified to more appropriate and potentially time-varying values. D. Short-term projection Model used: Apropos designed function, named mff, to perform deterministic forecast, only with catch constraints (allowing the introduction of variability in the assumed recruitment values). Having the initial numbers-at-age at the beginning of the year, the total F at age in the assessment year y-1 and the assumptions we want to make on the weight-at-age, the selectivity-at-age by fleet, the maturity ogive, the natural mortality rate and the recruitment. We can project forward the population given a level of catches for the intermediate year y and for the protection year y+1. It is also possible to add some variability to the recruitments, by including a standard deviation value. The method starts projecting the population numbers-at-age from the last assessment year with the estimated the fishing mortality rates by fleet, N 0 =rec e ε, ε ~ N 0, σ N 1 =N 0 e M 0 +F p 0 N a =N a 1 e M +F a 1 a 1, a in 2,,A-1 N A =N A 1 e M A 1+F A 1 +N A e M A+F A where rec corresponds to the assumed recruitment level, Na are the numbers-at-age a, Ma is the natural mortality-at-age a, Fa is the fishing mortality-at-age a, σ is the standard deviation of the recruitment and p is the proportion of the year from the recruitment time to the end of the year. For the intermediate year in the short-term projections, the population numbers-atage are calculated assuming catch constraints by fleet, using Pope s approximation forward, λ= catch, S a N a W a a C a = a S a N a λ N 0 =rec e ε, ε ~ N 0, σ N 1 = N 0 C 0 e M p2 0 e M p 0 proportiontothe max imumthatcouldbecaptured N a = N a 1 C a 1 e M 2 a 1 e M a 1, a in 2,,A-1 N A = N A 1 C A 1 e M 2 A 1 e M A 1 N A C A e M 2 A e M A where λ is the proportion to the maximum catch that could be captured, rec corresponds to the assumed recruitment, Na are the numbers-at-age a, Ma is the natural mortality-at-age a, Fa is the fishing mortality-at-age, Sa is the selectivity-at-age, a and p is the proportion of the year from the recruitment time to the end of the year. The source code is available on request. Software used: R (
88 620 ICES WGHANSA REPORT 2013 Initial stock size: the one estimated by the assessment model Maturity: the same as in the previous year of the assessment F and M before spawning: both of them are 0 Weight-at-age in the stock: the same as in the previous year of the assessment Weight-at-age in the catch: assumed equal to the weight-at-age in the stock Exploitation pattern: the one estimated in the assessment model Intermediate year assumptions: the catches by fleet are assumed to be exactly the same as the ones in the previous year Stock recruitment model used: no stock recruitment model is used, the recruitment is assumed to be stochastic in all the years (the assessment year, the intermediate and the projection year), around the geometric mean of the historical values with the same variability as the one observed in the series. Procedures used for splitting projected catches: E. Medium-term projections No medium-term projection has been performed for this stock Model used: Software used: Initial stock size: Natural mortality: Maturity: F and M before spawning: Weight-at-age in the stock: Weight-at-age in the catch: Exploitation pattern: Intermediate year assumptions: Stock recruitment model used: Uncertainty models used: Initial stock size: Natural mortality: Maturity: F and M before spawning: Weight-at-age in the stock: Weight-at-age in the catch: Exploitation pattern: Intermediate year assumptions: Stock recruitment model used:
89 ICES WGHANSA REPORT F. Long-term projections No long-term projection has been performed for this stock. Model used: Software used: Maturity: F and M before spawning: Weight-at-age in the stock: Weight-at-age in the catch: Exploitation pattern: Procedures used for splitting projected catches: G. Biological reference points Reference points have not been defined for this stock. H. Other issues I. References ASTT Report from the assessment simulation task team on Chilean jack mackerel stock assessments, April 6 9th 2010, IMARPE, Lima, Peru. Abaunza, P., Gordo, L.S., García Santamaría, M.T., Iversen, S.A., Murta, A.G., Gallo, E Life history parameters as an important basis for the initial recognition of stock management units in horse mackerel (Trachurus trachurus). Fisheries Research 89: Abaunza, P., Murta, A.G., Campbell, N., Cimmaruta, R., Comesaña, A.S., Dahle, G., García Santamaría, M.T., Gordo, L.S., Iversen, S.A., MacKenzie, K., Magoulas, A., Mattiucci, S., Molloy, J., Pinto, A.L., Quinta, R., Ramos, P., Sanjuan, A., Santos, A.T., Stransky, C., Zimmermman, C. 2008b. Stock identity of horse mackerel (Trachurus trachurus) in the Northeast Atlantic and Mediterranean Sea: integrating the results from different stock identification approaches. Fisheries Research. 89, Cabral, H.N., Murta, A. G The diet of blue whiting, hake, horse mackerel and mackerel off Portugal. J. Appl. Ichthyiol. 18: Castro, J., Punzón, A Pelágic métiers of the Northern Spanish coastal bottom trawl fleet. Working Document to the ICES Working Group on the Assessment of Mackerel, Horse Mackerel, Sardine and Anchovy (September, Vigo, Spain). Included in the W.G. report: ICES C.M. 2006/ACFM: 08. Cubillos, L., Gatica, C., Serra, R Short review of natural mortality and size at first maturity on jack mackerel (Trachurus murphyi) in the southeastern Pacific. Working Document Nº 14 to the Chilean Jack Mackerel Workshop, Santiago, Chile, 30 June 4 July In: Report of the South Pacific Regional Fishery Management Organization. Chilean Jack Mackerel Workshop. Frid, C.L.J. (coord.) The Synthesis of the EU funded INEXFISH project. Final report of the project IN-EX Fish - Incorporating extrinsic drivers into fisheries management (FP ). 156 pp.
90 622 ICES WGHANSA REPORT 2013 Ganias, K. Somapakis, S. Machias, A. Theodorau, A. J Evaluation of spawning frequency in a Mediterranean sardine population (Sardina pilchardus) Marine biology, 142: Gordo, L. S., Costa, A., Abaunza, P., Lucio, P., Eltink, A. T. G. W., Figueiredo, I Determinate versus indeterminate fecundity in horse mackerel. Fish. Res., 89: Griewank, A., Corliss, G. F. (Editors) Automatic Differentiation of Algorithms: Theory, Implementation, and Application. SIAM, Philadelphia. Hernández, "Report of the census fishing fleets operating in Northeast Atlantic waters in 2007." Authors: Carmen Hernández. Internal Report IEO nº 15, 32p. (SAP Project). June 13, In Spanish. Hunter, J. R., Macewicz, B. J Rates of atresia in in the ovary of captive and wild northern anchovy, Engraulis mordax. Fish. Bull., U.S. 83: ICES Report of the Working Group on the assessment of the stocks of sardine, horse mackerel and anchovy June 1990, ICES Headquarters, Copenhagen. ICES CM 1990/Assess:24: 169pp. ICES Report of the Working Group on the assessment of the stocks of sardine, horse mackerel and anchovy June 1991, ICES Headquarters, Copenhagen. ICES CM 1991/Assess:22: 138pp. ICES Report of the Working Group on the Assessment of Mackerel, Horse Mackerel, Sardine and Anchovy. ICES CM 2005/ACFM:08. ICES Report of the Working Group on the assessment of mackerel, horse mackerel, sardine and anchovy June 1992, ICES Headquarters, Copenhagen. ICES CM 1992/Assess:17: 207pp. ICES Report of the Working Group on Mackerel and Horse Mackerel Egg Surveys (WGMEGS). ICES CM 2008/LRC:09. Jennings, S., Kaiser, M.J., Reynolds, J.D Marine Fisheries Ecology. Blackwell Science, Ltd. London. Lowe, S., J. Ianelli, M. Wilkins, K. Aydin, R. Lauth, and I. Spies Stock assessment of Aleutian Islands Atka mackerel. In Stock Assessment and Evaluation Report for the Groundfish Resources of the Bering Sea/Aleutian Islands Regions. North Pacific Fisheries Management Council, P.O. Box , Anchorage, Alaska, MFMR Ministry of fisheries and marine resources. Horse mackerel, rock lobster and deep-sea crab geological state of the stock. < Murta, A.G Morphological variation of horse mackerel (Trachurus trachurus) in the Iberian and North African Atlantic: implication for stock identification. ICES J. Mar. Sci. 27: Murta, A.G., Abaunza, P Has horse mackerel been more abundant than it is now in Iberian waters? Working Document to the ICES Working Group on the Assessment of Mackerel, Horse Mackerel, sardine and Anchovy (Copenhagen, 2000). Document included in the Working Group Report: ICES C.M. 2000/ACFM: 5. Murta, A.G., Abaunza, P., Cardador, F., Sánchez, F Ontogenic migrations of horse mackerel (Trachurus trachurus) along the Iberian coast: implications for stock identification. Fish. Res. 89: Silva, C. and Murta, A. Classification of the Trawl and Purse Seine fishing trips in the Portuguese Continental Waters. Working Document to be presented at the Meeting of the Working Group on the Assessment of Hake, Monk and Megrim, (WGHMM) May Vigo. Sousa, P., Azevedo, M., Gomes, M.C Species-richness patterns in space, depth, and time ( ) of the Portuguese fauna sampled by bottom trawl. Aquat. Living Resour. 19:
91 ICES WGHANSA REPORT Wood S.N Generalized additive models: an introduction with R. Chapman & Hall/CRC. 391 pp. Zhang, C.I., Lee, J.B Stock assessment and management implications of horse mackerel (Trachurus japonicus) in Korean waters, based on the relationships between recruitment and the ocean enviroment. Progress in Oceanography, 49:
92 624 ICES WGHANSA REPORT 2013 Table 5. Symbols definitions used for model equations. General Definitions Symbol/Value Use in Catch at Age Model Year index: i = {1992,., 2010} Age index: j = { 0,1,2,, 11+} Mean weight in year t by age j Maximum age beyond which selectivity is constant i j Wt,j Maxage Selectivity parameterization Instantaneous Natural Mortality Mj Fixed M=0.8,0.5,0.3,0.2, , for j=0,1,2 11 Proportion females mature at age j Sample size for proportion in year i Survey catchability coefficient pj Ti s q Definition of spawning biomass Scales multinomial assumption about estimates of proportion at age μ s Prior distribution = lognormal( q 2 q σ, ) Stock-recruitment parameters R0 h 2 σ R Unfished equilibrium recruitment, steepness, variance Virginal biomass ϕ Spawning biomass per recruit when there is not fishing Estimated parameters φ i,r 0,h,ε i,μ f,μ s,m,η s j,η f j,q s Note that the number of selectivity parameters estimated depends on the model configuration.
93 Z i j i, j= i 1, j 1 s s Zij NSe s ij j pij = s s Zij NSe ij j j ICES WGHANSA REPORT Table 6. Variables and equations describing implementation of the horse mackerel assessment model. Eq Description 1) Survey abundance index (s) by year ( Δs represents the fraction of the year when the survey occurs) 2) Catch biomass by year i 3) Proportion at age j, in year i Symbol/Constraints Key Equation(s) I i s 11 s s s i = ij ij j j= 0 I q NWSe C 11 f ij ij ij j= 0 11 P, P = 1.0 ij ij j= 0 s Z ij f ˆ Fij Zij C = NW (1 e ) Z 4) Initial numbers at age j = 0 R ) 0 < j < 10 p f ij = Cˆ j 1992, j f ij Cˆ f ij N = e µ ε j µ R+ ε1993 j M N1992, j = e e j= 1 6) j = 11+ ( ) 1 N = N e 1992, ,10 1 M ij 7) Subsequent years (i >1992) j = 0 R i Ni,2 = e µ + ε 8) 0 < j < 10 1, 1 N N e Z 9) j = 11+ t 1,10 Zi 1,11 N = N e + N e 10) Year effect and individuals at age 2 and i = 1981,, ) Index catchability Mean effect Age effect 2010 ε, ε = 0 i i i= 1981 f µ s, µ 11 η, η = 0 ij j= 0 ij i,11 i 1,10 i 1,11 R i Ni,0 = e µ + ε = s s qi e µ s sj s sj s e η j = j maxage s maxage e η = j > maxage 12) Instantaneous fishing mortality F ij f =e μ f +η j f +φi 13) Mean fishing effect μ f 14) Annual effect of fishing mortality in year i 15) age effect of fishing (regularized) In year time variation allowed 2010 ϕ, ϕ = 0 i i i= 1992 f η ij, + 12 ij j= 2 η = 0 f sij f sij = f j e η f maxage e η, j maxage = j > maxage In years where selectivity is constant over time f f η = η i, j i 1, j i change year 16) Natural Mortality vector Mj , for ages ) Total mortality Z ij = f F ij f +M
94 626 ICES WGHANSA REPORT 2013 Eq Description 17) Spawning biomass (note spawning taken to occur at mid of January) 18) Recruitments (Beverton-Holt form) at age 0. Symbol/Constraints Key Equation(s) Bi Z ij 12 i = ij ij j j= 0 B Ne Wp R Bi i R α i =, β + Bi 4hR B 0 0 ( 1 h) α = and β = where 5h 1 5h 1 B0 = R0ϕ ϕ 12 12M M( j 1) e W12 p12 = e Wp j j + M j= 2 1 e h=0.8
95 ICES WGHANSA REPORT Table 7. Specification of objective function that is minimized (i.e., the penalized negative of the log-likelihood). Likelihood /penalty component 44) Catch biomass likelihood 19) Abundance indices 20) Proportion at age likelihood 21) Penalty on smoothness for selectivities 22) Penalty on recruitment regularity 23) Recruitment curve penalty 24) Overall objective function to be minimized 2010 f f C i L1 = λ4 1992ln ˆ f f i= C i s s I i L2 = λ1 ln ˆ s s i I i ( ˆ ) L = τ P ln P k = 3, 4 L k k k k i ij ij ki,, j 11 l l l λ ( η + 2 η η + 1) k k j j j k j= 0 2 = + 2 k = 6, L = λ ε i= 1981 L 2 i Ni,0 6 = λ6 ln i= 1992 R i L= k L k 2 2 Description / notes Fit to catch biomass in each year Survey abundances k=3 for the fishery, k=4 for the survey Smoothness (second differencing), Note: k=6 for the fishery, k=9 for the survey Influences estimates where data are lacking (e.g., if no signal of recruitment strength is available, then the recruitment estimate will converge to median value). Conditioning on stockrecruitment curve over period (but reduced to have negligible effect on estimation).
96 628 ICES WGHANSA REPORT 2013 Table 8. Input variance or sample size ( τ assumptions and corresponding penalties ( used on log-likelihood functions in the base model. L Abundance index τ L 1 Landings Combined index Fishery age composition Survey age composition Time-change in fishery selectivities Fishery age-specific penalties Fishery descending selectivity-with-age penalty Time-change in survey selectivities Survey age-specific penalties Survey descending selectivity-with-age penalty Recruitment regularity S-Recruitment curve fit (for period , scale only) Input data types and characteristics: Variable from year to year Type Name Year range Age range Yes/No Caton Catch in tonnes Si Canum Catch-at-age in numbers Si Weca Weight-at-age in the commercial catch Si West Weight-at-age of the spawning stock at Si spawning time. Mprop Proportion of natural mortality before Si spawning Fprop Proportion of fishing mortality before No spawning Matprop Proportion mature-at-age No Natmor Natural mortality No Spanish-Portuguese bottom-trawl survey
97 ICES WGHANSA REPORT Stock Annex: Sardine Subarea VII and VIIIabd Stock Working Group Sardine Subarea VII + VIIIabd WGHANSA Date 4th to 8th of February, 2013 Revised at Authors WKPELA E. Duhamel, L. Ibaibarriaga, J. Massé, L. Pawlowski, M. Santos and A. Uriarte. A. General A.1. Stock definition European sardine (Sardine pilchardus Walbaum, 1792) has a wide distribution extending in the Northeast Atlantic from the Celtic Sea and North Sea in the north to Mauritania in the south. Populations of Madeira, the Azores and the Canary Islands are at the western limit of the distribution (Parrish et al., 1989). Sardine is also found in the Mediterranean and the Black Seas. Changing environmental conditions affect sardine distribution, with fish having been found as far south as Senegal during episodes of low water temperature (Corten and van Kamp, 1996; Binet et al., 1998). Sardine in Celtic Seas (VIIabcfgjk), English Channel (VIId, VIIe, VIIh) and in Bay of Biscay (VIIIabd) are considered to belong to the same stock from a genetic point of view. Therefore, the sardine stock in VIIIabd and VII can be considered as a single stock unit but it is important to note that there should be some distinction within the stock structure to take account of some regional differences between fisheries as there are some locally important fisheries operating in some area. The availability of data strongly differs between the northern (Celtic Seas, English Channel) and the southern component (Bay of Biscay). Additionally, each area presents different historical exploitation patterns. Therefore analysis and management advice between the areas may differ, even if the advice covers the whole stock. A.2. Fishery There are currently no management measures implemented for this stock. The fisheries appear to be regulated by market price. Some fisheries (e.g. French fleets in the Bay of Biscay) have set their own local management in order to sustain correct market prices which imply targeting fish of certain sizes and limit to the total amount of catch. The absence of TAC is currently not seen as a problem for the management of those fisheries as the demand of sardine is considered to be low. Divisions VIIIabd (Bay of Biscay) An update of the French and Spanish catch dataseries in Divisions VIIIa and VIIIb (from 1983 and 1996 for France and Spain, respectively) including 2011 catches was presented to this benchmark. Spanish catches are taken by purse seines from the Basque Country operating only in Division VIIIb. Spanish landings peaked in 1998 and 1999 with almost 8 thousand tonnes but have decreased until 2010 to below 1 thousand tonnes. The Spanish fishery takes place mainly during March and April and in the fourth quarter of the year.
98 630 ICES WGHANSA REPORT 2013 French catches have increased along the series, with values ranging from 4400 tonnes in 1983 to tonnes in 2011 (Figure A.2.1). A total of 90% of the catches are taken by purse seiners while the remaining 10% is reported by pelagic trawlers (mainly pair trawlers). A substantial part of the French catches originates in Divisions VIIh and VIIe, but these catches have been assigned to Division VIIIa due to their very concentrated location at the boundary between VIIIa, VIIh and VIIe. Spanish catches were unusually high prior 1989 where a strong drop occurs. The reason of this drop is unknown and likely to be related to some data aggregation issues which make any uses of landings prior this year uncertain. Both purse seiners and pelagic trawlers target sardine in French waters. Average vessel length is about 18 m. Purse seiners operate mainly in coastal areas (<10 nautical miles) while trawlers are allowed to fish within 3 nautical miles from the coast. Both pair trawlers and purse seiners operate close to their base harbour when targeting sardine. The highest catches are taken in the summer months. Almost all the catches are taken in southwest Brittany. While French catches in Divisions VIIIa and VIIIb are constituted by fish of a wide range of sizes with a peak at 20 cm length, sardine taken by Spanish vessels show a narrower range of sizes but with a peak at similar length size. The Bay of Biscay sardine fisheries overlaps with VIIe and VIIh (statistical rectangle 25E4, 25E5). Catches in those rectangles are assumed to be of sardine from Bay of Biscay. Therefore landings in Bay of Biscay and English Channel are corrected to take account of this phenomenon by adding the catches in those rectangles to the Bay of Biscay landings time-series Denmark Lithuania Germany Russia Denmark UK Netherland Ireland Spain France Figure A.2.1. Historical time-series of landings of sardine per country in the Bay of Biscay. Subareas VIIdeh (English Channel and VIIh) Most of the catches are concentrated close to or in the English Channel (VIId, VIIe, VIIh) with major landings from France and Netherlands, other catches being taken by England and Wales. Little information was available from other countries operating
99 ICES WGHANSA REPORT in that subarea. Catches have substantially oscillated with time and between countries from to less than 2000 tons. This region has been harvested substantially in the past by various fleets (Figure A.2.2) from various countries that are no longer operating in those waters. The peak of fishing activity was in the early 1990s at around tons. Over the last decades, the landings have been between nearly 5000 to tons with no particular trends. The English Channel is after Bay of Biscay the second fishing area for sardine Denmark Germany Russia Lithuania Ireland UK Netherland France Figure A.2.2. Historical time-series of landings of sardine per country in the English Channel and VIIh. As mentioned for the Bay of Biscay, catches in rectangles 25E4, 25E5 are removed from the official landings and added to the catches in the Bay of Biscay to take account of the mixing at the borders of Division VIIIa and VIIh and VIIe. Subareas VIIabcfgjk (Celtic Seas) Catches in this area are very low. A.3. Ecosystem aspects Sardine is prey of a range of fish and marine mammal species which take advantage of its schooling behaviour and availability. Sardine has been found to be important in the diet of common dolphins (Delphinus delphis) in Galicia (NW Spain) (Santos et al., 2004), Portugal (Silva, 2003) and the Atlantic French coast (Meynier, 2004). Recent studies of consumption of common dolphins in Galician (Santos et al., 2011) waters give figures ranging from almost 6000 tons to more than 9000 tons of sardine, which represents a rather small proportion of the combined Spanish and Portuguese annual landings of sardine from ICES Areas VIIIc and IXa (6 7%).There are also other species feeding on sardine, although to a lesser extent, such as: harbour porpoise (Phocoena phocoena), bottlenose dolphin (Tursiops truncatus), striped dolphin (Stenella coeruleoalba), and white-sided dolphin (Lagenorhynchus acutus) (e.g. Santos et al., 2007).
100 632 ICES WGHANSA REPORT 2013 B. Data B.1. Commercial catches Landings data have been available for since 1950 on various aggregation levels. Data are considered to be accurate for all countries starting 1989 within the whole area. Discards were measured only in 2012 and were low based on the French Observers at sea program in the Bay of Biscay and hence not included in the assessment. In the past (late eighties and early nineties for the French Pelagic trawlers and sixties and seventies for the Spanish Purse seine fleet) they seemed to be more relevant (according to disputes among fishermen), but were never quantified. Length distribution of discards are also available from Netherlands in the English Channel for B.2. Biological Catches-at-length and catches-at-age are known since 1984 for Spain and since 2002 for France in the Bay of Biscay. Because of the availability of the datasets only the period starting in 2000 is used. They are obtained by applying to the monthly Length distributions half year or quarterly ALKs. Biological sampling of the catches has been generally sufficient, and useful to have a better knowledge of the age structure of the catches during the second semester in the North of the Bay of Biscay. Complete age composition and mean weight-at-age on half year basis, were each year reported in ICES (WGHANSA report, ICES 2012). Age reading is considered accurate. The most recent cross reading exchanges and workshop between Spain and France (but other countries, too) took place in 2011 (WKARAS report, ICES 2011). The overall level of agreement and precision in sardine of the Bay of Biscay age reading determinations seems to be satisfactory: Most of the sardine otoliths were well classified by most of the readers during the 2011 workshop (with an average agreement 75% and a CV of 14%). Sardines are mature in their 1st year of life. Growth in weight and length are routinely obtained from surveys and from the monitoring of the fishery. Natural mortality is fixed at 0.33 based on the assessment for sardine in VIIIc and IXa. This parameter is considered to vary between years and ages, but it is assumed to be constant for the assessment of the stock. B.3. Surveys Relevant surveys are available for the Bay of Biscay only. Some sardines are caught during the various demersal surveys (e.g FR-IBTS) occuring each year in the Celtic Seas, Bay of Biscay and English Channel but those catches are not substantial enough to be considered as indicators of the stock status. Some abundance indices are available every year for the Bay of Biscay through two spring surveys based on acoustic surveys (PELGAS) and DEPM (Daily egg production method - BIOMAN). The population present in the Bay of Biscay is monitored by the two annual surveys carried out in spring on the spawning stock, namely, the Daily Egg Production Method and the Acoustics surveys (regularly since 1989, although surveys were also con-
101 ICES WGHANSA REPORT ducted in 1983, 1984 and some in the seventies) (Massé, 1988; 1994; 1996). Both surveys provide spawning biomass and population-at-age estimates. This survey based monitoring system provides population estimates by the middle of the year, when a small part of the annual catches have been already taken. B.3.1. Sardine acoustic indices (PELGAS survey) Acoustic surveys are carried out every year in the Bay of Biscay in spring on board the French research vessel Thalassa since The objective of PELGAS surveys is to study the abundance and distribution of pelagic fish in the Bay of Biscay. These surveys are connected with Ifremer programmes on data collection for monitoring and management of fisheries and ecosystemic approach for fisheries. This task is formally included in the first priorities defined by the Commission regulation EU N 199/2008 of 06 November 2008 establishing the minimum and extended Community programmes for the collection of data in the fisheries sector and laying down detailed rules for the application of Council Regulation (EC) No 1543/2000. These surveys must be considered in the frame of the Ifremer fisheries ecology action "resources variability" which is the French contribution to the international Globec programme. It is planned with Spain and Portugal in order to have most of the potential area to be covered from Gibraltar to Brest with the same protocol for sampling strategy. Data are available for the ICES working groups WGHANSA, WGWIDE and WGACEGG. In 2003, survey data are considered less reliable because of unusual environmental conditions linked to the heat wave over Europe. Results this year were considered not representative of the true status of the stock. B PELGAS Method and sampling strategy In the frame of an ecosystemic approach, the pelagic ecosystem is characterised at each trophic level. In this objective, to assess an optimum horizontal and vertical description of the area, two types of actions are combined: Continuous acquisition by storing acoustic data from five different frequencies and pumping seawater under the surface in order to evaluate the number of fish eggs using a CUFES system (Continuous Under-water Fish Eggs Sampler); and Discrete sampling at stations (by trawls, plankton nets, CTD). Satellite imagery (temperature and sea colour) and modelisation will be also used before and during the cruise to recognise the main physical and biological structures and to improve the sampling strategy. Concurrently, a visual counting and identification of cetaceans and birds (from board) is carried out in order to characterise the higher level predators of the pelagic ecosystem. Satellite imagery (temperature and sea colour) and modelisation are also used before and during the cruise to recognise the main physical and biological structures and to improve the sampling strategy. The strategy of the survey is the same for the whole series (since 2000). Acoustic data were collected along systematic parallel transects perpendicular to the French coast (Figure B.3.1.1). The length of the ESDU (Elementary Sampling Distance Unit) was 1 mile and the transects were uniformly
102 634 ICES WGHANSA REPORT 2013 spaced by 12 nautical miles covering the continental shelf from 20 m depth to the shelf break. Acoustic data were collected only during the day because of pelagic fish behaviour in this area. These species are usually dispersed very close to the surface during the night and so "disappear" in the blind layer for the echo sounder between the surface and 8 m depth. Two echo-sounders are usually used during surveys (SIMRAD EK60 for vertical echo-sounding and MARPORT on the pelagic trawl). Since 2009 the SIMRAD ME70 is used for multibeam visualisation. Energies and samples provided by split beam transducers (six frequencies EK60, 18, 38, 70, 120, 200 and 333 khz), simple beam (MARPORT) and multibeam echosounder were simultaneously visualised, stored using the MOVIES+ software and at the same standard HAC format. The calibration method is the same that the one described for the previous years (see W.D. 2001) with a tungsten sphere hanged up 20 m below the transducer and is generally performed at anchorage in front of Machichaco Cap or in the Douarnenez Bay, on the west side of Brittany, in optimal meteorological conditions. Acoustic data are collected by Thalassa along the totality of the daylight route from which about 2000 nautical miles on one way transect are usable for assessment. Fish are measured on board (for all species) and otoliths (for anchovy and sardine) are collected for age determinations. Figure B The acoustic transects network of the PELGAS survey. B Echoes scrutinizing Most of the acoustic data along the transects are processed and scrutinised during the survey and are generally available one week after the end of the survey. Acoustic energies (Sa) are cleaned by sorting only fish energies (excluding bottom echoes, para-
103 ICES WGHANSA REPORT sites, plankton, etc.) and classified into several categories of echotraces according to the year fish (species) structures. D1 energies attributed to mackerel, horse mackerel, blue whiting, various demersal fish, corresponding to cloudy schools or layers (sometimes small dispersed points) close to the bottom or of small drops in a 10 m height layer close to the bottom. D2 energies attributed to anchovy, sprat, sardine and herring corresponding to the usual echo-traces observed in this area since more than 15 years, constituted by schools well defined, mainly situated between the bottom and 50 meters above. These echoes are typical of clupeids in coastal areas and sometimes more offshore. D3 energies attributed to blue whiting, myctophids and boarfish offshore, just closed to the shelf-break and on the platform in the north. D4 energies attributed to sardine, mackerel and anchovy corresponding to small and dense echoes, very close to the surface. D8 energies attributed exclusively to sardine (big and very dense schools). B Data processing The global area is split into several strata where coherent communities are observed (species associations) in order to minimise the variability due to the variable mixing of species. For each stratum, a mean energy is calculated for each type of echoes and the area measured. A mean haul for the strata is calculated to get the proportion of species into the strata. This is obtained by estimating the average of species proportions weighted by the energy surrounding haul positions. Energies are therefore converted into biomass by applying catch ratio, length distributions and TS relationships. The calculation procedure for biomass estimate and variance is described in Petitgas et al., The TS relationships used since 2000 are still the same and as following: Sardine, anchovy & sprat: TS = 20 Log L 71.2 Horse mackerel: TS = 20 Log L 68.7 Blue whiting: TS = 20 Log L 67.0 Mackerel: TS = 20 Log L 86.0 The mean abundance per species in a stratum (tons m.n. -2 ) is calculated as: M e( k) = s A ( D, k) X e( D, k) D and total biomass (tons) by: Be = A( k) Me( k) where, k : strata index D : echo type e : species SA : Average SA (NASC) in the strata (m2/n.mi.2) k Xe : species proportion coefficient (weighted by energy around each haul) (tons m -2 )
104 636 ICES WGHANSA REPORT 2013 A : area of the strata (m.n. 2 ) Then variance estimate is: Var. M ( k) = 2 e sa ( D, k) Var[ X e( D, k)] n. cha( k) + D Var. Be = A2( k) Var. Me( k) k cv = Var. Be Be X 2 e var[ s A ( D, k)] n. esu( D, k) At the end, density in numbers and biomass by length and age are calculated for each species in each ESDU according to the nearest haul length composition. These numbers and biomass are weighted by the biomass in each stratum and data are used for spatial distributions by length and age. The detailed protocol for these surveys (strategy and processing) is described in Annex 6 of WGACEGG report (ICES 2009). B.3.2 Anchovy Daily Egg Production Method (BIOMAN Survey) B the DEPM model The sardine spawning stock biomass estimates is derived according to Parker (1980) and Stauffer and Picquelle (1980) from the ratio between daily production of eggs in the sea and the daily specific fecundity of the adult population: Equation 1 Where, SSB SSB = Spawning stock biomass in metric tons P P A + = DF k R F S W = tot 0 Ptot P0 = Total daily egg production in the sampled area = daily egg production per surface unit in the sampled area A+ = Spawning area, in sampling units DF = Daily specific fecundity. k R F S DF = W W = Average weight of mature females in grams, R = Sex ratio, fraction of population that are mature females, by weight. F = Batch fecundity, numbers of eggs spawned per mature females per batch S = Fraction of mature females spawning per day k = Conversion factor from gram to metric tons (10 6 ) An estimate of an approximate variance and bias for the biomass estimator derived using the delta method (Seber, 1982, in Stauffer and Picquelle, op. cit.) was also developed by the latter authors. Population estimates of numbers-at-age are derived as follows:
 of age a in the population.")
105 ICES WGHANSA REPORT Equation 2 N a = N E a = SSB Ea W t Where, Na = Population estimate of numbers-at-age a. N = Total spawning stock estimate in numbers. SSB = spawning stock biomass estimate. SSB N = W t Wt = average weight of anchovies in the population. Ea = Relative frequency (in numbers) of age a in the population. Variance estimate of the sardine stock in numbers-at-age and total is derived applying the delta method. B Collection of plankton samples Every year the area covered to collect the plankton samples is the southeast of the Bay of Biscay taking in advance the anchovy survey in the Bay of Biscay. Predetermined distribution of stations is shown in Figure B The strategy of egg sampling is as follow: a systematic central sampling scheme with random origin and sampling intensity depending on the egg abundance found (Motos, 1994). Stations are located every 3 miles along 15-mile-apart transects perpendicular to the coast Nantes La Rochelle Bordeaux Predetermined vertical hauls (PairoVET) 35 Arcachon Santander Bi SS Figure B Predetermined stations of the vertical hauls (PairoVET) that could be performed during the survey. At each station a vertical plankton haul is performed using a PairoVET net (Pair of Vertical Egg Tow, Smith et al., 1985 in Lasker, 1985) with a net mesh size of 150 µm for a total retention of the sardine eggs under all likely conditions. The net is lowered
106 638 ICES WGHANSA REPORT 2013 to a maximum depth of 100 m or 5 m above the bottom in shallower waters. After allowing 10 seconds at the maximum depth for stabilisation, the net is retrieved to the surface at a speed of 1 m s-1. A 45 kg depressor is used to allow for correctly deploying the net. "G.O. 2030" flowmeters are used to detect sequential clogging of the net during a series of tows. Immediately after the haul, the net is washed and the samples obtained are fixed in formaldehyde 4% buffered with sodium tetra borate in seawater. After six hours of fixing, anchovy, sardine and other eggs species are identified, sorted out and count on board. Afterwards, in the laboratory, a percentage of the samples are checked to assess the quality of the sorting made at sea. According to that, a portion of the samples are sorted again to ensure no eggs were left in the sample. In the laboratory, sardine eggs are classified into morphological stages (adapted from Gamulin and Hure, 1955). The Continuous Underway Fish Egg Sampler (CUFES, Checkley et al., 1997) is used to record the eggs found at 3 m depth with a net mesh size of 350 µm. The CUFES system has a CTD to record simultaneously temperature and salinity at 3 m depth, a flowmeter to measure the volume of the filtered water, a fluorimeter and a GPS (Geographical Position System) to provide sampling position and time. All these data are registered at real time using the integrated EDAS (Environmental Data Acquisition System) with custom software. During the survey, the anchovy, sardine and other eggs are recorded per PairoVET station and the area where sardine eggs occurred is quantified. Following the systematic central sampling scheme (Cochran, 1977) each station is located in the centre of a rectangle. Egg Abundance found at a particular station is assumed to represent the abundance in the whole rectangle. The area represented by each station is measured. A standard station has a surface of 45 squared nautical miles (154 km 2 ) = 3 (distance between two consecutive stations) x 15 (distance between two consecutive transects) nautical miles. Since sampling is adaptive, station area changed according to sampling intensity and the cut of the coast. Sample depth, temperature, salinity and fluorescence profiles are obtained in every station using a CTD RBR-XR420 coupled to the PairoVET. In addition, surface temperature and salinity is recorded in each station with a manual termosalinometer WTW LF197.Moreover current data are obtained all along the survey with an ADCP (Acoustic Doppler Current Profiles). In some point determinate previously to the survey, water is filtered from the surface to obtain chlorophyll samples to calibrate the chlorophyll data. B Collection of adult samples Since 2008 each three years adults are being obtained from a research vessel with pelagic trawl taking in advance the anchovy survey. The research vessel pelagic trawler covers the same area as the plankton vessel. When the plankton vessel encountered areas with sardine eggs, the pelagic trawler is directed to those areas to fish. In each haul 100 individuals of each species are measure. Immediately after fishing, sardine is sorted from the bulk of the catch and a sample is selected at random. A minimum of 60 anchovies are weighted, measured and sexed and from the mature females the gonads of 25 non-hydrated females (NHF) are preserved. If the target of 25 NHF is not completed 10 more anchovies are taken at random and process in the same manner. Sampling is stopped when 120 anchovies have
107 ICES WGHANSA REPORT to be sexed to achieve the target of 25 NHF. Otoliths are extracted on board and read in the laboratory to obtain the age composition per sample. B Total daily egg production estimates Since 1999 the sardine eggs were counted but only were staged in years 1999, 2002, 2008 and In years without egg stages it was considered the total abundances of eggs defined as the sum along all the stations of the sardine eggs in each station multiplied by the area each station represents. In years when sardine eggs are sorted and staged (1999, 2002, 2008 and 2011), it is possible to estimate total daily egg production (Ptot). This is calculated as the product between the daily egg production (P0) and the spawning area (SA). P tot = P 0 SA A standard sampling station represents a surface of 45 nm 2 (i.e. 154 km 2 ). Since the sampling was adaptive, area per station changes according to the sampling intensity and the cut of the coast. The total area is calculated as the sum of the area represented by each station. The spawning area (SA) is delimited with the outer zero sardine egg stations but it can contain some inner zero stations embedded. The spawning area is computed as the sum of the area represented by the stations within the spawning area. The daily egg production per area unit (P0) was estimated together with the daily mortality rate (Z) from a general exponential decay mortality model of the form: P i, j = P0 exp( Z ai, j ) (2) where Pi,j and ai,j denote respectively the number of eggs per unit area in cohort j in station i and their corresponding mean age. Let the density of eggs in cohort j in station i, Pi,j, be the ratio between the number of eggs Ni,j and the effective sea area sampled Ri (i.e. P i,j = N i,j / R i ). The model was written as a generalised linear model (GLM, McCullagh and Nelder, 1989; ICES, 2004) with logarithmic link function: log E [ N ] = log( R ) + log P Z a, ( i, j ) i ( 0 ) i j (3) where the number of eggs of daily cohort j in station i (N ij ) was assumed to follow a negative binomial distribution. The logarithm of the effective sea surface area sampled (log(r i )) was an offset accounting for differences in the sea surface area sampled and the logarithm of the daily egg production log(p 0 ) and the daily mortality Z rates were the parameters to be estimated. The eggs collected at sea and sorted into morphological stages had to be transformed into daily cohort frequencies and their mean age calculated in order to fit the above model. For that purpose the Bayesian ageing method described in ICES (2004), Stratoudakis et al., (2006) and Bernal et al., (2011) was used. This ageing method is based on the probability density function (pdf) of the age of an egg f(age stage, temp), which is constructed as: (4),, f ( age stage, temp) f ( stage age, temp) f ( age) The first term f(stage age, temp) is the pdf of stages given age and temperature. It represents the temperature dependent egg development, which is obtained by fitting a multinomial model like extended continuation ratio models (Agresti, 1990) to data.
108 640 ICES WGHANSA REPORT 2013 from temperature dependent incubation experiments (Ibaibarriaga et al., 2007, Bernal et al., 2008). The second term is the prior distribution of age. A priori the probability of an egg that was sampled at time τ of having an age is the product of the probability of an egg being spawned at time τ - age and the probability of that egg surviving since then (exp( -Z age)): (5) f ( age) f ( spawn = τ age) exp( Z age). The pdf of spawning time f(spawn=τ - age) allows refining the ageing process for species with spawning synchronicity that spawn at approximately certain times of the day (Lo, 1985a; Bernal et al., 2001). Sardine spawning time was assumed to be normally distributed with mean at 21:00h GMT and standard deviation of 3 (ICES, 2004). The peak of the spawning time was also used to define the age limits for each daily cohort (spawning time peak plus and minus 15 hours). Details on how the number of eggs in each cohort and the corresponding mean age are computed from the pdf of age are given in Bernal et al. (2011). The incubation temperature considered was the one obtained from the CTD at 10 m in the way up. Given that this ageing process depends on the daily mortality rate which is unknown, an iterative algorithm in which the ageing and the model fitting are repeated until convergence of the Z estimates was used (Bernal et al., 2001; ICES, 2004; Stratoudakis et al., 2006). The procedure is as follows: Step 1. Assume an initial mortality rate value; Step 2. Using the current estimates of mortality calculate the daily cohort frequencies and their mean age; Step 3. Fit the GLM and estimate the daily egg production and mortality rates. Update the mortality rate estimate; Step 4. Repeat steps (1) (3) until the estimate of mortality converged (i.e. the difference between the old and updated mortality estimates was smaller than ). Incomplete cohorts, either because the bulk of spawning for the day was not over at the time of sampling, or because the cohort was so old that its constituent eggs had started to hatch in substantial numbers, were removed in order to avoid any possible bias. At each station, younger cohorts were dropped if they were sampled before twice the spawning peak width after the spawning peak and older cohorts were dropped if their mean age plus twice the spawning peak width was over the critical age at which less than 99% eggs were expected to be still unhatched. Once the final model estimates were obtained the coefficient of variation of P0 was given by the standard error of the model intercept (log(p0)) (Seber, 1982) and the coefficient of variation of Z was obtained directly from the model estimates. The analysis was conducted in R ( The MASS library was used for fitting the GLM with negative binomial distribution and the egg library ( for the ageing and the iterative algorithm. B3.2.5 Adult parameters, daily fecundity and SSB estimates In 2008 and 2011 adult samples were collected within the same day as the egg sampling. These samples are used to obtain adult parameters to estimate the daily fecundity, i.e. batch fecundity, spawning fraction, average female weight and sex ratio.
109 ICES WGHANSA REPORT These adult parameters are estimates as follows: Sex Ratio (R): It is calculate as the average sample ratio between the average female weight and the sum of the average female and male weights of the anchovies in each of the samples. Total weight of hydrated females is corrected for the increase of weight due to hydration. Data on gonad-free-weight (Wgf) and correspondent total weight (W) of nonhydrated females is fitted by a linear regression model. Gonad-free-weight of hydrated anchovies is then transformed to total weight by applying the following equation: W = a + b W gf For the Batch fecundity (F) estimates i.e. number of eggs laid per batch and female, the hydrated egg method was followed (Hunter et al, 1985). The number of hydrated oocytes in gonads of a set of hydrated females is counted. This number is deduced from a sub-sampling of the hydrated ovary: Three pieces of approximately 50 mg are removed from different parts of each ovary, weighted with precision of 0.1 mg and the number of hydrated oocytes counted. Sanz and Uriarte (1989) showed that three tissue samples per ovary are adequate to get good precision in the final batch fecundity estimate and the location of sub-samples within the ovary do not affect it. Finally the number of hydrated oocytes in the subsample is raised to the total gonad of the female according to the ratio between the weights of the gonad and the weight subsampled. A linear regression between female weight and batch fecundity is established for the subset of hydrated females and used to calculate the batch fecundity of all mature females. The average of the batch fecundity estimates for the females of each sample as derived from the gonad free weight eggs per batch relationship is then used as the sample estimate of batch fecundity. Moreover, an analysis is conducted to verify if there are differences in the batch fecundity if strata are defined to estimate SSB. To estimate Spawning Frequency (S), i.e. the proportion of females spawning per day, was estimated from the incidence of postovulatory follicles 1 and 2 day old in the gonads of mature females (Hunter and Macewicz, 1985) (the number of females with Day-0 POF was corrected by the average number of females with Day-1 or Day- 2 POF).
110 642 ICES WGHANSA REPORT 2013 Mean and variance of the adult parameters are estimated following equations for cluster sampling (as suggested by Picquelle and Stauffer, 1985): Equation 3 Equation 4 Where, n Y = n i=1 n i=1 M i M 2 M i ( yi - Y) i=1 Var(Y) = 2 M n (n - 1) y i i 2 Yi is an estimate of whatever adult parameter from sample i and Mi is the size of the cluster corresponding to sample i. occasionally a station produced a very small catch, resulting in a small sub-sample size. To reflect the actual size of the station and its lower reliability, small samples were given less weight in the estimate. For the estimation of W, F and S, a weighting factor was used, which equalled to 1 when the number of mature females in station i (Mi) was 20 or greater and it equalled to Mi/20 otherwise. In the case of R when the total weight of the sample was less than 800 g then the weighting factor was equal to total weight of the sample divided by 800 g, otherwise it was set equal to 1. In summary for the estimation of the parameters of the Daily Fecundity we are using a threshold-weighting factor (TWF) under the assumption of homogeneous fecundity parameters within each stratum. The Spawning Stock Biomass is estimates as the ratio between the total egg production (Ptot) and Daily Fecundity (DF).
111 ICES WGHANSA REPORT B3.2.6 Egg abundance estimates Table B Sardine egg abundances in the Bay of Biscay from 1999 to Ab.tot.Sp is the sum along all the stations of the sardine eggs in each station multiplied by the area each station represents. Pos.area is the positive area for sardine; tot area is the total area surveyed; %pos area is the percentage the positive area represents in relation to the total area and Ptot is the total egg production. Year Ab.tot_Sp pos area tot area % pos area Ab.tot/pos.area Ptot(egg/day) E+12 26,679 59, E E E+12 40,139 52, E E+11 14,547 51, E E+12 39,112 50, E E E+12 22,878 47, E E+12 37,289 49, E E+13 38,979 50, E E+12 23,376 45, E E+12 16,710 45, E E+12 20,235 46, E E E+12 34,746 60, E E+13 36,361 61, E E+12 22,851 98, E+08 available E+12 20,054 80, E E E E E E E E E E E E E E Figure B Total sardine egg abundance estimates from 1999 to 2012 in the Bay of Biscay.


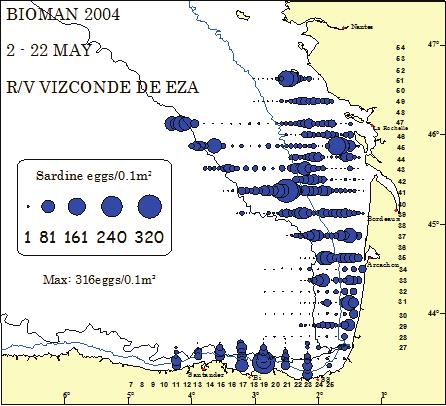
112 644 ICES WGHANSA REPORT 2013 B Historical series DEPM and acoustic surveys


113 ICES WGHANSA REPORT BIOMAN May R/V Investigador 48 BIOMAN May R/V Ramón Margalef Nantes Nantes Sardine eggs/m² La Rochelle Bordeaux Sardine eggs(eggs/0.1m^2) La Rochelle Bordeaux Arcachon Arcachon Santander Bi SS Santander Bi SS
114 646 ICES WGHANSA REPORT 2013 B. 3.3 Sardine Daily Egg Production Method (SAREVA Survey) in the inner of the Bay of Biscay B Introduction The Daily Egg Production Method (DEPM) is a well-established methodology to assess the spawning biomass (SSB) of fish species with indeterminate fecundity. The Sardine DEPM is based on the equation (Picquelle and Stauffer, 1985; Lasker, 1985): SSB = + Area * P0* W F * S * R Where P0: Daily egg production (eggs/m 2 /day) Area + : Spawning area W: Average weight of mature females in grams F: Batch fecundity, number of eggs spawned per mature female per batch S: Spawning fraction, fraction of mature females spawning per day R: Sex Ratio is the fraction of the mature population that are females by weight. The Daily Egg Production Method (DEPM) for sardine has been applied by Instituto Español de Oceanografía (IEO) to estimate the spawning stock biomass of the North Atlanto-Iberian sardine stock since 1988 (García et al., 1992) and then repeated in 1990, 1997, 1999, 2002, 2005, 2008 and From 2000 onwards the surveys have been planned and conducted within the framework of ICES, on a triennial basis. Spring surveys for the application of the DEPM, consisting of ichthyoplankton, adults and hydrographic sampling, and since 1997 the sampling area was extended in order to reach the 45 degrees latitude North, covering the region from the northwestern (border Minho River), north Iberian Peninsula (north Spanish Atlantic and Cantabrian waters, ICES Division IXa North and VIIIc) and the inner part of the Bay of Biscay (from 42 ºN to 45 N, ICES Division VIIIb). This section provides a description of the sampling, laboratory analysis and estimation procedures used to obtain the sardine spawning stock biomass estimate for the application of DEPM conducted by IEO from 1997 to present in the inner of the Bay of Biscay (ICES Division VIIIb). Since 2002 extra effort was put in place in order to standardize methodologies for surveying, laboratorial and data analyses. These objectives were possible due to methodological developments and effective coordination undertaken first by the SGSBSA (ICES ) and later by the WGACEGG (Stratoudakis et al., 2004; Stratoudakis et al., 2006; ICES, 2009; ICES, 2010; ICES, 2011). Estimations for area delimitation (surveyed & spawning), egg ageing, mortality and model fitting for egg production (P0) are presented. Results from adults fishing sampling are showed and parameters from the mature fraction of the population (mean females weight, sex ratio, batch fecundity and spawning fraction) are calculated. Estimates were based on procedures and software adapted and developed during the WKRESTIM 2009 and modifications carried out subsequently for the revision of the sardine DEPM historical series ( ) in Divisions IXa and VIIIc. Sardine DEPM estimates in the inner of the Bay of Biscay (the inner part of Divisions VIIIb until 45 N) from 1997 until 2011, were presented in ICES Working Group on Acoustic and Egg Surveys for Sardine and Anchovy in ICES Areas VIII and IX
115 ICES WGHANSA REPORT (WGACEGG) last November of 2012, in order to be considered as a contribution for the ICES WKPELA 2013 meeting for sardine in Subarea VII and Divisions VIIIa, b, d. B Methodology B Surveying From 1997, six DEPM surveys were carried out by IEO (1997, 1999, 2002, 2005, 2008 and 2011). The Spanish surveys were undertaken using two vessels, RV Cornide de Saavedra for plankton sampling mainly and RV Thalassa to carry out the fishing hauls (in 2008 and 2011 some fishing hauls were carried out on RV Cornide de Saavedra). The surveys were designed to obtain en adequate spatial and temporal coverage during the spawning peak of sardine in the area. Due to the bad weather, in 2005 was not possible to complete the plankton sampling coverage, so no data for this year is presented in this work. Plankton sampling The main egg sampler for the DEPM is the PairoVET net that collects eggs through the water column at point stations. The PairoVET sampler (=double CalVET) includes two nets (Ø 25cm) with 150 µm mesh size; sampling covered the water column from bottom, or 100 m (beyond the 100 isobath) depth, to the surface. Vertical plankton hauls were carried out following a pre-defined grid (Figure ) of sampling stations along transects perpendicular to the coast and spaced 8 miles from 2005 onwards. The inshore limit of the transects is determined by bottom depth (as close to shore as possible) while the offshore extension was decided adaptively, based on the presence of eggs and covering the extension of the platform to the 200 m isobath. From 2002, the Continuous Underway Fish Egg Sampler (CUFES) was used as an auxiliary egg sampler, helping in defining the offshore extension of the transects and to modify adaptively the intensity of CalVET sampling. The outer limit of a transect was reached when two consecutive CUFES samples were negative beyond the 200 m depth. From 1997 to 2005, a CTD (Sea Bird-25) profile (Temperature and Salinity) was carried out in each CalVET station. From 2008 to 2011 the Sea Bird-25 was used in each transect head and in alternate stations along the transects, meanwhile a CTD (Sea Bird-37) was coupled to the CalVET sampler. General Oceanics Flowmeters were used to record the towing length and estimate the sampled water volume (assuming a filtration efficiency of 100%). After hauling, nets are washed from the outside with seawater under pressure and plankton samples from the two nets are preserved in formalin at 4% in distilled water and the two samples from each net stored in separate containers. Samples for one net are then sorted, and sardine, anchovy and other eggs are identified and counted. The total numbers of eggs from both plankton samplers, CalVET and CUFES, were counted onboard in order to obtain a preliminary data of sardine egg abundance and distribution.
.")
116 648 ICES WGHANSA REPORT 2013 Figure Sardine DEPM IEO surveys in the inner of the Bay of Biscay. Sardine egg distribution (eggs/m 2 from PairoVET sampler) and SST (ºC) by year. Adult fish surveying Fishing hauls were conducted by pelagic trawling following sardine schools detection by the echosounder (for RV Thalassa). The number of samples and its spatial distribution was organized to ensure good and homogeneous coverage of the survey area (Figure ) in order to obtain a representation of the sardine population. Onboard the RV, and for each haul, a minimum of 60 sardines were randomly selected and biologically sampled. These could also be complemented by additional fish in order to achieve a minimum of 30 females per haul for histology, and/or to obtain extra hydrated females for the fecundity estimations. The biological sampling was always carried out in fresh material, and ovaries were immediately collected and preserved in a formaldehyde buffered solution (4% diluted in distilled water) for posterior histological processing and analysis at the laboratory. Moreover, otoliths were extracted on board to obtain the age composition per sample in the laboratory.
ICES Working Group on the assessment of Mackerel, Horse Mackerel, Sardine and Anchovy. Vigo, 5-15 September 2005 Working Document
 ICES Working Group on the assessment of Mackerel, Horse Mackerel, Sardine and Anchovy. Vigo, 5-15 September 25 Working Document Direct assessment of anchovy by the PELGAS5 acoustic survey Jacques Massé
Anchovy (Engraulis encrasicolus) in Subarea 8 (Bay of Biscay)
 in Subarea 8 (Bay of Biscay)") ICES Advice on fishing opportunities, catch, and effort Bay of Biscay and the Iberian Coast and Oceanic Northeast Atlantic Ecoregions Published 8 December 2017 DOI: 10.17895/ices.pub.3707 Anchovy (Engraulis
ICES Advice on fishing opportunities, catch, and effort Bay of Biscay and the Iberian Coast and Oceanic Northeast Atlantic Ecoregions Published 8 December 2017 DOI: 10.17895/ices.pub.3707 Anchovy (Engraulis
Direct assessment of small pelagic fish by the PELGAS17 acoustic survey
 Working Document for WGHANSA (Bilbao, 24-29 June.2017) Direct assessment of small pelagic fish by the PELGAS17 acoustic survey Erwan Duhamel 1, Mathieu Doray 2, Martin Huret 1, Florence Sanchez 5, Patrick
Direct assessment of small pelagic fish by the PELGAS13 acoustic survey
 Working Document for WGHANSA (Bilbao, June.213) Direct assessment of small pelagic fish by the PELGAS13 acoustic survey Erwan Duhamel 1, Mathieu Doray 2, Martin Huret 1, Ghislain Doremus 4 and Alexis Pengrech
1 MATERIAL AND METHOD
 ICES Working Group on the assessment of Mackerel, Horse Mackerel, Sardine and Anchovy. Galway, 5-14 September 26 Working Document The French sardine fishery Erwan Duhamel 1 (1) IFREMER, lab. Fisheries
Advice June 2012
 2.4.1 Advice June 212 ECOREGION STOCK Iceland and East Greenland Beaked redfish (Sebastes mentella) in Subareas V, XII, and XIV and NAFO Subareas 1+2 (Deep pelagic stock > 5 m) Advice for 213 The advice
3.4.3 Advice June Barents Sea and Norwegian Sea Cod in Subareas I and II (Norwegian coastal waters cod)
") 3.4.3 Advice June 2013 ECOREGION STOCK Barents Sea and Norwegian Sea Cod in Subareas I and II (Norwegian coastal waters cod) Advice for 2014 ICES advises on the basis of the Norwegian rebuilding plan,
3.4.3 Advice June 2013 ECOREGION STOCK Barents Sea and Norwegian Sea Cod in Subareas I and II (Norwegian coastal waters cod) Advice for 2014 ICES advises on the basis of the Norwegian rebuilding plan,
Red Sea bream in Subareas VI, VII and VIII
 Stock Annex; Red Sea bream in Subareas VI, VII and VIII Stock specific documentation of standard assessment procedures used by ICES. Stock sbr-678_sa Working Group Red Sea bream (Pagellus bogaraveo) in
Boarfish (Capros aper) in subareas 6 8 (Celtic Seas, English Channel, and Bay of Biscay)
 in subareas 6 8 (Celtic Seas, English Channel, and Bay of Biscay)") ICES Advice on fishing opportunities, catch, and effort Bay of Biscay and the Iberian Coast, Celtic Seas, Published 29 September 2017 Greater North Sea, and Oceanic Northeast Atlantic Ecoregions DOI: 10.17895/ices.pub.3025
ICES Advice on fishing opportunities, catch, and effort Bay of Biscay and the Iberian Coast, Celtic Seas, Published 29 September 2017 Greater North Sea, and Oceanic Northeast Atlantic Ecoregions DOI: 10.17895/ices.pub.3025
Horse mackerel (Trachurus trachurus) in Division 9.a (Atlantic Iberian waters)
 in Division 9.a (Atlantic Iberian waters)") Bay of Biscay and the Iberian Coast Ecoregion Published 13 July 2018 https://doi.org/10.17895/ices.pub.4496 Horse mackerel (Trachurus trachurus) in Division 9.a (Atlantic Iberian waters) ICES advice on
Bay of Biscay and the Iberian Coast Ecoregion Published 13 July 2018 https://doi.org/10.17895/ices.pub.4496 Horse mackerel (Trachurus trachurus) in Division 9.a (Atlantic Iberian waters) ICES advice on
2.3.1 Advice May Capelin in Subareas V and XIV and Division IIa west of 5 W (Iceland East Greenland Jan Mayen area).
.") 2.3.1 Advice May 2014 ECOREGION Iceland and East Greenland STOCK Capelin in Subareas V and XIV and Division IIa west of 5 W (Iceland East Greenland Jan Mayen area) Advice for 2014/2015 ICES advises on
2.3.1 Advice May 2014 ECOREGION Iceland and East Greenland STOCK Capelin in Subareas V and XIV and Division IIa west of 5 W (Iceland East Greenland Jan Mayen area) Advice for 2014/2015 ICES advises on
Case study results North Agean purse seine, Kavala, Greece ID
 Case study results 2.3 - North Agean purse seine, Kavala, Greece Contact person: Antigoni Foutsi, WWF, a.foutsi@wwf.gr http://minouw-project.eu/ ID 634495 1 SUMMARY A comparison of fisheries discards in
Stock Annex: template
 Stock Annex: template Stock Annex Stock specific documentation of standard assessment procedures used by ICES. Stock Working Group: Thornback ray (Raja Clavata) in the Bay of Biscay VIIIa-c WGEF Date:
Spurdog (Squalus acanthias) in the Northeast Atlantic
 in the Northeast Atlantic") ICES Advice on fishing opportunities, catch, and effort Northeast Atlantic Published 11 October 2016 9.3.17 Spurdog (Squalus acanthias) in the Northeast Atlantic ICES stock advice ICES advises that when
ICES Advice on fishing opportunities, catch, and effort Northeast Atlantic Published 11 October 2016 9.3.17 Spurdog (Squalus acanthias) in the Northeast Atlantic ICES stock advice ICES advises that when
Blue whiting (Micromesistius poutassou) in subareas 1 9, 12, and 14 (Northeast Atlantic and adjacent waters)
 in subareas 1 9, 12, and 14 (Northeast Atlantic and adjacent waters)") ICES Advice on fishing opportunities, catch, and effort Ecoregions of the Northeast Atlantic and Arctic Ocean Published 29 September 2017 DOI: 10.17895/ices.pub.3030 Blue whiting (Micromesistius poutassou)
ICES Advice on fishing opportunities, catch, and effort Ecoregions of the Northeast Atlantic and Arctic Ocean Published 29 September 2017 DOI: 10.17895/ices.pub.3030 Blue whiting (Micromesistius poutassou)
SC-02-JM-12. Report of the 5 th workshop on diagnosis of the status of the South Pacific Jack mackerel fishery in Peru SNP Scientific Committee
 2 nd Meeting of the Scientific Committee Honolulu, Hawaii, USA 1-7 October 2014 SC-02-JM-12 Report of the 5 th workshop on diagnosis of the status of the South Pacific Jack mackerel fishery in Peru SNP
The fishery for jack mackerel in the Eastern Central Pacific by European trawlers in 2008 and 2009
 Eighth International Meeting: SWG: Jack Mackerel Sub-Group SP-08-SWG-JM-01 The fishery for jack mackerel in the Eastern Central Pacific by European trawlers in 2008 and 2009 Ad Corten Corten Marine Research
ICES advises that when the MSY approach is applied, catches in 2019 should be no more than tonnes.
 ICES Advice on fishing opportunities, catch, and effort Greater Northern Sea, Celtic Seas, and Bay of Biscay and Iberian Coast Published 29 June 2018 ecoregions https://doi.org/10.17895/ices.pub.4463b
Stock Annex: Sprat (Sprattus sprattus) in Subarea 6 and divisions 7.a c and 7.f k (West of Scotland, southern Celtic Seas)
 in Subarea 6 and divisions 7.a c and 7.f k (West of Scotland, southern Celtic Seas)") ICES Stock Annex 1 Stock Annex: Sprat (Sprattus sprattus) in Subarea 6 and divisions 7.a c and 7.f k (West of Scotland, southern Celtic Seas) Stock specific documentation of standard assessment procedures
ICES Stock Annex 1 Stock Annex: Sprat (Sprattus sprattus) in Subarea 6 and divisions 7.a c and 7.f k (West of Scotland, southern Celtic Seas) Stock specific documentation of standard assessment procedures
Whiting (Merlangius merlangus) in divisions 7.b c and 7.e k (southern Celtic Seas and western English Channel)
 in divisions 7.b c and 7.e k (southern Celtic Seas and western English Channel)") ICES Advice on fishing opportunities, catch, and effort Celtic Seas, Greater North Sea, and Oceanic Northeast Atlantic ecoregions Published 30 June 2017 Version 2: 07 July 2017 DOI: 10.17895/ices.pub.3269
ICES Advice on fishing opportunities, catch, and effort Celtic Seas, Greater North Sea, and Oceanic Northeast Atlantic ecoregions Published 30 June 2017 Version 2: 07 July 2017 DOI: 10.17895/ices.pub.3269
Pelagic fishery for Sebastes mentella in the Irminger Sea
 3.2.6.d Pelagic fishery for Sebastes mentella in the Irminger Sea The stock structure of deep-sea redfish S. mentella in Sub-area XII, Division Va and Sub-area XIV and NAFO Div. 1F remains generally uncertain.
Sandeel (Ammodytes spp.) in Divisions IIIa, IVa, and IVb, SA 3 (Skagerrak and Kattegat, North and Central North Sea)
 in Divisions IIIa, IVa, and IVb, SA 3 (Skagerrak and Kattegat, North and Central North Sea)") ICES Advice on fishing opportunities, catch and effort Greater North Sea Ecoregion Published 23 February 2015 6.3.39 Sandeel (Ammodytes spp.) in Divisions IIIa, IVa, and IVb, SA 3 (Skagerrak and Kattegat,
ICES Advice on fishing opportunities, catch and effort Greater North Sea Ecoregion Published 23 February 2015 6.3.39 Sandeel (Ammodytes spp.) in Divisions IIIa, IVa, and IVb, SA 3 (Skagerrak and Kattegat,
Sandeel (Ammodytes spp.) in Divisions 3a, 4a, and 4b, SA 3 (Skagerrak and Kattegat, North and Central North Sea)
 in Divisions 3a, 4a, and 4b, SA 3 (Skagerrak and Kattegat, North and Central North Sea)") ICES Advice on fishing opportunities, catch and effort Greater North Sea Ecoregion Published 22 February 2016 6.3.39 Sandeel (Ammodytes spp.) in Divisions 3a, 4a, and 4b, SA 3 (Skagerrak and Kattegat,
ICES Advice on fishing opportunities, catch and effort Greater North Sea Ecoregion Published 22 February 2016 6.3.39 Sandeel (Ammodytes spp.) in Divisions 3a, 4a, and 4b, SA 3 (Skagerrak and Kattegat,
ICES Advice on fishing opportunities, catch, and effort Celtic Seas and Greater North Sea Ecoregions Published 24 October 2017
 ICES Advice on fishing opportunities, catch, and effort Celtic Seas and Greater North Sea Ecoregions Published 24 October 2017 DOI: 10.17895/ices.pub.3334 Seabass (Dicentrarchus labrax) in divisions 4.b
Assessment of the Japanese sardine (Sardinops melanostictus) stock in the northwestern Pacific for Japanese management system
 stock in the northwestern Pacific for Japanese management system") Assessment of the Japanese sardine (Sardinops melanostictus) stock in the northwestern Pacific for Japanese management system Hiroshi NISHIDA, Masayuki NOTO, Atsushi KAWABATA and Chikako WATANABE National
Assessment of the Japanese sardine (Sardinops melanostictus) stock in the northwestern Pacific for Japanese management system Hiroshi NISHIDA, Masayuki NOTO, Atsushi KAWABATA and Chikako WATANABE National
ICES advises that when the MSY approach is applied, catches in 2019 should be no more than tonnes.
 Advice on fishing opportunities, catch, and effort Celtic Seas, Greater North Sea, and Oceanic Northeast Atlantic ecoregions Published 29 June 2018 Version 2: 4 September 2018 https://doi.org/10.17895/ices.pub.4487
Haddock (Melanogrammus aeglefinus) in divisions 7.b k (southern Celtic Seas and English Channel)
 in divisions 7.b k (southern Celtic Seas and English Channel)") ICES Advice on fishing opportunities, catch, and effort Celtic Seas, Greater North Sea, and Oceanic Northeast Atlantic ecoregions Published 29 June 2018 https://doi.org/10.17895/ices.pub.4453 Haddock (Melanogrammus
ICES Advice on fishing opportunities, catch, and effort Celtic Seas, Greater North Sea, and Oceanic Northeast Atlantic ecoregions Published 29 June 2018 https://doi.org/10.17895/ices.pub.4453 Haddock (Melanogrammus
6.3.8 Advice May 2014 Version 2, ECOREGION North Sea STOCK Herring in Division IIIa and Subdivisions (western Baltic spring spawners)
") 6.3.8 Advice May 2014 Version 2, 04-07-2014 ECOREGION North Sea STOCK Herring in Division IIIa and Subdivisions 22 24 (western Baltic spring spawners) Advice for 2015 ICES advises on the basis of the MSY
6.3.8 Advice May 2014 Version 2, 04-07-2014 ECOREGION North Sea STOCK Herring in Division IIIa and Subdivisions 22 24 (western Baltic spring spawners) Advice for 2015 ICES advises on the basis of the MSY
ICES Advice on fishing opportunities, catch, and effort Celtic Seas and Greater North Sea ecoregions Published 30 June 2016
 ICES Advice on fishing opportunities, catch, and effort Celtic Seas and Greater North Sea ecoregions Published 30 June 2016 5.3.57 Sea bass (Dicentrarchus labrax) in divisions 4.b c, 7.a, and 7.d h (central
ICES advice on fishing opportunities. ICES advises that when the MSY approach is applied, total removals in 2018 should be no more than 880 tonnes.
 ICES Advice on fishing opportunities, catch, and effort Celtic Seas and Greater North Sea ecoregions bss.27.4bc7ad-h Published 29 June 2018 Version 2: 2 July 2018 https://doi.org/10.17895/ices.pub.4472
Blue whiting (Micromesistius poutassou) in subareas 1 9, 12, and 14 (Northeast Atlantic and adjacent waters)
 in subareas 1 9, 12, and 14 (Northeast Atlantic and adjacent waters)") ICES Advice on fishing opportunities, catch, and effort Ecoregions of the Northeast Atlantic and Arctic Ocean Published 28 September 2018 nea https://doi.org/10.17895/ices.pub.4536 Blue whiting (Micromesistius
ICES Advice on fishing opportunities, catch, and effort Ecoregions of the Northeast Atlantic and Arctic Ocean Published 28 September 2018 nea https://doi.org/10.17895/ices.pub.4536 Blue whiting (Micromesistius
9.4.5 Advice September Widely distributed and migratory stocks Herring in the Northeast Atlantic (Norwegian spring-spawning herring)
") 9.4.5 Advice September 212 ECOREGION STOCK Widely distributed and migratory stocks Herring in the Northeast Atlantic (Norwegian spring-spawning herring) Advice for 213 ICES advises on the basis of the
9.4.5 Advice September 212 ECOREGION STOCK Widely distributed and migratory stocks Herring in the Northeast Atlantic (Norwegian spring-spawning herring) Advice for 213 ICES advises on the basis of the
A REVIEW AND EVALUATION OF NATURAL MORTALITY FOR THE ASSESSMENT AND MANAGEMENT OF YELLOWFIN TUNA IN THE EASTERN PACIFIC OCEAN
 A REVIEW AND EVALUATION OF NATURAL MORTALITY FOR THE ASSESSMENT AND MANAGEMENT OF YELLOWFIN TUNA IN THE EASTERN PACIFIC OCEAN Mark N. Maunder and Alex Aires-da-Silva Outline YFT history Methods to estimate
Advice June 2014
 5.3.23 Advice June 2014 ECOREGION STOCK Celtic Sea and West of Scotland Plaice in Division VIIa (Irish Sea) Advice for 2015 Based on ICES approach to data-limited stocks, ICES advises that catches should
Advice May Herring in Subdivisions and 32 (excluding Gulf of Riga herring)
") 8.3.10 Advice May 2014 ECOREGION STOCK Baltic Sea Herring in Subdivisions 25 29 and 32 (excluding Gulf of Riga herring) Advice for 2015 ICES advises on the basis of the MSY approach that catches in 2015
8.3.10 Advice May 2014 ECOREGION STOCK Baltic Sea Herring in Subdivisions 25 29 and 32 (excluding Gulf of Riga herring) Advice for 2015 ICES advises on the basis of the MSY approach that catches in 2015
A Combined Recruitment Index for Demersal Juvenile Cod in NAFO Divisions 3K and 3L
 NAFO Sci. Coun. Studies, 29: 23 29 A Combined Recruitment Index for Demersal Juvenile Cod in NAFO Divisions 3K and 3L David C. Schneider Ocean Sciences Centre, Memorial University St. John's, Newfoundland,
Report of the Working Group on Widely Distributed
 ICES WGWIDE REPORT 2017 ICES ADVISORY COMMITTEE ICES CM 2017/ACOM:23 Report of the Working Group on Widely Distributed Stocks (WGWIDE) 30 August -5 September 2017 ICES Headquarters, Copenhagen, Denmark
Fishing down the marine food webs in the Hellenic seas
 Fishing down the marine food webs in the Hellenic seas Stergiou K.I. and M. Koulouris Department of Zoology, Laboratory of Ichthyology, Aristotle University of Thessaloniki, Hellas INTRODUCTION Fishing
Hydroacoustic surveys of Otsego Lake s pelagic fish community,
 Hydroacoustic surveys of Otsego Lake s pelagic fish community, 2010 1 Holly A. Waterfield 2 and Mark Cornwell 3 INTRODUCTION Hydroacoustic surveys were conducted in May and November 2010 to estimate pelagic
ASMFC Stock Assessment Overview: Red Drum
 Introduction This document presents a summary of the 217 stock assessments for red drum. These assessments were initially conducted through the Southeast Data, Assessment and Review (SEDAR) process using
Advice October 2013
 5.4.21.3 Advice October 213 ECOREGION Celtic Sea and West of Scotland STOCK Nephrops on Porcupine Bank (FU 16) Advice for 214 ICES advises on the basis of the MSY approach that catches from FU 16 in 214
ICCAT Secretariat. (10 October 2017)
") ICCAT Secretariat (10 October 2017) Bluefin tuna: Background information Managed by International Commission for the Conservation of Atlantic Tunas (ICCAT): Two stocks (mixing occurring, but extent not
ICCAT Secretariat (10 October 2017) Bluefin tuna: Background information Managed by International Commission for the Conservation of Atlantic Tunas (ICCAT): Two stocks (mixing occurring, but extent not
Undulate ray (Raja undulata) in divisions 8.a b (northern and central Bay of Biscay)
 in divisions 8.a b (northern and central Bay of Biscay)") ICES Advice on fishing opportunities, catch, and effort Bay of Biscay and the Iberian Coast Ecoregion Published July 13 2018 https://doi.org/10.17895/ices.pub.4502 Undulate ray (Raja undulata) in divisions
ICES Advice on fishing opportunities, catch, and effort Bay of Biscay and the Iberian Coast Ecoregion Published July 13 2018 https://doi.org/10.17895/ices.pub.4502 Undulate ray (Raja undulata) in divisions
Plaice (Pleuronectes platessa) in Division 7.e (western English Channel)
 in Division 7.e (western English Channel)") Celtic Seas and Greater North Sea ecoregions Published 30 June 2016 Version 2: 15 May 2017 5.3.51 Plaice (Pleuronectes platessa) in Division 7.e (western English Channel) ICES stock advice ICES advises
Celtic Seas and Greater North Sea ecoregions Published 30 June 2016 Version 2: 15 May 2017 5.3.51 Plaice (Pleuronectes platessa) in Division 7.e (western English Channel) ICES stock advice ICES advises
White anglerfish (Lophius piscatorius) in divisions 8.c and 9.a (Cantabrian Sea and Atlantic Iberian waters)
 in divisions 8.c and 9.a (Cantabrian Sea and Atlantic Iberian waters)") ICES Advice on fishing opportunities, catch, and effort Bay of Biscay and the Iberian Coast Ecoregion Published 29 June 2018 https://doi.org/10.17895/ices.pub.4459 White anglerfish (Lophius piscatorius)
ICES Advice on fishing opportunities, catch, and effort Bay of Biscay and the Iberian Coast Ecoregion Published 29 June 2018 https://doi.org/10.17895/ices.pub.4459 White anglerfish (Lophius piscatorius)
Summary of current information available on Coastal Pelagic Species with emphasis on Northern Anchovy
 Agenda Item H.3.a Supplemental SWFSC PowerPoint (Electronic Only) November 2015 Summary of current information available on Coastal Pelagic Species with emphasis on Northern Anchovy Gerard DiNardo, Dale
Hydroacoustic survey of Otsego Lake, 2004
 Hydroacoustic survey of Otsego Lake, 2004 Thomas E. Brooking 1 Mark D. Cornwell 2 INTRODUCTION Fishery managers must often rely on uncertain information regarding abundance and distribution of offshore
Fine-Scale Survey of Right and Humpback Whale Prey Abundance and Distribution
 DISTRIBUTION STATEMENT A. Approved for public release; distribution is unlimited. Fine-Scale Survey of Right and Humpback Whale Prey Abundance and Distribution Joseph D. Warren School of Marine and Atmospheric
Mackerel (Scomber scombrus) in subareas 1 8 and 14, and in Division 9.a (the Northeast Atlantic and adjacent waters)
 in subareas 1 8 and 14, and in Division 9.a (the Northeast Atlantic and adjacent waters)") ICES Advice on fishing opportunities, catch, and effort Ecoregions in the Northeast Atlantic and Arctic Ocean Published 29 September 2017 DOI: 10.17895/ices.pub.3023 Mackerel (Scomber scombrus) in subareas
ICES Advice on fishing opportunities, catch, and effort Ecoregions in the Northeast Atlantic and Arctic Ocean Published 29 September 2017 DOI: 10.17895/ices.pub.3023 Mackerel (Scomber scombrus) in subareas
Fishing mortality in relation to highest yield. Fishing mortality in relation to agreed target
 3.4 Stock summaries 3.4. Northeast Arctic cod State of the stock Spawning biomass in relation to precautionary limits Full reproductive capacity Fishing mortality in relation to precautionary limits/management
Preliminary results of SEPODYM application to albacore. in the Pacific Ocean. Patrick Lehodey
 SCTB15 Working Paper ALB-6 Preliminary results of SEPODYM application to albacore in the Pacific Ocean Patrick Lehodey Oceanic Fisheries Programme Secretariat of the Pacific Community Noumea, New Caledonia
Northeast Atlantic Mackerel, Handlines
 Northeast Atlantic Mackerel, Handlines Northeast Atlantic Mackerel, Handlines Content last updated 3rd Apr 2017 Stock: Mackerel (Scomber scombrus) in subareas 1 7 and 14, and in divisions 8.a e and 9.a
Advice June Sole in Division IIIa and Subdivisions (Skagerrak, Kattegat, and the Belts)
") 6.3.26 Advice June 2014 ECOREGION STOCK North Sea Sole in Division IIIa and Subdivisions 22 24 (Skagerrak, Kattegat, and the Belts) Advice for 2015 ICES advises on the basis of the MSY approach that catches
6.3.26 Advice June 2014 ECOREGION STOCK North Sea Sole in Division IIIa and Subdivisions 22 24 (Skagerrak, Kattegat, and the Belts) Advice for 2015 ICES advises on the basis of the MSY approach that catches
Advice June Capelin in Subareas V and XIV and Division IIa west of 5 W (Iceland East Greenland Jan Mayen area).
.") 2.4.12 Advice June 2012 ECOREGION Iceland and East Greenland STOCK Capelin in Subareas V and XIV and Division IIa west of 5 W (Iceland East Greenland Jan Mayen area) Advice for 2013 ICES advises on the
2.4.12 Advice June 2012 ECOREGION Iceland and East Greenland STOCK Capelin in Subareas V and XIV and Division IIa west of 5 W (Iceland East Greenland Jan Mayen area) Advice for 2013 ICES advises on the
Overview 10/8/2015. October Pelagic Advice Pelagic AC 7 October 2015
 October Pelagic Advice Pelagic AC 7 October 2015 John Simmonds ICES ACOM Vice Chair Overview WG 1 Blue whiting NSS herring North Sea horse makerel WG 2 Stocks Northeast Atlantic mackerel Western horse
Striped red mullet (Mullus surmuletus) in Subarea 4 and divisions 7.d and 3.a (North Sea, eastern English Channel, Skagerrak and Kattegat)
 in Subarea 4 and divisions 7.d and 3.a (North Sea, eastern English Channel, Skagerrak and Kattegat)") ICES Advice on fishing opportunities, catch, and effort Greater North Sea Ecoregion Published 30 June 2017 DOI: 10.17895/ices.pub.3162 Striped red mullet (Mullus surmuletus) in Subarea 4 and divisions
ICES Advice on fishing opportunities, catch, and effort Greater North Sea Ecoregion Published 30 June 2017 DOI: 10.17895/ices.pub.3162 Striped red mullet (Mullus surmuletus) in Subarea 4 and divisions
Sprat (Sprattus sprattus) in subdivisions (Baltic Sea)
 in subdivisions (Baltic Sea)") ICES Advice on fishing opportunities, catch, and effort Baltic Sea Ecoregion Published 31 May 2016 8.3.18 Sprat (Sprattus sprattus) in subdivisions 22 32 (Baltic Sea) ICES stock advice ICES advises that
ICES Advice on fishing opportunities, catch, and effort Baltic Sea Ecoregion Published 31 May 2016 8.3.18 Sprat (Sprattus sprattus) in subdivisions 22 32 (Baltic Sea) ICES stock advice ICES advises that
Stock Annex: Greater silver smelt (Argentina silus) in divisions 5.b and 6.a (Faroes grounds and west of Scotland)
 in divisions 5.b and 6.a (Faroes grounds and west of Scotland)") ICES Stock Annex 1 Stock Annex: Greater silver smelt (Argentina silus) in divisions 5.b and 6.a (Faroes grounds and west of Scotland) Stock specific documentation of standard assessment procedures used
ICES Stock Annex 1 Stock Annex: Greater silver smelt (Argentina silus) in divisions 5.b and 6.a (Faroes grounds and west of Scotland) Stock specific documentation of standard assessment procedures used
Herring (Clupea harengus) in subdivisions 20 24, spring spawners (Skagerrak, Kattegat, and western Baltic)
 in subdivisions 20 24, spring spawners (Skagerrak, Kattegat, and western Baltic)") ICES Advice on fishing opportunities, catch, and effort Baltic Sea and Greater North Sea Ecoregions Published 31 May 2017 DOI: 10.17895/ices.pub.3126 Herring (Clupea harengus) in subdivisions 20 24, spring
ICES Advice on fishing opportunities, catch, and effort Baltic Sea and Greater North Sea Ecoregions Published 31 May 2017 DOI: 10.17895/ices.pub.3126 Herring (Clupea harengus) in subdivisions 20 24, spring
Plaice (Pleuronectes platessa) in Subarea 4 (North Sea) and Subdivision 20 (Skagerrak)
 in Subarea 4 (North Sea) and Subdivision 20 (Skagerrak)") ICES Advice on fishing opportunities, catch, and effort Greater North Sea Ecoregion Published 14 November 2018 https://doi.org/10.17895/ices.pub.4613 Plaice (Pleuronectes platessa) in Subarea 4 (North
ICES Advice on fishing opportunities, catch, and effort Greater North Sea Ecoregion Published 14 November 2018 https://doi.org/10.17895/ices.pub.4613 Plaice (Pleuronectes platessa) in Subarea 4 (North
PACIFIC BLUEFIN TUNA STOCK ASSESSMENT
 PACIFIC BLUEFIN TUNA STOCK ASSESSMENT SUMMARY 19-21 December 2012 Webinar PACIFIC BLUEFIN TUNA STOCK ASSESSMENT SUMMARY 1. Stock Identification and Distribution Pacific bluefin tuna (Thunnus orientalis)
ICES advice on fishing opportunities
 ICES Advice on fishing opportunities, catch, and effort Greater North Sea Ecoregion Published 29 June 2018 Version 2: 3 July 2018 Version 3: 14 November 2018 https://doi.org/10.17895/ices.pub.4458 Sole
Herring (Clupea harengus) in subdivisions and 32 (central Baltic Sea, excluding Gulf of Riga)
 in subdivisions and 32 (central Baltic Sea, excluding Gulf of Riga)") ICES Advice on fishing opportunities, catch, and effort Baltic Sea Ecoregion Published 31 May 2016 8.3.14 Herring (Clupea harengus) in subdivisions 25 29 and 32 (central Baltic Sea, excluding Gulf of Riga)
ICES Advice on fishing opportunities, catch, and effort Baltic Sea Ecoregion Published 31 May 2016 8.3.14 Herring (Clupea harengus) in subdivisions 25 29 and 32 (central Baltic Sea, excluding Gulf of Riga)
Preliminary analysis of yellowfin tuna catch, effort, size and tagging data using an integrated age-structured model
 Preliminary analysis of yellowfin tuna catch, effort, size and tagging data using an integrated age-structured model Introduction John Hampton Secretariat of the Pacific Community Noumea, New Caledonia
3.3.2 Cod (Gadus morhua) in subareas 1 and 2 (Northeast Arctic)
 in subareas 1 and 2 (Northeast Arctic)") ICES Advice on fishing opportunities, catch, and effort Barents Sea and Norwegian Sea Ecoregions Published 10 June 2016 3.3.2 Cod (Gadus morhua) in subareas 1 and 2 (Northeast Arctic) ICES stock advice
ICES Advice on fishing opportunities, catch, and effort Barents Sea and Norwegian Sea Ecoregions Published 10 June 2016 3.3.2 Cod (Gadus morhua) in subareas 1 and 2 (Northeast Arctic) ICES stock advice
Advice June, revised September Herring in Division IIIa and Subdivisions (Western Baltic spring spawners)
") 6.4.15 Advice June, revised September 21 ECOREGION STOCK North Sea and Baltic Herring in Division IIIa and Subdivisions 22 24 (Western Baltic spring spawners) Advice for 211 Management Objective (s) Catches
6.4.15 Advice June, revised September 21 ECOREGION STOCK North Sea and Baltic Herring in Division IIIa and Subdivisions 22 24 (Western Baltic spring spawners) Advice for 211 Management Objective (s) Catches
Sprat (Sprattus sprattus) in Subarea 4 (North Sea)
 in Subarea 4 (North Sea)") ICES Advice on fishing opportunities, catch, and effort Greater North Sea Ecoregion Published 12 April 2018 http://doi.org/10.17895/ices.pub.4257 Sprat (Sprattus sprattus) in Subarea 4 (North Sea) ICES
ICES Advice on fishing opportunities, catch, and effort Greater North Sea Ecoregion Published 12 April 2018 http://doi.org/10.17895/ices.pub.4257 Sprat (Sprattus sprattus) in Subarea 4 (North Sea) ICES
Sprat (Sprattus sprattus) in Subarea 4 (North Sea)
 in Subarea 4 (North Sea)") ICES Advice on fishing opportunities, catch, and effort Greater North Sea Ecoregion Published 30 June 2016 6.3.51 Sprat (Sprattus sprattus) in Subarea 4 (North Sea) ICES stock advice ICES provides catch
ICES Advice on fishing opportunities, catch, and effort Greater North Sea Ecoregion Published 30 June 2016 6.3.51 Sprat (Sprattus sprattus) in Subarea 4 (North Sea) ICES stock advice ICES provides catch
7.3.5 Blue jack mackerel (Trachurus picturatus) in Subdivision 10.a.2 (Azores)
 in Subdivision 10.a.2 (Azores)") ICES Advice on fishing opportunities, catch, and effort Azores Ecoregion Published 14 July 2016 7.3.5 Blue jack mackerel (Trachurus picturatus) in Subdivision 10.a.2 (Azores) ICES stock advice ICES advises
ICES Advice on fishing opportunities, catch, and effort Azores Ecoregion Published 14 July 2016 7.3.5 Blue jack mackerel (Trachurus picturatus) in Subdivision 10.a.2 (Azores) ICES stock advice ICES advises
Distribution and abundance of Norwegian spring spawning herring during the spawning season in 2006
 Toktrapport/Havforskningsinstituttet/ISSN 153-6294/Nr.1-26 «Cruise report» RV Håkon Mosby 16-2.2.26 Distribution and abundance of Norwegian spring spawning herring during the spawning season in 26 by Aril
INTER-AMERICAN TROPICAL TUNA COMMISSION SCIENTIFIC ADVISORY COMMITTEE FOURTH MEETING. La Jolla, California (USA) 29 April - 3 May 2013
 29 April - 3 May 2013") INTER-AMERICAN TROPICAL TUNA COMMISSION SCIENTIFIC ADVISORY COMMITTEE FOURTH MEETING La Jolla, California (USA) 29 April - 3 May 2013 DOCUMENT SAC-04-04c INDICES OF RELATIVE ABUNDANCE OF YELLOWFIN TUNA
INTER-AMERICAN TROPICAL TUNA COMMISSION SCIENTIFIC ADVISORY COMMITTEE FOURTH MEETING La Jolla, California (USA) 29 April - 3 May 2013 DOCUMENT SAC-04-04c INDICES OF RELATIVE ABUNDANCE OF YELLOWFIN TUNA
Saithe (Pollachius virens) in subareas 4 and 6, and in Division 3.a (North Sea, Rockall and West of Scotland, Skagerrak and Kattegat)
 in subareas 4 and 6, and in Division 3.a (North Sea, Rockall and West of Scotland, Skagerrak and Kattegat)") ICES Advice on fishing opportunities, catch, and effort Celtic Seas, Faroes, and Greater North Sea Ecoregions Published 30 June 2017 DOI: 10.17895/ices.pub.3206 Saithe (Pollachius virens) in subareas 4
ICES Advice on fishing opportunities, catch, and effort Celtic Seas, Faroes, and Greater North Sea Ecoregions Published 30 June 2017 DOI: 10.17895/ices.pub.3206 Saithe (Pollachius virens) in subareas 4
Trawl fishery management of Eastern Arabian Sea
 Trawl fishery management of Eastern Arabian Sea Dr. A.P.Dineshbabu, Central Marine Fisheries Research Institute, India Existing management practices Seasonal closure of fishery: The regulations for closed
Consultation Document
 Consultation Document Development of a regulation establishing a multiannual plan for the management of Northern Adriatic Sea small pelagic fisheries The sole purpose of this consultation is to collect
Tuna [211] 86587_p211_220.indd 86587_p211_220.indd /30/04 12/30/04 4:53:37 4:53:37 PM PM
![Tuna [211] 86587_p211_220.indd 86587_p211_220.indd /30/04 12/30/04 4:53:37 4:53:37 PM PM](/thumbs/85/92584906.jpg "Tuna [211] 86587_p211_220.indd 86587_p211_220.indd /30/04 12/30/04 4:53:37 4:53:37 PM PM") Tuna [] highlights Ocean and Climate Changes The catches of Pacific bluefin tuna and North Pacific albacore tuna have fluctuated considerably from year to year, but no upward or downward trends are apparent
Tuna [] highlights Ocean and Climate Changes The catches of Pacific bluefin tuna and North Pacific albacore tuna have fluctuated considerably from year to year, but no upward or downward trends are apparent
ASSESSMENT OF THE WEST COAST OF NEWFOUNDLAND (DIVISION 4R) HERRING STOCKS IN 2011
 HERRING STOCKS IN 2011") Canadian Science Advisory Secretariat Science Advisory Report 212/24 ASSESSMENT OF THE WEST COAST OF NEWFOUNDLAND (DIVISION 4R) HERRING STOCKS IN 211 Context Figure 1. Map of unit areas of NAFO Division
Canadian Science Advisory Secretariat Science Advisory Report 212/24 ASSESSMENT OF THE WEST COAST OF NEWFOUNDLAND (DIVISION 4R) HERRING STOCKS IN 211 Context Figure 1. Map of unit areas of NAFO Division
EU request to ICES on in-year advice on haddock (Melanogrammus aeglefinus) in Division 7.a (Irish Sea)
 in Division 7.a (Irish Sea)") ICES Special Request Advice Celtic Seas Ecoregion Published 1 March 2017 EU request to ICES on in-year advice on haddock (Melanogrammus aeglefinus) in Division 7.a (Irish Sea) Advice summary Please note:
ICES Special Request Advice Celtic Seas Ecoregion Published 1 March 2017 EU request to ICES on in-year advice on haddock (Melanogrammus aeglefinus) in Division 7.a (Irish Sea) Advice summary Please note:
MEFISTO PREPARED APPLICATIONS MODELLING FISHERIES MANAGEMENT STRATEGIES IN THE MEDITERRANEAN
 MEFISTO PREPARED APPLICATIONS MODELLING FISHERIES MANAGEMENT STRATEGIES IN THE MEDITERRANEAN CASE STUDY 2: The sardine (Sardina pilchardus) and the anchovy (Engraulis encrasicholus) of Tarragona Sergi
BSAC recommendations for the fishery in the Baltic Sea in 2018
 Copenhagen 7 th July 2017 BSAC recommendations for the fishery in the Baltic Sea in 2018 The BSAC recommends setting the catch levels for the Baltic stocks in 2018 at the values indicated in the table
STOCK STATUS OF SOUTHERN BLUEFIN TUNA
 7 th Expert Consultation on Indian Ocean Tunas, Victoria, Seychelles, 9-14 November, 1998 STOCK STATUS OF SOUTHERN BLUEFIN TUNA Tsuji, S. 1 Introduction The Commission for the Conservation of Southern
Annex 7: Request on management areas for sandeel in the North Sea
 922 ICES HAWG REPORT 2018 Annex 7: Request on management areas for sandeel in the North Sea Request code (client): 1707_sandeel_NS Background: During the sandeel benchmark in 2016 the management areas
Southern Gulf of St. Lawrence (4T) Herring
 Herring") Stock Status Report 24/23 Southern Gulf of St. Lawrence (4T) Herring Background Herring are a pelagic species which form schools during feeding and spawning periods. Herring in the southern Gulf of St.
Stock Status Report 24/23 Southern Gulf of St. Lawrence (4T) Herring Background Herring are a pelagic species which form schools during feeding and spawning periods. Herring in the southern Gulf of St.
Herring (Clupea harengus) in subdivisions 20 24, spring spawners (Skagerrak, Kattegat, and western Baltic)
 in subdivisions 20 24, spring spawners (Skagerrak, Kattegat, and western Baltic)") ICES Advice on fishing opportunities, catch, and effort Baltic Sea and Greater North Sea Ecoregions Published 31 May 2018 https://doi.org/10.17895/ices.pub.4390 Herring (Clupea harengus) in subdivisions
ICES Advice on fishing opportunities, catch, and effort Baltic Sea and Greater North Sea Ecoregions Published 31 May 2018 https://doi.org/10.17895/ices.pub.4390 Herring (Clupea harengus) in subdivisions
Cod (Gadus morhua) in subdivisions 24 32, eastern Baltic stock (eastern Baltic Sea) *
 in subdivisions 24 32, eastern Baltic stock (eastern Baltic Sea) *") ICES Advice on fishing opportunities, catch, and effort Baltic Sea Ecoregion Published 31 May 2017 Version 2: 1 June 2017 Version 3: 8 June 2017 Version 4: 8 March 2018 DOI: 10.17895/ices.pub.3096 Cod
ICES Advice on fishing opportunities, catch, and effort Baltic Sea Ecoregion Published 31 May 2017 Version 2: 1 June 2017 Version 3: 8 June 2017 Version 4: 8 March 2018 DOI: 10.17895/ices.pub.3096 Cod
Black-bellied anglerfish (Lophius budegassa) in divisions 7.b k, 8.a b, and 8.d (west and southwest of Ireland, Bay of Biscay)
 in divisions 7.b k, 8.a b, and 8.d (west and southwest of Ireland, Bay of Biscay)") ICES Advice on fishing opportunities, catch, and effort Greater Northern Sea, Celtic Seas, and Bay of Biscay and Iberian Coast Ecoregions Published 29 June 2018 https://doi.org/10.17895/ices.pub.4474 Black-bellied
ICES Advice on fishing opportunities, catch, and effort Greater Northern Sea, Celtic Seas, and Bay of Biscay and Iberian Coast Ecoregions Published 29 June 2018 https://doi.org/10.17895/ices.pub.4474 Black-bellied
9.4.5 Advice October Widely Distributed and Migratory Stocks Herring in the Northeast Atlantic (Norwegian spring-spawning herring)
") 9.4.5 Advice October 21 ECOREGION STOCK Widely Distributed and Migratory Stocks Herring in the Northeast Atlantic (Norwegian spring-spawning herring) Advice for 211 Management Objective (s) Landings in
9.4.5 Advice October 21 ECOREGION STOCK Widely Distributed and Migratory Stocks Herring in the Northeast Atlantic (Norwegian spring-spawning herring) Advice for 211 Management Objective (s) Landings in
Stock characteristics, fisheries and management of Greenland halibut (Reinhardtius hippoglossoides (Walbaum)) in the Northeast Arctic
) in the Northeast Arctic") The 10 th Norwegian Russian Symposium Stock characteristics, fisheries and management of Greenland halibut (Reinhardtius hippoglossoides (Walbaum)) in the Northeast Arctic by Kjell H. Nedreaas (IMR) &
The 10 th Norwegian Russian Symposium Stock characteristics, fisheries and management of Greenland halibut (Reinhardtius hippoglossoides (Walbaum)) in the Northeast Arctic by Kjell H. Nedreaas (IMR) &
Recent stock recovery and potential future developments in. Sebastes mentella in the Barents- and Norwegian Seas.
 Recent stock recovery and potential future developments in the fishery, The rise management, of the assessment beaked and redfish population of Sebastes mentella in the Barents- and Norwegian Seas. Benjamin
Beaked redfish (Sebastes mentella) in subareas 1 and 2 (Northeast Arctic)
 in subareas 1 and 2 (Northeast Arctic)") ICES Advice on fishing opportunities, catch, and effort Arctic Ocean, Barents Sea, Faroes, Greenland Sea, Published 13 June 2017 Icelandic Waters, and Norwegian Sea Ecoregions DOI: 10.17895/ices.pub.3212
ICES Advice on fishing opportunities, catch, and effort Arctic Ocean, Barents Sea, Faroes, Greenland Sea, Published 13 June 2017 Icelandic Waters, and Norwegian Sea Ecoregions DOI: 10.17895/ices.pub.3212
NAFO/ICES PANDALUS ASSESSMENT GROUP MEETING OCTOBER An overview of Norwegian investigations of the shrimp stock off East Greenland in
 NOT TO BE CITED WITHOUT PRIOR REFERENCE TO THE AUTHOR(S) Northwest Atlantic Fisheries Organization Serial No. N5595 NAFO SCR Doc. 08/063 NAFO/ICES PANDALUS ASSESSMENT GROUP MEETING OCTOBER 2008 An overview
The Hague, Kingdom of the Netherlands October 2016 SC The European Union Annual report
 4 th Meeting of the Scientific Committee The Hague, Kingdom of the Netherlands 1-1 October 216 SC-4-1 The European Union Annual report Ad Corten Consultant Dutch Ministry of Economic Affairs 1 National
SWG JACK MACKEREL FISHERY IN CHILE
 SWG-10-07 JACK MACKEREL FISHERY IN CHILE ANNUAL NATIONAL REPORT SCIENCE WORKING GROUP 2011 1. DESCRIPTION OF THE FISHERY. 1.1 Composition of the Fleet. The structure and size of the industrial purse seine
STECF EXPERT WORKING GROUP EWG 16-13
 STECF EXPERT WORKING GROUP EWG 16-13 Stock assessments in the Mediterranean Sea, Part I 26 30 September 2016, Barza di Ispra, Italy DG MARE focal persons: Xavier Vazquez & Amanda Perez Chair: John Simmonds
ICES Advisory Approach
 ICES Advisory Approach Pelagic AC 12 April 2018 Eskild Kirkegaard ICES ACOM Chair Rules for advice on fishing opportunities Agreed management strategies Available information and knowledge Basis of ICES
19 INTERNATIONAL CONGRESS ON ACOUSTICS MADRID, 2 7 SEPTEMBER 2007
 19 INTERNATIONAL CONGRESS ON ACOUSTICS MADRID, 2 7 SEPTEMBER 2007 INVESTIGATIONS ON THE STRUCTURE OF FISH STOCKS IN ATATURK DAM LAKE BY USING CLASSICAL AND ACOUSTICAL APPROACHES AKOGLU, Ekin; GUCU, Ali
Beaked redfish (Sebastes mentella) in subareas 1 and 2 (Northeast Arctic)
 in subareas 1 and 2 (Northeast Arctic)") ICES Advice on fishing opportunities, catch, and effort Arctic Ocean, Barents Sea, Faroes, Greenland Sea, Published 28 September 2018 Icelandic Waters, and Norwegian Sea Ecoregions DOI: 10.17895/ices.pub.4538
ICES Advice on fishing opportunities, catch, and effort Arctic Ocean, Barents Sea, Faroes, Greenland Sea, Published 28 September 2018 Icelandic Waters, and Norwegian Sea Ecoregions DOI: 10.17895/ices.pub.4538
REVISION OF THE WPTT PROGRAM OF WORK
 REVISION OF THE WPTT PROGRAM OF WORK IOTC 2016 WPTT18 08 Rev 1 PREPARED BY: IOTC SECRETARIAT 1, 3 OCTOBER 2016 PURPOSE To ensure that the participants at the 18 th Working Party on Tropical Tunas (WPTT18)
Sprat (Sprattus sprattus) in Division 3.a (Skagerrak and Kattegat)
 in Division 3.a (Skagerrak and Kattegat)") ICES Advice on fishing opportunities, catch, and effort Greater North Sea Ecoregion Published 07 April 2017 DOI: 10.17895/ices.pub.3256 Sprat (Sprattus sprattus) in Division 3.a (Skagerrak and Kattegat)
ICES Advice on fishing opportunities, catch, and effort Greater North Sea Ecoregion Published 07 April 2017 DOI: 10.17895/ices.pub.3256 Sprat (Sprattus sprattus) in Division 3.a (Skagerrak and Kattegat)
ICES advice on fishing opportunities
 ICES Advice on fishing opportunities, catch, and effort Northeast Atlantic and Arctic Ocean Published 22 October 2018 Version 2: 25 October 2018 https://doi.org/10.17895/ices.pub.4568 Herring (Clupea harengus)
Advice October 2014
 5.3.21.3 Advice October 2014 ECOREGION Celtic Sea and West of Scotland STOCK Nephrops on Porcupine Bank (FU 16) Advice for 2015 ICES advises on the basis of the MSY approach that catches from FU 16 in