Survival of the blacktip shark, Carcharhinus limbatus
|
|
|
- Alaina Clark
- 6 years ago
- Views:
Transcription
1 University of Rhode Island Open Access Master's Theses 2013 Survival of the blacktip shark, Carcharhinus limbatus William A. Swinsburg University of Rhode Island, Follow this and additional works at: Terms of Use All rights reserved under copyright. Recommended Citation Swinsburg, William A., "Survival of the blacktip shark, Carcharhinus limbatus" (2013). Open Access Master's Theses. Paper This Thesis is brought to you for free and open access by It has been accepted for inclusion in Open Access Master's Theses by an authorized administrator of For more information, please contact
2 SURVIVAL OF THE BLACKTIP SHARK, CARCHARHINUS LIMBATUS BY WILLIAM A. SWINSBURG A THESIS SUBMITTED IN PARTIAL FULFILLMENT OF THE REQUIREMENTS FOR THE DEGREE OF MASTER OF SCIENCE IN BIOLOGICAL AND ENVIRONMENTAL SCIENCES UNIVERSITY OF RHODE ISLAND 2013
3 MASTER OF BIOLOGICAL AND ENVIRONMENTAL SCIENCES THESIS OF WILLIAM A. SWINSBURG APPROVED: Thesis Committee: Major Professor David Bengtson Nancy Kohler Jeremy Collie Graham Forrester Nasser H. Zawia DEAN OF THE GRADUATE SCHOOL UNIVERSITY OF RHODE ISLAND 2013
4 ABSTRACT Proportional survival (S) is a crucial life-history parameter in population dynamics, natural selection, and management of harvested stocks; variations in survival due to age, sex, or geographic region may have large effects on the success of managing fish stocks. The blacktip shark, Carcharhinus limbatus, is the most abundantly harvested shark species in American fisheries. Direct estimates of survival are preferred, but all current survival estimates for this species are either focused on young-of-the-year (YOY) or based on indirect methods. The objectives of this study were to determine whether age, sex, or geographic grouping affects survival and to generate direct survival estimates based on tag-recovery data. As a byproduct of this analysis, distribution maps and descriptive data summarizing captures were included. The U.S. National Marine Fisheries Service has been collecting tag-recovery data since 1962 through the Cooperative Shark Tagging Program (CSTP). Models were generated from this database with program MARK, ranked in order of parsimony according to Akaike s Information Criterion, and tested for significance of effects with likelihood ratio tests. No movement has been observed to date between the west Gulf of Mexico, east Gulf of Mexico, and U.S. Atlantic, but 2 sharks tagged in the U.S. Virgin Islands were recaptured off Florida and Georgia (displacement= 1049 and 1183 n. mi., respectively). Survival did not differ significantly for males vs. females (P=0.761), east vs. west Gulf of Mexico (P=0.654), or U.S. Atlantic vs. Gulf of Mexico (P=0.243). However, significant differences were found for survival of YOY (0.580) and post-yoy (0.725) within the Gulf of Mexico (P=0.0003). These results demonstrate that survival can be modeled effectively for species in the CSTP with
5 relatively small sample sizes. Future analyses may benefit from a length-based model, due to the difficulty in assigning life stages based on size.
6 ACKNOWLEDGMENTS I am deeply indebted to my research advisors David Bengtson and Nancy Kohler for their patient guidance and mentorship. This work benefited significantly from the innovative ideas and valuable feedback of Jeremy Collie and Graham Forrester. I greatly appreciate the advice and technical support of Tony Wood, Patricia Turner, Camilla McCandless, and Ruth Briggs (CSTP-NMFS). I am very thankful to the countless biologists, fishery observers, recreational fishermen and commercial fishermen who voluntarily contributed to this database. Finally, I am grateful for the continual support of my family and friends scattered throughout southeastern Ohio, central Pennsylvania, and Rhode Island. iv
7 DEDICATION I dedicate this thesis to my inspiring parents Robin and Joan, my kind-hearted sisters Becky and Laura, and my breathtaking fiancée Barbara. Soli Deo gloria. v
8 PREFACE This thesis is presented in Manuscript Format. This paper is formatted according to the guidelines for submission to Fishery Bulletin. The paper has not yet been submitted for publication. All the pages have been formatted in the accepted font and margin alignment. vi
9 TABLE OF CONTENTS ABSTRACT... ii ACKNOWLEDGMENTS... iv DEDICATION... v PREFACE... vi TABLE OF CONTENTS... vii LIST OF TABLES... ix LIST OF FIGURES... xii CHAPTER ABSTRACT... 2 INTRODUCTION... 2 MATERIALS AND METHODS... 7 RESULTS DISCUSSION CONCLUSIONS ACKNOWLEDGEMENTS LITERATURE CITED TABLES FIGURES APPENDICES APPENDIX I: Definition of Terms APPENDIX II: Additional Background for Survival APPENDIX III: Additional Tables and Figures vii
10 BIBLIOGRAPHY viii
11 LIST OF TABLES TABLE PAGE Table 1. Summary of all tags and recaptures by region Table 2. Summary of tagging fate for each region Table 3. CSTP capture distribution by sex and life stage for blacktip sharks tagged and recaptured in the U.S. Atlantic Ocean Table 4. CSTP capture distribution by sex and life stage for blacktip sharks tagged and recaptured in the Gulf of Mexico Table 5. CSTP capture distribution by sex and life stage for blacktip sharks tagged and recaptured in the International Atlantic Ocean Table 6. Summary statistics for recaptures of all regions Table 7. Tag and recapture information for 4 sharks that crossed between U.S. and International Atlantic waters Table 8. Final results for ĉ, r, and S T for select models Table 9. P values for the simplest likelihood ratio tests of each effect Table 10. Sensitivity analysis for ST as a function of varying Λ Table A-1. CSTP recapture statistics by sex for blacktip sharks tagged and recaptured in the U.S. Atlantic Ocean Table A-2. CSTP recapture statistics by sex for blacktip sharks tagged and recaptured in the Gulf of Mexico Table A-3. CSTP recapture statistics by sex for blacktip sharks tagged and recaptured in the International Atlantic ix
12 TABLE PAGE Table A-4. Captures by industry (including all tags and recaptures) Table A-5. Captures by gear (including all tags and recaptures) Table A-6. The 7 most parsimonious models (those with model likelihood ) tested with YOY and post-yoy groups Table A-7. Survival likelihood ratio tests for YOY vs. post-yoy sharks in the GOM Table A-8. Recovery probability likelihood ratio tests for YOY vs. post-yoy sharks in the GOM Table A-9. The 8 most parsimonious models (those with model likelihood ) tested with male and female groups Table A-10. Survival likelihood ratio tests for male vs. female post-yoy sharks in the GOM Table A-11. Recovery probability likelihood ratio tests for male vs. female post-yoy sharks in the GOM Table A-12. The 9 most parsimonious models (those with model likelihood ) tested with west and east GOM groups Table A-13. Survival likelihood ratio tests for post-yoy sharks in the west GOM vs. those in the east GOM Table A-14. Recovery probability likelihood ratio tests for post-yoy sharks in the west GOM vs. those in the east GOM Table A-15. The 11 most parsimonious models (those with model likelihood ) tested with Atlantic and GOM groups x
13 TABLE PAGE Table A-16. Survival likelihood ratio tests for post-yoy sharks in the Atlantic vs. those in the GOM Table A-17. Recovery probability likelihood ratio tests for post-yoy sharks in the Atlantic vs. those in the GOM xi
14 LIST OF FIGURES FIGURE PAGE Figure 1. Geographic regions used in analysis Figure 2. Distribution of recaptures according to time at liberty, displacement, and speed Figure 3. Length frequency by sex for blacktip shark captures in the U.S. Atlantic Ocean Figure 4. Length frequency by sex for blacktip shark captures in the Gulf of Mexico Figure 5. Length frequency by sex for blacktip shark captures in the International Atlantic Ocean Figure 6. Blacktip shark captures by sex in the U.S. Atlantic Figure 7. Blacktip shark captures by sex in the GOM Figure 8. Blacktip shark captures by sex in the International Atlantic Figure 9. Blacktip shark captures by life stage in the U.S. Atlantic Figure 10. Blacktip shark captures by life stage in the Gulf of Mexico Figure 11. Blacktip shark captures by life stage in the International Atlantic Figure 12. Blacktip shark recaptures by sex and life stage in the U.S. Atlantic Figure 13. Blacktip shark recaptures by sex and life stage in the Gulf of Mexico Figure 14. Blacktip shark recaptures by sex and life stage in the International Atlantic Figure A-1. Possible encounter histories and associated probabilities for the reduced (Seber) parameterization xii
15 FIGURE PAGE Figure A-2. Recovery matrix format Figure A-3. Fishing mortality rate of blacktip sharks in the Gulf of Mexico and Atlantic from 1986 through Figure A-4. Distribution of blacktip sharks tagged and recaptured in the Gulf of Mexico from 1964 through Figure A-5. Distribution of blacktip sharks tagged and recaptured in the U.S. Atlantic waters from 1964 through Figure A-6. Distribution of blacktip sharks tagged and recaptured in International Atlantic waters from 1964 through Figure A-7. Mean displacement of blacktip sharks at large for less than 1 year Figure A-8. Length frequency for blacktip shark captures in the U.S. Atlantic Ocean Figure A-9. Length frequency for blacktip shark captures in the Gulf of Mexico Figure A-10. Length frequency for blacktip shark captures in the International Atlantic Ocean Figure A-11. Blacktip shark captures in the CSTP by industry Figure A-12. Blacktip shark captures in the CSTP by industry in the west and east U.S. GOM Figure A-13. Blacktip shark captures in the CSTP by gear Figure A-14. Blacktip shark captures in the CSTP by gear in the west and east U.S. GOM Figure A-15. Blacktip shark captures by sex off the north U.S. Atlantic coast xiii
16 FIGURE PAGE Figure A-16. Blacktip shark captures by sex off the south U.S. Atlantic coast Figure A-17. Blacktip shark captures by sex off the west coast of Florida Figure A-18. Blacktip shark captures by sex in the northwestern Gulf of Mexico Figure A-19. Blacktip shark captures by sex in the Bahamas Figure A-20. Blacktip shark captures by sex in the U.S. Virgin Islands Figure A-21. Blacktip shark captures by life stage off the north U.S. Atlantic coast Figure A-22. Blacktip shark captures by life stage off the south U.S. Atlantic coast Figure A-23. Blacktip shark captures by life stage off the west coast of Florida Figure A-24. Blacktip shark captures by life stage in the northwestern Gulf of Mexico Figure A-25. Blacktip shark captures by life stage in the Bahamas Figure A-26. Blacktip shark captures by life stage in the U.S. Virgin Islands Figure A-27. Embryo, YOY and pregnant blacktip shark captures in the U.S. Atlantic Figure A-28. Embryo, YOY and pregnant blacktip shark captures off the north U.S. Atlantic coast Figure A-29. Embryo, YOY and pregnant blacktip shark captures in the south U.S. Atlantic coast Figure A-30. Embryo, YOY and pregnant blacktip shark captures in the Gulf of Mexico xiv
17 FIGURE PAGE Figure A-31. Embryo, YOY and pregnant blacktip shark captures off the west coast of Florida Figure A-32. Embryo, YOY and pregnant blacktip shark captures in the northwestern Gulf of Mexico Figure A-33. Embryo, YOY and pregnant blacktip shark captures in the International Atlantic Figure A-34. Embryo, YOY and pregnant blacktip shark captures in the Bahamas 115 Figure A-35. Embryo, YOY and pregnant blacktip shark captures in the U.S. Virgin Islands Figure A-36. Blacktip shark recaptures by sex and life stage off the north U.S. Atlantic coast Figure A-37. Blacktip shark recaptures by sex and life stage off the south U.S. Atlantic coast Figure A-38. Blacktip shark recaptures by sex and life stage off the west coast of Florida Figure A-39. Blacktip shark recaptures by sex and life stage in the northwestern Gulf of Mexico Figure A-40. Blacktip shark recaptures by sex and life stage in the Bahamas Figure A-41. Blacktip shark recaptures by sex and life stage in the U.S. Virgin Islands Figure A-42. Blacktip shark landings in the GOM by fleet xv
18 FIGURE PAGE Figure A-43. Probability expressions for number of sharks marked and recovered in a given year, with no age grouping Figure A-44. Probability expressions for number of sharks marked and recovered in a given year, including an age effect Figure A-45. Data input file for analysis with an age grouping Figure A-46. Sample likelihood distributions with different variances Figure A-47. Sample calculation of variance with profile likelihood method Figure A-48. Calculation of observed model deviance over mean deviance Figure A-49. Visual representation of nesting xvi
19 CHAPTER 1 Survival of the blacktip shark, Carcharhinus limbatus by William Swinsburg 1 ; Nancy Kohler 2 ; Jeremy Collie 3 ; Patricia Turner 4 ; Camilla McCandless 5 is in preparation to Fishery Bulletin 1 M.S. Candidate, Department of Fisheries, Animal, and Veterinary Science, The University of Rhode Island, Kingston, RI billswinsburg@gmail.com 2 NOAA/NMFS/NEFSC, Narragansett, RI Nancy.Kohler@noaa.gov 3 Professor, Graduate School of Oceanography, The University of Rhode Island, Narragansett, RI jcollie@mail.uri.edu 4 NOAA/NMFS/NEFSC, Narragansett, RI pat.turner@noaa.gov 5 NOAA/NMFS/NEFSC, Narragansett, RI cami.mccandless@noaa.gov 1
20 ABSTRACT Proportional survival (S) is a crucial life-history parameter in population dynamics, natural selection, and management of harvested stocks; variations in survival due to age, sex, or geographic region may have large effects on the success of managing fish stocks. The blacktip shark, Carcharhinus limbatus, is the most abundantly harvested shark species in American fisheries. Direct estimates of survival are preferred, but all current survival estimates for this species are either focused on young-of-the-year (YOY) or based on indirect methods. The objectives of this study were to determine whether age, sex, and geographic grouping affect survival and to generate direct survival estimates based on tag-recovery data. As a byproduct of this analysis, distribution maps and descriptive data summarizing captures were included. No movement has been observed to date between the west Gulf of Mexico, east Gulf of Mexico, and U.S. Atlantic, but 2 sharks tagged in the U.S. Virgin Islands were recaptured off Florida and Georgia (displacement= 1049 and 1183 n. mi., respectively). Survival did not differ significantly for males vs. females (P=0.761), east vs. west Gulf of Mexico (P=0.654), or U.S. Atlantic vs. Gulf of Mexico (P=0.243). However, significant differences were found for survival of YOY (0.580) and post-yoy (0.725) within the Gulf of Mexico (P=0.0003). Future analyses may benefit from a length-based model, due to the difficulty in assigning life stages based on size. INTRODUCTION Proportional survival (S) is a crucial life-history parameter in population dynamics, natural selection, and management of harvested stocks (Lebreton et al., 2
21 1992). Variation in survival, fecundity, and growth rate can interact to influence adaptive fitness (Endler, 1986; Hutchings, 1993). Accurate estimates of survival are a key component of demographic analysis and stock assessment of marine species (Cortés, 1998; Mollet & Cailliet, 2002), and they determine which levels of exploitation are sustainable (Simpfendorfer et al., 2005a). Vetter (1988) suggested that survival in fish stocks can vary due to a number of factors, including changing levels of fishing effort (Quinn and Deriso, 1999). Gear selectivity, predation pressure, or other factors may result in survival probabilities that vary with age (Deriso et al., 1985; Quinn and Deriso, 1999). These variations in survival could also have large effects on the success of fisheries management (Deriso et al., 1985; Cortés, 1998; Quinn and Deriso, 1999). In either of the cases above, stock assessments that assume constant survival may greatly overestimate or underestimate a stock s capacity to handle intensive fishing pressure. This lack of information may lead to fishing limits that are too high for sustainable harvest. In a broader sense, determining whether survival varies with time or age is the first step in understanding how anthropogenic causes may be affecting the lifehistory of a species. Proportional survival over a finite interval is related to total instantaneous mortality rate (Z) by S=e -Z where Z is the sum of instantaneous natural mortality (M) and instantaneous fishing mortality (F) (Quinn and Deriso, 1999). Converting between instantaneous mortality and finite survival assumes that the instantaneous 3
22 mortality rate is constant during the finite time interval. Many methods of estimating survival were described by Ricker (1975) and Seber (2002). Direct methods of calculating survival (i.e., mark-recapture) are preferable over indirect methods that involve the use of life-history parameters (Brownie et al., 1985; Lebreton et al., 1992; Quinn & Deriso, 1999; Simpfendorfer et al., 2005b). Recent advances in computer modeling technology allow powerful hypothesis testing related to variations in survival (Lebreton et al., 1992). New models allow the user to separate the effects of recovery probability from the probability of death using mark-recapture histories (White & Burnham, 1999; Cooch & White 1 ). Elasmobranchs are slow-growing fish with late maturity and small litter size (Hoenig and Gruber, 1990). This K-type strategy (sensu MacArthur & Wilson, 1967) represents a significant challenge for managing these populations (Hoenig & Gruber, 1990; Pratt and Casey, 1990; Walker, 1998). In addition, large predatory fishes like sharks may be much more sensitive to overexploitation (and ultimately, extinction) than previously anticipated (Myers and Worm, 2005). In order to assist stock assessment and management, more information about shark populations and biological variables is needed (Walker, 1998; ICCAT 2 ). In particular, proportional survival is a critical factor in stock assessment and demographic analysis (Mollet & Calliet, 2002). The blacktip shark, Carcharhinus limbatus (Müller and Henle, 1839), is the 1 Cooch, E. and G. White Program MARK. A Gentle Introduction, 5 th edn. [ accessed November 2011.] 2 ICCAT Report of the 2004 inter-sessional meeting of the ICCAT subcommittee on bycatches: shark stock assessment. Collect. Vol. Sci. Pap. ICCAT 54:
23 most abundantly harvested shark species in American fisheries; investigations of survival are appropriate for such an ecologically and economically important species (Castro, 1996; Grace and Henwood, 1997; Cortés 3 ; NOAA/NMFS 4 ; NOAA/NMFS 5 ). Blacktip sharks inhabit tropical, subtropical, and temperate waters throughout the world (Garrick, 1982; Castro, 1996). This species has an annual migration cycle that corresponds with a biennial ovulation cycle (Branstetter, 1981; Castro, 1996). Females either breed or give birth in May to June; post-parturition females are not able to mate again until the following spring. It is believed that the entire population migrates to more southern waters in the fall; in the following spring, the sharks return to their northern breeding and pupping grounds (Branstetter, 1981; Killam 6 ; Castro, 1993; Castro, 1996). Indirect methods have provided survival probabilities for blacktip sharks that range from (Cortés, 1998) and (Cortés and Brooks 7 ). However, all of these methods are based on life history parameters like longevity and age at maturity; no one has estimated adult blacktip shark survival based on 3 Cortés, E shark evaluation annual report. Document SFD-00/ NOAA/NMFS Southeast Fisheries Science Center, Panama City, Fla. 24 p. 4 NOAA/NMFS SEDAR 11 Stock Assessment Report. Large Coastal Shark Complex, Blacktip, and Sandbar Shark. 387 p. 5 NOAA/NMFS SEDAR 29 Stock Assessment Report. HMS Gulf of Mexico Blacktip Shark. 197 p. 6 Killam, K The reproductive biology, age, and growth of the blacktip shark, Carcharhinus limbatus (Valenciennes) near Tampa Bay, Florida. M.S. Thesis, University of South Florida, Tampa, FL. 7 Cortés, E and E. Brooks Indirect estimates of natural mortality for sandbar (Carcharhinus plumbeus) and blacktip (Carcharhinus limbatus) sharks in the western North Atlantic. SEDAR 11 LCS05/06-DW p. 5
24 empirical tag-recovery data from the population itself. As a result, survival estimates based on direct methods were unavailable for the 2005 SouthEast Data Assessment and Review (SEDAR) on large coastal sharks (Cortés and Brooks 7 ). Similarly, no one has tested for significant differences in survival based on time, age, sex, and location in blacktip sharks. Therefore, the primary objectives of this research were to estimate survival in blacktip sharks based on tag-recovery data and determine if significant differences in survival exist based on time, age, sex, and location. Information on size, distribution, and movement were provided as a byproduct of this survival analysis. Blacktip sharks in the Gulf of Mexico (GOM) are currently managed by the National Marine Fisheries Service (NMFS) as a single stock, but the degree of exchange between the east GOM, west GOM, and U.S. Atlantic is unknown (Kohler et al., 1998; Keeney et al., 2003; Kohler et al. 8 ; NOAA/NMFS 4 ). According to recent SEDAR stock assessment reports, there is a great need for conventional mark-recapture studies that describe the exchange (or lack thereof) of this stock between the East and West GOM (NOAA/NMFS 4 ; NOAA/NMFS 5 ). No exchange has been observed between these regions to date. Therefore, it is desirable to determine whether survival differs significantly among sharks from these 3 regions. The NMFS Cooperative Shark Tagging Program (CSTP) is one of the largest mark-recapture databases for sharks in the world. It currently includes over 227,000 8 Kohler N. E., P. A. Turner, and R. Briggs Preliminary Tag and Recapture Data for the Sandbar Shark, Carcharhinus plumbeus, and the Blacktip Shark, Carcharhinus limbatus, in the Western North Atlantic. SEDAR 11 LCS05-06-DW p. 6
25 tagged sharks of over 50 species and 13,000 recaptures. NMFS has been collecting mark-recapture data since 1962 through the CSTP. Recreational and commercial fishermen tag sharks, providing information on size, sex, condition, location, and date of capture. If a tagged shark is recaptured, corresponding information is sent to NMFS, allowing for the calculation of time at large and displacement (calculated as the shortest distance between mark and recapture locations). Displacement values are presented in nautical miles, n. mi, where 1 n. mi=1.852 km. Blacktip sharks were predominantly caught by rod and reel, longline, and gill net. The body length of some sharks was measured by biologists, but some were recorded as estimates. The effect of this uncertainty was minimized by collapsing length data into life stage categories. This database was fishery-dependent, but the large sample size (n>9000 blacktip shark captures) presented a unique opportunity to map distribution and analyze survival in the geographic areas that are most important to fisheries. The CSTP database represented extensive spatial coverage of U.S. waters, so spatial bias in distribution was minimized (Kohler et al., 1998). For the purposes of this analysis, all shark landings were defined as captures, including both tags and recaptures. Shark recaptures were dead recoveries; the sharks were not rereleased and recaptured after initial recapture. MATERIALS AND METHODS In the CSTP, length and weight were reported with varying units of measure. Fork length was used whenever provided and converted to cm when applicable. Total length was converted to fork length using the formula: TL(cm)=(1.1955)FL(cm)+1.13 (NMFS SEFSC unpublished data). 7
26 When neither fork length nor total length was provided, weight in kilograms was converted to FL according to the formula: Weight (kg)=(1*10-5 )FL(cm) (NMFS SEFSC unpublished data). Sharks were categorized into life stages according to length. The boundary between young-of-the-year (YOY) and juveniles was set to 56.6 cm FL, the maximum embryo size plus 10% TL (cm) according to Garrick (1982). Sharks measuring less than 56.6 cm FL were classified as YOY. Males and females in the Gulf of Mexico were considered mature when FL was greater than the median length at maturity, cm and cm, respectively (Carlson et al., 2006). Males and females between 56.6 cm FL and the median length at maturity were considered to be juveniles for the purposes of this study. Sharks of unknown sex that were between 56.6 cm FL and cm FL were categorized as juveniles. Sharks without a size estimate or sharks of unknown sex that were between cm FL and cm FL were categorized as unknown maturity. Sharks of unknown sex that were larger than cm FL were categorized as mature. Sharks were classified as embryos when they were taken from pregnant females. A similar methodology was used for Atlantic sharks, substituting and cm FL as the median length at maturity for males and females, respectively (Carlson et al., 2006). Data were plotted as points for distribution maps with MapInfo Professional 7.0 (MapInfo Professional, vers. 7.0, Pitney Bowes Software, Inc., Troy, NY). In the CSTP database, blacktip sharks have been reported along the east coast of the United States from Texas to Delaware; a limited amount of data were also available from Mexico and the Caribbean, as far south as French Guiana. NMFS 8
27 manages 2 stocks of blacktip sharks, 1 in the U.S. Atlantic Ocean and 1 in the GOM. The U.S. Atlantic region was defined as the geographic area within the U.S. Exclusive Economic Zone (EEZ) from Delaware to the Straits of Florida (NOAA/NMFS 4 ). The Gulf of Mexico was defined as the geographic region from the Florida Keys throughout the Gulf of Mexico (NOAA/NMFS 4 ). For the purposes of these analyses, the boundary between the Gulf of Mexico and the U.S. Atlantic region was a line beginning on the east coast of Florida at 25º10.4 N latitude, proceeding due east to the U.S. EEZ. The International Atlantic was defined as the region of the northwest Atlantic not included in the aforementioned regions. For certain analyses, the Gulf of Mexico was further divided into 3 sub-regions: the east U.S. GOM, west U.S. GOM, and the Mexican GOM. The U.S. EEZ and the meridian at 89 W longitude were the boundaries to separate these sub-regions (Figure 1). Direct estimates of survival were calculated with the freely available program MARK (Program MARK, vers. 6.2, Gary C. White, Fort Collins, CO), loosely following the procedure of Wood et al. (2007). The 4 survival analyses conducted were: 1) YOY vs. post-yoy, 2) male vs. female, 3) west vs. east GOM, and 4) GOM vs. Atlantic. Survival was modeled with the reduced (Seber) parameterization (Seber, 1970; Anderson et al., 1985). In this parameterization, S was the probability that the fish survives the year, and r was the probability that the fish was recovered and reported (Fig. A-1). Model names describe the parameters included in the model. For example, S(g*t) r(g+t) indicates that survival was modeled with an interaction between group and time, and recovery probability was modeled with group and time effects, but no interaction. A period (.) 9
28 indicates that either group or time effects were not included in the model. Data were entered in the classic recovery (triangular) matrix format (Fig. A-2). S and r were solved numerically for the maximum likelihood estimate, and the profile likelihood method generated confidence intervals. A parametric bootstrap procedure (Cooch and White 1 ) for the most general model (group- and time-dependent survival and recovery probabilities) assessed goodness of fit. The quasi-likelihood parameter, ĉ was estimated as the average of the mean ĉ and mean deviance estimates. Models were ranked according to the quasi-likelihood adjusted AIC (White and Burnham, 1999). Likelihood ratio tests (LRT) determined whether survival and recovery probabilities were time-dependent, age-dependent, sex-dependent, regiondependent or constant. In addition to the predictive variables of group and time, models were fit with an external index to account for changing levels of yearly fishing effort. It is known that F=qf where F=fishing mortality rate, q=catchability coefficient, and f=fishing effort (Quinn and Deriso, 1999). The catchability coefficient was assumed to be constant over time, so that F could be used as proxy for effort. Values of F were available specifically for Gulf of Mexico and U.S. Atlantic blacktip sharks from from the SEDAR 11 Stock Assessment Report (Fig. A-3). Therefore, the analysis was constrained to this time period. A more detailed explanation of survival analysis procedures is provided in Appendix II. 10
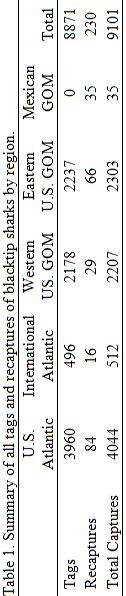
29 RESULTS The first blacktip sharks in the CSTP were tagged in 1964, but the tagging rates remained below 100 sharks per year until 1988 in the GOM and 1999 in the U.S. Atlantic (Figs. A-4-A-5). Tagging rate in the International Atlantic reached a maximum of 69 sharks per year in 2005 (Fig. A-6). A total of 8871 blacktip sharks were tagged within the CSTP. From 1964 through 2011, 230 of these sharks were recaptured, leading to 9101 captures, total (Table 1). The fate of these tagged sharks is displayed by region in Table 2. Notably, 1 shark tagged in U.S. waters of the Atlantic Ocean was recaptured in the International Atlantic, 3 sharks tagged in the International Atlantic were recaptured in the U.S. Atlantic, and 35 sharks tagged in the U.S. waters of the western GOM were recaptured in Mexican waters of the GOM. Information on these captures by sex and life stage is provided in Tables 3-5. Females were caught more often than males, resulting in a male to female sex ratio of 1:1.2 in the U.S. Atlantic, 1:1.8 in the GOM and 1:1.6 in the International Atlantic. Juveniles were the most commonly caught life stage for both males and females. Mean time at liberty ranged from days in the eastern U.S. GOM to days in the International Atlantic (Table 6). During the period of study, 35 blacktip sharks were recaptured in Mexican waters, but no blacktip sharks were tagged there. For this reason, the final destination of sharks in the southern GOM was unknown. Recapture statistics by sex are provided in Tables A-1-3 (excluding the 4 sharks that crossed between the U.S. Atlantic and the International Atlantic, as described in Table 7). In the U.S. Atlantic, 3959 sharks were tagged, and 81 of these tagged sharks were recaptured in the same region (2.0%), yielding a total of
30 captures. The highest values for maximum displacement (616 n. mi.), maximum speed (15.3 n. mi./day), and maximum time at liberty (5.9 years) were from a male, female, and a shark of unknown sex, respectively. In the GOM, 4415 sharks were tagged, and 130 of these tagged sharks were recaptured (2.9%), yielding a total of 4545 blacktip shark captures. The highest values for maximum displacement (632 n. mi.), maximum speed (16.4 n. mi./day), and maximum time at liberty (7.8 years) were from female sharks. In the International Atlantic, 493 sharks were tagged, and 15 of these tagged sharks were recaptured in the same region (3.0%), yielding a total of 508 captures. The highest values for maximum displacement (215 n. mi.) and maximum speed (0.5 n. mi./day) were from females, but the maximum time at liberty (2.6 years) was from a male. Distribution of recaptures by time at liberty, displacement, and speed is displayed in Figure 3. The shark with the longest time at liberty (7.8 years) was a juvenile female tagged near Galveston, Texas that was recaptured 632 nautical miles away in the waters off Veracruz, Mexico. The fastest moving shark was a YOY female that was tagged off Padre Island, Texas and recaptured near Veracruz, Mexico, traveling 459 nautical miles in 28 days (16.4 n. mi./day). The 2 sharks with the largest displacement were YOY males tagged by a NMFS biologist at the British Virgin Islands and recaptured 1043 and 1089 n. mi. away off Cape Canaveral, FL and Jekyll Sound, GA, respectively. Mean displacement of blacktip sharks at liberty for less than 1 year are displayed by region in Figure A-7. Sharks tagged as juveniles had the largest mean displacement in all 3 regions. 12
31 Blacktip sharks measuring approximately cm FL were the most frequently caught size group, corresponding to the boundary between YOY and juvenile categories (Figs. 2-4 and Figs. A-8-10). The smallest shark categorized as a YOY was caught in the GOM, and was measured as 32 cm FL. The largest measured male and female were 160 and 166 cm FL in the GOM, and cm FL in the U.S. Atlantic, and 134 and 166cm FL in the International Atlantic, respectively. The largest 2 sharks with estimated lengths were females estimated at 190 cm FL (1 from the GOM and 1 from the U.S. Atlantic). The CSTP database included a combination of effort from recreational fishermen, biologists, and commercial fishermen. Recreational landings were more common than those specifically identified as commercial. Biologists also tagged many sharks in the GOM, but most of the tagging was done by recreational fishermen (Table A-4). The number of sharks tagged by biologists increased dramatically in the 2000s (Figs. A-11-12). The temporal trends in the fishing industry (Figs. A-11-12) were mirrored by temporal trends in gear (Figs. A-13-14). In the U.S. Atlantic, the 3 most common sets of gear for captures were rod and reel (n=2144), longline (n=1659), and gill net (n=216) (Table A-5). Rod and reel captures increased moderately through the 1990s and 2000s, whereas longline captures increased dramatically in the 2000s (Fig. A-13). Blacktip sharks in the GOM were also predominantly caught by rod and reel (n=3278), longline (n=1110), and gill net (n=134). The 1980s and 1990s were dominated by rod and reel captures, whereas longline captures increased in the 2000s. 13
32 Sharks were also caught in smaller numbers (n<20) with handline, otter trawl, beach seine, set line, and hand landing net. Male blacktip sharks have not yet been tagged in certain areas off Florida, Tamaulipas and Veracruz (Figs. 5-7 and Figs. A-15-20). Blacktip sharks seemed to remain strictly within the 200m depth contour. Larger sharks have been tagged in both nearshore and continental shelf waters within this range, but YOY were almost exclusively found close to shore (Figs and Figs. A-21-26). YOY were present along most of the U. S. Gulf of Mexico coastline, with exceptions in parts of Florida and Louisiana (Figs. A-27-35). This trend may have simply reflected reduced effort in these areas. Almost all of these sharks were caught near the shore. No movement was observed between the west GOM, east GOM, and U.S. Atlantic (Figs and Figs. A-36-41). However, sharks of all 3 life stages migrated from U. S. to Mexican waters in the Gulf of Mexico (Fig. A-39). Of the 130 sharks that were tagged and recaptured in the GOM, only 32 were recaptured in an older life stage than tagged (25%); the majority of sharks were recaptured within the same life stage. Similarly, of the 81 sharks tagged and recaptured in the U.S. Atlantic, 19 were recaptured in an older life stage (23%). In the International Atlantic, 3 of the 15 recaptured sharks were recaptured in an older life stage (20%). Survival In analysis 1, survival models were constructed with an age effect, differentiating between YOY and post-yoy groups (designated by a g in the model structure). The most parsimonious model S(..) r(g+effort) had 2.38 times more weight 14
33 than the next best model S(g.) r(g+effort) and times more weight than S(g.) r(.effort) (Table A-6). Likelihood ratio tests determined the significance of various effects in the GOM YOY vs. post-yoy analysis (Tables A-7-8). No tests were significant for the interaction of age group and time for recovery probability, r(g*t), or survival, S(g*t). However, 7 out of 14 possible tests were significant for S(g), 5 out of 14 for S(t), 8 out of 10 for r(effort), and 5 out of 10 for r(t). All LRT s were significant for r(g). The first comparison in each section of Tables A-7-8 displays the simplest model that contains the parameter of interest. These comparisons are particularly useful in hypothesis testing. By only considering the simplest LRT s, r(effort), r(g), and S(g) were significant effects. Therefore, survival and recovery probabilities were significantly different for YOY and post-yoy, and effort is a significant factor in recovery probability in this analysis. In analysis 2, post-yoy data were modeled with male and female groups. The most parsimonious model S(..) r(.effort) had 2.64 times more weight than the next best model, S(g.) r(.effort) and 2.67 times more weight than S(..) r(g+effort) (Table A-9). The relevant likelihood ratio tests are given in Tables A No tests were significant for S(g), S(g*t), r(t) and r(g*t). However, 1 out of 14 tests was significant for S(t), 7 out of 10 for r(effort), and 4 out of 15 for r(g). By only considering the simplest LRT s, only r(effort) was a significant effect. Therefore, survival was not significantly different for male vs. female sharks, and effort is a significant factor in recovery probability in this analysis. In analysis 3, post-yoy data were modeled with groups representing the west GOM and east GOM. The most parsimonious model S(..) r(.effort) had 2.64 times 15
34 more weight than the next best model S(g.) r(.effort) and 2.67 times more weight than S(..) r(g+effort) (Table A-12). The relevant likelihood ratio tests are shown in Tables A No tests were significant for S(g), S(g*t), r(t), or r(g*t). However, 3 out of 14 tests were significant for S(t), 8 out of 10 tests were significant for r(effort), 6 out of 15 tests were significant for r(g). By only considering the simplest LRT s, only r(effort) was a significant effect. Therefore, survival was not significantly different for post-yoy sharks from the west GOM vs. those from the west GOM. Effort was a significant factor in recovery probability in this analysis. In analysis 4, post-yoy data were then modeled with groups in the Atlantic and GOM. The most parsimonious model S(..) r(g+effort) had 1.53 times more weight than the next best model, S(g.) r(g+effort), and times more weight than S(..) r(..) (Table A-15). The relevant likelihood ratio tests are displayed in Tables A No tests were significant for S(g). However, 7 out of 12 tests were significant for S(t), 1 out of 6 for S(g*t), 4 out of 5 for r(effort), 3 out of 10 for r(g), 4 out of 10 for r(t), and 1 out of 5 for r(g*t). By only considering the simplest LRT s, S(g*t), r(effort), and r(t) were significant effects. Therefore, there was no evidence that survival was significantly different for post-yoy sharks from the GOM vs. those from the U.S. Atlantic. However, effort and time significantly affected recovery probability in this analysis. The interaction between group and time on survival is significant, but it cannot be easily interpreted. The average ĉ values generated from the deviance ĉ and mean ĉ are provided in Table 8. All average ĉ values were less than 3, indicating that the models fit the 16
35 data adequately. Recovery probability ranges for the most parsimonious models are also given in Table 8. DISCUSSION The extensive spatial and temporal span of data in the CSTP provides a unique opportunity to describe the biology and ecology of the species within the program. Specifically, the data gathered provide unique insights into size, spatial distribution, movement, and changes in fishing industry and gear over time. Of course, one of the most substantial contributions of this database is its ability to provide direct estimates of survival. Size With the large sample size of the CSTP, it was possible to observe a wide range of size estimates. In the GOM, 2.4% of males and 1.2% of females in the CSTP were larger than the largest sharks observed by Clark and Von Schmidt (1965). Similarly, in the U.S. Atlantic, 4.2% of males and 3.8% of females in the CSTP were larger than the largest sharks observed by Castro (1996). Excluding the 7 sharks specifically listed as embryos, 40 of the YOY tagged in the CSTP were smaller than the smallest neonate size observed by Branstetter (1981) and Castillo-Géniz et al. (1998) (range: cm FL). These 40 YOY were evenly distributed throughout the east and west Gulf coasts, and 22 of these 40 (including the smallest) were measured, not estimated lengths. These authors sampled sharks with the same types of gear (gillnet, longline, and rod and reel) as the CSTP. We are therefore encouraged to expand the perceived size range of this species. 17
36 Spatial Distribution Some have reported the presence of blacktip sharks in water over 800 m deep (Garrick, 1982; Russell, 1993). However, the Gulf of Mexico blacktip sharks in the CSTP seemed to remain strictly within the 200 m depth contour (Figs. 5-6). There was extensive fishing effort from the CSTP in deeper waters; other species were commonly reported in mid-gulf waters in the CSTP (Kohler et al., 1998). It is therefore likely that blacktip sharks rarely venture into water deeper than 200m. Accounts of blacktip shark in water deeper than 800m seem to be the exception, not the rule, to their behavior. The location of YOY and pregnant females can be useful for the identification of nurseries. In the CSTP, YOY were almost exclusively found close to shore (Figs. A-27-35). These data further support the idea that blacktip shark juveniles spend the first few months of their lives in nurseries close to shore (Castro, 1993; Heupel and Simpfendorfer, 2002; Heupel et al., 2007). While pregnant and embryo blacktip sharks were generally found close to shore, there were also exceptions to this behavior. A mother of 3 embryos (each measuring 41 cm FL) off Louisiana was caught very close to the 200 m depth contour (Fig. A-32). The date of capture for this event was January 3 rd, several months before the expected time of parturition. Similarly, 2 YOY were found very close to the 200 m depth contour off the Florida Keys (Fig. A-31). However, these YOY were still relatively close (<15 nautical miles) to land. 18
37 Movement For the purposes of effective population management, it is desirable to determine the extent of exchange within and among water bodies in the northwest Atlantic. Genetic work by Keeney et al. (2003) implied that the U.S. Atlantic waters and the Gulf of Mexico represented 2 distinct populations, while Ryburn 9 suggested that sharks from the 2 areas interbreed. None of the Gulf of Mexico blacktip sharks migrated out of the Gulf to the Caribbean or Atlantic (Figs ). By comparison, CSTP data indicated that other sharks have well-established exchange patterns between Gulf and Atlantic waters (Kohler et al., 1998). However, the CSTP data currently suggest that the Gulf blacktip sharks do not mix with those from the Atlantic. This data set continues to support the decision to manage the Gulf of Mexico and Atlantic blacktip sharks as 2 separate stocks (NOAA/NMFS 4 ). Exchange was also not observed between the west and east Gulf of Mexico in the CSTP. Limited genetic data suggest that the east and west Gulf of Mexico are 2 separate populations of blacktip sharks, although they are currently managed as 1 population (Keeney et al., 2005; NOAA/NMFS 4 ). If the Gulf truly contains 2 stocks, the CSTP data suggest that eastern Louisiana (approximately 89 W longitude) may be the location of this natural boundary; no recaptures have been observed across this line. An exchange of blacktip sharks was observed between Mexican and U.S. waters within the Gulf of Mexico (Fig. 12). Blacktip sharks of all ages (n=35) 9 Ryburn J.A Inter-oceanic divergence and speciation in Carcharhinus plumbeus, Carcharhinus limbatus and Carcharhinus falciformis inferred from mitochondrial DNA sequence. Master s thesis. Iowa State University. 19
38 migrated south from the waters of Texas and Louisiana to Tamaulipas, Veracruz, Tabasco, and Campeche. Most (n=33) of these recaptures occurred within a time at liberty of less than 1 year, and the shortest such migration was 103 nautical miles in 11 days. Interestingly, 3 sharks that were born off Texas arrived in southern Veracruz as YOY (i.e., less than 56.6cm FL). One male also made a remarkable journey from Louisiana to Campeche. If this shark remained within the 200m depth contour for the entire journey, he would have traveled 1,090 nautical miles (over a maximum time period of 4.4 years). While exchange between the GOM and Atlantic was not observed, 4 sharks crossed the U.S. EEZ between U.S. and International waters of the Atlantic Ocean (Table 7). Two of these sharks were recaptured over 1000 nautical miles away from their tagging location (Fig. 13). These recaptures are the first documented evidence that blacktip sharks can travel this far, and that exchange exists for blacktip sharks between the U.S. coastal waters and those of the Caribbean. A NMFS biologist identified the 2 males as blacktip sharks, ensuring positive identification. Migration Research Integration and Synthesis On the eastern U.S. coast, blacktip sharks spend the winter in the waters of southern Florida, migrate to the Carolinas and Georgia in the spring to breed and give birth, and return to their wintering grounds in the fall (Castro, 1996). The seasonal movement of blacktip sharks within the GOM, however, is not fully understood. Sharks in the western and eastern GOM may have separate yearly north-south migration cycles, similar to those in the U.S. Atlantic waters (Branstetter, 1981; Killam 6 ; Castillo-Géniz et al., 1998; Heupel and Simpfendorfer, 2002). Genetic work 20
39 suggests that females are philopatric for their natal nurseries, but it is possible that males contribute to genetic exchange between regions (Hueter et al., 2005; Keeney et al., 2005). The migration cycle in the western GOM is especially interesting because the CSTP provides strong evidence of exchange with Mexican waters. It is believed that blacktip sharks in the western GOM spend the spring and summer months in the northern coastal waters for mating and breeding (Branstetter 10 ). Nursery habitat can be found from Sabine Lake to Lower Laguna Madre, Texas (McCandless et al., 2002; Keeney et al., 2005). Gravid females have also been caught from April to September in the waters of Matamoros, near the Texas-Mexico border (Castillo-Géniz et al., 1998). Therefore, the entire coast of Texas represents the starting point for these newly born blacktip sharks. In the fall, blacktip sharks of all ages are believed to move south to warmer water (Branstetter 10 ). Castillo-Géniz et al. (1998) note increased catches in Mexican waters late in the year, due to annual southward migration. Blacktip sharks are most common in Tamaulipas in October-December, and Veracruz in November-May (Castillo-Géniz et al., 1998). It may be inferred that the sharks pass through Tamaulipas and spend winter in the warmer waters of Veracruz, Tabasco, and Campeche. This hypothesis is consistent with the observation that blacktip sharks are generally rare in Tamaulipas, but very common in Veracruz (Bonfil, 1997). Despite the observation that US-born YOY migrate to Mexican waters, not all 10 Branstetter, S. G Biological parameters of the sharks of the northwestern Gulf of Mexico in relation to their potential as a commercial fishery resource. PhD Dissertation. Texas A&M University, Corpus Christi, TX. 21
40 blacktip sharks in Mexican waters are originally born U.S. waters. Nurseries have been documented in Campeche and Quintana Roo, Mexico (Bonfil, 1997; Castillo- Géniz et al., 1998). One can infer that blacktip sharks caught in Mexican waters during the winter represent a mixture of Mexican-born and US-born sharks. Tagging data are lacking in southern Gulf waters. Very few sharks have been tagged in Mexican waters in the CSTP, so the sharks movements after arriving in Mexico are unknown. Researchers at Mote Marine Laboratory reported westward movement of blacktip sharks from the northeast Yucatan Peninsula (Tyminski et al. 11 ). This may further suggest that western Gulf blacktip sharks stay in the western Gulf, instead of crossing into eastern waters. This analysis of Gulf of Mexico blacktip sharks is not without limitations. Movement data are only based on 2 points of reference (i.e., mark and recapture). GPS tags would provide a more continuous record of animal movement. In addition, the life stages assigned in the CSTP are approximated bins based on the shark s fork length. Biological indicators of life stage (e.g., healing of the umbilical scar, condition of the clasper, etc ) are not recorded by CSTP volunteers. These life stages are not intended to serve as absolute descriptions of life stage. Change in Effort Over Time Blacktip shark landings in the U.S. Atlantic were dominated by recreational fishing from 1981 through 1990 (Fig. A-42). Commercial landings increased dramatically in 1991, and dominated the catch until Both sources have 11 Tyminski, J., C. Simpfendorfer and R. Hueter Results of Mote Marine Laboratory Shark Tagging Program for blacktip (Carcharhinus limbatus) and sandbar (C. plumbeus) sharks. SEDAR 11 LCS05/06-DW p. 22
41 contributed more or less evenly since 1999 (NOAA/NMFS 4 ). In the GOM, fishing effort has been a combination of Mexican, recreational, and commercial sources, with the highest contributor varying from year to year (Fig. A-42). Mexico was the greatest contributor of blacktip shark landings in the GOM in Recreational landings exceeded commercial landings from 1981 through 1987, with a maximum in Commercial landings reached a maximum in 1988 to Landings in all categories have shown an overall decline from 1990 through the present (NOAA/NMFS 5 ). By 2010, recreational fishing had become the greatest source of fishing mortality in the GOM (NOAA/NMFS 5 ). The temporal trend of fishing industry in the CSTP (Fig. A- 11) roughly matches that listed in the SEDAR SAR (Fig. A-42). Comparing the east and west GOM, similar trends in capture history were observed. Recreational captures were more common in the 1990s, whereas biologist captures were the most substantial contributor in the early 2000s (Fig. A-12). During the period of study, fishing mortality rate was much lower in the Atlantic (average F=0.003) compared with that in the GOM (average F=0.047). In the GOM, F was highest in the 1990s, but never reached F MSY of (Fig. A-3). Effort and catches decreased through the early 2000s, so that F current is (NOAA/NMFS 5 ). As of 2006, only about 8-23% of the virgin stock size was depleted in the GOM (NOAA/NMFS 4 ). The SEDAR SAR concluded on the basis of these data that neither the Atlantic nor GOM stock was overfished (NOAA/NMFS 4 ). Survival The 4 assumptions of the Seber parameterization are: (1) all marked animals present at time (i) have the same probability of surviving to time (i+1) and the same 23
42 recapture probability, (2) sampling is an instantaneous processes, relative to the time interval between occasions (i) and (i+1), (3) tagged cohorts are thoroughly mixed, and (4) tags are not lost or missed. If there were a difference in survival probability or recapture probability due to age (assumption 1), this difference needed to be addressed (Simpfendorfer et al., 2005b). Therefore, the data were first modeled with YOY vs. post-yoy groups, to determine if such a difference existed. Assumption 3 (mixing of cohorts) was investigated because genetic work has suggested that the east GOM, west GOM, and U.S. Atlantic may represent distinct populations of blacktip sharks (Keeney et al., 2003; Keeney et al., 2005). No exchange of blacktip sharks has been observed to date between these 3 areas. Recaptures in these 3 regions were analyzed for nonmixing with a χ 2 contingency table (Latour et al., 2001). This test did not require evidence of exchange between geographic areas; it simply determined if the number of recaptures in each region differed significantly from what would be expected if cohorts were thoroughly mixed. Due to the sparseness of the data, recapture cohorts were binned into 5-year groups ( , , etc..). With 2 degrees of freedom, 5 out of 6 tests did not indicated significant evidence of nonmixing (P=0.36, 0.52, 0.58, 0.54, and 0.31). However, the final test ( ) was marginally significant (P=0.05), indicating some evidence for a lack of mixing in those years. The number of recaptures was small (n<20) for every combination of region and cohort, so these results may be affected by the sparseness of the data. Regardless of χ 2 test results, it is possible to determine post-facto whether survival in these geographic areas is significantly different. According to the simplest 24
43 likelihood ratio tests, geographic grouping had no effect on either survival or recovery probability (Table 9). Satellite tags would be necessary to definitively determine if tagged cohorts are thoroughly mixed. Nevertheless, the CSTP data demonstrate that the survival is not significantly different among the east GOM, west Gulf of Mexico, and U.S. Atlantic. In order to correct for assumption (4), the final true survival estimate is given by the equation S T =S(1-Λ) -1 where S T is the true survival estimate, S is the apparent survival probability, and Λ is the instantaneous tag-shedding rate. A double-tagging experiment is ongoing in the NMFS CSTP, but the results of this experiment are not yet available. There are several different types of tags used in mark-recapture research; tag-shedding rates should be based on the type of tag under consideration (Xiao et al., 1999). Wood et al. (2007) developed a proxy tag-shedding rate (an instantaneous rate of yr -1 ) specifically designed for the type of tag used in the CSTP. This proxy was calculated as weighted mean tag-shedding rate based on tuna-tagging experiments. Due to the slower cruising speed and thicker skin of blacktip sharks (compared to tuna), the proxy tag-shedding rate likely represents a maximum value for blacktip sharks. Therefore, corrected survival estimates are likely maximum estimates as well. Airesda-Silva et al. (2009) investigated alternative values of Λ to be used with data from the CSTP; the S T estimates generated from varying Λ are given in Table 10. This survival analysis provided two useful types of information: tests of significance for various effects on survival and recovery, and direct estimates of 25
44 survival. Likelihood ratio tests supported the conclusion that YOY and post-yoy have different survival probabilities (Table 9). There was no evidence for significant differences in survival based on sex or geographic region within the GOM. These findings were encouraging, because they were consistent with current NMFS policy to manage the entire GOM as 1 stock (NOAA/NMFS 4 ; NOAA/NMFS 5 ). However, genetic work suggested that the Atlantic and GOM are 2 distinct populations (Keeney et al., 2003; Keeney et al., 2005). Therefore, it was interesting that there was no significant difference in survival between the Atlantic and GOM. It is possible that the small sample size of recaptures only permits the detection of large differences in survival. Likelihood ratio tests were also used to investigate the significance of different effects on recovery probability (Table 9). Recovery probability was different for YOY vs. post-yoy, but not significantly affected by other grouping schemes. In every analysis, recovery probability was significantly affected by fishing effort. These results underscore the need to account for changes in fishing effort in any future studies in the CSTP. True survival estimates were generated after correcting for tag-shedding rate (Table 8). In analysis 1 (YOY vs. post-yoy), the model S(..) r(g+effort) was the most parsimonious model with a corrected age-constant survival of Likelihood ratio tests determined that there was a significant age effect on survival and recovery probability in this analysis, and that fishing effort had a significant effect on recovery probability (Table 9). Therefore, the second most parsimonious model S(g.) r(g+effort) was also found to be valuable for management purposes. In this model, 26
45 corrected post-yoy survival was 0.725, whereas YOY survival was Time did not have an effect on survival or recovery probability, on the basis of LRT. Similarly, there was no significant interaction between group and time for either survival or recovery probability. The estimate of survival for GOM post-yoy in analysis 1 (0.725) did not exactly match the corresponding estimates from analyses 2, 3, and 4 (0.814, 0.781, and 0.781, respectively) (Table 8). Differences between these estimates were caused by differences in data input. Analysis 2 did not include any sharks of unknown sex, resulting in a slightly different estimate of survival. Analyses 3 and 4 only included sharks that were tagged as post-yoy, and they both yielded the same estimate. Analysis 1 included YOY that were assumed to mature into post-yoy after 1 year; this additional source of data resulted in the narrowest of the 4 confidence intervals. For this reason, is the preferred estimate of post-yoy survival. Several authors have suggested that survival is lowest in the first year of life for fish in general, and elasmobranchs specifically (Caley, 2006; Hoenig and Gruber, 1990; Manire and Gruber, 1993; Simpfendorfer 1999). Manire and Gruber (1993) provided an empirical estimate of YOY survival as low as 0.36 to 0.55 for lemon sharks in Bimini, Bahamas. Why does survival appear to be so low for YOY? It is possible that inexperienced young sharks are more vulnerable to predation or less effective at foraging (Branstetter, 1990; Simpfendorfer et al., 2005b). Alternatively, survival of YOY may appear to be low due to emigration from the studied area. If juvenile sharks are dispersing from the Gulf of Mexico, it would be impossible to determine whether those sharks died or emigrated. 27
46 Survival estimates can only take values from 0 to 1. Confidence intervals for all original survival estimates fell within these limits. However, when confidence intervals were corrected for tag-shedding rate, some values were inflated to impossibly high values ( 1). It is possible that the true tag-shedding rate in blacktip sharks is lower than the proxy value of (Table 10). A larger sample size would also ensure that confidence interval boundaries were between 0 and 1. The effects of sex and geographic location were intentionally tested for post- YOY only. Combining YOY and post-yoy in these analyses would have confounded the effects that were being investigated. Because direct estimates of YOY survival have already been conducted with robust methods (Heupel and Simpfendorfer, 2002), it was more appropriate to test these group differences in post- YOY sharks. This experimental design allowed a more definitive investigation of the significance of group effects through LRT. The corrected survival estimates provided were consistent with those already published. The survival for age 0 blacktip sharks used in management is 0.52, based on the direct estimate by Heupel and Simpfendorfer (2002) (NOAA/NMFS 4 ). The YOY survival estimate from analysis 1 (0.580) was slightly higher than this value. Whereas the CSTP included a full size range of YOY, Heupel and Simpfendorfer (2002) studied a narrower subset of smaller neonate sharks (i.e., those with an open umbilical scar and a mean TL of 62 cm). This difference in data source likely caused the small apparent discrepancy between these 2 estimates. Prior to this paper, the only estimates of adult survival for blacktip sharks have been from indirect methods based on life history parameters. Cortés (1998) reported a 28
47 survival of Cortés and Brooks 7 calculated average survival for blacktip sharks based on 11 indirect methods. The average survival ranged from 0.70 to 0.78 for the GOM and 0.75 to 0.82 for the Atlantic (Cortés and Brooks 7 ). A more realistic average S (based on age-specific methods only) ranged from 0.71 to 0.81 for the GOM and 0.75 to 0.85 for the Atlantic. The CSTP estimate of post-yoy survival in the GOM (0.725) fits within these all of these ranges, but the Atlantic estimate (0.933) was slightly higher than that given by Cortés and Brooks 7. In 2006, NMFS tentatively accepted the average mortalities from Chen and Watanabe (1989) and Lorenzen (1996) weight-based indirect methods as developed by Cortés and Brooks 7 for post-yoy sharks. These mortalities were (S= ) for the GOM and (S= ) for the Atlantic (NOAA/NMFS 4 ). These mortalities were judged to be unrealistic by the SEDAR 11 review panel, because they were too high to maintain a self-sustaining population. As a result, the age 0 survival was increased from 0.52 to 0.75 and the post-yoy natural mortalities were decreased to a range of (S= ) for the GOM and (S= ) for the Atlantic (NOAA/NMFS 4 ). In 2012, life history and natural mortality values were updated for the GOM using a combined dataset from Carlson et al. (2006) and Passerotti and Baremore 12 (NOAA/NMFS 5 ). Age-specific values of instantaneous natural mortality were calculated from the methods of Hoenig (1983), Chen and Watanabe (1989), Peterson 12 Passerotti, M. S. and I. E. Baremore Updates to age and growth parameters for blacktip shark, Carcharhinus limbatus, in the Gulf of Mexico. SEDAR29-WP-18. SEDAR, North Charleston, SC. 12 p. 29
48 and Wroblewski (1984) and Lorenzen (1996). To ensure that calculated M values allowed for positive population growth, the minimum of these 4 estimates was used. Values of instantaneous M for ages 1 through 18 ranged from to 0.134, respectively (S= ). Total instantaneous mortality (Z) is the sum of natural mortality (M) and fishing mortality (F). Proportional survival is related to Z by S=e -z (Quinn and Deriso 1999). If post-yoy survival was in the GOM, Z was Given a fishing mortality ranging from to 0.073, natural mortality was relatively high ( ). Similarly, in the Atlantic, a survival of yielded a total mortality of If fishing mortality rate ranged from to in the Atlantic, natural mortality would be It appears that fishing mortality made up a very small proportion of overall mortality in these stocks. Given the relatively high rate of natural mortality, future studies may be able to determine the relative contribution of cannibalism, predation from other sharks, disease, old age, and other factors in this natural mortality. It is known that adult blacktip sharks (up to 180 cm TL) have been attacked by even larger sharks (Dodrill 13 ). It is likely, therefore, that predation continues to contribute to natural mortality into older age. Recent studies have investigated the evolutionary impact of size-selective fisheries (Conover and Munch, 2002; Olsen et al., 2004; Heino and Dieckmann 14 ). 13 Dodrill, J. W A hook and line survey of the sharks of Melbourne Beach, Brevard County, FL. M.S. Thesis, Florida Institute of Technology, Melbourne, FL. 304 pp. 14 Heino, M., and U. Dieckmann. Fisheries-induced selection as a driver of biodiversity change in exploited populations. ICES. CM 2007/E:17. 5 p. 30
49 These changes often resulted in decreasing length at maturity; evidence has suggested that this phenomenon has also occurred in elasmobranchs (Sminkey and Musick, 1995; Carlson and Baremore, 2003; Cassoff et al. 2007). Carlson et al. (2006) suggested that size at maturity has decreased for blacktip sharks in the Gulf of Mexico in a span of years (Carlson et al., 2006). If there was a real decrease in size-atmaturity in blacktip sharks, some juvenile sharks from the early years of the program were categorized as mature according to the modern size at maturity. If future survival analyses differentiate between juvenile and mature sharks, this potential life history change may negatively affect the results. Because specific data on the magnitude of these changes is limited, it would be beneficial to analyze survival based on length, instead of life stage. The usefulness of this survival analysis is limited by the broad categorization of sharks into groups such as YOY and post-yoy. Unfortunately, it is not possible to further refine post-yoy estimates into juvenile vs. mature groups, due to ambiguity in the coding of juvenile shark parameters. It was assumed that YOY became post-yoy after 1 year s time, but juvenile sharks may take 1-4 years to become mature (Carlson et al., 2006). Because of the inherent variation in size and maturity at age (and because estimates of age in the CSTP are originally based on length measurements), a length-based model may be more appropriate for future work. Program MARK has already been used to calculate survival directly in some elasmobranchs (Rodríguez-Cabello and Sánchez, 2005; Wood et al., 2007). Despite the relatively low sample size for blacktip sharks, it was possible to effectively model survival. As a result, survival estimates for YOY and post-yoy blacktip sharks were 31
50 calculated from direct methods, and likelihood ratio tests determined that there is a significant effect of age group on survival and recovery probability. CONCLUSIONS No movement has been observed to date between the west Gulf of Mexico, east Gulf of Mexico, and U.S. Atlantic in the CSTP. However, 2 sharks tagged in the U.S. Virgin Islands were recaptured off Florida and Georgia, traveling over 1000 nautical miles. This paper provides evidence that finite survival differs between YOY and post-yoy blacktip sharks. There is no evidence that survival varies between males and females, or among the west GOM, east GOM, or U.S. Atlantic. However, it is possible that only relatively large differences in survival would be detectable with the sample size in the CSTP. Corrected direct estimates of survival were consistent with indirect estimates for YOY (S=0.580) and post-yoy (S=0.725). This positive result demonstrates that direct estimates of survival (and related analysis) can be successfully performed for species with smaller sample size in the CSTP. ACKNOWLEDGEMENTS This work benefited significantly from the innovative ideas, valuable feedback, and technical support of David Bengtson, Graham Forrester and Ruth Briggs. We are very thankful to the countless biologists, fishery observers, recreational fishermen and commercial fishermen who voluntarily contributed to this database. LITERATURE CITED Aires-da-Silva, A.M., M.N. Maunder, V.F. Gallucci, N.E. Kohler, and J.J. Hoey A spatially structured tagging model to estimate movement and fishing mortality rates for the blue shark (Prionace glauca) in the North Atlantic Ocean. Mar. Freshwater. Res. 60:
51 Anderson, D. R., K. P. Burnham, and G.C. White Problems in estimating agespecific survival rates from recovery data of birds ringed as young. J. Anim. Ecol Bonfil, R Status of shark resources in the southern Gulf of Mexico and Caribbean: Implications for management. Fish. Res. 29: Branstetter, S. G Biological notes on the sharks of the north central Gulf of Mexico. Contrib. Mar. Sci. 24: Branstetter, S. G Early life-history implications of selected carcharhinoid and lamnoid sharks of the Northwest Atlantic. In H. Pratt, S. Gruber and T. Taniuchi (Eds.), Elasmobranchs as Living Resources: Advances in the Biology, Ecology, Systematics, and the Status of the Fisheries. NOAA Technical Report NMFS, 90: Brownie, C., D.R. Andersen, K. P. Burnham, and S. Robson Statistical Inference from Band Recovery Data- A handbook, 2nd edn. Washington, DC: U.S. Fish and Wildlife Service Resource Publications. 44 p. Caley, M. J Age-specific mortality rates in reef fishes: Evidence and implications. Aust. J. Ecol 23: Carlson, J. K. and I. E. Baremore Changes in biological parameters of Atlantic sharpnose shark Rhizoprionodon terraenovae in the Gulf of Mexico: evidence for density dependent growth and maturity? Mar. Freshwater Res. 54: Carlson, J. K., J. R. Sulikowski and I. E. Baremore Do differences in life history exist for blacktip sharks, Carcharhinus limbatus, from the United 33
52 States South Atlantic Bight and eastern Gulf of Mexico? Environ. Biol. Fishes 77: Cassoff, R. M., S. E. Campana, and S. Myklevoll Changes in baseline growth and maturation parameters of Northwest Atlantic porbeagle, Lamna nasus, following heavy exploitation. Can. J. Fish. Aquat. Sci. 64: Castillo-Géniz, J. L., J. F. Márquez-Farias, M. C. Rodriguez de la Cruz, E. Cortés, and A. Cid del Prado The Mexican artisanal shark fishery in the Gulf of Mexico: towards a regulated fishery. Mar. Freshwater Res. 49: Castro, J The shark nursery of Bulls Bay, South Carolina, with a review of the shark nurseries of the southeastern coast of the United States. Environ. Biol. Fishes 38: Castro, J Biology of the blacktip shark, Carcharhinus limbatus, off the southeastern United States. Bull. Mar. Sci. 59: Chen, S. and S. Watanabe Age dependence of natural mortality coefficient in fish population dynamics. Nippon Suisan Gakkaishi, 55: Clark, E. and K. Von Schmidt Sharks of the central Gulf coast of Florida. Bull. Mar. Sci. 15: Conover, D. O., and S. B. Munch Sustaining fisheries yields over evolutionary time scales. Science, 297: Cortés, E Demographic analysis as an aid in shark stock assessment and management. Fish. Res. 39: Deriso, R. B., T. J. Quinn, and P. R. Neal Catch-age analysis with auxiliary information. Can. J. Fish. Aquat. Sci. 42:
53 Endler, J. A Natural selection in the wild. Monographs in Population Biology. Princeton: Princeton University Press. 339 p. Garrick, J. A. F Sharks of the genus Carcharhinus. NOAA Tech. Rep. NMFS Circular 445, 194p. Grace, M. and T. Henwood Assessment of the distribution and abundance of coastal sharks in the U.S. Gulf of Mexico and Eastern Seaboard, 1995 and Mar. Fish. Rev. 59: Heupel, M. R. and C.A. Simpfendorfer Estimation of mortality of juvenile blacktip sharks, Carcharhinus limbatus, within a nursery area using telemetry data. Can. J. Fish. Aquat. Sci. 59: Heupel, M. R., J. K. Carlson and C. A. Simpfendorfer Shark nursery areas: concepts, definition, characterization and assumptions. Mar. Ecol.-Prog. Ser. 337: Hoenig, J. M Empirical use of longevity data to estimate mortality rates. Fish. Bull. 82: Hoenig, J. M. and S. H. Gruber Life-history patterns in the elasmobranchs: implications for fisheries management. In H. L. Pratt Jr., S. H. Gruber, and T. Taniuchi (Eds.), Elasmobranchs as Living Resources: Advances in the Biology, Ecology, Systematics, and the Status of the Fisheries. NOAA Tech. Rep. NMFS 90, 16 p. Hueter, R.E., M.R. Heupel, E.J. Heist, and D.B. Keeney Evidence of philopatry in sharks and implications for the management of shark fisheries. J. Northwest Atl. Fish. Soc. 35:
54 Hutchings, J. A Adaptive life histories affected by age-specific survival and growth rate. Ecology, Keeney D. B., M. Heupel, R. E. Hueter, and E. J. Heist Genetic heterogeneity among blacktip shark Carcharhinus limbatus, continental nurseries along the U.S. Atlantic and Gulf of Mexico. Mar. Biol. 143: Keeney, D. B., M. Heupel, R. E. Hueter and E. J. Heist Microsatellite and mitochondrial DNA analyses of the genetic structure of blacktip shark (Carcharhinus limbatus) nurseries in the northwestern Atlantic, Gulf of Mexico, and Caribbean Sea. Mar. Ecol. 14: Kohler N. E., J. G. Casey, and P. A. Turner NMFS Cooperative Shark Tagging Program, : An atlas of shark tag and recapture data. Mar. Fish. Rev. 60:1-87. Latour, R. J., J. M. Hoenig, J. E. Olney, and K. H. Pollock A simple test for nonmixing in multiyear tagging studies: application to striped bass tagged in the Rappahannock River, Virginia. Trans. Am. Fish. Soc. 130: Lebreton, J. D., K. P. Burnham, J. Clobert, and D. R. Anderson Modeling survival and testing biological hypotheses using marked animals: a unified approach with case studies. Ecol. Monogr. 62: Lorenzen, K A simple von Bertalanffy model for density-dependent growth in extensive aquaculture, with an application to common carp (Cyprinus carpio). Aquaculture, 142: MacArthur, R. W., and E. O. Wilson The theory of island biogeography. Princeton University Press, Princeton, N.J. 205p. 36
55 Manire, C. A., and S. H. Gruber A preliminary estimate of natural mortality of age-0 lemon sharks, Negaprion brevirostris. NOAA Tech. Rep. NMFS 115, 108 p. McCandless, C. T., H. L. Prat and N. E. Kohler Shark nursery grounds of the Gulf of Mexico and the east coast waters of the United States: an overview. NOAA s Highly Migratory Species Office, NOAA Fisheries Narragansett Lab. 287 p. Mollet, H. F. and G. M. Cailliet Comparative population demography of elasmobranchs using life history tables, Leslie matrices and stage-based matrix models. Mar. Freshwater Res. 53: Myers, R. A. and B. Worm Extinction, survival or recovery of large predatory fishes. Philos. Trans. R. Soc. Lond., Ser. B: Biol. Sci. 360: Olsen, E. M., M. Heino, G. R. Lilly, M. J. Morgan, J. Brattey, B. Ernande, and U. Dieckmann Maturation trends indicative of rapid evolution preceded the collapse of northern cod. Nature, 428: Peterson, I. and J. S. Wroblewski Mortality rate of fishes in the pelagic ecosystem. Can. J. Fish. Aquat. Sci. 41: Pratt, H. W. and J. G. Casey Shark reproductive strategies as a limiting factor in directed fisheries, with a review of Holden s method of estimating growth parameters. NOAA Tech. Rep. NMFS 90, 528 p. Quinn, T. J. and R. B. Deriso Quantitative Fish Dynamics. New York: Oxford University Press. 37
56 Ricker, W. E Computation and interpretation of biological statistics of fish populations. B. Fish. Res. Board Can. 191: Rodríguez-Cabello, C. and F. Sánchez Mortality estimates of Scyliorhinus canicula in the Cantabrian Sea using tag-recapture data. J. Fish Biol. 66: Russell, S. J Shark bycatch in the northern Gulf of Mexico tuna longline fishery, , with observations on the nearshore directed shark fishery. NOAA Technical Report NMFS 115, 108p. Seber, G. A. F Estimating time-specific survival and reporting rates for adult birds from band returns. Biometrika, 57: Seber, G. A. F The Estimation of Animal Abundance and Related Parameters, 2 nd edn. New York: MacMillan. 654 p. Sminkey, T. R. & J. A. Musick Age and growth of the sandbar shark, Carcharhinus plumbeus, before and after population depletion. Copeia, 1995: Simpfendorfer, C.A Mortality estimates and demographic analysis for the Australian sharpnose shark, Rhizoprionodon taylori, from northern Australia. Fish. Bull. 97: Simpfendorfer, C. A., G. G. Freitas, T. R. Wiley, and M. R. Heupel. 2005a. Distribution and habitat partitioning of immature bull sharks Carcharhinus leucas in a southwest Florida estuary. Estuar. Coast. 28:
57 Simpfendorfer C. A., R. Bonfil and R. J. Latour. 2005b. Mortality Estimation. In: Musick, J. A. and R. Bonfil (Eds.), Management techniques for elasmobranch fisheries. FAO Fisheries Technical Paper. No Rome, FAO. 2005b. 251p. Vetter, E. F Estimation of natural mortality in fish stocks: a review. Fish. Bull. 86: Walker, T Can shark resources be harvested sustainably? A question revisited with a review of shark fisheries. Mar. Freshwater Res. 49: White, G. C. and K. P. Burnham Program MARK: survival estimation from populations of marked animals. Bird Study 46: Wood, A. D., J. S. Collie and N. E. Kohler Estimating survival of the shortfin mako Isurus oxyrinchus (Rafinesque) in the north-west Atlantic from tagrecapture data. J. Fish Biol. 71: Xiao, Y., L. P. Brown, T. I. Walker, and A. E. Punt Estimation of instantaneous rates of tag shedding for school shark, Galeorhinus galeus, and gummy shark, Mustelus antarcticus, by conditional likelihood. Fish. Bull. 97:
58 TABLES 40
59 41
60 42
61 43
62 44
63 45
64 46
65 Table 10. Sensitivity analysis for S T as a function of varying Λ. Λ Analysis Model Group S(..) r(g+effort) S(g.) r(g+effort) YOY Post-YOY S(..) r(.effort) S(g.) r(.effort) Male Female S(..) r(.effort) S(g.) r(.effort) West GOM East GOM S(..) r(g+effort) S(g.) r(g+effort) Atlantic GOM

66 FIGURES Figure 1. Geographic regions used in analysis. 48
67 Figure 2. Distribution of recaptures according to time at liberty, displacement, and speed. 49
68 50 Figure 3. Length frequency by sex for blacktip shark captures in the U.S. Atlantic Ocean.

69 51 Figure 4. Length frequency by sex for blacktip shark captures in the Gulf of Mexico.
70 52 Figure 5. Length frequency by sex for blacktip shark captures in the International Atlantic Ocean.
71 53 Figure 6. Blacktip shark captures by sex in the U.S. Atlantic. The solid line represents the 200 m depth contour. The dashed line represents the U.S. EEZ.
72 54 Figure 7. Blacktip shark captures by sex in the GOM. The solid line represents the 200 m depth contour. The dashed line represents the U.S. EEZ.
73 55 Figure 8. Blacktip shark captures by sex in the International Atlantic. The solid line represents the 200 m depth contour. The dashed line represents the U.S. EEZ.

74 56 Figure 9. Blacktip shark captures by life stage in the U.S. Atlantic. The solid line represents the 200 m depth contour. The dashed line represents the U.S. EEZ.
75 57 Figure 10. Blacktip shark captures by life stage in the Gulf of Mexico. The solid line represents the 200 m depth contour. The dashed line represents the U.S. EEZ.

76 58 Figure 11. Blacktip shark captures by life stage in the International Atlantic. The solid line represents the 200 m depth contour. The dashed line represents the U.S. EEZ.
77 59 Figure 12. Blacktip shark recaptures by sex and life stage in the U.S. Atlantic. The solid line represents the 200 m depth contour. The dashed line represents the U.S. EEZ.

78 60 Figure 13. Blacktip shark recaptures by sex and life stage in the Gulf of Mexico. The solid line represents the 200 m depth contour. The dashed line represents the U.S. EEZ.
79 61 Figure 14. Blacktip shark recaptures by sex and life stage in the International Atlantic. The solid line represents the 200 m depth contour. The dashed line represents the U.S. EEZ.
80 APPENDICES APPENDIX I: Definition of Terms AIC: Akaike s information criterion, used for determining relative parsimony of a model, balancing overall fit with the number of parameters involved. AIC= -2ln(L) +2K, where K is the number of parameters Ĉ: the variance inflation factor, which indicates the degree of overdispersion (lack of fit) in the most general model Capture: any landing event, including both tags and recaptures CSTP: Cooperative Shark Tagging Program F: instantaneous fishing mortality rate Likelihood ratio test: a statistical significance test for estimates made under the maximum likelihood approach. Determined by comparing [deviance of reduced model-deviance of general model] with a χ 2 distribution with n degrees of freedom, where n is the difference in number of parameters M: instantaneous natural mortality rate Nested models: a reduced model is considered nested if it can be created by constricting a more general model (e.g., fixing a time-dependent parameter to become time-independent) NMFS: National Marine Fisheries Service Parametric bootstrap: a resampling technique used to determine Goodness of Fit (GOF). A model is created from the original data, and is used to simulate data. Proportional Survival (S): the probability of surviving from year (i) to year (i+1). S=N t+1 /N t = e -Z QAIC c : quasi-likelihood adjusted AIC. The AIC value that has been adjusted by ĉ Recovery probability (r): probability that a dead animal is both recovered and reported Recapture rate: the percent of tagged sharks that are recaptured S T : true survival estimate, corrected for tag-shedding rate. S T =S(1-Λ) -1 Tagging rate: the number of sharks that are tagged per year Tag-shedding rate (Λ): the instantaneous rate of tag shedding from year (i) to year (i+1) YOY: young of the year Z: instantaneous total mortality rate (Z=M+F) 62
81 APPENDIX II: Additional Background for Survival Reduced (Seber) Parameterization Survival was modeled with the reduced (Seber) parameterization (Seber, 1970; Anderson et al., 1985). Animals are tagged once, released, and recovered once; they are not re-released alive after recovery. In this model, S is the probability that the fish survives a time interval, and r is the probability that a dead fish is recovered and reported (Fig. A-1). If the number of animals released and recovered during each occasion is known, one can calculate estimates of these parameters based on the probability associated with each specific fate (Fig. A-1). The simplicity of the reduced parameterization is advantageous for the calculation of parameters. The disadvantage of the reduced parameterization is that S does not consider the source of mortality (natural vs. hunting/fishing). As a result, a fish that avoids natural mortality but is caught and reported has the probability (1- S)r. Therefore, survival from the Seber parameterization represents survival from all sources of mortality, including natural and fishing mortality. The probabilities S and r can be used to calculate expressions for the expected number of fish recovered in a given occasion. In the sample diagram in Figure A-43, three rows represent three years of marking, and three columns represent three years of recovery. In this diagram, N i is the number of individuals tagged in year i (i=1,2,, I), r i is the recovery probability in year i, and S i is the survival probability in year i. Estimates of S and r can also be modeled separately for young-of-the-year (YOY) and post-yoy. When investigating models with an age effect, S and r represent the post-yoy survival and recovery probability, respectively, while S * and 63
82 r * represent YOY survival and recovery probability, respectively. An animal that is marked and released as YOY is assumed to acquire the post-yoy parameters by the second year of its life. Therefore, probability expressions for sharks tagged as YOY include both YOY and post-yoy parameters (Fig. A-44). The triangular matrix of probability expressions corresponds to a triangular matrix of fish recovered in each element of that matrix. Recovery data are entered into program MARK using this classic recovery matrix format (Fig. A-2). In this format, n represents the number of fish recaptured, rows represent years of tagging (up to I years), and columns represent years of recovery (up to J years). A sample input file that was used in the analysis is shown in Figure A-45. Models were also fit with an external index of effort. It is known that F=qf, where F=fishing mortality rate, q=catchability coefficient, and f=fishing effort. If the catchability coefficient is assumed to be constant over time, fishing mortality rate (F) can be used as proxy for effort. Values of F are available specifically for Gulf of Mexico and U.S. Atlantic blacktip sharks from from the SEDAR 11 Stock Assessment Report (Fig. A-3). Therefore, the analysis was constrained to this time period. From 1986 to 2004, 3240 blacktip sharks were tagged in the CSTP in the GOM, and 96 of these were recaptured (2.96%). During the same time period, 1589 sharks were tagged in the U.S. Atlantic, and 38 were recaptured (2.39%). Calculation of Parameters To calculate parameter estimates, the observed recovery matrix is compared to matrix of probability expressions. Program MARK solves for the maximum likelihood estimates of S and r numerically (not algebraically). In maximum 64
83 likelihood methods, the true value of the parameter is unknown. However, there is a likelihood (probability) distribution for the value of the true parameter, given the observed data (Fig. A-46). Program MARK solves for the maximum likelihood, and its corresponding parameter value. The maximum likelihood estimate (MLE) of the parameter is the point where the likelihood distribution s first derivative is 0. The variance associated with a given parameter depends on the shape of the likelihood distribution. For example, two likelihood distributions may have the same MLE of survival, but different variances (Fig. A-46). A greater spread in the likelihood function implies greater variance. The profile likelihood method generates confidence intervals that are 0,1 bounded. In this method, possible parameter values are plotted on the x axis, and log-likelihood is plotted on the y axis. When α = 5%, the χ 2 value with 1 degree of freedom is With the profile likelihood approach, a y value is calculated by adding 1.92 (half of 3.84) to the log-likelihood at the maximum of the log-likelihood distribution (Fig. A-47). This y value intersects with the loglikelihood function at two points, and the x values at these intersections represent the 95% CI. The confidence interval in this method is not symmetrical around the MLE for the parameter, but it is always 0,1 bounded. Goodness of Fit (GOF) Models can only be successfully analyzed if they adequately fit the data. Deviance (difference in fit) is defined by the equation: deviance= -2(log-likelihood of model) [-2(log-likelihood of saturated model)], where the saturated model is the model with all possible parameters included. Considering the saturated model itself, the ratio of model deviance over the model s degrees of freedom is a measure of 65
84 overdispersion (lack of fit) in the model. This ratio is known as the variance inflation factor or quasi-likelihood parameter, ĉ (Cooch and White, 2004). Perfect fit is achieved when ĉ=1, whereas overdispersion or lack of fit occurs when ĉ>1. A parametric bootstrap approach can be used to estimate ĉ. In this method, the most general model is used to simulate data (capture histories) that fit all the assumptions of model. The model is then fit to each set of simulated data, and the model deviance and ĉ are calculated for each simulation. There are two ways to use bootstrap simulations to estimate ĉ. One method of calculating ĉ is based on deviance. The mean of all the simulated deviances represents the expected deviance when no assumptions are violated (and fit is perfect). Therefore, the estimate of ĉ is the ratio of the observed model deviance over the mean of all the simulated deviances. A ratio higher than 1.0 suggests a certain amount of overdispersion. Figure A-48 shows a visual representation of how this method was applied to the general model S(g*t) r(g*t) in the analysis of YOY vs. post-yoy. The second method of calculating ĉ is based on the simulated values of ĉ in the bootstrap. The mean of all the simulated ĉ represents the expected value of ĉ when fit is perfect. Therefore, the ratio of the observed model ĉ over the mean of all the simulated ĉ provides a similar measurement of overdispersion. Estimates from both methods were averaged to calculate the final value of ĉ in the analysis. The model fits the data adequately if ĉ 3 (Lebreton et al., 1992). Ranking Various models can be ranked using Akaike s Information Criterion, AIC. This metric is used for determining relative parsimony of a model, balancing overall fit 66
85 with the number of parameters involved (Akaike, 1973). AIC is defined by: AIC= - 2ln(L) +2K, where K is the number of parameters and L is the likelihood of the model, given the data. High likelihood results in a lower AIC; more parameters results in a higher AIC. As a result, a more parsimonious model has a lower AIC. AIC c is a variation of AIC that corrects for sample size (Sugiura, 1978; Hurvich & Tsai, 1989). AIC c is defined by: AIC c = -2ln(L) +2K + [2K(K+1)]/[n-K-1], where n is sample size The extra term in this definition creates a higher penalty for small sample size. QAIC c is another variation, known as the quasi-likelihood adjusted AIC (White and Burnham, 1999). QAIC c is defined by: QAIC c = [-2ln(L)]/ ĉ +2K + [2K(K+1)]/[n-K-1]. If ĉ >1, the contribution of the model likelihood term decreases, and the K penalty is relatively more powerful. Therefore, when ĉ >1, simpler models with fewer parameters become more favored. All models in the candidate set are ranked by QAIC c to identify the most parsimonious model. Any two models can be directly compared through ΔQAIC c, the difference in QAIC c between two models. If ΔQAIC c >7, there is strong support for a difference in the two models. If 2<ΔQAIC c <7, there is moderate support for a difference in the two models. If ΔQAIC c <2, there is very little support for a difference in the two models (Anderson and Burnham, 1999). The normalized Akaike weights are used to quantify and standardize the difference in support between two models. By definition, w i =(e - ΔAIC(2)^-1 )(Σe - ΔAIC(2)^-1 ) -1, where w i is the normalized Akaike weight (Buckland et al. 1997). The ratio of two normalized Akaike weights shows the relative support of one model over another. For example, if model A has a weight of 0.6 and model B has a weight of 0.2, model A is 3 times more supported than model B. Program MARK also 67
86 provides an index called model likelihood, which is simply the weight of a model divided by weight of most parsimonious model. Likelihood Ratio Tests QAIC is one useful method of comparing two models, but it also possible to use classic statistical hypothesis testing between nested models using the likelihood ratio test (LRT). Two models are nested if one (known as the general model) can be transformed into the other (known as the reduced model) by a linear restriction (Cooch and White, 2004). In other words, the two models differ only by the presence or absence of a term. In most cases, the general model contains a certain parameter (e.g., S(t)), whereas the reduced model does not (e.g., S(.)) (Fig. A-49). The difference in deviance between nested models is approximately Chi-square distributed, and the difference in the number of parameters is the degrees of freedom. The Chi-square statistic is calculated as: χ 2 =Dev r -Dev g where χ 2 is the Chi-square statistic, Dev r is the reduced model deviance, and Dev g is the general model deviance. Equivalently, LRT is determined by comparing -2 ln(l r /L f ) with a χ 2 distribution, where L f is the likelihood of the full model, and L r is the likelihood of the reduced model. In a LRT, a significant difference (probability<0.05) means that there is a significant increase in deviance with the reduction in the number of parameters. In other words, there is a significant increase in deviance when you remove the parameter of interest; the model that includes the added parameter fits the data significantly better. A non-significant difference (probability>0.05) means that the two models both fit the data equally well, but the reduced model is preferred, since it has fewer parameters. The deviance is not statistically different between the two 68
87 models, but the reduced model is more parsimonious. If probability>0.05, there is not a significant difference between the models; adding the parameter (e.g., timedependency in survival) does not significantly improve the model fit. 69


88 APPENDIX III: Additional Tables and Figures 70
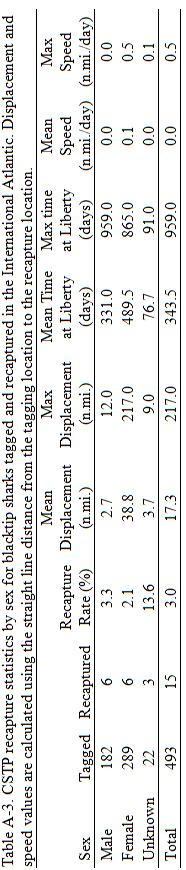
89 71
90 Table A-4. Captures by industry (including all tags and recaptures). Industry U.S. Western Eastern Mexican International Total Atlantic US. GOM U.S. GOM GOM Atlantic Recreational Biologist Commercial Fishery Observer Other Total
91 Table A-5. Captures by gear (including all tags and recaptures). Gear U.S. Atlantic Western US. Eastern U.S. Mexican GOM International Atlantic Rod and Reel Total GOM GOM Longline Gill Net Other Total Table A-6. The 7 most parsimonious models (those with model likelihood ) tested with YOY and post-yoy groups. Model QAICc Delta QAICc AICc Weights Model Likelihood Num. Par Deviance S(..) r(g+effort) S(g.) r(g+effort) S(g.) r(.effort) S(..) r(g.) S(g.) r(g.) S(..) r(.effort) S(g+t) r(g.)
92 Table A-7. Survival likelihood ratio tests for YOY vs. post-yoy sharks in the GOM. ** indicates that models are nested, but sparseness in data does not allow for calculation of probability. Effect Reduced Model General Model Chi-sq. Df Prob. Significant S(g) S(..) r(..) S(g.) r(..) S(..) r(.effort) S(g.) r(.effort) S(..) r(.t) S(g.) r(.t) S(..) r(g*t) S(g.) r(g*t) ** S(..) r(g.) S(g.) r(g.) S(..) r(g+effort) S(g.) r(g+effort) S(..) r(g+t) S(g.) r(g+t) S(.t) r(..) S(g+t) r(..) S(.t) r(.effort) S(g+t) r(.effort) S(.t) r(.t) S(g+t) r(.t) <.0001 S(.t) r(g*t) S(g+t) r(g*t) ** S(.t) r(g.) S(g+t) r(g.) S(.t) r(g+effort) S(g+t) r(g+effort) S(.t) r(g+t) S(g+t) r(g+t) S(t) S(..) r(..) S(.t) r(..) S(..) r(.effort) S(.t) r(.effort) S(..) r(.t) S(.t) r(.t) S(..) r(g*t) S(.t) r(g*t) S(..) r(g.) S(.t) r(g.) S(..) r(g+effort) S(.t) r(g+effort) S(..) r(g+t) S(.t) r(g+t) S(g.) r(..) S(g+t) r(..) ** S(g.) r(.effort) S(g+t) r(.effort) S(g.) r(.t) S(g+t) r(.t) <.0001 S(g.) r(g*t) S(g+t) r(g*t) S(g.) r(g.) S(g+t) r(g.) S(g.) r(g+effort) S(g+t) r(g+effort) S(g.) r(g+t) S(g+t) r(g+t) S(g*t) S(g+t) r(..) S(g*t) r(..) S(g+t) r(.effort) S(g*t) r(.effort) S(g+t) r(.t) S(g*t) r(.t) S(g+t) r(g*t) S(g*t) r(g*t) S(g+t) r(g.) S(g*t) r(g.) ** S(g+t) r(g+effort) S(g*t) r(g+effort) S(g+t) r(g+t) S(g*t) r(g+t)
93 Table A-8. Recovery probability likelihood ratio tests for YOY vs. post-yoy sharks in the GOM. ** indicates that models are nested, but sparseness in data does not allow for calculation of probability. Effect Reduced Model General Model Chi-sq. Df Prob. Significant r(effort) S(..) r(..) S(..) r(.effort) <.0001 S(..) r(g.) S(..) r(g+effort) S(.t) r(..) S(.t) r(.effort) <.0001 S(.t) r(g.) S(.t) r(g+effort) S(g*t) r(..) S(g*t) r(.effort) <.0001 S(g*t) r(g.) S(g*t) r(g+effort) <.0001 S(g.) r(..) S(g.) r(.effort) <.0001 S(g.) r(g.) S(g.) r(g+effort) S(g+t) r(..) S(g+t) r(.effort) <.0001 S(g+t) r(g.) S(g+t) r(g+effort) r(g) S(..) r(..) S(..) r(g.) <.0001 S(..) r(.effort) S(..) r(g+effort) <.0001 S(..) r(.t) S(..) r(g+t) <.0001 S(.t) r(..) S(.t) r(g.) <.0001 S(.t) r(.effort) S(.t) r(g+effort) <.0001 S(.t) r(.t) S(.t) r(g+t) <.0001 S(g*t) r(..) S(g*t) r(g.) <.0001 S(g*t) r(.effort) S(g*t) r(g+effort) S(g*t) r(.t) S(g*t) r(g+t) S(g.) r(..) S(g.) r(g.) <.0001 S(g.) r(.effort) S(g.) r(g+effort) S(g.) r(.t) S(g.) r(g+t) <.0001 S(g+t) r(..) S(g+t) r(g.) <.0001 S(g+t) r(.effort) S(g+t) r(g+effort) S(g+t) r(.t) S(g+t) r(g+t) r(t) S(..) r(..) S(..) r(.t) S(..) r(g.) S(..) r(g+t) S(.t) r(..) S(.t) r(.t) <.0001 S(.t) r(g.) S(.t) r(g+t) S(g*t) r(..) S(g*t) r(.t) <.0001 S(g*t) r(g.) S(g*t) r(g+t) S(g.) r(..) S(g.) r(.t) S(g.) r(g.) S(g.) r(g+t) S(g+t) r(..) S(g+t) r(.t) <.0001 S(g+t) r(g.) S(g+t) r(g+t) r(g*t) S(..) r(g+t) S(..) r(g*t) S(.t) r(g+t) S(.t) r(g*t) S(g*t) r(g+t) S(g*t) r(g*t) S(g.) r(g+t) S(g.) r(g*t) ** S(g+t) r(g+t) S(g+t) r(g*t)
94 Table A-9. The 8 most parsimonious models (those with model likelihood ) tested with male and female groups. Model QAICc Delta QAICc AICc Weights Model Likelihood Num. Par Deviance S(..) r(.effort) S(g.) r(.effort) S(..) r(g+effort) S(g.) r(g+effort) S(..) r(..) S(g.) r(..) S(..) r(g.) S(g.) r(g.)
95 Table A-10. Survival likelihood ratio tests for male vs. female post-yoy sharks in the GOM. ** indicates that models are nested, but sparseness in data does not allow for calculation of probability. Effect Reduced Model General Model Chi-sq. Df Prob. Significant S(g) S(..) r(..) S(g.) r(..) S(..) r(.effort) S(g.) r(.effort) S(..) r(.t) S(g.) r(.t) ** S(..) r(g*t) S(g.) r(g*t) ** S(..) r(g.) S(g.) r(g.) S(..) r(g+effort) S(g.) r(g+effort) S(..) r(g+t) S(g.) r(g+t) ** S(.t) r(..) S(g+t) r(..) ** S(.t) r(.effort) S(g+t) r(.effort) S(.t) r(.t) S(g+t) r(.t) S(.t) r(g*t) S(g+t) r(g*t) S(.t) r(g.) S(g+t) r(g.) S(.t) r(g+effort) S(g+t) r(g+effort) S(.t) r(g+t) S(g+t) r(g+t) S(t) S(..) r(..) S(.t) r(..) S(..) r(.effort) S(.t) r(.effort) S(..) r(.t) S(.t) r(.t) S(..) r(g*t) S(.t) r(g*t) S(..) r(g.) S(.t) r(g.) S(..) r(g+effort) S(.t) r(g+effort) S(..) r(g+t) S(.t) r(g+t) S(g.) r(..) S(g+t) r(..) S(g.) r(.effort) S(g+t) r(.effort) S(g.) r(.t) S(g+t) r(.t) S(g.) r(g*t) S(g+t) r(g*t) S(g.) r(g.) S(g+t) r(g.) S(g.) r(g+effort) S(g+t) r(g+effort) S(g.) r(g+t) S(g+t) r(g+t) S(g*t) S(g+t) r(..) S(g*t) r(..) S(g+t) r(.effort) S(g*t) r(.effort) S(g+t) r(.t) S(g*t) r(.t) S(g+t) r(g*t) S(g*t) r(g*t) S(g+t) r(g.) S(g*t) r(g.) ** S(g+t) r(g+effort) S(g*t) r(g+effort) S(g+t) r(g+t) S(g*t) r(g+t)
96 Table A-11. Recovery probability likelihood ratio tests for male vs. female post-yoy sharks in the GOM. ** indicates that models are nested, but sparseness in data does not allow for calculation of probability. Effect Reduced Model General Model Chi-sq. Df Prob. Significant r(effort) S(..) r(..) S(..) r(.effort) S(..) r(g.) S(..) r(g+effort) S(.t) r(..) S(.t) r(.effort) ** S(.t) r(g.) S(.t) r(g+effort) S(g*t) r(..) S(g*t) r(.effort) S(g*t) r(g.) S(g*t) r(g+effort) S(g.) r(..) S(g.) r(.effort) S(g.) r(g.) S(g.) r(g+effort) S(g+t) r(..) S(g+t) r(.effort) S(g+t) r(g.) S(g+t) r(g+effort) r(g) S(..) r(..) S(..) r(g.) S(..) r(.effort) S(..) r(g+effort) S(..) r(.t) S(..) r(g+t) S(.t) r(..) S(.t) r(g.) S(.t) r(.effort) S(.t) r(g+effort) S(.t) r(.t) S(.t) r(g+t) S(g*t) r(..) S(g*t) r(g.) ** S(g*t) r(.effort) S(g*t) r(g+effort) S(g*t) r(.t) S(g*t) r(g+t) S(g.) r(..) S(g.) r(g.) S(g.) r(.effort) S(g.) r(g+effort) S(g.) r(.t) S(g.) r(g+t) ** S(g+t) r(..) S(g+t) r(g.) S(g+t) r(.effort) S(g+t) r(g+effort) S(g+t) r(.t) S(g+t) r(g+t) r(t) S(..) r(..) S(..) r(.t) S(..) r(g.) S(..) r(g+t) S(.t) r(..) S(.t) r(.t) S(.t) r(g.) S(.t) r(g+t) S(g*t) r(..) S(g*t) r(.t) S(g*t) r(g.) S(g*t) r(g+t) S(g.) r(..) S(g.) r(.t) ** S(g.) r(g.) S(g.) r(g+t) ** S(g+t) r(..) S(g+t) r(.t) S(g+t) r(g.) S(g+t) r(g+t) r(g*t) S(..) r(g+t) S(..) r(g*t) S(.t) r(g+t) S(.t) r(g*t) S(g*t) r(g+t) S(g*t) r(g*t) S(g.) r(g+t) S(g.) r(g*t) S(g+t) r(g+t) S(g+t) r(g*t)
97 Table A-12. The 9 most parsimonious models (those with model likelihood ) tested with west and east GOM groups. Model QAICc Delta QAICc AICc Weights Model Likelihood Num. Par Deviance S(..) r(.effort) S(g.) r(.effort) S(..) r(g+effort) S(g.) r(g+effort) S(..) r(..) S(..) r(g.) S(g.) r(..) S(g.) r(g.) S(.t) r(g.)
98 Table A-13. Survival likelihood ratio tests for post-yoy sharks in the west GOM vs. those in the east GOM. ** indicates that models are nested, but sparseness in data does not allow for calculation of probability. Effect Reduced Model General Model Chi-sq. Df Prob. Significant S(g) S(..) r(..) S(g.) r(..) S(..) r(.effort) S(g.) r(.effort) S(..) r(.t) S(g.) r(.t) ** S(..) r(g*t) S(g.) r(g*t) ** S(..) r(g.) S(g.) r(g.) S(..) r(g+effort) S(g.) r(g+effort) S(..) r(g+t) S(g.) r(g+t) S(.t) r(..) S(g+t) r(..) S(.t) r(.effort) S(g+t) r(.effort) S(.t) r(.t) S(g+t) r(.t) S(.t) r(g*t) S(g+t) r(g*t) ** S(.t) r(g.) S(g+t) r(g.) S(.t) r(g+effort) S(g+t) r(g+effort) S(.t) r(g+t) S(g+t) r(g+t) S(t) S(..) r(..) S(.t) r(..) S(..) r(.effort) S(.t) r(.effort) S(..) r(.t) S(.t) r(.t) S(..) r(g*t) S(.t) r(g*t) S(..) r(g.) S(.t) r(g.) S(..) r(g+effort) S(.t) r(g+effort) S(..) r(g+t) S(.t) r(g+t) S(g.) r(..) S(g+t) r(..) S(g.) r(.effort) S(g+t) r(.effort) S(g.) r(.t) S(g+t) r(.t) S(g.) r(g*t) S(g+t) r(g*t) S(g.) r(g.) S(g+t) r(g.) S(g.) r(g+effort) S(g+t) r(g+effort) S(g.) r(g+t) S(g+t) r(g+t) S(g*t) S(g+t) r(..) S(g*t) r(..) S(g+t) r(.effort) S(g*t) r(.effort) S(g+t) r(.t) S(g*t) r(.t) S(g+t) r(g*t) S(g*t) r(g*t) S(g+t) r(g.) S(g*t) r(g.) ** S(g+t) r(g+effort) S(g*t) r(g+effort) S(g+t) r(g+t) S(g*t) r(g+t)
99 Table A-14. Recovery probability likelihood ratio tests for post-yoy sharks in the west GOM vs. those in the east GOM. ** indicates that models are nested, but sparseness in data does not allow for calculation of probability. Effect Reduced Model General Model Chi-sq. Df Prob. Significant r(effort) S(..) r(..) S(..) r(.effort) S(..) r(g.) S(..) r(g+effort) S(.t) r(..) S(.t) r(.effort) S(.t) r(g.) S(.t) r(g+effort) S(g*t) r(..) S(g*t) r(.effort) S(g*t) r(g.) S(g*t) r(g+effort) S(g.) r(..) S(g.) r(.effort) S(g.) r(g.) S(g.) r(g+effort) S(g+t) r(..) S(g+t) r(.effort) S(g+t) r(g.) S(g+t) r(g+effort) r(g) S(..) r(..) S(..) r(g.) S(..) r(.effort) S(..) r(g+effort) S(..) r(.t) S(..) r(g+t) <.0001 S(.t) r(..) S(.t) r(g.) S(.t) r(.effort) S(.t) r(g+effort) S(.t) r(.t) S(.t) r(g+t) S(g*t) r(..) S(g*t) r(g.) S(g*t) r(.effort) S(g*t) r(g+effort) ** S(g*t) r(.t) S(g*t) r(g+t) S(g.) r(..) S(g.) r(g.) S(g.) r(.effort) S(g.) r(g+effort) S(g.) r(.t) S(g.) r(g+t) <.0001 S(g+t) r(..) S(g+t) r(g.) S(g+t) r(.effort) S(g+t) r(g+effort) S(g+t) r(.t) S(g+t) r(g+t) r(t) S(..) r(..) S(..) r(.t) S(..) r(g.) S(..) r(g+t) S(.t) r(..) S(.t) r(.t) S(.t) r(g.) S(.t) r(g+t) S(g*t) r(..) S(g*t) r(.t) S(g*t) r(g.) S(g*t) r(g+t) S(g.) r(..) S(g.) r(.t) ** S(g.) r(g.) S(g.) r(g+t) S(g+t) r(..) S(g+t) r(.t) S(g+t) r(g.) S(g+t) r(g+t) r(g*t) S(..) r(g+t) S(..) r(g*t) S(.t) r(g+t) S(.t) r(g*t) S(g*t) r(g+t) S(g*t) r(g*t) S(g.) r(g+t) S(g.) r(g*t) ** S(g+t) r(g+t) S(g+t) r(g*t)
100 Table A-15. The 11 most parsimonious models (those with model likelihood ) tested with Atlantic and GOM groups. Model QAICc Delta QAICc AICc Weights Model Likelihood Num. Par Deviance S(..) r(g+effort) S(g.) r(g+effort) S(..) r(..) S(g.) r(..) S(.t) r(g+effort) S(g+t) r(g+effort) S(..) r(g.) S(g.) r(g.) S(.t) r(g.) S(g+t) r(g.) S(..) r(g+t)
101 Table A-16. Survival likelihood ratio tests for post-yoy sharks in the Atlantic vs. those in the GOM. ** indicates that models are nested, but sparseness in data does not allow for calculation of probability. Effect Reduced Model General Model Chi-sq. Df Prob. Significant S(g) S(..) r(..) S(g.) r(..) S(..) r(.t) S(g.) r(.t) S(..) r(g*t) S(g.) r(g*t) ** S(..) r(g.) S(g.) r(g.) S(..) r(g+effort) S(g.) r(g+effort) S(..) r(g+t) S(g.) r(g+t) ** S(.t) r(..) S(g+t) r(..) S(.t) r(.t) S(g+t) r(.t) S(.t) r(g*t) S(g+t) r(g*t) S(.t) r(g.) S(g+t) r(g.) S(.t) r(g+effort) S(g+t) r(g+effort) S(.t) r(g+t) S(g+t) r(g+t) S(t) S(..) r(..) S(.t) r(..) S(..) r(.t) S(.t) r(.t) <.0001 S(..) r(g*t) S(.t) r(g*t) S(..) r(g.) S(.t) r(g.) S(..) r(g+effort) S(.t) r(g+effort) S(..) r(g+t) S(.t) r(g+t) S(g.) r(..) S(g+t) r(..) S(g.) r(.t) S(g+t) r(.t) <.0001 S(g.) r(g*t) S(g+t) r(g*t) S(g.) r(g.) S(g+t) r(g.) S(g.) r(g+effort) S(g+t) r(g+effort) S(g.) r(g+t) S(g+t) r(g+t) <.0001 S(g*t) S(g+t) r(..) S(g*t) r(..) S(g+t) r(.t) S(g*t) r(.t) S(g+t) r(g*t) S(g*t) r(g*t) S(g+t) r(g.) S(g*t) r(g.) ** S(g+t) r(g+effort) S(g*t) r(g+effort) S(g+t) r(g+t) S(g*t) r(g+t)
102 Table A-17. Recovery probability likelihood ratio tests for post-yoy sharks in the Atlantic vs. those in the GOM. ** indicates that models are nested, but sparseness in data does not allow for calculation of probability. Effect Reduced Model General Model Chi-sq. Df Prob. Significant r(effort) S(..) r(g.) S(..) r(g+effort) S(.t) r(g.) S(.t) r(g+effort) S(g*t) r(g.) S(g*t) r(g+effort) <.0001 S(g.) r(g.) S(g.) r(g+effort) S(g+t) r(g.) S(g+t) r(g+effort) r(g) S(..) r(..) S(..) r(g.) S(..) r(.t) S(..) r(g+t) <.0001 S(.t) r(..) S(.t) r(g.) <.0001 S(.t) r(.t) S(.t) r(g+t) ** S(g*t) r(..) S(g*t) r(g.) ** S(g*t) r(.t) S(g*t) r(g+t) S(g.) r(..) S(g.) r(g.) S(g.) r(.t) S(g.) r(g+t) ** S(g+t) r(..) S(g+t) r(g.) <.0001 S(g+t) r(.t) S(g+t) r(g+t) r(t) S(..) r(..) S(..) r(.t) ** S(..) r(g.) S(..) r(g+t) S(.t) r(..) S(.t) r(.t) S(.t) r(g.) S(.t) r(g+t) S(g*t) r(..) S(g*t) r(.t) S(g*t) r(g.) S(g*t) r(g+t) S(g.) r(..) S(g.) r(.t) ** S(g.) r(g.) S(g.) r(g+t) ** S(g+t) r(..) S(g+t) r(.t) S(g+t) r(g.) S(g+t) r(g+t) r(g*t) S(..) r(g+t) S(..) r(g*t) ** S(.t) r(g+t) S(.t) r(g*t) S(g*t) r(g+t) S(g*t) r(g*t) S(g.) r(g+t) S(g.) r(g*t) S(g+t) r(g+t) S(g+t) r(g*t)
103 Figure A-1. Possible encounter histories and associated probabilities for the reduced (Seber) parameterization (adapted from Cooch and White 2004). Figure A-2. Recovery matrix format. Figure A-3. Fishing mortality rate of blacktip sharks in the Gulf of Mexico and Atlantic from 1986 through 2004 (NOAA/NMFS 2006). 85
104 Figure A-4. Distribution of blacktip sharks tagged (a) and recaptured (b) in the Gulf of Mexico from 1964 through Figure A-5. Distribution of blacktip sharks tagged (a) and recaptured (b) in the U.S. Atlantic waters from 1964 through
105 Figure A-6. Distribution of blacktip sharks tagged (a) and recaptured (b) in International Atlantic waters from 1964 through
106 Figure A-7. Mean displacement of blacktip sharks at large for less than 1 year. N= 53, 43, and 12, for YOY, juveniles, and mature sharks, respectively, in the GOM. N= 16, 18, and 16 for YOY, juveniles, and mature sharks in the U.S. Atlantic. N=5,4, and 1 for YOY, juveniles, and mature sharks, respectively, in the International Atlantic. 88
107 89 Figure A-8. Length frequency for blacktip shark captures in the U.S. Atlantic Ocean.
108 90 Figure A-9. Length frequency for blacktip shark captures in the Gulf of Mexico.
109 91 Figure A-10. Length frequency for blacktip shark captures in the International Atlantic Ocean.
110 Figure A-11. Blacktip shark captures in the CSTP by industry. 92
111 Figure A-12. Blacktip shark captures in the CSTP by industry in the west and east U.S. GOM. 93
112 Figure A-13. Blacktip shark captures in the CSTP by gear. 94
113 Figure A-14. Blacktip shark captures in the CSTP by gear in the west and east U.S. GOM. 95
114 96 Figure A-15. Blacktip shark captures by sex off the north U.S. Atlantic coast. The solid line represents the 200 m depth contour. The dashed line represents the U.S. EEZ.
115 97 Figure A-16. Blacktip shark captures by sex off the south U.S. Atlantic coast. The solid line represents the 200 m depth contour. The dashed line represents the U.S. EEZ
116 98 Figure A-17. Blacktip shark captures by sex off the west coast of Florida. The solid line represents the 200 m depth contour. The dashed line represents the U.S. EEZ.

117 99 Figure A-18. Blacktip shark captures by sex in the northwestern Gulf of Mexico. The solid line represents the 200 m depth contour. The dashed line represents the U.S. EEZ.
118 100 Figure A-19. Blacktip shark captures by sex in the Bahamas. The solid line represents the 200 m depth contour. The dashed line represents the U.S. EEZ.
119 101 Figure A-20. Blacktip shark captures by sex in the U.S. Virgin Islands. The solid line represents the 200 m depth contour. The dashed line represents the U.S. EEZ.
120 102 Figure A-21. Blacktip shark captures by life stage off the north U.S. Atlantic coast. The solid line represents the 200 m depth contour. The dashed line represents the U.S. EEZ.
121 103 Figure A-22. Blacktip shark captures by life stage off the south U.S. Atlantic coast. The solid line represents the 200 m depth contour. The dashed line represents the U.S. EEZ.

122 104 Figure A-23. Blacktip shark captures by life stage off the west coast of Florida. The solid line represents the 200 m depth contour. The dashed line represents the U.S. EEZ.
123 105 Figure A-24. Blacktip shark captures by life stage in the northwestern Gulf of Mexico. The solid line represents the 200 m depth contour. The dashed line represents the U.S. EEZ.
124 106 Figure A-25. Blacktip shark captures by life stage in the Bahamas. The solid line represents the 200 m depth contour. The dashed line represents the U.S. EEZ.
125 107 Figure A-26. Blacktip shark captures by life stage in the U.S. Virgin Islands. The solid line represents the 200 m depth contour. The dashed line represents the U.S. EEZ.
126 108 Figure A-27. Embryo, YOY and pregnant blacktip shark captures in the U.S. Atlantic. The solid line represents the 200 m depth contour. The dashed line represents the U.S. EEZ.

127 109 Figure A-28. Embryo, YOY and pregnant blacktip shark captures off the north U.S. Atlantic coast. The solid line represents the 200 m depth contour. The dashed line represents the U.S. EEZ.

128 110 Figure A-29. Embryo, YOY and pregnant blacktip shark captures in the south U.S. Atlantic coast. The solid line represents the 200 m depth contour. The dashed line represents the U.S. EEZ.

129 111 Figure A-30. Embryo, YOY and pregnant blacktip shark captures in the Gulf of Mexico. The solid line represents the 200 m depth contour. The dashed line represents the U.S. EEZ.

130 112 Figure A-31. Embryo, YOY and pregnant blacktip shark captures off the west coast of Florida. The solid line represents the 200 m depth contour. The dashed line represents the U.S. EEZ.
131 113 Figure A-32. Embryo, YOY and pregnant blacktip shark captures in the northwestern Gulf of Mexico. The solid line represents the 200 m depth contour. The dashed line represents the U.S. EEZ.
132 114 Figure A-33. Embryo, YOY and pregnant blacktip shark captures in the International Atlantic. The solid line represents the 200 m depth contour. The dashed line represents the U.S. EEZ.
133 115 Figure A-34. Embryo, YOY and pregnant blacktip shark captures in the Bahamas. The solid line represents the 200 m depth contour. The dashed line represents the U.S. EEZ.
134 116 Figure A-35. Embryo, YOY and pregnant blacktip shark captures in the U.S. Virgin Islands. The solid line represents the 200 m depth contour. The dashed line represents the U.S. EEZ.
135 117 Figure A-36. Blacktip shark recaptures by sex and life stage off the north U.S. Atlantic coast. The solid line represents the 200 m depth contour. The dashed line represents the U.S. EEZ.

136 118 Figure A-37. Blacktip shark recaptures by sex and life stage off the south U.S. Atlantic coast. The solid line represents the 200m depth contour. The dotted-dashed line represents the U.S. EEZ.

137 119 Figure A-38. Blacktip shark recaptures by sex and life stage off the west coast of Florida. The solid line represents the 200 m depth contour. The dashed line represents the U.S. EEZ.

138 120 Figure A-39. Blacktip shark recaptures by sex and life stage in the northwestern Gulf of Mexico. The solid line represents the 200m depth contour. The dotted-dashed line represents the U.S. EEZ.

139 121 Figure A-40. Blacktip shark recaptures by sex and life stage in the Bahamas. The solid line represents the 200 m depth contour. The dashed line represents the U.S. EEZ.
140 122 Figure A-41. Blacktip shark recaptures by sex and life stage in the U.S. Virgin Islands. The solid line represents the 200 m depth contour. The dashed line represents the U.S. EEZ.
141 Figure A-42. Blacktip shark landings in the Gulf of Mexico by fleet (NOAA/NMFS 2012). Year of Recovery Year Marked Number Marked N 1 N 1 (1-S 1 )r 1 N 1 S 1 (1-S 2 )r 2 N 1 S 1 S 2 (1-S 3 )r 3 2 N 2 N 2 (1-S 2 )r 2 N 2 S 2 (1-S 3 )r 3 3 N 3 N 3 (1-S 3 )r 3 Figure A-43. Probability expressions for number of sharks marked and recovered in a given year, with no age grouping. (Cooch and White 2004). 123
142 Year of Recovery Year Marked Number Marked Marked as Post-YOY 1 N 1 N 1 (1-S 1 )r 1 N 1 S 1 (1-S 2 )r 2 N 1 S 1 S 2 (1-S 3 )r 3 2 N 2 N 2 (1-S 2 )r 2 N 2 S 2 (1-S 3 )r 3 3 N 3 N 3 (1-S 3 )r 3 Marked as YOY 1 N 1 N 1 (1-S * * 1 )r 1 N 1 S * 1 (1-S 2 )r 2 N 1 S * 1 S 2 (1-S 3 )r 3 2 N 2 N 2 (1-S * * 2 )r 2 N 2 S * 2 (1-S 3 )r 3 3 N 3 N 3 (1-S * * 3 )r 3 Figure A-44. Probability expressions for number of sharks marked and recovered in a given year, including an age effect. (Cooch and White 2004). An asterisk ( * ) indicates parameters that are specific to young-of-the-year. 124

143 Figure A-45. Data input file for analysis with an age grouping. 125
Nancy E. Kohler, Danielle Bailey, Patricia A. Turner, and Camilla McCandless SEDAR34-WP-25. Submitted: 10 June 2013
 Mark/Recapture Data for the Atlantic Sharpnose Shark (Rhizoprionodon terranovae), in the Western North Atlantic from the NEFSC Cooperative Shark Tagging Program Nancy E. Kohler, Danielle Bailey, Patricia
SMALL COASTAL SHARK 2007 SEDAR DATA WORKSHOP DOCUMENT
 SMALL COASTAL SHARK 7 SEDAR DATA WORKSHOP DOCUMENT Preliminary Mark/Recapture Data for Four Species of Small Coastal Sharks in the Western North Atlantic Nancy E. Kohler and Patricia A. Turner NOAA/NMFS/NEFSC
ASMFC Stock Assessment Overview: Red Drum
 Introduction This document presents a summary of the 217 stock assessments for red drum. These assessments were initially conducted through the Southeast Data, Assessment and Review (SEDAR) process using
ASMFC Stock Assessment Overview: Red Drum
 Purpose The purpose of this document is to improve the understanding and transparency of the Commission s stock assessment process and results. It is the first of several that will be developed throughout
SMOOTH HAMMERHEAD SHARK (HHS)
") SMOOTH HAMMERHEAD SHARK (HHS) (Sphyrna zygaena) HHS1 1. FISHERY SUMMARY Smooth hammerhead sharks (Sphyrna zygaena) are not currently managed under the QMS. No assigned fishing allowances exist. However,
SMOOTH HAMMERHEAD SHARK (HHS) (Sphyrna zygaena) HHS1 1. FISHERY SUMMARY Smooth hammerhead sharks (Sphyrna zygaena) are not currently managed under the QMS. No assigned fishing allowances exist. However,
Commercial Bycatch Rates of Shortfin Mako (Isurus oxyrinchus) from Longline Fisheries in the Canadian Atlantic
 from Longline Fisheries in the Canadian Atlantic") ICCAT Working Paper for Shark Stock Assessment Meeting 2008 Commercial Bycatch Rates of Shortfin Mako (Isurus oxyrinchus) from Longline Fisheries in the Canadian Atlantic G.M. Fowler and S.E. Campana Population
ICCAT Working Paper for Shark Stock Assessment Meeting 2008 Commercial Bycatch Rates of Shortfin Mako (Isurus oxyrinchus) from Longline Fisheries in the Canadian Atlantic G.M. Fowler and S.E. Campana Population
Size and spatial distribution of the blue shark, Prionace glauca, caught by Taiwanese large-scale. longline fishery in the North Pacific Ocean
 1 ISC/16/SHARKWG-1/21 Size and spatial distribution of the blue shark, Prionace glauca, caught by Taiwanese large-scale longline fishery in the North Pacific Ocean Kwang-Ming Liu 1,2, Kuang-Yu Su 1,2,
Preliminary catches of smoothhound sharks SEDAR39-DW-03
 Preliminary catches of smoothhound sharks E. Cortés and H. Balchowsky SEDAR39-DW-3 9 May 214 This information is distributed solely for the purpose of pre-dissemination peer review. It does not represent
STOCK STATUS OF SOUTHERN BLUEFIN TUNA
 7 th Expert Consultation on Indian Ocean Tunas, Victoria, Seychelles, 9-14 November, 1998 STOCK STATUS OF SOUTHERN BLUEFIN TUNA Tsuji, S. 1 Introduction The Commission for the Conservation of Southern
Cami T. McCandless and Joesph J. Mello SEDAR39- DW June 2014
 Standardized indices of abundance for Smooth Dogfish, Mustelus canis, from the Northeast Fisheries Observer Program Cami T. McCandless and Joesph J. Mello SEDAR39- DW- 09 30 June 2014 This information
Standardized catch rates of U.S. blueline tilefish (Caulolatilus microps) from commercial logbook longline data
 from commercial logbook longline data") Standardized catch rates of U.S. blueline tilefish (Caulolatilus microps) from commercial logbook longline data Sustainable Fisheries Branch, National Marine Fisheries Service, Southeast Fisheries Science
Standardized catch rates of U.S. blueline tilefish (Caulolatilus microps) from commercial logbook longline data Sustainable Fisheries Branch, National Marine Fisheries Service, Southeast Fisheries Science
Melissa M. Giresi, William B. Driggers, R. Dean Grubbs, Jim Gelsleichter, Eric R. Hoffmayer SEDAR39-DW May 2014
 Seasonal Distribution of Mustelus canis off the Atlantic coast of the U.S. Melissa M. Giresi, William B. Driggers, R. Dean Grubbs, Jim Gelsleichter, Eric R. Hoffmayer SEDAR39-DW-28 21 May 2014 This information
Modeling effects of fishing closures in the Western Florida Shelf
 Modeling effects of fishing closures in the Western Florida Shelf David J. Die and Steven Saul* University of Miami * Currently SEFSC/NMFS/NOAA Outline Effects of fishing closures DWH Fishing closures
A non-equilibrium surplus production model of black grouper (Mycteroperca bonaci) in southeast United States waters
 in southeast United States waters") SEDAR19-AW-05 A non-equilibrium surplus production model of black grouper (Mycteroperca bonaci) in southeast United States waters Introduction Robert G. Muller Florida Fish and Wildlife Conservation Commission
SEDAR19-AW-05 A non-equilibrium surplus production model of black grouper (Mycteroperca bonaci) in southeast United States waters Introduction Robert G. Muller Florida Fish and Wildlife Conservation Commission
United States Commercial Vertical Line Vessel Standardized Catch Rates of Red Grouper in the US South Atlantic,
 SEDAR19-DW-14 United States Commercial Vertical Line Vessel Standardized Catch Rates of Red Grouper in the US South Atlantic, 1993-2008 Kevin McCarthy and Neil Baertlein National Marine Fisheries Service,
Atlantic croaker, Micropogonias undulatus (Linnaeus, 1766)
") Atlantic croaker, Micropogonias undulatus (Linnaeus, 1766) Although Atlantic croaker occur throughout much of Florida, they are seldom found south of Tampa Bay on the gulf coast or south of the Indian
Atlantic croaker, Micropogonias undulatus (Linnaeus, 1766) Although Atlantic croaker occur throughout much of Florida, they are seldom found south of Tampa Bay on the gulf coast or south of the Indian
PRELIMINARY ESTIMATES OF BLUE AND MAKO SHARKS BYCATCH AND CPUE OF TAIWANESE LONGLINE FISHERY IN THE ATLANTIC OCEAN
 PRELIMINARY ESTIMATES OF BLUE AND MAKO SHARKS BYCATCH AND CPUE OF TAIWANESE LONGLINE FISHERY IN THE ATLANTIC OCEAN Kwang-Ming Liu 1, Shoou-Jeng Joung, and Wen-Pei Tsai 3 1 Institute of Marine Affairs and
A Combined Recruitment Index for Demersal Juvenile Cod in NAFO Divisions 3K and 3L
 NAFO Sci. Coun. Studies, 29: 23 29 A Combined Recruitment Index for Demersal Juvenile Cod in NAFO Divisions 3K and 3L David C. Schneider Ocean Sciences Centre, Memorial University St. John's, Newfoundland,
Red Snapper distribution on natural habitats and artificial structures in the northern Gulf of Mexico
 Red Snapper distribution on natural habitats and artificial structures in the northern Gulf of Mexico SEFSC Mandy Karnauskas and John Walter, NMFS SEFSC Miami Matthew Campbell and Adam Pollack, NMFS SEFSC
Species Profile: Red Drum Benchmark Assessment Finds Resource Relatively Stable with Overfishing Not Occurring
 Red Drum Sciaenops ocellatus Management Unit: New Jersey - Florida Interesting Facts: * The name is derived from their color and the fact that during spawning time males produce a drum-like noise by vibrating
NOAA/NMFS QUARTERLY PROGRESS REPORT. C. Project Title: Center for Shark Research (CSR) at Mote Marine Laboratory,
 at Mote Marine Laboratory,") NOAA/NMFS QUARTERLY PROGRESS REPORT A. Grant Number: NA77FM0281 B. Grantee: Mote Marine Laboratory C. Project Title: Center for Shark Research (CSR) at Mote Marine Laboratory, 1997-1998 D. Amount of Grant:
NOAA/NMFS QUARTERLY PROGRESS REPORT A. Grant Number: NA77FM0281 B. Grantee: Mote Marine Laboratory C. Project Title: Center for Shark Research (CSR) at Mote Marine Laboratory, 1997-1998 D. Amount of Grant:
Atlantic States Marine Fisheries Commission
 Atlantic States Marine Fisheries Commission DRAFT ADDENDUM I TO THE OMNIBUS AMENDMENT TO THE INTERSTATE FISHERY MANAGEMENT PLANS FOR SPANISH MACKEREL, SPOT, AND SPOTTED SEATROUT FOR PUBLIC COMMENT Spanish
SEA GRANT PROGRESS REPORT
 SEA GRANT PROGRESS REPORT Project Title: The relationship between seasonal migrations of berried female lobster Homarus americanus, egg development and larval survival. Principal Investigator: Winsor H.
Black Sea Bass Encounter
 Black Sea Bass Encounter Below is an adaptation of the Shark Encounter (Lawrence Hall of Science: MARE 2002) lesson plan to be about Black Sea Bass and to incorporate information learned from Dr. Jensen
Advice June 2012
 2.4.1 Advice June 212 ECOREGION STOCK Iceland and East Greenland Beaked redfish (Sebastes mentella) in Subareas V, XII, and XIV and NAFO Subareas 1+2 (Deep pelagic stock > 5 m) Advice for 213 The advice
SEDAR 10 DW- 08. REVIEW OF TAGGING DATA FOR GAG GROUPER (Mycteroperca microlepis) FROM THE SOUTHEASTERN GULF OF MEXICO REGION
 FROM THE SOUTHEASTERN GULF OF MEXICO REGION") SEDAR 1 DW- 8 REVIEW OF TAGGING DATA FOR GAG GROUPER (Mycteroperca microlepis) FROM THE SOUTHEASTERN GULF OF MEXICO REGION 1985-25. THIS DOCUMENT SHOULD NOT BE CITED WITHOUT AUTHOR S PERMISSION. Mauricio
SEDAR 1 DW- 8 REVIEW OF TAGGING DATA FOR GAG GROUPER (Mycteroperca microlepis) FROM THE SOUTHEASTERN GULF OF MEXICO REGION 1985-25. THIS DOCUMENT SHOULD NOT BE CITED WITHOUT AUTHOR S PERMISSION. Mauricio
Monitoring the length structure of commercial landings of albacore tuna during the fishing year
 SCTB15 Working Paper ALB-5 Monitoring the length structure of commercial landings of albacore tuna during the 2001 2002 fishing year Linda Griggs National Institute of Water and Atmospheric Research Ltd.
and found that there exist a significant overlap between the billfish resources and the exploitation activities targeting tunas and mahi mahi.
 Executive Summary Report 2016 Billfish Research in the Eastern Pacific Ocean Rosenstiel School of Marine and Atmospheric Science University of Miami January 2017 During 2016, the Eastern Pacific Ocean
Updated landings information for the commercial fisheries in Puerto Rico with emphasis on silk and queen snapper and parrotfish fisheries
 Updated landings information for the commercial fisheries in Puerto Rico with emphasis on silk and queen snapper and parrotfish fisheries Nancie J. Cummings and Daniel Matos-Caraballo SEDAR 26-DW-03 Date
Preliminary results of SEPODYM application to albacore. in the Pacific Ocean. Patrick Lehodey
 SCTB15 Working Paper ALB-6 Preliminary results of SEPODYM application to albacore in the Pacific Ocean Patrick Lehodey Oceanic Fisheries Programme Secretariat of the Pacific Community Noumea, New Caledonia
ATLANTIC STATES MARINE FISHERIES COMMISSION. Winter Flounder Abundance and Biomass Indices from State Fishery-Independent Surveys
 ATLANTIC STATES MARINE FISHERIES COMMISSION Winter Flounder Abundance and Biomass Indices from State Fishery-Independent Surveys Technical Committee Report to the Winter Flounder Management Board February
Commercial Bycatch Rates of Blue Shark (Prionace glauca) from Longline Fisheries in the Canadian Atlantic
 from Longline Fisheries in the Canadian Atlantic") ICCAT Working Paper for Shark Stock Assessment Meeting 2008 Commercial Bycatch Rates of Blue Shark (Prionace glauca) from Longline Fisheries in the Canadian Atlantic G.M. Fowler and S.E. Campana Population
ICCAT Working Paper for Shark Stock Assessment Meeting 2008 Commercial Bycatch Rates of Blue Shark (Prionace glauca) from Longline Fisheries in the Canadian Atlantic G.M. Fowler and S.E. Campana Population
A REVIEW AND EVALUATION OF NATURAL MORTALITY FOR THE ASSESSMENT AND MANAGEMENT OF YELLOWFIN TUNA IN THE EASTERN PACIFIC OCEAN
 A REVIEW AND EVALUATION OF NATURAL MORTALITY FOR THE ASSESSMENT AND MANAGEMENT OF YELLOWFIN TUNA IN THE EASTERN PACIFIC OCEAN Mark N. Maunder and Alex Aires-da-Silva Outline YFT history Methods to estimate
ATLANTIC SALMON NEWFOUNDLAND AND LABRADOR, SALMON FISHING AREAS 1-14B. The Fisheries. Newfoundland Region Stock Status Report D2-01
 Fisheries Pêches and Oceans et Océans DFO Science Newfoundland Region Stock Status Report D2-01 ATLANTIC SALMON NEWFOUNDLAND AND LABRADOR, SALMON FISHING AREAS 1-14B Background There are 15 Atlantic salmon
West Coast Rock Lobster. Description of sector. History of the fishery: Catch history
 West Coast Rock Lobster Description of sector History of the fishery: The commercial harvesting of West Coast rock lobster commenced in the late 1800s, and peaked in the early 1950s, yielding an annual
Spatial/Seasonal overlap between the midwater trawl herring fishery and predator focused user groups
 Spatial/Seasonal overlap between the midwater trawl herring fishery and predator focused user groups A working paper submitted to the Herring PDT Micah Dean July 26, 2017 Introduction A goal of Amendment
Assessment Summary Report Gulf of Mexico Red Snapper SEDAR 7
 Assessment Summary Report Gulf of Mexico Red Snapper SEDAR 7 Stock Distribution: Red snapper are found throughout the Gulf of Mexico, the Caribbean Sea, and from the U.S. Atlantic Coast to northern South
Atlantic States Marine Fisheries Commission
 Atlantic States Marine Fisheries Commission Coastal Sharks Technical Committee Review of SEDAR 21 Dusky, Sandbar, and Blacknose Assessment January 11, 2012 Present: Greg Skomal (MA DMF, Chair) Carolyn
Pelagic fishery for Sebastes mentella in the Irminger Sea
 3.2.6.d Pelagic fishery for Sebastes mentella in the Irminger Sea The stock structure of deep-sea redfish S. mentella in Sub-area XII, Division Va and Sub-area XIV and NAFO Div. 1F remains generally uncertain.
SEDAR 28 Gulf and South Atlantic -- Spanish Mackerel and Cobia Workshop Document List Document # Title Authors
 Gulf and South Atlantic -- Spanish Mackerel and Cobia Workshop Document List Document # Title Authors SEDAR28-DW01 SEDAR28-DW02 SEDAR28-DW03 SEDAR28-DW04 SEDAR28-DW05 SEDAR28-DW06 SEDAR28-DW07 SEDAR28-DW08
Blue cod 5 (BCO5) pot mesh size review
 pot mesh size review") Blue cod 5 (BCO5) pot mesh size review Discussion Document MPI Discussion Paper No: 2017/01 Prepared for public consultation by the Ministry for Primary Industries ISBN No: 978-1-77665-454-3 (o) ISSN No:
Blue cod 5 (BCO5) pot mesh size review Discussion Document MPI Discussion Paper No: 2017/01 Prepared for public consultation by the Ministry for Primary Industries ISBN No: 978-1-77665-454-3 (o) ISSN No:
SCIENTIFIC COMMITTEE SEVENTH REGULAR SESSION August 2011 Pohnpei, Federated States of Micronesia
 SCIENTIFIC COMMITTEE SEVENTH REGULAR SESSION 9-17 August 2011 Pohnpei, Federated States of Micronesia CPUE of skipjack for the Japanese offshore pole and line using GPS and catch data WCPFC-SC7-2011/SA-WP-09
U.S. National Observer Program, Southeast Regional Fishery Observer Programs & Regional Electronic Technology Implementation Plans Jane DiCosimo
 Tab A, No. 7 Office of Science and Technology Silver Spring, MD U.S. National Observer Program, Southeast Regional Fishery Observer Programs & Regional Electronic Technology Implementation Plans Jane DiCosimo
Craig A. Brown. NOAA Fisheries, Southeast Fisheries Center, Sustainable Fisheries Division 75 Virginia Beach Drive, Miami, FL, , USA
 STANDARDIZED CATCH RATES OF VERMILION SNAPPER, RHOMBOPLITES AURORUBENS, FROM THE UNITED STATES HEADBOAT FISHERY IN THE GULF OF MEXICO DURING 1986-2004 Craig A. Brown NOAA Fisheries, Southeast Fisheries
The Sustainability of Atlantic Salmon (Salmo salar L.) in South West England
 in South West England") The Sustainability of Atlantic Salmon (Salmo salar L.) in South West England Submitted by Sarah-Louise Counter to the University of Exeter as a thesis for the degree of Doctor of Philosophy in Biological
The Sustainability of Atlantic Salmon (Salmo salar L.) in South West England Submitted by Sarah-Louise Counter to the University of Exeter as a thesis for the degree of Doctor of Philosophy in Biological
Factors influencing production
 Fisheries Reading: Miller Ch. 15 Supplementary: Levinton, Ch. 18 Krkošek et al. Epizootics of wild fish induced by farm fish. Proceedings of the National Academy of Sciences (2006) vol. 103 (42) pp. 15506
Application of a New Method for Monitoring Lake Trout Abundance in Yukon: Summer Profundal Index Netting (SPIN)
") Application of a New Method for Monitoring Lake Trout Abundance in Yukon: Summer Profundal Index Netting (SPIN) Prepared by: Lars Jessup Nathan Millar November 2011 Application of a New Method for Monitoring
Application of a New Method for Monitoring Lake Trout Abundance in Yukon: Summer Profundal Index Netting (SPIN) Prepared by: Lars Jessup Nathan Millar November 2011 Application of a New Method for Monitoring
STANDARDIZED CATCH RATES OF QUEEN SNAPPER, ETELIS OCULATUS, FROM THE ST. CROIX U.S. VIRGIN ISLANDS HANDLINE FISHERY DURING
 STANDARDIZED CATCH RATES OF QUEEN SNAPPER, ETELIS OCULATUS, FROM THE ST. CROIX U.S. VIRGIN ISLANDS HANDLINE FISHERY DURING 1984-1997 by Shannon L. Cass-Calay and Monica Valle-Esquivel National Marine Fisheries
SOUTH PACIFIC COMMISSION. TWENTY-SECOND REGIONAL TECHNICAL MEETING ON FISHERIES (Noumea, New Caledonia, 6-10 August 1990)
") Page 1 ORIGINAL : ENGLISH SOUTH PACIFIC COMMISSION TWENTY-SECOND REGIONAL TECHNICAL MEETING ON FISHERIES (Noumea, New Caledonia, 6-10 August 1990) STOCK STATUS OF SKIPJACK TUNA IN THE WESTERN TROPICAL
Page 1 ORIGINAL : ENGLISH SOUTH PACIFIC COMMISSION TWENTY-SECOND REGIONAL TECHNICAL MEETING ON FISHERIES (Noumea, New Caledonia, 6-10 August 1990) STOCK STATUS OF SKIPJACK TUNA IN THE WESTERN TROPICAL
Tuna [211] 86587_p211_220.indd 86587_p211_220.indd /30/04 12/30/04 4:53:37 4:53:37 PM PM
![Tuna [211] 86587_p211_220.indd 86587_p211_220.indd /30/04 12/30/04 4:53:37 4:53:37 PM PM](/thumbs/85/92584906.jpg "Tuna [211] 86587_p211_220.indd 86587_p211_220.indd /30/04 12/30/04 4:53:37 4:53:37 PM PM") Tuna [] highlights Ocean and Climate Changes The catches of Pacific bluefin tuna and North Pacific albacore tuna have fluctuated considerably from year to year, but no upward or downward trends are apparent
Tuna [] highlights Ocean and Climate Changes The catches of Pacific bluefin tuna and North Pacific albacore tuna have fluctuated considerably from year to year, but no upward or downward trends are apparent
Agenda Item Summary BACKGROUND. Public Involvement ISSUE ANALYSIS. Attachment 1
 Agenda Item Summary Attachment BACKGROUND Between 996 and 03 white sturgeon fisheries in the Columbia River downstream from Bonneville Dam were managed under a series of management accords between the
Minnesota Department of Natural Resources Fisheries Division, Lake Superior Area
 Minnesota F-9-R(P)- Study 4 Job 616 Minnesota Department of Natural Resources Fisheries Division, Lake Superior Area Coaster Brook Trout Status in Minnesota-Lake Superior Tributaries Following Regulation
Atlantic Striped Bass Draft Addendum V. Atlantic Striped Bass Board May 9, 2017
 Atlantic Striped Bass Draft Addendum V Atlantic Striped Bass Board May 9, 2017 Timeline May 2017: Consider Approval of Draft Addendum V for Public Comment May July 2017: Public Comment period August 2017:
STUDY PERFORMANCE REPORT
 STUDY PERFORMANCE REPORT State: Michigan Project No.: F-81-R-3 Study No.: 491 Title: Evaluation of lake sturgeon Acipenser fulvescens populations in the St. Clair River and Lake St. Clair Period Covered:
Atlantic Sturgeon Update NER Protected Resources
 Atlantic Sturgeon Update NER Protected Resources June 18, 2013 Outline Brief background Update on information available for Atlantic sturgeon Overview of draft batched fisheries Biological Opinion (BiOp)
Map Showing NAFO Management Units
 Map Showing NAFO Management Units Biology Are 6 species of seals in Atlantic Canadian waters, all of which occur in Newfoundland Two Arctic Species (Ringed, Bearded) Two temperate (Grey, Harbour) Two migratory
Preliminary Report. Note: calculations reported are preliminary and should not be cited without the author s permission. December 21, 2003.
 Preliminary Report Analysis of Total Fishing Mortality for Gulf of Mexico Red Snapper Contributed by Shrimp Trawl Bycatch and Commercial and Recreational Fisheries (Including Discards) Note: calculations
Biological Review of the 2014 Texas Closure
 Biological Review of the 2014 Texas Closure Report to the Gulf of Mexico Fishery Management Council by James M. Nance, Ph.D. Southeast Fisheries Science Center Galveston Laboratory January 2015 Introduction
Plaice (Pleuronectes platessa) in Division 7.e (western English Channel)
 in Division 7.e (western English Channel)") Celtic Seas and Greater North Sea ecoregions Published 30 June 2016 Version 2: 15 May 2017 5.3.51 Plaice (Pleuronectes platessa) in Division 7.e (western English Channel) ICES stock advice ICES advises
Celtic Seas and Greater North Sea ecoregions Published 30 June 2016 Version 2: 15 May 2017 5.3.51 Plaice (Pleuronectes platessa) in Division 7.e (western English Channel) ICES stock advice ICES advises
Addendum to SEDAR16-DW-22
 Addendum to SEDAR16-DW-22 Introduction Six king mackerel indices of abundance, two for each region Gulf of Mexico, South Atlantic, and Mixing Zone, were constructed for the SEDAR16 data workshop using
2007 REVIEW OF THE ATLANTIC STATES MARINE FISHERIES COMMISSION FISHERY MANAGEMENT PLAN FOR. SPOT (Leiostomus xanthurus) 2006 FISHING YEAR
 2006 FISHING YEAR") 2007 REVIEW OF THE ATLANTIC STATES MARINE FISHERIES COMMISSION FISHERY MANAGEMENT PLAN FOR SPOT (Leiostomus xanthurus) 2006 FISHING YEAR Prepared by Nichola Meserve (ASMFC) The Spot Plan Review Team Joe
2007 REVIEW OF THE ATLANTIC STATES MARINE FISHERIES COMMISSION FISHERY MANAGEMENT PLAN FOR SPOT (Leiostomus xanthurus) 2006 FISHING YEAR Prepared by Nichola Meserve (ASMFC) The Spot Plan Review Team Joe
HADDOCK ON THE SOUTHERN SCOTIAN SHELF AND IN THE BAY OF FUNDY (DIV. 4X/5Y)
") Canadian Science Advisory Secretariat Science Advisory Report 26/47 HADDOCK ON THE SOUTHERN SCOTIAN SHELF AND IN THE BAY OF FUNDY (DIV. 4X/5Y) Context Haddock (Melanogrammus aeglefinus) are found on both
Canadian Science Advisory Secretariat Science Advisory Report 26/47 HADDOCK ON THE SOUTHERN SCOTIAN SHELF AND IN THE BAY OF FUNDY (DIV. 4X/5Y) Context Haddock (Melanogrammus aeglefinus) are found on both
Red Sea bream in Subareas VI, VII and VIII
 Stock Annex; Red Sea bream in Subareas VI, VII and VIII Stock specific documentation of standard assessment procedures used by ICES. Stock sbr-678_sa Working Group Red Sea bream (Pagellus bogaraveo) in
STANDARDIZED CATCH RATES OF BLUEFIN TUNA, THUNNUS THYNNUS, FROM THE ROD AND REEL/HANDLINE FISHERY OFF THE NORTHEAST UNITED STATES DURING
 SCRS/2008/088 STANDARDIZED CATCH RATES OF BLUEFIN TUNA, THUNNUS THYNNUS, FROM THE ROD AND REEL/HANDLINE FISHERY OFF THE NORTHEAST UNITED STATES DURING 1980-2007 by Craig A. Brown 1 Sustainable Fisheries
Overview of Florida s Cooperative East Coast Red Snapper Tagging Program, SEDAR41-DW10. Submitted: 1 August 2014
 Overview of Florida s Cooperative East Coast Red Snapper Tagging Program, 2011-2013 Russell B. Brodie, Justin J. Solomon, Richard Paperno, Theodore S. Switzer, Cameron B. Guenther, and Beverly Sauls SEDAR41-DW10
ASMFC Stock Assessment Overview: Atlantic Menhaden
 Introduction This document presents a summary of the 217 Stock Assessment Update for Atlantic menhaden. The assessment is an update to the 215 Benchmark Stock Assessment that was peer reviewed by an independent
Sheepshead Fishery Overview South Atlantic State/Federal Management Board May 2014 Introduction Life History Landings
 Sheepshead Fishery Overview South Atlantic State/Federal Management Board May 2014 Introduction The Atlantic States Marine Fisheries Commission (ASMFC) does not currently manage sheepshead (Archosargus
August 3, Prepared by Rob Cheshire 1 & Joe O Hop 2. Center for Coastal Fisheries and Habitat Research Beaufort, NC
 SEDAR 19-DW05 Evaluation of the 1960, 1965, and 1970 U.S. Fish and Wildlife Service salt-water angling survey data for use in the stock assessment of red grouper (Southeast US Atlantic) and black grouper
STANDARDIZED CATCH RATE OF SAILFISH (Istiophorus platypterus) CAUGHT BY BRAZILIAN LONGLINERS IN THE ATLANTIC OCEAN ( )
 CAUGHT BY BRAZILIAN LONGLINERS IN THE ATLANTIC OCEAN ( )") SCRS/2008/079 STANDARDIZED CATCH RATE OF SAILFISH (Istiophorus platypterus) CAUGHT BY BRAZILIAN LONGLINERS IN THE ATLANTIC OCEAN (1986-2006) Catarina Wor 12 ; Bruno L. Mourato 1,3 ; Humberto G. Hazin 1
SCRS/2008/079 STANDARDIZED CATCH RATE OF SAILFISH (Istiophorus platypterus) CAUGHT BY BRAZILIAN LONGLINERS IN THE ATLANTIC OCEAN (1986-2006) Catarina Wor 12 ; Bruno L. Mourato 1,3 ; Humberto G. Hazin 1
2017 North Pacific Albacore Stock Assessment
 2017 North Pacific Albacore Stock Assessment 13 th Regular Session of the Northern Committee August 28-September 1, 2017 Busan, Republic of Korea ISC-Albacore Working Group 2017 North Pacific Albacore
PACIFIC BLUEFIN TUNA STOCK ASSESSMENT
 PACIFIC BLUEFIN TUNA STOCK ASSESSMENT SUMMARY 19-21 December 2012 Webinar PACIFIC BLUEFIN TUNA STOCK ASSESSMENT SUMMARY 1. Stock Identification and Distribution Pacific bluefin tuna (Thunnus orientalis)
Preliminary Draft of. SEDAR 17 Data Workshop Vermilion Snapper Report. Commercial Fishery (Section 3)
") SEDAR 17-DW-05 Preliminary Draft of SEDAR 17 Data Workshop Vermilion Snapper Report Commercial Fishery (Section 3) Prepared by: Douglas Vaughan Sustainable Fisheries Branch Southeast Fisheries Science
SEDAR 17-DW-05 Preliminary Draft of SEDAR 17 Data Workshop Vermilion Snapper Report Commercial Fishery (Section 3) Prepared by: Douglas Vaughan Sustainable Fisheries Branch Southeast Fisheries Science
Serial No. N4859 NAFO SCR Doc. 03/41 SCIENTIFIC COUNCIL MEETING JUNE 2003
 NOT TO BE CITED WITHOUT PRIOR REFERENCE TO THE AUTHOR(S) Northwest Atlantic Fisheries Organization Serial No. N4859 NAFO SCR Doc. 03/41 SCIENTIFIC COUNCIL MEETING JUNE 2003 Results of a Greenland Halibut
Status of Northern Pike and Yellow Perch at Goosegrass Lake, Alberta, 2006
 Status of Northern Pike and Yellow Perch at Goosegrass Lake, Alberta, 2006 CONSERVATION REPORT SERIES The Alberta Conservation Association is a Delegated Administrative Organization under Alberta s Wildlife
Spurdog (Squalus acanthias) in the Northeast Atlantic
 in the Northeast Atlantic") ICES Advice on fishing opportunities, catch, and effort Northeast Atlantic Published 11 October 2016 9.3.17 Spurdog (Squalus acanthias) in the Northeast Atlantic ICES stock advice ICES advises that when
ICES Advice on fishing opportunities, catch, and effort Northeast Atlantic Published 11 October 2016 9.3.17 Spurdog (Squalus acanthias) in the Northeast Atlantic ICES stock advice ICES advises that when
SAC-08-10a Staff activities and research plans. 8 a Reunión del Comité Científico Asesor 8 th Meeting of the Scientific Advisory Committee
 SAC-08-10a Staff activities and research plans 8 a Reunión del Comité Científico Asesor 8 th Meeting of the Scientific Advisory Committee IATTC RESEARCH PROGRAM Four programs: A. Stock Assessment; B. Biology
3.4.3 Advice June Barents Sea and Norwegian Sea Cod in Subareas I and II (Norwegian coastal waters cod)
") 3.4.3 Advice June 2013 ECOREGION STOCK Barents Sea and Norwegian Sea Cod in Subareas I and II (Norwegian coastal waters cod) Advice for 2014 ICES advises on the basis of the Norwegian rebuilding plan,
3.4.3 Advice June 2013 ECOREGION STOCK Barents Sea and Norwegian Sea Cod in Subareas I and II (Norwegian coastal waters cod) Advice for 2014 ICES advises on the basis of the Norwegian rebuilding plan,
Surf Clams: Latitude & Growth
 Surf Clams: Latitude & Growth East Coast MARE Materials For the leader: Projector Whiteboard to project data graph onto For the activity: Copy of data table Copy of map Computer program to graph in or
An update of the application of the A-SCALA method to bigeye tuna in the western and central Pacific Ocean
 SCTB15 Working Paper BET-6 An update of the application of the A-SCALA method to bigeye tuna in the western and central Pacific Ocean Chi-Lu Sun 1, Mark Maunder, George Watters, and Su-Zan Yeh 1 1 Institute
STUDY PERFORMANCE REPORT
 STUDY PERFORMANCE REPORT State: Michigan Project No.: F-81-R-1 Study No.: 436 Title: Vital Statistics of walleye in Saginaw Bay Period Covered: October 1, 1999 to September 30, 2000 Study Objective: To
Review on Size Sampling Frameworks for North Atlantic Albacore of Taiwanese Logline Fleets
 International Journal of Research in Engineering and cience (IJRE) I (Online): 23-9364, I (Print): 23-9356 Volume 6 Issue 4 Ver. I ǁ 18 ǁ PP. 27-41 Review on ize ampling Frameworks for orth Atlantic Albacore
Preliminary analysis of yellowfin tuna catch, effort, size and tagging data using an integrated age-structured model
 Preliminary analysis of yellowfin tuna catch, effort, size and tagging data using an integrated age-structured model Introduction John Hampton Secretariat of the Pacific Community Noumea, New Caledonia
INTER-AMERICAN TROPICAL TUNA COMMISSION SCIENTIFIC ADVISORY COMMITTEE FOURTH MEETING. La Jolla, California (USA) 29 April - 3 May 2013
 29 April - 3 May 2013") INTER-AMERICAN TROPICAL TUNA COMMISSION SCIENTIFIC ADVISORY COMMITTEE FOURTH MEETING La Jolla, California (USA) 29 April - 3 May 2013 DOCUMENT SAC-04-04c INDICES OF RELATIVE ABUNDANCE OF YELLOWFIN TUNA
INTER-AMERICAN TROPICAL TUNA COMMISSION SCIENTIFIC ADVISORY COMMITTEE FOURTH MEETING La Jolla, California (USA) 29 April - 3 May 2013 DOCUMENT SAC-04-04c INDICES OF RELATIVE ABUNDANCE OF YELLOWFIN TUNA
Cedar Lake Comprehensive Survey Report Steve Hogler and Steve Surendonk WDNR-Mishicot
 Cedar Lake- 2006 Comprehensive Survey Report Steve Hogler and Steve Surendonk WDNR-Mishicot ABSTRACT Cedar Lake is a 142 acre lake located in the southwest corner of Manitowoc County. It is a seepage lake
STOCK ASSESSMENT OF YELLOWFIN TUNA IN THE EASTERN PACIFIC OCEAN UPDATE OF 2011 STOCK ASSESSMENT. January 1975 December 2011
 STOCK ASSESSMENT OF YELLOWFIN TUNA IN THE EASTERN PACIFIC OCEAN UPDATE OF 2011 STOCK ASSESSMENT January 1975 December 2011 Outline Stock assessment (base case model) Methodology (Stock Synthesis) Fishery
Brief History of the Gulf Menhaden Purse-Seine Fishery. Ray Mroch NMFS Beaufort Laboratory
 Brief History of the Gulf Menhaden Purse-Seine Fishery Ray Mroch NMFS Beaufort Laboratory SEDAR 63 Review November 6, 2018 Scientific name: Brevoortia patronus (Family: Clupeidae) Distribution: from southwest
Hook Selectivity in Gulf of Mexico Gray Triggerfish when using circle or J Hooks
 Hook Selectivity in Gulf of Mexico Gray Triggerfish when using circle or J Hooks Alisha M. Gray and Beverly Sauls SEDAR43- WP- 09 25 March 2015 This information is distributed solely for the purpose of
2001 REVIEW OF THE ATLANTIC STATES MARINE FISHERIES COMMISSION FISHERY MANAGEMENT PLAN FOR WEAKFISH (Cynoscion regalis)
") 2001 REVIEW OF THE ATLANTIC STATES MARINE FISHERIES COMMISSION FISHERY MANAGEMENT PLAN FOR WEAKFISH (Cynoscion regalis) Plan Review Team Rick Cole, DE Louis Daniel, NC Charles Lesser, DE Rob O Reilly,
2001 REVIEW OF THE ATLANTIC STATES MARINE FISHERIES COMMISSION FISHERY MANAGEMENT PLAN FOR WEAKFISH (Cynoscion regalis) Plan Review Team Rick Cole, DE Louis Daniel, NC Charles Lesser, DE Rob O Reilly,
Year Avg. TAC Can Others Totals
 SKATE IN DIVISIONS 3L, 3N, 3O AND SUBDIVISION 3Ps Background There are 8 to 1 species of skate in the waters around Newfoundland. Of these, thorny skate (Raja radiata) is by far the most common, comprising
17-06 BFT RECOMMENDATION BY ICCAT FOR AN INTERIM CONSERVATION AND MANAGEMENT PLAN FOR WESTERN ATLANTIC BLUEFIN TUNA
 17-06 BFT RECOMMENDATION BY ICCAT FOR AN INTERIM CONSERVATION AND MANAGEMENT PLAN FOR WESTERN ATLANTIC BLUEFIN TUNA RECALLING the Recommendation by ICCAT to Establish a Rebuilding Program for Western Atlantic
The Emerging View of New England Cod Stock Structure
 Cod Population Structure and New England Fisheries Symposium: Furthering our understanding by integrating knowledge gained through science and fishing Putting it All Together: The Emerging View of New
Updated and revised standardized catch rate of blue sharks caught by the Taiwanese longline fishery in the Indian Ocean
 Updated and revised standardized catch rate of blue sharks caught by the Taiwanese longline fishery in the Indian Ocean Wen-Pei Tsai 1,3 and Kwang-Ming Liu 2 1 Department of Fisheries Production and Management,
Highly Migratory Species SWFSC/NMFS Report
 Agenda Item D..b Supplemental SWFSC PowerPoint June 206 Highly Migratory Species SWFSC/NMFS Report Gerard DiNardo Cisco Werner SWFSC PFMC Item D..b Tacoma, June 206 SWFSC HMS Research Activities Cooperative
REVISION OF THE WPTT PROGRAM OF WORK
 REVISION OF THE WPTT PROGRAM OF WORK IOTC 2016 WPTT18 08 Rev 1 PREPARED BY: IOTC SECRETARIAT 1, 3 OCTOBER 2016 PURPOSE To ensure that the participants at the 18 th Working Party on Tropical Tunas (WPTT18)
Andrew A. Rosenberg University of New Hampshire, USA
 by Andrew A. Rosenberg University of New Hampshire, USA Principles Recovery of overexploited stocks even after decades of overfishing is possible if fishing pressure and habitat impacts can be reduced
Chesapeake Bay Jurisdictions White Paper on Draft Addendum IV for the Striped Bass Fishery Management Plan
 Chesapeake Bay Jurisdictions White Paper on Draft Addendum IV for the Striped Bass Fishery Management Plan Maryland Department of Natural Resources, District of Columbia s Fisheries and Wildlife Division,
A SURVEY OF 1997 COLORADO ANGLERS AND THEIR WILLINGNESS TO PAY INCREASED LICENSE FEES
 Executive Summary of research titled A SURVEY OF 1997 COLORADO ANGLERS AND THEIR WILLINGNESS TO PAY INCREASED LICENSE FEES Conducted by USDA Forest Service Rocky Mountain Research Station Fort Collins,
Abundance, Distribution, and Habitat Use of Sharks in Two Northeast Florida Estuaries
 UNF Digital Commons UNF Theses and Dissertations Student Scholarship 202 Abundance, Distribution, and Habitat Use of Sharks in Two Northeast Florida Estuaries Michael Philip McCallister University of North
IFFO RS V2.0 FISHERY ASSESSMENT METHODOLOGY AND TEMPLATE REPORT. Fishery Under Assessment. Date. Assessor
 IFFO RS V2.0 FISHERY ASSESSMENT METHODOLOGY AND TEMPLATE REPORT Fishery Under Assessment Date Assessor IFFO RS Ltd, Unit C, Printworks, 22 Amelia Street, London, SE17 3BZ, United Kingdom Application details
Atlantic Shark Fishery: Gulf of Mexico. National Marine Fisheries Service (NMFS) Highly Migratory Species (HMS) Management Division
 Highly Migratory Species (HMS) Management Division") Atlantic Shark Fishery: Gulf of Mexico National Marine Fisheries Service (NMFS) Highly Migratory Species (HMS) Management Division Brief Outline Fishery Management Basics General Shark Management Species
Atlantic Shark Fishery: Gulf of Mexico National Marine Fisheries Service (NMFS) Highly Migratory Species (HMS) Management Division Brief Outline Fishery Management Basics General Shark Management Species