N. J. Cummings, S. C. Turner, D. B. McClellan, and C. M. Legault
|
|
|
- Archibald Mathews
- 6 years ago
- Views:
Transcription
1 SEDAR 15-RD05 Atlantic Greater Amberjack Abundance Indices From Commercial Handline and Recreational Charter, Private, and Headboat Fisheries through fishing year 1997 By N. J. Cummings, S. C. Turner, D. B. McClellan, and C. M. Legault U.S. Department of Commerce National Oceanic and Atmospheric Administration National Marine Fisheries Service Southeast Fisheries Science Center 75 Virginia Beach Drive Miami, Florida USA July 1999 Sustainable Fisheries Division Contribution No. SFD-98/99-62
2 Introduction Parrack (1993a,b), Cummings and McClellan (1996, 1997) and Cummings (1998) presented catch per unit of effort (CPUE) statistics for the Atlantic greater amberjack, Seriola dumerili, stock. This report updates the CPUE analyses of earlier studies through the 1997 fishing year, incorporates new analysis procedures, and presents a new index of stock abundance developed from tagging data observations. Virtual Population Analysis (VPA) techniques have been used to evaluate the condition of this stock. Information external to the input fishery catch at age data are required for tuning (calibrating) the VPA estimates of stocksize and mortality trends. Standardized CPUE observations or abundance trends (independent and fishery dependent) have been shown effective in the standardization or calibration of VPA s. Therefore, providing updated CPUE trends and implementing improvements in analysis methods is important in the analysis of the Atlantic greater amberjack stock status. Materials and Methods As in the previous 1996 evaluation of stock status, three separate sources of CPUE data existed for estimating temporal trends in abundance of the Atlantic greater amberjack stock. These included observations of recreational catch per angler and catch per angler hour from the Marine Recreational Fisheries Sampling Survey (MRFSS) data base of intercepted angler fishing trips from the shore, charter, and private vessel modes in the Atlantic ocean. In addition, for headboats operating from North Carolina through the Florida Keys, the National Marine Fisheries Service (NMFS), Beaufort Laboratory conducts a survey. This database is an archive of captain reports of landed catch in number per trip, and the number of anglers per trip collected since 1972 in the Carolinas, since 1976 in North Carolina through Daytona, Florida, and since 1977 in the Florida Keys. The third source of CPUE data was the NMFS Atlantic Snapper - Grouper and the Gulf of Mexico Reeffish Logbook database. This combined set of commercial data referred to as the Logbook data in this report, is an archival landings reports made by all commercial fishermen that have federal permits to fish in the Atlantic Snapper - Grouper and also in the Gulf of Mexico fishery. The logbook survey was begun in January 1992 in the Atlantic in response to the mandate of Amendment 4 of the South Atlantic Snapper-Grouper Fishery Management Plan to collect information pertaining to the Atlantic reeffish fisheries. The logbook survey was begun in April 1990 in the Gulf of Mexico as part of the Gulf of Mexico Fishery Management Plan Data collection requirements (McClellan and Bohnsack 1991, Anon. 1987). During the early years only a sample of the permit holders (drawn randomly at a 25% rate) were required to report. Reporting became mandatory in 1993 in the Atlantic (Harris et al. 1994) and in 1991 for Florida vessels fishing in the Gulf of Mexico. It was necessary to select landings reports from the Gulf survey as well as the Atlantic since some permit holders who fish the Atlantic stock, especially in the Florida Keys region, may report to both systems. Reports were identified as duplicates and removed prior to analyses. A new abundance index for the Atlantic greater amberjack was developed from tagging observations from releases made by scientific and recreational anglers from the early 1960 s through
3 MRFSS CPUE Analysis Procedures The MRFSS based CPUE indices included intercepts from recreational fishing trips having a positive catch of greater amberjack (whether targeting or not) and also intercepts with zero catches of greater amberjack that indicated they were targeting any of the four highly sought amberjack species (greater, banded rudder, almaco and lesser). As with previous MRFSS indices, observations from Monroe county Florida were considered in the analysis. Information recorded for each observation included the year, month, state and county of intercept, and whether targeting greater amberjack. In addition, a variable referred to as bag limit stanza corresponding to un-regulated or 3 fish per person was defined and each observation coded for this variable. Fishing year was calculated, as May 1-April 30, for each observation from the month and year of intercept. These five independent variables (fishing year, month, state-county, target id, and bag limit stanza) were used to adjust the fishing year CPUE indices for the estimated effects of these variables on catch rates. General linear modeling statistical methods (Robson 1966) as previously used in Parrack (1993a,b) and Cummings and McClellan (1996,1997), were used in calculating the abundance indices for the MRFSS observations of positive catch. The Lo method (Lo et al. 1992) was explored to develop an abundance index for Atlantic greater amberjack from the combined set of charter and private CPUE observations of zero catch in addition to the positive catches. The Lo method assumes a delta-lognormal error structure in the raw data and generates an estimate of CPUE from the product of two models. One model estimates frequency (the proportion of intercepts in which greater amberjack was caught) assuming a binomial error distribution and the second model estimates the mean density of greater amberjack within positive trips assuming a lognormal error distribution. Previous analyses of the MRFSS CPUE observations indicated the amount of observed variability in the raw catch per hour fished data was high, especially in the private boat f fishery, therefore this year s analyses were made separately for the charter and the private boat data as well as the combined set of charter and private data. Few intercepts were from the shore-based fishery therefore these were not considered in the CPUE abundance analyses. Commercial Logbook CPUE Analysis Procedures The NMFS Atlantic Snapper - Grouper and the Gulf of Mexico Logbooks were also used to develop an index of abundance for greater amberjack in the Atlantic. This combined set of commercial data referred to as logbook below contains landings reports from commercial fishermen that have federal permits to fish in the Atlantic Snapper - Grouper and the Gulf of Mexico reef fish fisheries. The logbook survey was initiated in the early 1990 s. During the early years only a sample of the permit holders (drawn randomly) were required to report, however, reporting became mandatory in about 1994 in the Atlantic. It was necessary to select landings reports from the Gulf survey as well as the Atlantic since some permit holders who fish the Atlantic stock, especially in the 3
4 Florida Keys region, could report to either or both systems. Duplicate reports in the two databases were identified and removed prior to analysis. Logbook records existed from 1991 to 1998 by trip; no within trip information was available (if a trip involved fishing in multiple locations and/or on multiple days, the catch (i.e., landings) and effort data could not be identified for those separate events). Recorded data included landed weight by species (converted to whole weight as necessary), information on the primary fishing gear used and location of the effort and/or catch by 1 o latitude and longitude square. A preliminary definition of fishing year from April through March of the following year was used for initial examination of the data. A variety of effort measures were available depending on the fishing gear and at a minimum included days at sea and hours fished. The number of trips, proportion of trips with greater amberjack and the proportion of greater amberjack in the total landings were summarized by fishing gear and fishing year to determine which gear(s) would be used for developing indices of abundance. Multiple measures of fishing effort were evaluated to select one for use in developing indices of abundance; these reviews included both examination of frequency distributions of individual effort components (hours fished, sea days, hooks per line, lines, etc) as well as total annual effort measures. The data indicated that apparently extreme values occurred for some effort measures such as hooks per line. In an attempt to reduce the influence of extreme observations on catch rates, a policy of eliminating the upper and lower 1% of the observations for each effort measure was established. Regression tree analysis (Venables and Ripley 1997) was used for preliminary data exploration primarily for the purpose of defining seasons and regions for use as explanatory variables. Separate analyses were conducted using as the dependent variable (1) proportion of positive caches and (2) catch per hook on trips on which caught greater amberjack (successful trips). Independent variables examined included fishing year, month or season (3 month seasons with January-March, etc.), latitude and longitude (based on the southeast corner of each one degree square) or region (defined from the results of earlier regression tree analyses). General linear model (GLM) analyses were used to select the effort measure for trips on which greater amberjack were caught. The dependent variable was the log of the landed weight, and a lognormal error distribution was assumed. Multiple analyses were made each including a different measure of effort as an explanatory variable along with fishing year, season and region. The coefficient of determination (R 2 ) and the probability of the F statistic for the effort effect were used to select the measure of effort for use in calculating catch rates. Indices of abundance were derived using the Lo method (Lo et al 1992) which assumes a delta lognormal error structure, employs separate GLM analyses of the proportions of positive trips and the catch rates on trips which caught amberjack, and combines the results of the separate analyses to derive the index. A binomial error assumption was 4
5 used for the proportion positive analyses and a lognormal error assumption was used for the analyses of positive trips. Fishing year, season and region were included in the analyses along with the season * region interaction if significant. In addition random effects year (fishing year) interactions with season and region were included where data were sufficient and if a significant effect was indicated. If possible three-way random effects year interactions (fishing year*season*region) were included; if the data would not support a three-way interaction one or more two-way random effects year interactions were included. NMFS Headboat CPUE Analysis Procedures Data were available from the NMFS headboat survey from The data consists of captains reports of the number and estimated weight of landed catch by species, the number of anglers on board the boat, the type of trip. Trip type included information on the length of the trip: half day, ¾ day, full day, multi-day and the time of the trip: day or night for full as well as early or late in the day or night for partial day trips. The data usually included information on the geographical location of the catch by 10 square. To eliminate effort clearly unrelated to greater amberjack, data were restricted to 10 squares in which greater amberjack (Seriola dumerili) or other members of the genus were ever recorded. To ensure that catches came from the stock under consideration, it was assumed that greater amberjack from the other side of the Gulf Stream were from a different population and fishing effort in the Bahamas and similar areas were excluded. To examine possible positive or negative associations of greater amberjack catch rates with other fishes; catches of other taxa were tabulated along with those of greater amberjack. Both relatively desegregated and highly aggregated taxonomic groupings were investigated. The desegregated classification included single species groups (such as black sea bass), genera (such as Myctoperca), families and groupings of similar species (such as large pelagics, or inshore Lujanids or offshore Lujanids); a total of 25 taxa were defined. Three classifications of aggregated taxa were defined; they were inshore species, offshore bottom oriented species and offshore pelagic species. Taxa were classified by their proportion of the total number of fish reported from a trip. Four levels of classification were used for preliminary analyses and two levels for subsequent analyses. The four levels were 0 (absent), and 1-3 indicating increasing proportions. The divisions between levels were taxa specific, because some taxa were frequently observed at all proportions while others were observed frequently up to some intermediate percentage of the catch. In final analyses the classifications for the aggregated taxa were summarized into 0 (absent or low) or 1 (moderate to high). Preliminary analyses indicated that there was a negative relationship between greater amberjack catch and the number of anglers on the boat, and therefore the basic unit of effort was defined as the trip and catch rates were defined as catch per trip. Regression tree analysis was used to explore the data set for possible aggregation into seasons and regions and to investigate the possible influences of the various taxonomic groupings. 5
6 Indices of abundance were derived using the Lo method (Lo et al. 1992), which assumes a delta lognormal error structure, employs separate GLM analyses of the proportions of positive trips and of the catch rates on trips which caught amberjack, and combines the results of the separate analyses to derive the index. A binomial error assumption was used for the proportion positive analyses and a lognormal error assumption was used for the analyses of positive trips. Fishing year, season and region were included in the analyses and in most cases information on catches of other species on the trip was also included. For the season, region and taxonomic factors two-way and three-way interactions were investigated to the extent permitted by the distribution of the data and the analysis. In addition random effects year (fishing year) interactions with the other factors were included if possible where data were sufficient and if a significant effect was indicated. The highest order random effect interactions, which could be estimated, were included. Tagging Data Analyses Tag and recapture observations from 1960 through 1998 were available. McClellan and Cummings (1997) provided a description of the data for the years The more recent data ( ) were extracted from the NMFS, Cooperative Tagging Center tagging database (D. Rosenthal, pers. comm.) and the observations combined. For each observation the date of tagging and date of recapture was recorded thus allowing the corresponding fishing year period, May April to be calculated. These data were used to generate a fishery independent estimates of the relative loss of the Atlantic greater amberjack stock. Several estimates were developed and the best estimate of relative loss used to create an index of relative abundance for the Atlantic greater amberjack stock. Porch s (1998) method of estimating annual mortality rates from tagging data is based upon the probability of a tagged fish being recaptured assuming M and reporting rates are constant over time: p( recapture) = I i= α F e w i w 1 Zi i Zw ( tw dw ) i = α Fi Z i i ( 1 e ) e Z i 1 Z j j j = α Where t α = time (date) animal was tagged t w = time (date) animal was recaptured α = discrete time interval during which the animal was tagged w = discrete time interval during which the animal was recaptured d I = time (date) at start of i th interval, except d α =t α I = time spent in each interval (d i+1 -d i ) I = last interval for which data are available 6
7 F = Z = fishing mortality rate all sources of tag loss, includes natural and fishing mortality, tag shedding, non-reported recaptures, emigration, etc. This method in practice cannot distinguish between sources of tag loss. The method estimates the total tag losses (Z*) for each time period. These Z* values contain the effects of tag shedding, emigration from the study area, non reported recaptures, etc in addition to natural and fishing mortality rates. If all factors other than annual fishing mortality rates can be assumed constant during the study period, then the relative change in the annual Z* estimates from this method can be used as an index of the relative changes of annual F in the fishery. The loss rate reported here is formed by dividing each annual Z* estimate by the average of all estimates such that the index is centered about 1.0. This standardization allows for easy comparison of values estimated under different assumptions or from different subsets of the database. The program TAP2 (C. Porch; NMFS, SEFSC, pers. comm.) allows for two methods of estimating these time period specific Z* rates. Each Z* can be estimated independently or through a Bayesian random walk. In the case of the random walk, the amount of change allowed in Z* between successive time intervals is determined by a user supplied value (σ) which causes changes larger than e σ to be unlikely. The discrete time intervals used in the program were fishing years from May of one year to April of the next calendar year, with the exception of the first and last time periods. The first time period ranged from January 1960 to April 1961 and the last time period ranged from May 1997 to December Not enough data was available in these periods to use only single fishing years. Four estimation procedures were considered for the time series; estimating annual loss rates for all years independently and fixing the random walk sigma at the values of 0.1, 0.3 and 0.5. The random walk sigmas constrain the model such that interannual variation in Z* s are permitted to vary to lower degrees with lower sigmas. These estimates used only fish, which had at least one day at large between time of tagging and time of recapture. A number of sensitivity analyses were also performed, for example, estimating Z* values for periods of two years, changing the minimum number of days at large, or allowing changes in tag-recapture rates. The resulting series of Z* estimates were rescaled by the average for that time series and case to produce the relative loss values. The number of greater amberjack caught each year in the private angler sector of the recreational fishery (Cummings and McClellan 1999) was used to transform the loss estimates into relative abundance estimates because the majority of tags were from this sector. The catches were either kept and released dead fish (A+B1) or all catch, including fish released alive, (A+B1+B2). These annual catches were used in the catch equation by assuming a constant level for the natural mortality rate (M) and a constant level for nonfishing related tag loss such that the Z* could be separated into its components of M, F and non-fishing related tag loss. The only remaining unknown in the catch equation is then the population abundance in numbers [N=CZ/(F(1-e -Z ))]. Each time series of values was re-scaled to average 1.0 by dividing annual values by the average of the time series. 7
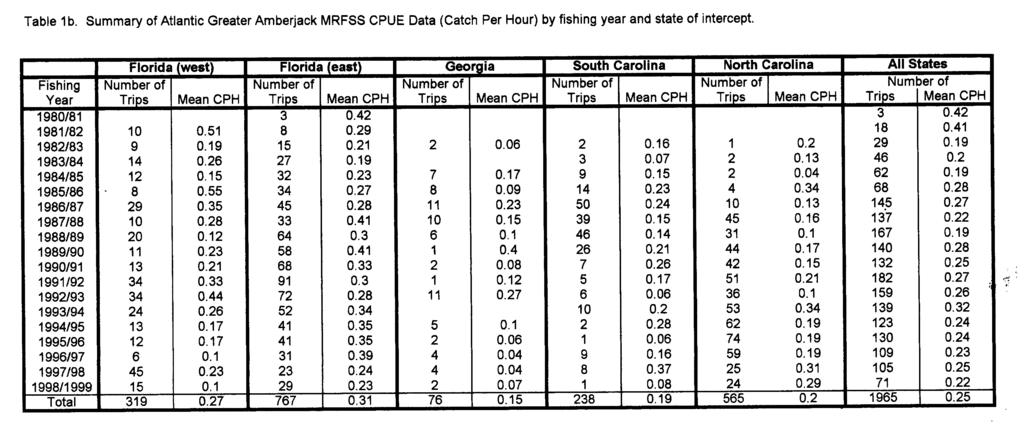
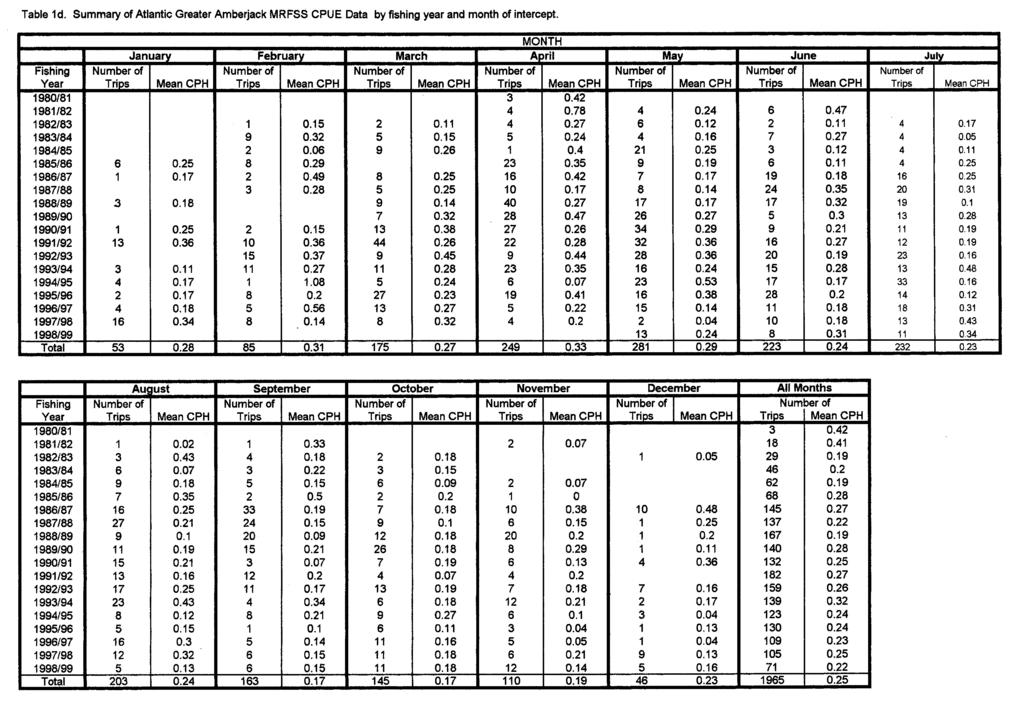
8 These relative abundance values could be used as a tuning index for age structured assessment models, such as virtual population analysis. Greater Amberjack CPUE Analysis Results MRFSS CPUE Analyses Summary statistics on the number of MRFSS intercepts and the nominal CPUE values of catch per angler hour (CPH) fished available for the charter and private boat fisheries for Atlantic greater amberjack are given in Tables 1a 1e. Fishing year 1998/99 (May April ) was incomplete as data were only available through December 1998 thus only fishing years 1981/ /98 were used in developing abundance trends. The majority of the intercepts were from fishing years 1986 through 1995/96. Most anglers catching one or more of the amberjack species were intercepted on the East Coast of Florida (n=767) followed by North Carolina (n=565), and then off Monroe county, Florida (n=319) (Table 1b). Recreational fishing trips from Georgia and South Carolina contributed 4% and 12% respectively to the total database of charter and private boat intercepts. Intercepts from the charterboat recreational mode made up 69 % of the data and 31 % of the intercepts were from the private boat fishery. The nominal CPUE values suggest that the private boat fishery CPUE (CPH) was higher (across all years) than for the charterboat fishery for Atlantic greater amberjack (Table 1c). The exception to this was in Georgia. The monthly distribution of MRFSS intercept observations (Table 1d) indicates that amberjack were encountered during most months of most fishing years and also indicates temporal differences in the nominal CPUE values. Effort measures other than anglers or hours fished were not recorded thus catch per angler angler hour was calculated and used. The plotted CPH data showed skewed distributions suggesting a transformation was appropriate (Figure 1). A log transformation of the raw CPH fished observations resulted in a more symmetrical distribution of the charter and private boat fishery intercepts (Figure 1). Relative abundance trends, referred to as standardized abundance trends, in this paper, were calculated using the GLM approach for the charter and private fisheries separately, the combined dataset of charter and private boat intercepts, and for the charter and private intercepts from Florida only. Summary results pertaining to each fit are included in Table 2. For each fit, the y-variate, was CPH fished and auxiliary information included in each fit as (X) variables to adjust CPH trends were the fishing year, month of intercept, state-county id, whether targeting greater amberjack or not, and bag limit stanza. In the case of the charter and private boat combined analysis, fishery type was also included as an independent variable in the mode. As in previous year s analyses of the MRFSS CPUE observations for Atlantic greater amberjack, the analyses indicated the amount of un-explained variability in the data from these models was high. The proportional amount of the variance explained by the fits was not high, ranging from 21 to 44 %. The best fit in terms of R 2 was obtained using the charterboat fishery observations, all states combined. For the majority of the fits, the inclusion of bag limit stanza (3 or none) or a term for whether the angler was targeting greater amberjack or was not targeting this species not was not significant in the model. 8
9 The calculated standardized abundance trends from the GLM fits for the charter and private boat fisheries off Florida were not in total agreement (Figure 2). The estimated fishing year abundance pattern from the charterboat fishery showed variability from 1981 through 1992 and stable abundance thereafter (Figure 2). The private boat fishery abundance pattern suggested increased abundance from and followed by a decline through 1996 (Figure 2). The variability in these estimates was high. Estimates of the number of fishing trips from these fisheries are available through the MRFSS survey; these were summarized by fishing year to obtain some feeling for the amount of total recreational effort expended by each fishery group (Figure 3). Estimated charterboat effort (number of fishing trips) was stable from about 1990 through 1997 while the estimated private boat effort (number of fishing trips) showed large increases between 1985 and 1988, a decline of about 30% in 1989, varied without trend through 1995, and declined again in The GLM estimated abundance trends from the all states combined fit charter and private boat fisheries are shown by fishing year with the estimated total effort for each fishery (Figure 4). The all states combined abundance estimation results were used in subsequent analyses of the stock evaluation as the trends did not differ when only the Florida samples were used; using the observations from all states better represented the range of the Atlantic greater amberjack stock, increased the sample size and the R 2 values were higher. The Lo method was used to develop abundance trends of the Atlantic greater amberjack stock using the combined data from the charter and private boat fisheries, all states combined. For this analysis observations of positive catches of Atlantic greater amberjack and also observations of zero catches of greater amberjack that occurred when an angler was intercepted and reported catching one of the other commonly sought after amberjacks (e.g., Alamo, banded rudder, lesser) but did not catch greater amberjack. were used. These anglers could have reported targeting greater amberjack (or any of the other jacks listed here). The model included the same independent variables as used in the previous GLM runs (fishing year, month, state-county, fishery, bag_limit stanza, and whether targeting greater amberjack or not). The Lo method produced similar results, as did the GLM procedure for the charter and private boat data combined, however the variance estimates of the fishing year parameter were much higher. All of the independent variables were important in explaining CPUE except for bag limit as the case found using the GLM. In this application since very few observations of zero greater amberjack catches existed in this dataset, the analysis set was very similar to that of the input data used in the GLM. The proportion of positive catches was very high and similar results would be expected since this portion of the data dominated in the calculation of the expected CPUE. For this reason and also because the variability was lower for the fishing year estimates estimate via GLM, the GLM abundance estimates results were used in further analyses related to the status of the Atlantic greater amberjack stock. Future evaluation of this approach using the total intercept database may be warranted. 9
10 Commercial Logbook CPUE Analyses The number of trips, proportion with greater amberjack and the pounds per trip by fishing gear and fishing year (Tables 3-5), were reviewed to select which observations would be used for developing indices of abundance. Data from gears from which little data were available [cast net, gill net, trap, vertical longline (buoy) or other] were not included in those tables and were not considered for analysis. It was decided to develop an index from handline data because there were substantial numbers of trips recorded and greater amberjack generally represented a substantial fraction of the total landings (roughly 15-25% across all trips). Longlines were rejected because greater amberjack generally represented less than 1% of the total landings. Powerheads are a special kind of spear fishing gear. Development of a combined spear and powerhead index was initially considered, because greater amberjack were reported on a substantial fraction of the powerhead and spear trips (generally over 35% and 20%, respectively) and represented substantial fractions of the total yield (roughly 20-40%). It was thought necessary to distinguish the two gears in developing an index of abundance, because of probable differences in efficiency. It was noted that the two gears would not be distinguished in the earliest years of the data set and the consistency in the number of trips per year suggested that they were reliably distinguished only from It was decided that an index would not be developed from these gears, because of the small number of years available. It was decided not to develop an index from the troll data, because of the relatively small proportion of amberjack in the total yield reported taken by trolling. Regression tree analysis of handline catch rates and proportions of positive trips were used to define seasons and regions. Examination of proportion positive and catch rates by month (Appendices 1 and 2) indicated that lower positive catch rates and lower proportions positive occurred in the more northern latitudes. It was noted that latitude 29 had high positive catch rates in most months and high proportions positive. May and March (months 5 and 15) had high positive catch rates and high proportions positive, while April had lower statistics. Differences were noted in the relative importance of latitudes between the proportion positive and the positive catch rate analyses. In aggregating latitudes into regions, greater weight was placed on the proportion positive results (i.e., estimates of the probability of catching amberjack on a trip), because often proportion positive has a stronger influence on abundance index patterns than the positive catch rates. Therefore four regions (24-26N, 27-28N, 29-33N and 34-35N) were defined. The analytical results with respect to month were more consistent between the proportion positive and positive catch rate analyses. Because May and March were the months of the highest positive catch rates and proportion positives, they were combined with April into one season and three other 3 month seasons were defined. Units of effort considered for calculating catch rates from the handline fishery included days at sea, hours fished during the entire trip, number of lines fished per day, number of hooks fished per day, total number of line-days (lines per day * days at sea), total number of line-hours, total number of hook-days and total number of hook-hours. GLM analyses of greater amberjack landings per trip with the various effort measures (Table 6) had low 10
11 R 2 (10-12%). Hooks per day had the lowest probability for the F statistic and highest R 2 and was selected as the unit of effort. All Vessels Fishing year, season and region were investigated as effects in analyses with data from all handline vessels. The season*region interactions were statistically significant in both the proportion positives and the yield per hook analyses and the random effects three way interaction was estimable and included (Tables 7 and 8). The estimated index of abundance (Table 9 and Figure 6) had a high fishing year 1991 value with a coefficient of variation of 0.51 which was roughly twice that of subsequent years. After 1991 the index shows an increase to 1995 and a decline thereafter. The confidence intervals (two standard errors above and below the index) suggest that differences in the annual index values were not highly significant. Analysis of Restricted Data Sets There was concern that some handline vessels might not target amberjack or species with which amberjack might be associated. If the fraction of vessels not targeting amberjack or associated species changed over time then an index of abundance from the entire fishery might be influenced by changes not related to abundance. Therefore additional indices were derived using data from selected vessels which might have been targeting amberjack or associated species. Restricted data sets were developed by limiting the observations to those vessels with either high proportions of trips with greater amberjack or high greater amberjack catch rates on successful trips. Additionally, to be included, vessels had to have reported at least 10 handline trips in each of at least 5 years in a region. 90 th -99 th Percentile Vessels Results of the analyses of data from vessels in the top 10% of vessels in proportion positive or catch rate on successful trips are presented in Tables 10 and 11. Data from the 27-28N region were excluded to permit a more balanced distribution of data across fishing years, seasons and regions. The three-way random effects interaction (i.e., fishing year*season*region) appeared to be influential and was included in both models. The standardized index (Table 12 and Figure 7) indicated high catch rates of Atlantic greater amberjack in the 1994 and 1995 fishing years with catch rates in and at similar levels and the lowest catch rate in th -99 th Percentile Vessels Results of analyses of data from vessels in the top 25% of vessels in proportion positive or catch rate on successful trips are presented in Tables 13 and 14. Data from 1991 and from the 27-28N region were excluded to permit a more balanced distribution of observations across fishing years, seasons and regions. The season*region interaction was significant in both models, and the three-way random effects interaction appeared to be influential in both. The standardized index (Table 15 and Figure 8) indicated high catch rates in 1992, 1994 and 1995 with catch rates in 1993 and at similar levels and the lowest catch rate in
12 Comparison between the three indices (Figure 9) showed that the indices had similar patterns. The analyses using all handline vessels and using the vessels in the 90 th -99 th percentile included 1991; the divergence of those indices in 1991 may reflect sparse data distribution in that year. Because of the possibility that effects not related to greater amberjack abundance may have influenced the all vessel index trend, the restricted data set trends were preferred. Because the two restricted sets had generally similar patterns, the 75 th -99 th percentile index was selected for use in subsequent assessments, because this index was based on more data and the data were more evenly distributed because of the elimination of 1991 year data and the observations from 27-28N region. NMFS Headboat CPUE Analyses Results Regression tree analysis of headboat catch (number of fish) per angler was used to gain insight into effects due to trip types, associated taxa as well as seasonal and geographic patterns in the data. Initial analyses included trip type and desegregated taxa (Appendix 3) and trip type with aggregated taxonomic information (Appendix 4). The analyses with trip type consistently indicated substantially higher catch rates for full day trips than for partial day trips. Because the partial day catch rates were so low, it was concluded that they might not provide much information on greater amberjack abundance patterns and they were excluded from subsequent analyses. Additional analysis was conducted using only full day trips with the aggregated taxonomic information (Appendix 5). Common components of all three of these analyses were that latitude 30 or 30 and 31 had higher catch rates than the other latitudes and that substantially higher average catch rates occurred in or When data splits were based on month, May was almost always classified with the higher catch rates and April was often in that grouping. It was also noted that in these analyses the first low catch rate node (node 2) accounted for 80-90% of the observations, and there was less discrimination provided by the explanatory variables for those low catch rates than for the higher catch rates classified below node 3. Thus the numerous low catch rate observations had less information content than the higher catch rate observations. Examination of positive catch rates by latitude and month (Figures 10 and 11) provided additional detail for defining regions and seasons. The high catch rates in the area of 30N were apparent. Examination of the associated raw data revealed that those catch rates were associated with multiple vessels in multiple months and that lower catch rates were observed in the same region at about the same time. Based on the regression tree results and Figure 10, four regions were defined: N, N, N, and N. It was decided to use four seasons of three months each. As noted from the regression tree results and in Figure 11, April and May often had higher catch rates and June had higher rates than March. Therefore April, May and June were combined and the remaining months assigned to appropriate seasons. The fishing year thus started in April and continued through March of the following year. Initial analyses of proportions positive and positive catch rate revealed difficulties associated with the taxonomic variables. Those variables were often correlated and typically there were few observations for some levels of those effects which resulted in a 12
13 very sparse distribution of the data and associated difficulties in analytical fitting. Collapsing the three aggregated taxonomic groups to two levels from four did not eliminate the problems; therefore one of those variables (inshore species) was selected for inclusion in the final model. The data available for the earliest years of the head boat survey were limited in number and geographic coverage. Because of very limited samples in those early years all data from 1974 and 1975 were excluded, the data for the N region were restricted to 1978 and later, and the data for the N region were restricted to 1979 and later. Final analyses included factors for fishing year, season, region and the relative importance of inshore species in the catch. A four-way random effect interaction term was included. Results of the analyses of proportions positive and of catch rates on trips with greater amberjack are shown in Tables 16 and 17. The final index showed an increase from 1977 to a peak in 1982, a general decline through much of the 1980 s, with fluctuating levels in the late 1980 s through mid 1990 s and lower levels since then (Table 18 and Figure 12). One additional set of analyses was performed to investigate the influence of the inshore taxa factor on the estimated standardized catch rates by redoing the all final analytical steps without that factor. Figure 13 shows that the relative index was quite similar with or without the inshore factor. Tagging Data Loss Rate Results The number of greater amberjack tagged, the number recaptured, and the relative loss values with coefficients of variation for each year are presented in Table 19 and relative loss is shown in Figure 14 The general pattern is the same in all four scenarios, high values in the 60's, decreasing to the lowest values in the 80's, followed by an increasing trend in the 90's. The coefficients of variation (CV) for the random walk models reflect the constraint imposed by the random walk process while the CV for the independent estimation of each year depends upon the sample size for that year (Table 19 and Figure 15). Three types of sensitivity analyses were performed. Instead of estimating Z* for every year, one Z* was estimated for every two years in order to examine if the low number of observations in some years were causing artifacts in the Z* estimates. The relative loss pattern did not change (Figure 16). Secondly, the minimum number of days at large was changed from one to either zero or seven in order to examine whether sufficient mixing of tagged and untagged fish was occurring. Again, the relative loss pattern did not change (Figure 17). The final sensitivity analysis allowed the proportion of tags reported to vary through a random walk process instead of being held constant in order to examine whether changes in reporting rates could explain the changes in Z*. Under two levels of sigma for the reporting rate random walk, the relative loss pattern did not change (Figure 18) even though the fraction reported was estimated to decrease over time (Figure 19). Since all sensitivity analyses showed the same relative loss pattern, the EstAll time series was used to form relative abundance time series using the two catch series (Figure 20) and four assumptions of how Z* could be split into its components (Table 20 and 13
14 Figure 21). The eight relative abundance time series are similar in trend and have a similar pattern of uncertainty about the point estimates, as demonstrated by Case 1 (Figure 22). The trend in abundance is increasing, but highly variable especially at the two peaks, from 1981 through From 1989 to 1990, the relative abundance values drop suddenly both in value and in variability. The trend from 1990 through 1997 is decreasing, with lower levels of uncertainty than the 1981 through 1989 estimates. This change in level of variability is caused by a large change in sample size (see Table 19). Given the high level of uncertainty in the 1981 through 1989 values, the relative abundance trends for the eight cases were computed for only years 1990 through 1997 (Table 21 and Figure 23). Note these computations only rescaled the estimates from , they did not require additional Z* estimation. These values grouped by the catch used in the calculations, with the four assumptions of how Z* is split adding only a small additional amount of variability among the cases. The relative abundance trends are more dependent upon the choice of catch than the choice of M and non-fishing related tag loss, when the latter two are assumed constant over the time series. If either M or the non-fishing related tag loss varied within the time series, these variables would become much more important in determining the trend in relative abundance. Plotting the uncertainty about the point estimates for Case 1 shows that some of the values are significantly different from others at the 80% confidence level (Figure 24). A summary of the indices considered for use in further evaluations of the Atlantic greater amberjack stock condition is given in Table 22. These results provide four measures of the abundance of this stock. Three of the indices overlap in some degree as they all derived from recreational fishery, MRFSS charter, MRFSS private, and the tagging index. Future CPUE examinations should further examine the disparity between the MRFSS charter and the private index. Further examinations of the logbook data might consider the effect of zero trips in the analysis as done for the headboat fishery. Analyses of the tagging data might consider the impact of time at liberty on the loss rate calculation. Sutherland and Scott (see McClellan and Cummings 1996) reported greater amberjack generally had limited movements with about one third of the tagged fish recaptured within 60 days of release. McClellan and Cummings (1996) reported that 41 % were recovered within 90 days, 69% within one year and 84.8% within two years. Acknowledgments Patty Phares provided all data pertaining to the recreational and headboat fishery. John Poffenberger provided commercial logbook data and Nelson Johnson answered many questions related to using these data. Clay Porch provided the analysis program, TAP, used in the tagging analysis. Larry Massey provided editorial assistance. Thanks are extended to these individuals for their timeliness. Literature Cited Cummings, N. J Fishery statistics for the Atlantic greater amberjack, Seriola dumerili, since U.S. Dept. of Comm., NOAA, NMFS, SEFSC, Sustainable Fisheries Division SFD/98/ p. 14
15 Cummings, N. J. and D. B. McClellan Characteristics of the Atlantic greater amberjack fishery through fishing year U.S. Dept. of Comm., NOAA, NMFS, SEFSC, Sustainable Fisheries Division SFD/98/99-61p. Cummings, N. J. and D. B. McClellan Status of the Greater Amberjack, Seriola dumerili, in the southeastern United States through Proc. Gulf and Carib. Fish. Inst. 49: Harris, K. C., G. N. Johnson, C. W. Krouse, and A. J. Chester The 1993 South Atlantic snapper-grouper logbook program. U.S. Dept. of Comm., NOAA, NMFS, SEFSC Miami Lab. Contr. MIA- 50p. Lo, N.C., L.D. Jackson, and J.L. Squire Indices of relative abundance From fish spotter data based on delta-lognormal models. Can. J. Fish. Aquat. Sci. 49: McClellan, D.B. and J. A. Bohnsack Review of the Gulf of Mexico reef fish logbook reporting system. U.S. Dept. of Comm., NOAA, NMFS, SEFSC Miami Lab. Contr. MIA- 36p. McClellan, D.B and N.J. Cummings Preliminary analysis of tag and recapture data of the greater amberjack, Seriola dumerili, in the southeastern United States. Gulf and Caribbean Fisheries Institute Proceedings 49: Parrack, N. C. [1993] The exploitation status of the Atlantic amberjack fisheries through U.S. Dept. of Comm., NOAA, NMFS, SEFSC Miami Lab. Contr. MIA-92/ p. Parrack, N. C. 1993b. Updated fisheries information for greater amberjack through U.S. Dept. of Comm., NOAA, NMFS, SEFSC, Miami Lab. Contr. No. MIA- 92/ p. Porch, C. E Estimating Atlantic bluefin tuna mortality from the release and recapture dates of recovered tags (preliminary results). ICCAT SCRS/98/65. 9 pp. Robson, D. S Estimation of the relative fishing power of individual ships. ICNAF Res. Bull. No. 3:5-15. Venables, W. N. and B. D. Ripley Modern applied statistics with S-Plus. Springer. New York. 548 p. 15
16 Table 1a. Summary of Atlantic Greater Amberjack MRFSS CPUE data on Catch per Hour )and Catch per Angler hour (CPA). Fishing Number of Year Observations Mean CPH Mean CPA 1981/ / / / / / / / / / / / / / / / / /
17 17
18 Table 1c. Summary of Atlantic Greater amberjack MRFSS CPUE Data by fishing mode and state of intercept. Florida (west) Florida (east) Georgia South Carolina North Carolina All States Fishing Number of Number of Number of Number of Number of Number of Mode Trips Mean CPH Trips Mean CPH Trips Mean CPH Trips Mean CPH Trips Mean CPH Trips Mean CPH Charter Private ALL
19 19
20 Table1e. Summary of Atlantic Greater Amberjack MRFSS Data for observed Catch per Hour (CPH) by state and code county. Florida (west) Florida (east) Georgia South Carolina North Carolina All States Fishing Number of Number of Number of Number of Number of Number of Area Trips Mean CPH Trips Mean CPH Trips Mean CPH Trips Mean CPH Trips Mean CPH Trips Mean CPH ALL
21 Table 2. Summary Results of the Atlantic Greater amberjack MRFSS CPUE Analyses Proportion of Total Comments On RUN ID TYPE MODEL FIT # Observations Sum of Squares Explained Model Fit Florida GLM ON Positive Catches Bag Limit Term Not Significant Charter 2 Florida GLM ON Positive Catches Bag Limit Term Not Ssignificant Private 3 Charter GLM ON Positive Catches Bag Limit Term Not Significant All States 4 Private GLM ON Positive Catches Bag Limit Term Not ignificant, All States Month not Significant 5 Charter GLM ON Positive Catches and Private
22 Table 3. Number of trips by gear and fishing year. H = handline, L=longline, P=powerhead, S=spear, and TR=troll. FISHYEAR GEAR H L P S TR Total ƒƒƒƒƒƒƒƒƒˆƒƒƒƒƒƒƒƒˆƒƒƒƒƒƒƒƒˆƒƒƒƒƒƒƒƒˆƒƒƒƒƒƒƒƒˆƒƒƒƒƒƒƒƒˆ ƒƒƒƒƒƒƒƒƒˆƒƒƒƒƒƒƒƒˆƒƒƒƒƒƒƒƒˆƒƒƒƒƒƒƒƒˆƒƒƒƒƒƒƒƒˆƒƒƒƒƒƒƒƒˆ ƒƒƒƒƒƒƒƒƒˆƒƒƒƒƒƒƒƒˆƒƒƒƒƒƒƒƒˆƒƒƒƒƒƒƒƒˆƒƒƒƒƒƒƒƒˆƒƒƒƒƒƒƒƒˆ ƒƒƒƒƒƒƒƒƒˆƒƒƒƒƒƒƒƒˆƒƒƒƒƒƒƒƒˆƒƒƒƒƒƒƒƒˆƒƒƒƒƒƒƒƒˆƒƒƒƒƒƒƒƒˆ ƒƒƒƒƒƒƒƒƒˆƒƒƒƒƒƒƒƒˆƒƒƒƒƒƒƒƒˆƒƒƒƒƒƒƒƒˆƒƒƒƒƒƒƒƒˆƒƒƒƒƒƒƒƒˆ ƒƒƒƒƒƒƒƒƒˆƒƒƒƒƒƒƒƒˆƒƒƒƒƒƒƒƒˆƒƒƒƒƒƒƒƒˆƒƒƒƒƒƒƒƒˆƒƒƒƒƒƒƒƒˆ ƒƒƒƒƒƒƒƒƒˆƒƒƒƒƒƒƒƒˆƒƒƒƒƒƒƒƒˆƒƒƒƒƒƒƒƒˆƒƒƒƒƒƒƒƒˆƒƒƒƒƒƒƒƒˆ ƒƒƒƒƒƒƒƒƒˆƒƒƒƒƒƒƒƒˆƒƒƒƒƒƒƒƒˆƒƒƒƒƒƒƒƒˆƒƒƒƒƒƒƒƒˆƒƒƒƒƒƒƒƒˆ ƒƒƒƒƒƒƒƒƒˆƒƒƒƒƒƒƒƒˆƒƒƒƒƒƒƒƒˆƒƒƒƒƒƒƒƒˆƒƒƒƒƒƒƒƒˆƒƒƒƒƒƒƒƒˆ ƒƒƒƒƒƒƒƒƒˆƒƒƒƒƒƒƒƒˆƒƒƒƒƒƒƒƒˆƒƒƒƒƒƒƒƒˆƒƒƒƒƒƒƒƒˆƒƒƒƒƒƒƒƒˆ Total
23 Table 4. Proportion of trips with greater amberjack by gear and fishing year. H = handline, L=longline, P=powerhead, S=spear, and TR=troll FISHYEAR GEAR H L P S TR ƒƒƒƒƒƒƒƒƒˆƒƒƒƒƒƒƒƒˆƒƒƒƒƒƒƒƒˆƒƒƒƒƒƒƒƒˆƒƒƒƒƒƒƒƒˆƒƒƒƒƒƒƒƒˆ ƒƒƒƒƒƒƒƒƒˆƒƒƒƒƒƒƒƒˆƒƒƒƒƒƒƒƒˆƒƒƒƒƒƒƒƒˆƒƒƒƒƒƒƒƒˆƒƒƒƒƒƒƒƒˆ ƒƒƒƒƒƒƒƒƒˆƒƒƒƒƒƒƒƒˆƒƒƒƒƒƒƒƒˆƒƒƒƒƒƒƒƒˆƒƒƒƒƒƒƒƒˆƒƒƒƒƒƒƒƒˆ ƒƒƒƒƒƒƒƒƒˆƒƒƒƒƒƒƒƒˆƒƒƒƒƒƒƒƒˆƒƒƒƒƒƒƒƒˆƒƒƒƒƒƒƒƒˆƒƒƒƒƒƒƒƒˆ ƒƒƒƒƒƒƒƒƒˆƒƒƒƒƒƒƒƒˆƒƒƒƒƒƒƒƒˆƒƒƒƒƒƒƒƒˆƒƒƒƒƒƒƒƒˆƒƒƒƒƒƒƒƒˆ ƒƒƒƒƒƒƒƒƒˆƒƒƒƒƒƒƒƒˆƒƒƒƒƒƒƒƒˆƒƒƒƒƒƒƒƒˆƒƒƒƒƒƒƒƒˆƒƒƒƒƒƒƒƒˆ ƒƒƒƒƒƒƒƒƒˆƒƒƒƒƒƒƒƒˆƒƒƒƒƒƒƒƒˆƒƒƒƒƒƒƒƒˆƒƒƒƒƒƒƒƒˆƒƒƒƒƒƒƒƒˆ ƒƒƒƒƒƒƒƒƒˆƒƒƒƒƒƒƒƒˆƒƒƒƒƒƒƒƒˆƒƒƒƒƒƒƒƒˆƒƒƒƒƒƒƒƒˆƒƒƒƒƒƒƒƒˆ ƒƒƒƒƒƒƒƒƒˆƒƒƒƒƒƒƒƒˆƒƒƒƒƒƒƒƒˆƒƒƒƒƒƒƒƒˆƒƒƒƒƒƒƒƒˆƒƒƒƒƒƒƒƒˆ ƒƒƒƒƒƒƒƒƒˆƒƒƒƒƒƒƒƒˆƒƒƒƒƒƒƒƒˆƒƒƒƒƒƒƒƒˆƒƒƒƒƒƒƒƒˆƒƒƒƒƒƒƒƒˆ 23
Craig A. Brown. NOAA Fisheries, Southeast Fisheries Center, Sustainable Fisheries Division 75 Virginia Beach Drive, Miami, FL, , USA
 STANDARDIZED CATCH RATES OF VERMILION SNAPPER, RHOMBOPLITES AURORUBENS, FROM THE UNITED STATES HEADBOAT FISHERY IN THE GULF OF MEXICO DURING 1986-2004 Craig A. Brown NOAA Fisheries, Southeast Fisheries
United States Commercial Vertical Line Vessel Standardized Catch Rates of Red Grouper in the US South Atlantic,
 SEDAR19-DW-14 United States Commercial Vertical Line Vessel Standardized Catch Rates of Red Grouper in the US South Atlantic, 1993-2008 Kevin McCarthy and Neil Baertlein National Marine Fisheries Service,
Addendum to SEDAR16-DW-22
 Addendum to SEDAR16-DW-22 Introduction Six king mackerel indices of abundance, two for each region Gulf of Mexico, South Atlantic, and Mixing Zone, were constructed for the SEDAR16 data workshop using
STANDARDIZED CATCH RATES OF BLUEFIN TUNA, THUNNUS THYNNUS, FROM THE ROD AND REEL/HANDLINE FISHERY OFF THE NORTHEAST UNITED STATES DURING
 SCRS/2008/088 STANDARDIZED CATCH RATES OF BLUEFIN TUNA, THUNNUS THYNNUS, FROM THE ROD AND REEL/HANDLINE FISHERY OFF THE NORTHEAST UNITED STATES DURING 1980-2007 by Craig A. Brown 1 Sustainable Fisheries
Standardized catch rates of U.S. blueline tilefish (Caulolatilus microps) from commercial logbook longline data
 from commercial logbook longline data") Standardized catch rates of U.S. blueline tilefish (Caulolatilus microps) from commercial logbook longline data Sustainable Fisheries Branch, National Marine Fisheries Service, Southeast Fisheries Science
Standardized catch rates of U.S. blueline tilefish (Caulolatilus microps) from commercial logbook longline data Sustainable Fisheries Branch, National Marine Fisheries Service, Southeast Fisheries Science
Standardized catch rates of yellowtail snapper ( Ocyurus chrysurus
 Standardized catch rates of yellowtail snapper (Ocyurus chrysurus) from the Marine Recreational Fisheries Statistics Survey in south Florida, 1981-2010 Introduction Yellowtail snapper are caught by recreational
Updated landings information for the commercial fisheries in Puerto Rico with emphasis on silk and queen snapper and parrotfish fisheries
 Updated landings information for the commercial fisheries in Puerto Rico with emphasis on silk and queen snapper and parrotfish fisheries Nancie J. Cummings and Daniel Matos-Caraballo SEDAR 26-DW-03 Date
STANDARDIZED CATCH RATES OF KING MACKEREL (Scomberomorus cavalla) FROM U.S. GULF OF MEXICO AND SOUTH ATLANTIC RECREATIONAL FISHERIES
 FROM U.S. GULF OF MEXICO AND SOUTH ATLANTIC RECREATIONAL FISHERIES") MSAP/02/03 STANDARDIZED CATCH RATES OF KING MACKEREL (Scomberomorus cavalla) FROM U.S. GULF OF MEXICO AND SOUTH ATLANTIC RECREATIONAL FISHERIES Mauricio Ortiz and Patty Phares. U.S. Department of Commerce
MSAP/02/03 STANDARDIZED CATCH RATES OF KING MACKEREL (Scomberomorus cavalla) FROM U.S. GULF OF MEXICO AND SOUTH ATLANTIC RECREATIONAL FISHERIES Mauricio Ortiz and Patty Phares. U.S. Department of Commerce
SEDAR52-WP November 2017
 Using a Censored Regression Modeling Approach to Standardize Red Snapper Catch per Unit Effort Using Recreational Fishery Data Affected by a Bag Limit Skyler Sagarese and Adyan Rios SEDAR52-WP-13 15 November
STANDARDIZED CATCH RATES OF QUEEN SNAPPER, ETELIS OCULATUS, FROM THE ST. CROIX U.S. VIRGIN ISLANDS HANDLINE FISHERY DURING
 STANDARDIZED CATCH RATES OF QUEEN SNAPPER, ETELIS OCULATUS, FROM THE ST. CROIX U.S. VIRGIN ISLANDS HANDLINE FISHERY DURING 1984-1997 by Shannon L. Cass-Calay and Monica Valle-Esquivel National Marine Fisheries
ASMFC Stock Assessment Overview: Red Drum
 Purpose The purpose of this document is to improve the understanding and transparency of the Commission s stock assessment process and results. It is the first of several that will be developed throughout
SCDNR Charterboat Logbook Program Data,
 SCDNR Charterboat Logbook Program Data, 1993 2010 Mike Errigo, South Atlantic Fishery Management Council Eric Hiltz and Julia Byrd, South Carolina Department of Natural Resources SEDAR25-DW23 (replaces
SCDNR Charterboat Logbook Program Data, Mike Errigo, Eric Hiltz, and Amy Dukes SEDAR32-DW-08
 SCDNR Charterboat Logbook Program Data, 1993-2011 Mike Errigo, Eric Hiltz, and Amy Dukes SEDAR32-DW-08 Submitted: 5 February 2013 Addendum: 5 March 2013* *Addendum added to reflect changes made during
August 3, Prepared by Rob Cheshire 1 & Joe O Hop 2. Center for Coastal Fisheries and Habitat Research Beaufort, NC
 SEDAR 19-DW05 Evaluation of the 1960, 1965, and 1970 U.S. Fish and Wildlife Service salt-water angling survey data for use in the stock assessment of red grouper (Southeast US Atlantic) and black grouper
Estimated sailfish catch-per-unit-effort for the U.S. Recreational Billfish Tournaments and U.S. recreational fishery ( )
") SCRS/2008/044 Estimated sailfish catch-per-unit-effort for the U.S. Recreational Billfish Tournaments and U.S. recreational fishery (1973-2007) John P. Hoolihan, Mauricio Ortiz, Guillermo A. Diaz, and
SCRS/2008/044 Estimated sailfish catch-per-unit-effort for the U.S. Recreational Billfish Tournaments and U.S. recreational fishery (1973-2007) John P. Hoolihan, Mauricio Ortiz, Guillermo A. Diaz, and
CPUE standardization of black marlin (Makaira indica) caught by Taiwanese large scale longline fishery in the Indian Ocean
 caught by Taiwanese large scale longline fishery in the Indian Ocean") CPUE standardization of black marlin (Makaira indica) caught by Taiwanese large scale longline fishery in the Indian Ocean Sheng-Ping Wang Department of Environmental Biology and Fisheries Science, National
CPUE standardization of black marlin (Makaira indica) caught by Taiwanese large scale longline fishery in the Indian Ocean Sheng-Ping Wang Department of Environmental Biology and Fisheries Science, National
STANDARDIZED CATCH RATE OF SAILFISH (Istiophorus platypterus) CAUGHT BY BRAZILIAN LONGLINERS IN THE ATLANTIC OCEAN ( )
 CAUGHT BY BRAZILIAN LONGLINERS IN THE ATLANTIC OCEAN ( )") SCRS/2008/079 STANDARDIZED CATCH RATE OF SAILFISH (Istiophorus platypterus) CAUGHT BY BRAZILIAN LONGLINERS IN THE ATLANTIC OCEAN (1986-2006) Catarina Wor 12 ; Bruno L. Mourato 1,3 ; Humberto G. Hazin 1
SCRS/2008/079 STANDARDIZED CATCH RATE OF SAILFISH (Istiophorus platypterus) CAUGHT BY BRAZILIAN LONGLINERS IN THE ATLANTIC OCEAN (1986-2006) Catarina Wor 12 ; Bruno L. Mourato 1,3 ; Humberto G. Hazin 1
Updated and revised standardized catch rate of blue sharks caught by the Taiwanese longline fishery in the Indian Ocean
 Updated and revised standardized catch rate of blue sharks caught by the Taiwanese longline fishery in the Indian Ocean Wen-Pei Tsai 1,3 and Kwang-Ming Liu 2 1 Department of Fisheries Production and Management,
John Carlson and Jason Osborne SEDAR34-WP-02. Submitted: 6 May 2013 Updated: 8 July 2013
 1 Standardized catch rates of bonnetheads from the Everglades National Park Creel Survey John Carlson and Jason Osborne SEDAR34-WP-02 Submitted: 6 May 2013 Updated: 8 July 2013 This information is distributed
Standardized catch rates of Atlantic king mackerel (Scomberomorus cavalla) from the North Carolina Commercial fisheries trip ticket.
 from the North Carolina Commercial fisheries trip ticket.") SEDAR16 DW 11 Standardized catch rates of Atlantic king mackerel (Scomberomorus cavalla) from the North Carolina Commercial fisheries trip ticket. Alan Bianchi 1 and Mauricio Ortiz 2 SUMMARY Standardized
SEDAR16 DW 11 Standardized catch rates of Atlantic king mackerel (Scomberomorus cavalla) from the North Carolina Commercial fisheries trip ticket. Alan Bianchi 1 and Mauricio Ortiz 2 SUMMARY Standardized
Southeast Regional Office:
 Southeast Regional Office: The Bridge from Science to Management Southeast Region Marine Resource Education Program Tampa, Florida Sept 30-Oct 2, 2014 Southeast Region Roles and Responsibilities Forecasting
Estimates of Historic Recreational Landings of Vermilion Snapper in the South Atlantic Using the FHWAR Census Method. Ken Brennan SEDAR 55-WP04
 Estimates of Historic Recreational Landings of Vermilion Snapper in the South Atlantic Using the FHWAR Census Method Ken Brennan SEDAR 55-WP04 Submitted: 7 November 2017 This information is distributed
INTER-AMERICAN TROPICAL TUNA COMMISSION SCIENTIFIC ADVISORY COMMITTEE FOURTH MEETING. La Jolla, California (USA) 29 April - 3 May 2013
 29 April - 3 May 2013") INTER-AMERICAN TROPICAL TUNA COMMISSION SCIENTIFIC ADVISORY COMMITTEE FOURTH MEETING La Jolla, California (USA) 29 April - 3 May 2013 DOCUMENT SAC-04-04c INDICES OF RELATIVE ABUNDANCE OF YELLOWFIN TUNA
INTER-AMERICAN TROPICAL TUNA COMMISSION SCIENTIFIC ADVISORY COMMITTEE FOURTH MEETING La Jolla, California (USA) 29 April - 3 May 2013 DOCUMENT SAC-04-04c INDICES OF RELATIVE ABUNDANCE OF YELLOWFIN TUNA
A non-equilibrium surplus production model of black grouper (Mycteroperca bonaci) in southeast United States waters
 in southeast United States waters") SEDAR19-AW-05 A non-equilibrium surplus production model of black grouper (Mycteroperca bonaci) in southeast United States waters Introduction Robert G. Muller Florida Fish and Wildlife Conservation Commission
SEDAR19-AW-05 A non-equilibrium surplus production model of black grouper (Mycteroperca bonaci) in southeast United States waters Introduction Robert G. Muller Florida Fish and Wildlife Conservation Commission
SCIENTIFIC COMMITTEE SECOND REGULAR SESSION August 2006 Manila, Philippines
 SCIENTIFIC COMMITTEE SECOND REGULAR SESSION 7-18 August 2006 Manila, Philippines MEASUREMENT-POINTS EXAMINATION OF CIRCLE HOOKS FOR PELAGIC LONGLINE FISHERY TO EVALUATE EFFECTS OF HOOK DESIGN WCPFC-SC2-2006/EB
Assessment Summary Report Gulf of Mexico Red Snapper SEDAR 7
 Assessment Summary Report Gulf of Mexico Red Snapper SEDAR 7 Stock Distribution: Red snapper are found throughout the Gulf of Mexico, the Caribbean Sea, and from the U.S. Atlantic Coast to northern South
Discards of red grouper (Epinephelus morio) for the headboat fishery in the US Gulf of Mexico SEDAR 42- DW- 17
 for the headboat fishery in the US Gulf of Mexico SEDAR 42- DW- 17") Discards of red grouper (Epinephelus morio) for the headboat fishery in the US Gulf of Mexico Fisheries Ecosystems Branch, National Marine Fisheries Service, Southeast Fisheries Science Center, Beaufort,
Discards of red grouper (Epinephelus morio) for the headboat fishery in the US Gulf of Mexico Fisheries Ecosystems Branch, National Marine Fisheries Service, Southeast Fisheries Science Center, Beaufort,
Marine Recreational Information Program Transition to Improved Survey Designs
 Marine Recreational Information Program Transition to Improved Survey Designs David Gloeckner Southeast Fisheries Science Center Richard Cody Office of Science & Technology Improved Survey Designs Fishing
MSAP/03/# Stock Assessment Analyses on Spanish and King Mackerel Stocks. Prepared for the 2003 Mackerel Stock Assessment Panel Meeting
 MSAP/3/# Stock Assessment Analyses on Spanish and King Mackerel Stocks Prepared for the 3 Mackerel Stock Assessment Panel Meeting Not to be distributed without accompanying Panel Report by Sustainable
Preliminary catches of smoothhound sharks SEDAR39-DW-03
 Preliminary catches of smoothhound sharks E. Cortés and H. Balchowsky SEDAR39-DW-3 9 May 214 This information is distributed solely for the purpose of pre-dissemination peer review. It does not represent
Estimates of Historic Recreational Landings of Red Snapper in the South Atlantic Using the FHWAR Census Method SEDAR 41-DW17
 Estimates of Historic Recreational Landings of Red Snapper in the South Atlantic Using the FHWAR Census Method SEDAR 41-DW17 Submitted: 23 July 2014 Addendum: 29 August 2014 Updated: 19 July 2015** **Addendum
Estimates of Historic Recreational Landings of Red Snapper in the South Atlantic Using the FHWAR Census Method SEDAR41-DW17 DRAFT
 Estimates of Historic Recreational Landings of Red Snapper in the South Atlantic Using the FHWAR Census Method SEDAR41-DW17 Submitted: 23 July 2014 Addendum: 29 August 2014 *Addendum added to reflect changes
ASMFC Stock Assessment Overview: Red Drum
 Introduction This document presents a summary of the 217 stock assessments for red drum. These assessments were initially conducted through the Southeast Data, Assessment and Review (SEDAR) process using
National Oceanic and Atmospheric Administration. Fisheries of the Caribbean, Gulf of Mexico, and South
 This document is scheduled to be published in the Federal Register on 07/13/2016 and available online at http://federalregister.gov/a/2016-16510, and on FDsys.gov Billing Code: 3510-22-P DEPARTMENT OF
The Economics of Atlantic Highly Migratory Species For-Hire Fishing Trips July - November 2013 Clifford Hutt and George Silva
 The Economics of Atlantic Highly Migratory Species For-Hire Fishing Trips July - November 2013 Clifford Hutt and George Silva U.S. Department of Commerce National Oceanic and Atmospheric Administration
AN INDEX OF ABUNDANCE OF BLUEFIN TUNA IN THE NORTHWEST ATLANTIC OCEAN FROM COMBINED CANADA-U.S. PELAGIC LONGLINE DATA
 SCRS/2015/171 AN INDEX OF ABUNDANCE OF BLUEFIN TUNA IN THE NORTHWEST ATLANTIC OCEAN FROM COMBINED CANADA-U.S. PELAGIC LONGLINE DATA Matthew Lauretta 1, Alex Hanke 2, and Irene Andrushchenko 2 SUMMARY During
SEDAR 28 Gulf and South Atlantic -- Spanish Mackerel and Cobia Workshop Document List Document # Title Authors
 Gulf and South Atlantic -- Spanish Mackerel and Cobia Workshop Document List Document # Title Authors SEDAR28-DW01 SEDAR28-DW02 SEDAR28-DW03 SEDAR28-DW04 SEDAR28-DW05 SEDAR28-DW06 SEDAR28-DW07 SEDAR28-DW08
PACIFIC BLUEFIN TUNA STOCK ASSESSMENT
 PACIFIC BLUEFIN TUNA STOCK ASSESSMENT SUMMARY 19-21 December 2012 Webinar PACIFIC BLUEFIN TUNA STOCK ASSESSMENT SUMMARY 1. Stock Identification and Distribution Pacific bluefin tuna (Thunnus orientalis)
Overview of Florida s Cooperative East Coast Red Snapper Tagging Program, SEDAR41-DW10. Submitted: 1 August 2014
 Overview of Florida s Cooperative East Coast Red Snapper Tagging Program, 2011-2013 Russell B. Brodie, Justin J. Solomon, Richard Paperno, Theodore S. Switzer, Cameron B. Guenther, and Beverly Sauls SEDAR41-DW10
ICCAT Secretariat. (10 October 2017)
") ICCAT Secretariat (10 October 2017) Bluefin tuna: Background information Managed by International Commission for the Conservation of Atlantic Tunas (ICCAT): Two stocks (mixing occurring, but extent not
ICCAT Secretariat (10 October 2017) Bluefin tuna: Background information Managed by International Commission for the Conservation of Atlantic Tunas (ICCAT): Two stocks (mixing occurring, but extent not
Delta-lognormal and multinomial approaches to index development for parrotfish, silk snapper, and queen snapper from Puerto Rican Trip Tickets
 Delta-lognormal and multinomial approaches to index development for parrotfish, silk snapper, and queen snapper from Puerto Rican Trip Tickets G. Walter Ingram SEDAR26-DW-07 Date Submitted: 22 July 2011
Preliminary analysis of yellowfin tuna catch, effort, size and tagging data using an integrated age-structured model
 Preliminary analysis of yellowfin tuna catch, effort, size and tagging data using an integrated age-structured model Introduction John Hampton Secretariat of the Pacific Community Noumea, New Caledonia
DEPARTMENT OF FISH AND GAME
 Sean Parnell, GOVERNOR DEPARTMENT OF FISH AND GAME November 4, 2011 DIVISION OF SPORT FISH 3298 Douglas Place Homer, AA 99603-8027 PHONE: (907) 235-8191 FAX: (907) 235-2448 and Douglas Island Center Bldg
South Atlantic Council Issues
 South Atlantic Council Issues Review and Discussion February 8, 2018 Florida Fish and Wildlife Conservation Commission Version 2 This is a review and discussion of actions from the South Atlantic Fishery
Yellowfin tuna catch opportunities in Cape Verde coping with uncertainties of local CPUEs
 Yellowfin tuna catch opportunities in Cape Verde coping with uncertainties of local CPUEs Foto Péricles Silva Ivanice Monteiro, Heino Fock and Péricles silva Lanzarote, April,19th 2018 Introdution Yellowfin
REVIEW OF BIGEYE TUNA CATCH INCLUDING FISH SIZE BY JAPANESE LONGLINE FISHERY IN THE ATLANTIC OCEAN
 1. Introduction Longline is the only tuna-fishing gear deployed by Japan at present in the Atlantic Ocean. Other two types of fishery, baitboat and purse seine fisheries, stopped fishing in the Atlantic
For-hire Data Collection. Gulf of Mexico Fishery Management Council Red Snapper For-hire Advisory Panel December 2-3, 2014 Tampa, FL
 For-hire Data Collection Gulf of Mexico Fishery Management Council Red Snapper For-hire Advisory Panel December 2-3, 2014 Tampa, FL Southeast Region Recreational Surveys MRIP For-hire Survey APAIS/CHTS
Preliminary Draft of. SEDAR 17 Data Workshop Vermilion Snapper Report. Commercial Fishery (Section 3)
") SEDAR 17-DW-05 Preliminary Draft of SEDAR 17 Data Workshop Vermilion Snapper Report Commercial Fishery (Section 3) Prepared by: Douglas Vaughan Sustainable Fisheries Branch Southeast Fisheries Science
SEDAR 17-DW-05 Preliminary Draft of SEDAR 17 Data Workshop Vermilion Snapper Report Commercial Fishery (Section 3) Prepared by: Douglas Vaughan Sustainable Fisheries Branch Southeast Fisheries Science
SCIENTIFIC COMMITTEE SEVENTH REGULAR SESSION August 2011 Pohnpei, Federated States of Micronesia
 SCIENTIFIC COMMITTEE SEVENTH REGULAR SESSION 9-17 August 2011 Pohnpei, Federated States of Micronesia CPUE of skipjack for the Japanese offshore pole and line using GPS and catch data WCPFC-SC7-2011/SA-WP-09
Amendment 43 to the Fishery Management Plan for the Snapper Grouper Fishery of the South Atlantic Region. Options Paper
 Amendment 43 to the Fishery Management Plan for the Snapper Grouper Fishery of the South Atlantic Region Amendment 43 to the Fishery Management Plan for the Snapper Grouper Fishery of the South Atlantic
An update of longline Catch Per-Unit-Effort indices for snapper in SNA 1 New Zealand Fisheries Assessment Report 2016/59
 An update of longline Catch Per-Unit-Effort indices for snapper in SNA 1 New Zealand Fisheries Assessment Report 2016/59 A.D. Langley ISSN 1179-5352 (online) ISBN 978-1-77665-412-3 (online) October 2016
Atlantic States Marine Fisheries Commission
 Atlantic States Marine Fisheries Commission DRAFT ADDENDUM I TO THE OMNIBUS AMENDMENT TO THE INTERSTATE FISHERY MANAGEMENT PLANS FOR SPANISH MACKEREL, SPOT, AND SPOTTED SEATROUT FOR PUBLIC COMMENT Spanish
Modifications to Gulf Reef Fish and South Atlantic Snapper Grouper Fishery Management Plans
 Tab B, No. 11b 3/19/15 Modifications to Gulf Reef Fish and South Atlantic Snapper Grouper Fishery Management Plans Draft Joint Generic Amendment DECISION DOCUMENT For the Joint Council Committee on South
Atlantic Highly Migratory Species
 Atlantic Highly Migratory Species Amendment 5b - Dusky Sharks: Summary of Final Measures & Implementation Presented to: Atlantic States Marine Fisheries Commission October 2017 Outline Brief Background
Species Profile: Red Drum Benchmark Assessment Finds Resource Relatively Stable with Overfishing Not Occurring
 Red Drum Sciaenops ocellatus Management Unit: New Jersey - Florida Interesting Facts: * The name is derived from their color and the fact that during spawning time males produce a drum-like noise by vibrating
Preliminary Report. Note: calculations reported are preliminary and should not be cited without the author s permission. December 21, 2003.
 Preliminary Report Analysis of Total Fishing Mortality for Gulf of Mexico Red Snapper Contributed by Shrimp Trawl Bycatch and Commercial and Recreational Fisheries (Including Discards) Note: calculations
Standardized CPUE of Indian Albacore caught by Taiwanese longliners from 1980 to 2014 with simultaneous nominal CPUE portion from observer data
 Received: 4 July 2016 Standardized CPUE of Indian Albacore caught by Taiwanese longliners from 1980 to 2014 with simultaneous nominal CPUE portion from observer data Yin Chang1, Liang-Kang Lee2 and Shean-Ya
Public Hearing Document
 Regulatory Amendment 1 to the Fishery Management Plan for the Dolphin and Wahoo Fishery of the Atlantic Modify commercial trip limits for dolphin Environmental Assessment Regulatory Impact Review Regulatory
USING DELTA-GAMMA GENERALIZED LINEAR MODELS TO STANDARDIZE CATCH RATES OF YELLOWFIN TUNA CAUGHT BY BRAZILIAN BAIT-BOATS
 SCRS/2008/166 USING DELTA-GAMMA GENERALIZED LINEAR MODELS TO STANDARDIZE CATCH RATES OF YELLOWFIN TUNA CAUGHT BY BRAZILIAN BAIT-BOATS Humber A. Andrade 1 SUMMARY In order to standardize catch per unit
Draft. Hiroki Yokoi, Yasuko Semba, Keisuke Satoh, Tom Nishida
 Draft Standardization of catch rate for blue marlin (Makaira mazara) exploited by the Japanese tuna longline fisheries in the Indian Ocean from 1971 to 2015 Hiroki Yokoi, Yasuko Semba, Keisuke Satoh, Tom
Stock Assessment of Red Porgy off the Southeastern United States. SEDAR Update Assessment
 Stock Assessment of Red Porgy off the Southeastern United States SEDAR Update Assessment Southeast Fisheries Science Center National Marine Fisheries Service Report issued: October 2012 Contents 1 Executive
AGENCY: National Marine Fisheries Service (NMFS), National Oceanic and Atmospheric
, National Oceanic and Atmospheric") This document is scheduled to be published in the Federal Register on 05/06/2014 and available online at http://federalregister.gov/a/2014-10222, and on FDsys.gov Billing Code: 3510-22-P DEPARTMENT OF
This document is scheduled to be published in the Federal Register on 05/06/2014 and available online at http://federalregister.gov/a/2014-10222, and on FDsys.gov Billing Code: 3510-22-P DEPARTMENT OF
An update of the 2015 Indian Ocean Yellowfin Tuna stock assessment for 2016
 IOTC-2016-WPTT18-27 Received: 14 October 2016 An update of the 2015 Indian Ocean Yellowfin Tuna stock assessment for 2016 Adam Langley, IOTC Consultant 1. Introduction A stock assessment of the Indian
Reef Fish Amendment 32 Gag and Red Grouper
 AMENDMENT GUIDE 11/2/11 Reef Fish Amendment 32 Gag and Red Grouper Provisions in the Magnuson-Stevens Fishery Conservation and Management Act require regional fishery management councils to develop annual
Cami T. McCandless and Joesph J. Mello SEDAR39- DW June 2014
 Standardized indices of abundance for Smooth Dogfish, Mustelus canis, from the Northeast Fisheries Observer Program Cami T. McCandless and Joesph J. Mello SEDAR39- DW- 09 30 June 2014 This information
Red Snapper distribution on natural habitats and artificial structures in the northern Gulf of Mexico
 Red Snapper distribution on natural habitats and artificial structures in the northern Gulf of Mexico SEFSC Mandy Karnauskas and John Walter, NMFS SEFSC Miami Matthew Campbell and Adam Pollack, NMFS SEFSC
Standardized catch rates of black grouper. Mycteroperca bonaci, and red grouper, Epinephelus morio, from Florida s commercial trip tickets,
 SEDAR19-DW-20 Standardized catch rates of black grouper. Mycteroperca bonaci, and red grouper, Epinephelus morio, from Florida s commercial trip tickets, 1991-2008 Introduction Robert G. Muller Florida
Scoping Document July 2016
 Amendment 10 to the Fishery Management Plan for the Dolphin Wahoo Fishery of the Atlantic and Amendment 44 to the Fishery Management Plan for the Snapper Grouper Fishery of the South Atlantic Region July
Beverly Sauls SEDAR31-DW11. 5 August 2012
 A Summary of Data on the Size Distribution and Release Condition of Red Snapper Discards from Recreational Fishery Surveys in the Gulf of Mexico Beverly Sauls SEDAR31-DW11 5 August 2012 This information
Anabela Brandão and Doug S. Butterworth
 Obtaining a standardised CPUE series for toothfish (Dissostichus eleginoides) in the Prince Edward Islands EEZ calibrated to incorporate both longline and trotline data over the period 1997-2013 Anabela
ICES Advice on fishing opportunities, catch, and effort Celtic Seas and Greater North Sea Ecoregions Published 24 October 2017
 ICES Advice on fishing opportunities, catch, and effort Celtic Seas and Greater North Sea Ecoregions Published 24 October 2017 DOI: 10.17895/ices.pub.3334 Seabass (Dicentrarchus labrax) in divisions 4.b
Atlantic States Marine Fisheries Commission ADDENDUM XXI TO THE SUMMER FLOUNDER, SCUP AND BLACK SEA BASS FISHERY MANAGEMENT PLAN FOR PUBLIC COMMENT
 Atlantic States Marine Fisheries Commission ADDENDUM XXI TO THE SUMMER FLOUNDER, SCUP AND BLACK SEA BASS FISHERY MANAGEMENT PLAN FOR PUBLIC COMMENT Black Sea Bass Recreational Management in 211 ASMFC Vision
Tab B, No /10/16. Red Snapper Management for Federally Permitted Charter Vessels. White Paper
 Tab B, No. 10 06/10/16 Red Snapper Management for White Paper June 2016 Table of Contents List of Tables... iii List of Figures... iii Chapter 1. Introduction... 4 1.1 Background... 4 1.2 Bag Limits...
ATLANTIC STATES MARINE FISHERIES COMMISSION. Winter Flounder Abundance and Biomass Indices from State Fishery-Independent Surveys
 ATLANTIC STATES MARINE FISHERIES COMMISSION Winter Flounder Abundance and Biomass Indices from State Fishery-Independent Surveys Technical Committee Report to the Winter Flounder Management Board February
Regulatory Amendment 25 to the Fishery Management Plan for the Snapper Grouper Fishery of the South Atlantic Region
 SOUTH ATLANTIC FISHERY MANAGEMENT COUNCIL Regulatory Amendment 25 to the Fishery Management Plan for the Snapper Grouper Fishery of the South Atlantic Region Acceptable Biological Catch & Annual Catch
Management under the Highly Migratory Species Fishery Management Plan
 Agenda Item G.4.b CDFW Report 1 September 2014 CALIFORNIA DEPARTMENT OF FISH AND WILDLIFE REPORT ON BAG REDUCTION OPTIONS FOR THE RECREATIONAL TAKE OF PACIFIC BLUEFIN TUNA Introduction At the June 2014
SEDAR 33 UPDATE REPORT Gulf of Mexico Gag Grouper. SEFSC Staff
 SEDAR 33 UPDATE REPORT Gulf of Mexico Gag Grouper SEFSC Staff December 28, 2016 Table of Contents 1. Introduction... 4 2. Data review and update... 4 2.1 Commercial... 4 2.1.1 Landings... 4 2.1.2 Discards...
Spatial/Seasonal overlap between the midwater trawl herring fishery and predator focused user groups
 Spatial/Seasonal overlap between the midwater trawl herring fishery and predator focused user groups A working paper submitted to the Herring PDT Micah Dean July 26, 2017 Introduction A goal of Amendment
Stock Assessment Update for Pink Shrimp (Farfantepenaeus duorarum) in the U.S. Gulf of Mexico for 2015
 in the U.S. Gulf of Mexico for 2015") Stock Assessment Update for Pink Shrimp (Farfantepenaeus duorarum) in the U.S. Gulf of Mexico for 2015 Rick A. Hart December 2016 NOAA Fisheries Southeast Fisheries Science Center Galveston Laboratory
Stock Assessment Update for Pink Shrimp (Farfantepenaeus duorarum) in the U.S. Gulf of Mexico for 2015 Rick A. Hart December 2016 NOAA Fisheries Southeast Fisheries Science Center Galveston Laboratory
SCTB16 Working Paper FTWG 5
 0 SCTB16 Working Paper FTWG 5 Fishery-related attributes associated with FAD and log fishing practices conducted by the U.S. purse seine fleet in the central-western Pacific Ocean, 1997 2002. Al Coan Jr.
Hook Selectivity in Gulf of Mexico Gray Triggerfish when using circle or J Hooks
 Hook Selectivity in Gulf of Mexico Gray Triggerfish when using circle or J Hooks Alisha M. Gray and Beverly Sauls SEDAR43- WP- 09 25 March 2015 This information is distributed solely for the purpose of
Monitoring the length structure of commercial landings of albacore tuna during the fishing year
 SCTB15 Working Paper ALB-5 Monitoring the length structure of commercial landings of albacore tuna during the 2001 2002 fishing year Linda Griggs National Institute of Water and Atmospheric Research Ltd.
Abalone spatial- and age-structured assessment model and projections for Zones A, B, C and D
 FISHERIES/215/AUG/SWG-AB/15 Abalone spatial- and age-structured assessment model and projections for Zones A, B, C and D A. Brandão and D.S. Butterworth Marine Resource Assessment & Management Group (MARAM)
Commercial Bycatch Rates of Shortfin Mako (Isurus oxyrinchus) from Longline Fisheries in the Canadian Atlantic
 from Longline Fisheries in the Canadian Atlantic") ICCAT Working Paper for Shark Stock Assessment Meeting 2008 Commercial Bycatch Rates of Shortfin Mako (Isurus oxyrinchus) from Longline Fisheries in the Canadian Atlantic G.M. Fowler and S.E. Campana Population
ICCAT Working Paper for Shark Stock Assessment Meeting 2008 Commercial Bycatch Rates of Shortfin Mako (Isurus oxyrinchus) from Longline Fisheries in the Canadian Atlantic G.M. Fowler and S.E. Campana Population
Barotrauma in Atlantic Coast Fisheries. Chip Collier March 2011
 Barotrauma in Atlantic Coast Fisheries Chip Collier March 2011 Atlantic Ecosystems Coastline 2,100 miles Two Large Marine Ecosystems Northern Southern Three Councils New England Mid Atlantic South Atlantic
ATLANTIC SALMON NEWFOUNDLAND AND LABRADOR, SALMON FISHING AREAS 1-14B. The Fisheries. Newfoundland Region Stock Status Report D2-01
 Fisheries Pêches and Oceans et Océans DFO Science Newfoundland Region Stock Status Report D2-01 ATLANTIC SALMON NEWFOUNDLAND AND LABRADOR, SALMON FISHING AREAS 1-14B Background There are 15 Atlantic salmon
Depletion-Based Stock Reduction Analysis (DB-SRA) for Starry Flounder (Platichthys stellatus) in U.S. Waters off California, Oregon and Washington
 for Starry Flounder (Platichthys stellatus) in U.S. Waters off California, Oregon and Washington") Agenda Item F.6 Attachment 3 November 2017 Depletion-Based Stock Reduction Analysis (DB-SRA) for Starry Flounder (Platichthys stellatus) in U.S. Waters off California, Oregon and Washington E.J. Dick 1,
Agenda Item F.6 Attachment 3 November 2017 Depletion-Based Stock Reduction Analysis (DB-SRA) for Starry Flounder (Platichthys stellatus) in U.S. Waters off California, Oregon and Washington E.J. Dick 1,
Using Population Models to Evaluate Management Alternatives for Gulf-strain Striped Bass
 Using Population Models to Evaluate Management Alternatives for Gulf-strain Striped Bass Alex Aspinwall Alabama Cooperative Fisheries and Wildlife Research Unit Elise Irwin U.S Geological Survey Introduction
A Combined Recruitment Index for Demersal Juvenile Cod in NAFO Divisions 3K and 3L
 NAFO Sci. Coun. Studies, 29: 23 29 A Combined Recruitment Index for Demersal Juvenile Cod in NAFO Divisions 3K and 3L David C. Schneider Ocean Sciences Centre, Memorial University St. John's, Newfoundland,
STOCK STATUS OF SOUTHERN BLUEFIN TUNA
 7 th Expert Consultation on Indian Ocean Tunas, Victoria, Seychelles, 9-14 November, 1998 STOCK STATUS OF SOUTHERN BLUEFIN TUNA Tsuji, S. 1 Introduction The Commission for the Conservation of Southern
2012 UPDATE OF THE CANADIAN BLUEFIN TUNA FISHERY AND CPUE SERIES
 SCRS/2013/174 Collect. Vol. Sci. Pap. ICCAT, 70(2): 543-555 (2014) 2012 UPDATE OF THE CANADIAN BLUEFIN TUNA FISHERY AND CPUE SERIES A. Hanke 1, I. Andrushchenko, G. Melvin and D. Busawon SUMMARY This document
The Economic Gains from Reallocating Specific Saltwater Fisheries
 The Economic Gains from Reallocating Specific Saltwater Fisheries Produced for the: American Sportfishing Association By: Southwick Associates May 12, 2015 Executive Summary Allocation arrangements between
Tab B, No 4(a) 1/4/07
 1/4/07") SCOPING DOCUMENT FOR REEF FISH AMENDMENT 30: Tab B, No 4(a) 1/4/07 GAG, RED GROUPER, GREATER AMBERJACK, AND GRAY TRIGGERFISH: STOP OVERFISHING AND SET SFA PARAMETERS JANUARY 2007 Gulf of Mexico Fishery
SCOPING DOCUMENT FOR REEF FISH AMENDMENT 30: Tab B, No 4(a) 1/4/07 GAG, RED GROUPER, GREATER AMBERJACK, AND GRAY TRIGGERFISH: STOP OVERFISHING AND SET SFA PARAMETERS JANUARY 2007 Gulf of Mexico Fishery
ICES Advice on fishing opportunities, catch, and effort Celtic Seas and Greater North Sea ecoregions Published 30 June 2016
 ICES Advice on fishing opportunities, catch, and effort Celtic Seas and Greater North Sea ecoregions Published 30 June 2016 5.3.57 Sea bass (Dicentrarchus labrax) in divisions 4.b c, 7.a, and 7.d h (central
2012 Maryland FMP Report (July 2013) Section 15. Red Drum (Sciaenops ocellatus)
 Section 15. Red Drum (Sciaenops ocellatus)") 1981 1983 1985 1987 1989 1991 1995 1997 1999 2001 2003 2005 2007 2009 2011 Pounds 2012 Maryland FMP Report (July 2013) Section 15. Red Drum (Sciaenops ocellatus) Chesapeake Bay FMP In 2012, red drum were
1981 1983 1985 1987 1989 1991 1995 1997 1999 2001 2003 2005 2007 2009 2011 Pounds 2012 Maryland FMP Report (July 2013) Section 15. Red Drum (Sciaenops ocellatus) Chesapeake Bay FMP In 2012, red drum were
Pacific Blue Marlin Stock Assessment Update in ISC Billfish Working Group
 Pacific Blue Marlin Stock Assessment Update in 2016 ISC Billfish Working Group Overview Overview of the 2013 Pacific Blue Marlin Stock Assessment 2016 Assessment Data and Model Blue Marlin Life History
June NMFS Address 11, 2014 (NOAA): Council Address. Dover, DE 19901
: Council Address. Dover, DE 19901") BLACK SEA BASS SEASON OPENING FRAMEWORK ADJUSTMENT Discussion Document and Background June 2014 Mid-Atlantic Fishery Management Council in cooperation with the National Marine Fisheriess Service (NMFS)
BLACK SEA BASS SEASON OPENING FRAMEWORK ADJUSTMENT Discussion Document and Background June 2014 Mid-Atlantic Fishery Management Council in cooperation with the National Marine Fisheriess Service (NMFS)
Nancy E. Kohler, Danielle Bailey, Patricia A. Turner, and Camilla McCandless SEDAR34-WP-25. Submitted: 10 June 2013
 Mark/Recapture Data for the Atlantic Sharpnose Shark (Rhizoprionodon terranovae), in the Western North Atlantic from the NEFSC Cooperative Shark Tagging Program Nancy E. Kohler, Danielle Bailey, Patricia
Habitat Omnibus Amendment DEIS draft sections relative to recreational fishery DRAFT. Omnibus Essential Fish Habitat Amendment 2
 DRAFT Omnibus Essential Fish Habitat Amendment 2 Amendment 14 to the Northeast Multispecies FMP Amendment 14 to the Atlantic Sea Scallop FMP Amendment 4 to the Monkfish FMP Amendment 3 to the Atlantic
S.S.K. Haputhantri. Abstract
 Received: 1 October 2017 IOTC-2017-WPTT19-45 Relationship between skipjack tuna (Katsuwonus pelamis) Catch Per Unit Effort (CPUE) and fishing operation related parameters: A case study in gillnet fishery