Report of the Lake Erie Forage Task Group. March 2018
|
|
|
- Timothy Jacobs
- 5 years ago
- Views:
Transcription
 {Chair} - The State University of New York, (SUNY- Buffalo State College) - Ohio Department of Natural")
 - Ontario Ministry of Natural Resources and Forestry, (OMNRF) - New York Department of Environmental Conservation, (NYSDEC) - Fisheries and Oceans Canada,")
1 Report of the Lake Erie Forage Task Group March 2018 Members: Eric Weimer Mark Clapsadl John Deller Andrew Briggs Jan-Michael Hessenauer Mike Hosack Patrick Kočovský Tom MacDougall Jim Markham David Marson Chelsea May Geoff Steinhart Zachary Slagle - Ohio Department of Natural Resources, (ODNR) {Chair} - The State University of New York, (SUNY- Buffalo State College) - Ohio Department of Natural Resources, (ODNR) - United States Fish and Wildlife Service, (USFWS) - Michigan Department of Natural Resources, (MDNR) - Pennsylvania Fish and Boat Commission, (PFBC) - United States Geological Survey - Great Lakes Science Center (USGS) - Ontario Ministry of Natural Resources and Forestry, (OMNRF) - New York Department of Environmental Conservation, (NYSDEC) - Fisheries and Oceans Canada, (DFO) - Ontario Ministry of Natural Resources and Forestry, (OMNRF) - Ohio Department of Natural Resources, (ODNR) - Ohio Department of Natural Resources, (ODNR) Presented to: Standing Technical Committee Lake Erie Committee Great Lakes Fishery Commission
2 Charges to the Forage Task Group Report on the results of the interagency lower trophic level monitoring program and status of trophic conditions as they relate to the Lake Erie Fish Community Goals and Objectives. 2. Describe the status and trends of forage fish in each basin of Lake Erie. 3. Continue hydroacoustic assessment of the pelagic forage fish community in Lake Erie, incorporating new methods in survey design and analysis while following the GLFC s Great Lakes Hydroacoustic Standard Operating Procedures where possible/feasible. 4. Report on the use of forage fish and new invasive species in the diets of selected commercially or recreationally important Lake Erie predator fish. 5. Develop and maintain a database to track new or emerging Aquatic Invasive Species in Lake Erie that exhibit the potential to directly impact economically important fisheries. 2
3 Charge 1: Report on the results of the interagency lower trophic level monitoring programand status of trophic conditions as they relate to the Lake Erie Fish Community Goals and Objectives. (J. Markham) In 1999, the Forage Task Group (FTG) initiated a Lower Trophic Level Assessment program (LTLA) within Lake Erie and Lake St. Clair (Figure 1.0.1). Nine key variables, as identified by a panel of lower trophic level experts, were measured to characterize ecosystem change. These variables included profiles of temperature, dissolved oxygen and light (Photosynthetically Active Radiation; PAR), water transparency (Secchi disc depth), nutrients (total phosphorus), chlorophyll a, phytoplankton, zooplankton, and benthos. The protocol called for each station to be visited every two weeks from May through September, totaling 12 sampling periods, with benthos collected on two dates, once in the spring and once in the fall. For this report, we will summarize the last 19 years of data for summer surface temperature, summer bottom dissolved oxygen, chlorophyll a concentrations, water transparency, total phosphorus and zooplankton. Stations were only included in the analysis if there were at least 3 years each containing 6 or more sampling dates. Stations included in this analysis are stations 3, 4, 5 and 6 from the west basin, stations 7, 8, 9, 10, 11, 12, 13 and 14 from the central basin, and stations 15, 16, 17, 18, 19, 20 and 25 from the east basin (Figure 1.0.1). Station 25 (located off Sturgeon Point in 19.5 meters of water) was added in The fish community objectives (FCO) for the lower trophic level ecosystem in Lake Erie are to maintain mesotrophic conditions that favor percids in the west, central and nearshore waters of the east basin, and oligotrophic conditions that favor salmonids in the offshore waters of the east basin (Ryan et al. 2003). Associated with these trophic classes are target ranges for total phosphorus, water transparency, and chlorophyll a (Table 1.0.1). For mesotrophic conditions, the total phosphorus range is 9-18 μg/l, summer (June-August) water transparency is 3-6 meters, and chlorophyll a concentrations between μg/l (Leach et al. 1977). For the offshore waters of the east basin, the target ranges for total phosphorus are < 9 μg/l, summer water transparency of > 6 m, and chlorophyll a concentrations of < 2.5 μg/l. A trophic state index (TSI) (Carlson 1977) was used to produce a metric which merges three independent variables to report a single broader measure of trophic conditions. This index uses algal biomass as the basis for trophic state classification, independently estimated using measures of chlorophyll a, water transparency, and total phosphorus. Each independent measure is combined and the average of the three indices reflects a trophic state value for that site and sampling event. The median value of the combined daily indices is used to determine an annual index for each basin. Because the number generated is only a relative measure of the trophic conditions and does not define trophic status, this index was calibrated to accepted Lake Erie ranges for values of total phosphorus, chlorophyll a, and transparency (from Leach et al. 1977) that have long been used to assess trophic conditions. In these terms, oligotrophic was determined to have a TSI < 36.5, mesotrophic between 36.5 and 45.5, eutrophic between 45.5 and 59.2, and hyper-eutrophic >59.2 (Table 1.0.2). Mean Summer Surface Water Temperature Summer surface water temperature represents the temperature of the water at 0-1 m depth for offshore stations only. Mean summer surface temperatures across all years are warmest in the west basin (mean=23.5 C), becoming progressively cooler in the central (mean = 22.0 C) and east basins (mean = 20.6 C) (Figure 1.0.2). A slightly increasing trend in summer surface water 3
4 temperature is evident for all basins. In 2017, the mean summer surface water temperature was at or near average in all three basins (west: 23.8 C; central: 22.0 C; east: 20.3 C). Hypolimnetic Dissolved Oxygen Dissolved oxygen (DO) levels less than 2.0 mg/l are deemed stressful to fish and other aquatic biota (Craig 2012; Eby and Crowder 2002). Low DO can occur when the water column becomes stratified, which can begin in early June and continue through September in the central and east basins. In the west basin, shallow depths allow wind mixing to penetrate to the bottom, generally preventing thermal stratification. Consequently, there are only a few summer observations that detect low bottom DO concentrations in the time series (Figure 1.0.3). In 2017, there were no observations from the west basin stations of DO below the 2.0 mg/l threshold. Low DO is more of an issue in the central basin, where it happens almost annually at the offshore stations (8, 10, 11 and 13) and occasionally at inshore stations. Dissolved oxygen of less than 2.0 mg/l has been observed as early as mid-june and can persist until late September when fall turnover remixes the water column. In 2017, bottom DO was below the 2.0 mg/l threshold in the central basin on six occasions (Station 10 on 8/8/17 (0.15 mg/l) and 8/21/17 (0.06 mg/l); Station 8 on 7/12/17 (1.58 mg/l) and 7/25/17 (0.10 mg/l); Station 11 on 8/10/17 (0.63 mg/l) and 8/24/17 (1.07 mg/l)) (Figure 1.0.3). There were also three other occasions where bottom DO was just above the 2.0 mg/l threshold. DO is rarely limiting in the east basin due to greater water depths, a large hypolimnion and cooler water temperatures. The only occasion when DO was below the 2.0 mg/l threshold was on 14 July and 13 August, 2010 at Station 25 (Figure 1.0.3). In 2017, only one measure of DO concentration of less than 6.0 mg/l was recorded in the east basin. Chlorophyll a Chlorophyll a concentrations indicate biomass of the phytoplankton resource, ultimately representing production at the lowest level. In the west basin, mean chlorophyll a concentrations have mainly been above targeted levels in the 19-year time series, fitting into eutrophic status rather than the targeted mesotrophic status (Figure 1.0.4). Annual variability is also highest in the west basin. In 2017, the mean chlorophyll a concentration was 6.8 µg/l in the west basin, which was above the targeted mesotrophic range. In the central basin, chlorophyll a concentrations have been less variable and within the targeted mesotrophic range for the entire time series, and that trend continued in 2017 (3.9 µg/l) (Figure 1.0.4). In the east basin, chlorophyll a concentrations in the nearshore waters have been below the targeted mesotrophic level for the entire time series (Figure 1.0.4). This may be due to high levels of grazing by dreissenids (Nicholls and Hopkins 1993) in the nearshore east basin waters where biomass of quagga mussels (Dreissena rostriformis bugensis) remains high (Patterson et al. 2005). Conversely, chlorophyll a levels in the offshore waters of the east basin remain in, or slightly above, the targeted oligotrophic range. In 2016, the mean chlorophyll a concentrations were 2.5 µg/l in the nearshore waters of the east basin and 2.5 µg/l in the offshore waters, both of which were borderline between mesotrophic and oligotrophic. Chlorophyll a concentrations are most stable in the east basin. Total Phosphorus Total phosphorus levels in the west basin have exceeded FCO targets since the beginning of the LTLA monitoring program, and in some years has been in the hyper-eutrophic range (Figure 4
5 1.0.5). In 2017, total phosphorus concentrations in the west basin increased slightly to 27.3 µg/l, which is the second lowest measure in the time series but still above targets. In the central basin, total phosphorus levels had exceeded FCO targets from 2006 through 2013, were borderline mesotrophic/eutrophic in 2014 and 2015, and have been increasing in recent years (Figure 1.0.5). Total phosphorus measures in the central basin in 2017 were 29.8 µg/l, which was higher than western basin measures for the second consecutive year. Similar to 2016, the value was heavily influenced by one exceptionally high value (210 µg/l) recorded on 21 September at Station 7 off the mouth of the Vermillion River. In the nearshore waters of the east basin, total phosphorus levels have remained stable and within the targeted mesotrophic range for nearly the entire time series (Figure 1.0.5). A gradual increasing trend was evident from 2006 through 2010, but a declining trend has been evident since Total phosphorus levels in the offshore waters of the east basin show a similar trend to nearshore waters, and had risen above the targeted oligotrophic range from 2008 through 2013 but have declined in more recent years. In 2017, mean total phosphorus concentrations in the east basin increased in both the nearshore (10.6 µg/l) and offshore (9.6 µg/l) waters, putting them within the targeted mesotrophic range in the nearshore waters and above the targeted oligotrophic range in the offshore waters. Water Transparency Similar to other fish community ecosystem targets (i.e. chlorophyll a, total phosphorus), water transparency has been in the eutrophic range, which is below the FCO target in the west basin, for the entire time series (Figure 1.0.6). Mean summer transparency in the west basin was 2.9 m in 2017, which was the highest measure in the time series and borderline eutrophic/mesotrophic. In contrast, water transparency in the central basin has remained within the targeted mesotrophic range for the entire series with the exception of 2015 (2.9 m), which was slightly below the mesotrophic target range (Figure 1.0.6). In 2017, water transparency decreased to 4.2 m, which was once again the targeted mesotrophic range. In the nearshore water of the east basin, water transparency was in the oligotrophic range, which is above the FCO targets, from 1999 through 2006, sharply declined, and then steadily increased and generally remained within the FCO targets for the next ten years (Figure 1.0.6). In 2017, water transparency declined to 5.0 m in the nearshore waters of the east basin, which was within the targeted mesotrophic range. In the offshore waters of the east basin, water transparency was within the oligotrophic target from 1999 through 2007, decreased into the mesotrophic range in five of the next six years, then increased thereafter. In 2017, mean summer transparency was 6.2 m in the offshore waters, which was within the targeted oligotrophic range. Trophic State Index (TSI) and Ecosystem Targets A box and whisker plot was used to describe the trophic state index (TSI) for each of the basins in Lake Erie (Figure 1.0.7). Median TSI values indicate that the west basin remained in a eutrophic status from the beginning of the entire time series until 2015, which was more favorable for a centrarchid (bass, sunfish) fish community. In recent years, overall measures of productivity have declined and are near or within the targeted mesotrophic status, which is more favorable for percid production (Walleye, Yellow Perch). In the central basin, median TSI values have generally remained within the targeted mesotrophic range for the entire time series. Trends in the nearshore waters of the east basin indicate median TSI values and ranges mostly below the targeted mesotrophic range in the early years of the time series, increasing into the targeted mesotrophic zone in the late-2000s, decreasing back into oligotrophic status through 2015, and increasing the 5
6 last two years. Similar trends are apparent in the offshore waters of the east basin. The TSI values for 2017 indicate borderline eutrophic/mesotrophic status in the west basin (46.4), mesotrophic status in the central basin (44.1), and borderline mesotrophic/oligotrophic status in both the nearshore (35.9) and offshore (36.8) waters of the eastern basin (Table 1.0.2). In general, the trophic status measures indicate that Lake Erie is in a favorable condition for percid production across the entire lake. Zooplankton Biomass Zooplankton biomass varies among basins and years. In the west basin, the 2017 mean biomass was mg/m 3, which was the fifth highest value in the time series and well above the long-term average of mg/m 3 (Figure 1.0.8). Cladocerans provide the bulk of the biomass of zooplankton in the west basin although increases in both calanoid and cyclopoid copepods have been observed in recent years. In the central basin, the 2017 mean zooplankton biomass was mg/m 3, which was less than the average time-series biomass (130.4 mg/m 3 ). Calanoid copepods typically have been higher in biomass in the central basin compared to the west basin with cladocerans less numerous, but copepod biomass has been conspicuously low for the past four years. In the east basin, overall zooplankton biomass is traditionally lower compared to the central and west basins with cladocerans and calanoid copepods equally important (Figure 1.0.8). Looking at larger long-term trends, there appeared to be a gradient of high zooplankton biomass in the west and lower biomass in the east from 2000 to From 2009 through 2013, zooplankton biomass increased in the central and east basins, but shifted back to the west basin in 2015 with declines observed in the central and east basins. Cladocerans typically are more dominant in the west basin zooplankton community and decline to the east while calanoid and cyclopoid copepods tend to be higher in biomass in the central and east basins. 6


7 Table Ranges of lower trophic indicators for each trophic class and trophic state index with the associated fish community (Leach et al. 1977; Ryder and Kerr 1978; Carlson 1977). Table Trophic state index and current trophic status, by basin, from Lake Erie, The east basin is separated into nearshore and offshore. 7


8 Ontario NY 13 MI PA 8 7 OH Figure Lower trophic level sampling stations in Lake Erie and Lake St. Clair. Station 25 was added in Lake St. Clair stations were last sampled in Figure Mean summer (June-August) surface water temperature ( C) at offshore stations, weighted by month, by basin in Lake Erie, Solid black lines represent time series trends. Data included in this analysis by basin and station: West 3, 6; Central 8, 10, 11, 13; East 16, 18, 19, 25. 8
 bottom dissolved oxygen (mg/l) concentrations for offshore sites by basin in Lake Erie,")


9 Figure Summer (June-August) bottom dissolved oxygen (mg/l) concentrations for offshore sites by basin in Lake Erie, The red horizontal line represents 2 mg/l, a level below which oxygen becomes limiting to the distribution of many temperate freshwater fishes. Data included in this analysis by basin and station: West 3, 6; Central 8, 10, 11, 13; East 16, 18, 19, 25. Figure Mean chlorophyll a concentration (µg/l), weighted by month, by basin in Lake Erie, The east basin is separated into nearshore and offshore. Shaded areas represent trophic class ranges. For this analysis data from stations 3 through 20, and 25 were included. 9

 Secchi depth (m), weighted by month, by basin in Lake Erie, 1999-2016.")
10 Figure Mean total phosphorus (µg/l), weighted by month, for offshore sites by basin in Lake Erie, The east basin is separated into nearshore and offshore. Shaded areas represent the trophic class ranges. For this analysis data from stations 3 through 20, and 25 were included. Figure Mean summer (June-August) Secchi depth (m), weighted by month, by basin in Lake Erie, The east basin is separated into inshore and offshore. Yellow shaded areas represent the targeted trophic class range. For this analysis data from stations 3 through 20, and 25 were included. 10


11 Figure Box and whisker plot of trophic state indices (TSI) by basin in Lake Erie, The east basin is separated into nearshore and offshore. Shaded areas represent trophic class ranges. Boxes indicate 25 th and 75 th quartiles of the values with the median value as the horizontal line. Vertical lines show the range of values with individual points representing outliers. All stations (3-20, 25) were included in this analysis. 11


12 Figure (Continued) Box and whisker plot of trophic state indices (TSI) by basin in Lake Erie, The east basin is separated into nearshore and offshore. Shaded areas represent trophic class ranges. Boxes indicate 25 th and 75 th quartiles of the values with the median value as the horizontal line. Vertical lines show the range of values with individual points representing outliers. All stations (3-20, 25) were included in this analysis. 12

13 Figure Mean zooplankton biomass (mg/m 3 ) by major taxonomic group by basin, 1999 through There is no data for 1999 and 2015 in the east basin. West basin includes stations 3 through 6, central basin stations 7 through 14, and east basin stations 15 through 20. Data excludes rotifers and veligers. Harpacticoid zooplankton comprise a miniscule biomass for most years and are not included in the graph. 13
14 Charge 2: Describe the status and trends of forage fish in each basin of Lake Erie. Eastern Basin 2.1 Synopsis of 2017 Forage Status and Trends Total forage fish abundance in 2017 decreased in Ontario and New York and increased in Pennsylvania Young-of-the-year (age-0) Rainbow Smelt density was above the long-term mean (10-year) in New York and Pennsylvania, but below long-term means in Ontario Yearling-and-older (age-1+) Rainbow Smelt density was below long-term means in all three east-basin jurisdictions Spiny-rayed fishes were down in Ontario and New York but up in Pennsylvania, with higher than average densities of White Perch Young-of-the-year Emerald Shiner were not detected in Ontario or Pennsylvania; catches in New York were up in 2017 compared to 2016 but still lower than the long-term mean Alewife densities increased in New York and Ontario, but were not detected in Pennsylvania Round Goby densities decreased in Pennsylvania and Ontario but increased in New York Central Basin In Pennsylvania, overall forage abundance decreased slightly from 2016 In 2017, overall forage abundance increased in Ohio waters due to large cohorts of age-0 Gizzard Shad, Alewife, and White Perch Young-of-the-year Yellow Perch abundance increased in Ohio indices, but was below long-term means in both Pennsylvania and Ohio Young-of-the-year Rainbow Smelt abundance increased in western Ohio, but decreased in eastern areas of the basin Yearling-and-older Rainbow Smelt indices were below long-term means in all central basin surveys Round Goby indices were above long-term means in Pennsylvania, but below long-term means in Ohio Gizzard Shad and Alewife indices in Ohio were some of the highest in the time series 14
15 West Basin Forage abundance was above the long-term mean, ending a three-year decline Forage biomass declined from 2016 Young-of-the-year Gizzard Shad density increased to long-term mean levels, rebounding from historic lows in 2016 Young-of-the-year Rainbow Smelt density was near the long-term mean, also recovering from historic lows Young-of-the-year and age-1+ Emerald Shiner indices continue to be very low Young-of-the-year White Perch density was the highest since 2012 Round Goby abundance was at long-term mean Young-of-the-year Walleye recruitment increased from 2016 but remained below the longterm mean Young-of-the-year Yellow Perch recruitment increased from 2016; remains above the longterm mean White Bass recruitment increased to above the long-term mean, the highest since 2009 Yearling-and-older Spottail Shiners abundance was the lowest in the time series (since 1988) Young-of-the-year Walleye, White Bass and Smallmouth Bass were below long-term means; age-0 Yellow Perch and White Perch were near long-term means 15
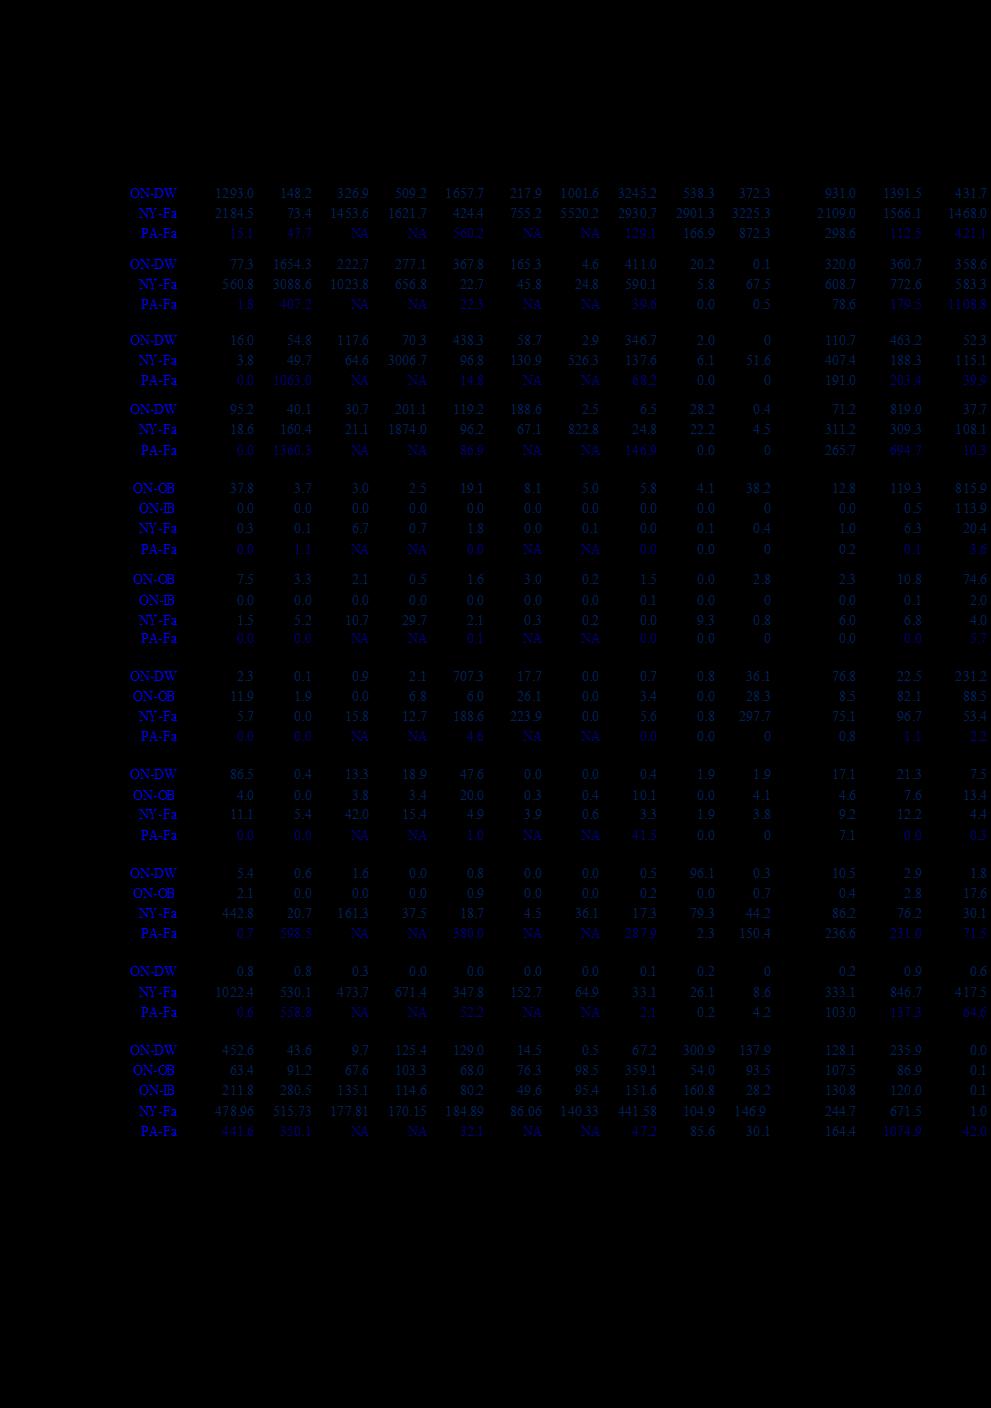
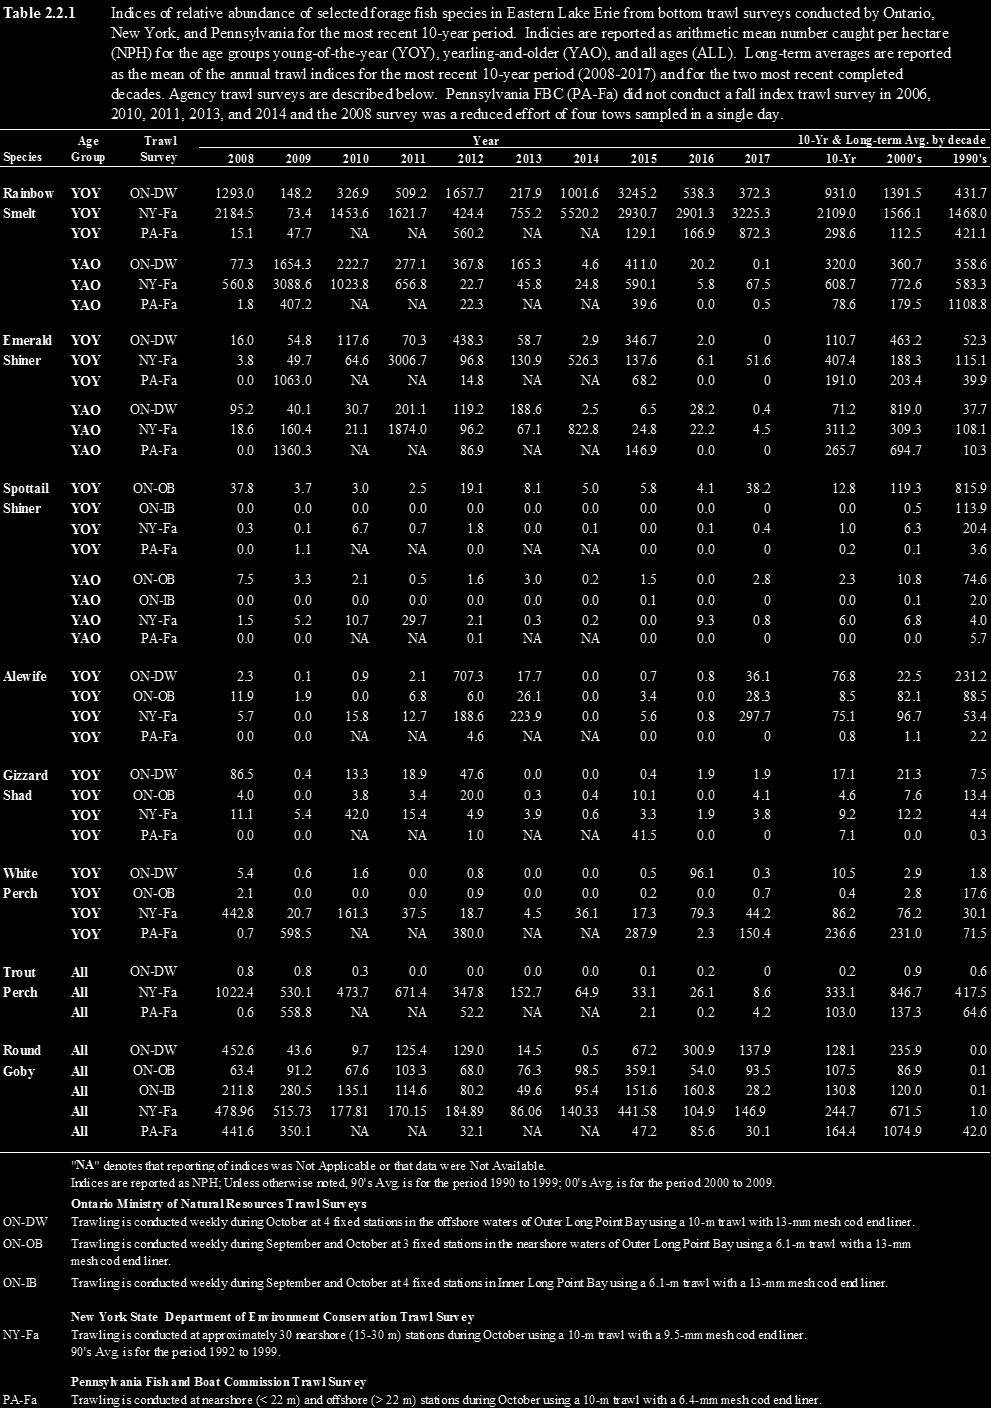
16 2.2 Eastern Basin (C. May, J. Markham and M. Hosack) Forage fish abundance and distribution is determined primarily from long-term bottom trawl assessments conducted by the basin agencies (also see East Basin Hydroacoustic Survey, Section 3.1). In 2017, a total of 34 trawl tows were sampled across New York waters (NYSDEC; n=26 years), 102 trawl tows in nearshore and offshore Long Point Bay of Ontario (OMNRF; n=37 and 34 years) and 10 trawls in Pennsylvania waters of the East Basin (PFBC; n=28 years) (Figure 2.2.1). In 2017, forage fish densities decreased in Ontario and New York and increased in Pennsylvania. Rainbow Smelt is the most abundant forage species in most years and jurisdictions and 2017 was no exception (Figure 2.2.2). However, this was primarily age-0 Rainbow Smelt. Very low densities of age-1+ Rainbow Smelt were caught in Ontario and Pennsylvania. Yearling-and-older catches were up from last year in New York but still low compared to the long-term mean. Alewife catches in New York were strong in Alewife numbers also increased in Ontario but were not caught in Pennsylvania. Spiny-rayed fishes were down in Ontario and New York but up in Pennsylvania, with higher than long-term mean densities of White Perch (Table 2.2.1). For soft-rayed fishes, age-0 Emerald Shiner was not detected in Ontario or Pennsylvania; catches in New York were up in 2017 compared to 2016 but still lower than average. Spottail Shiner density increased in Ontario but was very low in New York and not detected in Pennsylvania. Trout Perch remained low in all jurisdictions (Table 2.2.1). Round Goby, an important species in the eastern basin forage fish community since it appeared in the late 1990s, decreased in Pennsylvania and Ontario but increased in New York (Table 2.2.1). 2.3 Central Basin (J. Deller and M. Hosack) Routine bottom trawl surveys in the central basin began in Pennsylvania in 1982 and in Ohio in 1990 to assess age-0 percid and forage fish abundance and distributions. Trawl locations in Pennsylvania range from 13 to 24 m depth and Ohio trawl locations range from 5 to >20 m depth (Figure 2.3.1). Ohio West covers the area from Lorain to Fairport Harbor. Ohio East covers the area from Fairport Harbor to the Pennsylvania state line. The Pennsylvania survey covers the area from the Pennsylvania state line to Erie. In 2017, 62 trawl tows were completed in the central basin, 24 in Ohio East, 33 in Ohio West, and 5 in Pennsylvania. Currently there are no annual trawl surveys in Ontario. To address this gap, OMNRF and USGS are collaborating to develop a new survey. Preliminary trawls were conducted in 2016 and Future development, results and analysis of the new survey will be included in the Forage Task Group Report. In 2017, overall forage abundance in Ohio waters increased from 2016 (Figure 2.3.2). The largest increases were in the clupeid and spiny-rayed forage groups (primarily age-0 White Perch). The Rainbow Smelt forage group decreased slightly from In Pennsylvania, overall forage abundance decreased from 2016 due to decreases in both Rainbow Smelt and spiny-rayed forage groups (Figure 2.3.3). All forage group density estimates were below the 25-year average in Pennsylvania and Ohio. Trends in age-0 Rainbow Smelt abundance were not consistent across central basin surveys. Young-of-the-year Rainbow Smelt indices increased in Ohio West, but decreased in both Ohio East and Pennsylvania from Despite the observed decrease from 2016, the Pennsylvania index was above the long-term mean and was the third highest in the time series. Both Ohio indices were at the long-term mean. Yearling-and-older Rainbow Smelt indices increased in Ohio, but remained 16
17 low in Pennsylvania relative to 2016 (Table 2.3.2). All age-1+ indices for Rainbow Smelt in the central basin were below long-term means. Densities of Round Goby have tended to be higher in eastern relative to western areas of the basin (Table 2.3.1; 2.3.2). In 2017, age-0 and age-1+ Round Goby abundance increased dramatically in Pennsylvania, and were well above the long-term mean. Ohio indices were mixed, with slight increases in age-0 densities in both areas, and age -1+ in the west. All Ohio indices were below the long-term mean. In Ohio, age-0 Gizzard Shad and Alewife indices were some of the highest in the time series in 2017 (Table 2.3.1). The highest indices in Ohio were in the eastern areas of the basin. In Pennsylvania, Gizzard Shad and Alewife are not routinely captured in assessment surveys. Only Gizzard Shad were captured in 2017, and were below long-term means. Since 2005, Yellow Perch cohorts in the central basin have tended to be strongest in the east relative to the west. In 2017, Yellow Perch age-0 indices in Ohio increased from 2016, but remain below long-term means. Ohio indices have been generally below long-term means since In contrast, the age-0 Pennsylvania index was the third highest in the time series and was above the long-term mean (Table 2.3.1). Yearling-and-older indices in both Ohio surveys decreased from 2016 and have been in decline since 2015 (Table 2.3.2). Both Ohio indices were below long-term means. In contrast to Ohio, the Pennsylvania age-1+ index increased from 2016 and was above the long-term mean, most likely due to the above average age-0 cohort from Trends in White Perch age-0 and age-1+ indices across the central basin were mixed. Indices for age-0 White Perch increased in Ohio, but were below the long-term means (Table 2.3.1). In Pennsylvania, the age-0 White Perch index has been declining since 2015 and is below the longterm mean. Ohio indices decreased from 2016 and were below long-term means (Table 2.3.2). Pennsylvania s age 1+ index increased from 2016, but remains below the long-term mean. History 2.4 West Basin (Z. Slagle and E. Weimer) Interagency trawling has been conducted in Ontario and Ohio waters of the western basin of Lake Erie in August of each year since 1987, though missing effort data from 1987 has resulted in the use of data since This interagency trawling program was developed to measure basinwide recruitment of percids, but has been expanded to provide basin-wide community abundance indices. In 1992, the Interagency Index Trawl Group (ITG) recommended that the Forage Task Group review its interagency trawling program and develop standardized methods for measuring and reporting basin-wide community indices. Historically, indices from bottom trawls had been reported as relative abundances, precluding the pooling of data among agencies. In 1992, in response to the ITG recommendation, the FTG began the standardization and calibration of trawling procedures among agencies so that the indices could be combined and quantitatively analyzed across jurisdictional boundaries. SCANMAR was employed by most Lake Erie agencies in 1992, by OMNRF and ODNR in 1995, and by ODNR alone in 1997 to calculate actual fishing dimensions of the bottom trawls. In the western basin, net dimensions from the 1995 SCANMAR exercise are used for the OMNRF vessel, while the 1997 results are applied to the ODNR vessel. In 2002, ODNR began interagency trawling with the new vessel R/V Explorer II, and SCANMAR was again employed to estimate the net dimensions in In 2003, a trawl comparison exercise among all western basin research vessels was conducted, and fishing power correction factors (Table 2.4.1) have been applied to the vessels administering the western basin Interagency Trawling Program (Tyson et al. 2006). Presently, the FTG estimates basin-wide abundance of forage fish in the 17
18 western basin using information from SCANMAR trials, trawling effort distance, and catches from the August interagency trawling program. Species-specific abundance estimates (number per hectare or number per m 3 ) are combined with length-weight data to generate a species-specific biomass estimate for each tow. Arithmetic mean volumetric estimates of abundance and biomass are extrapolated by depth strata (0-6m, >6m) to the entire western basin to obtain a fishing power correction adjusted, absolute estimate of forage fish abundance and biomass for each species. For reporting purposes, species have been pooled into three functional groups: clupeids (age-0 Gizzard Shad and Alewife), soft-rayed fish (Rainbow Smelt, Emerald Shiner, Spottail Shiner, other cyprinids, Silver Chub, Trout-Perch, and Round Goby), and spiny-rayed fish (age-0 White Perch, White Bass, Yellow Perch, Walleye and Freshwater Drum). Hypoxic conditions have been observed during previous years of interagency bottom trawl assessment in the west basin. Due to concerns about the potential effects of hypoxia on the distribution of juvenile percids and other species, representatives from task groups, the Standing Technical Committee, researchers from the Quantitative Fisheries Center at Michigan State University and Ohio State University (OSU) developed an interim policy for the assignment of bottom trawl status. Informed by literature (Eby and Crowder 2002; Craig and Crowder 2005) and field study (ODNR /OSU/USGS) concerning fish avoidance of hypoxic waters, an interim policy was agreed upon whereby bottom trawls that occurred in waters with dissolved oxygen less than or equal to 2 mg per liter would be excluded from analyses. The policy has been applied retroactively from Currently, there is no consensus among task groups on the best way to handle this sort of variability in the estimation of year-class strength in Lake Erie. In part, this situation is hampered by a lack of understanding of how fish distribution changes in response to low dissolved oxygen. This interim policy will be revisited in the future following an improved understanding of the relationship between dissolved oxygen and the distribution of fish species and life stages in Lake Erie (Kraus et al. 2015) Results In 2017, hypolimnetic dissolved oxygen levels were below the 2 mg per liter threshold at one site during the August trawling survey (located offshore in the Sandusky sub-basin). In total, data from 72 sites were used in 2017 (Figure 2.4.1). Total forage abundance rebounded from a three-year decline ( ) in 2017, increasing to above the 10-year and overall means (Figure 2.4.2). Spiny-rayed species increased 35% compared to 2016, while soft-rayed species increased by 93%. Clupeid abundance increased 18-fold from historic lows in Total forage abundance averaged 5,769 fish/ha across the western basin, increasing 58% from 2016, and residing above the long-term mean (5,194 fish/ha). Clupeid density was 815 fish/ha (average 1,100 fish/ha), soft-rayed fish density was 262 fish/ha (mean 518 fish/ha), and spiny-rayed fish density was 4,692 fish/ha (mean 3,576 fish/ha). Relative abundance of the dominant species includes: age-0 White Perch (68%), Gizzard Shad (14%), and age-0 Yellow Perch (9%). Total forage biomass in 2017 declined 185% relative to 2016 (Figure 2.4.3). Relative biomass of clupeid, soft-rayed, and spiny-rayed species in 2017 was 26%, 2%, and 72%, respectively, and differed from their respective historic averages of 28%, 7%, and 65%. Spatial maps of forage distribution were constructed using FPC-corrected site-specific catches (number per hectare) of the functional forage groups (Figure 2.4.4). Abundance contours were generated using kriging techniques to interpolate abundance among trawl locations. Clupeid catches were highest in Sandusky Bay and off Catawba Island in the South Passage. Soft-rayed fish were most abundant in the waters east and south of Pelee Island. Spiny-rayed abundance was densest in northern Maumee Bay and off Catawba Island in the South Passage. 18
19 Recruitment of individual species is highly variable in the western basin. Young-of-the-year Yellow Perch (494/ha; Figure 2.4.5) increased relative to 2016 and was above the long-term mean (407/ha); age-0 Walleye abundance (23/ha; Figure 2.4.5) also increased but was below the longterm mean (31/ha). Young-of-the-year White Perch (3,907/ha) climbed above the 2016 index, above the long-term mean and was the highest since Young-of-the-year White Bass (248/ha) increased to above the long-term mean and was the highest since Young-of-the-year Rainbow Smelt (105/ha) rebounded to the long term mean after disappearing in 2016; Age-1+ Rainbow Smelt density (1.3/ha) was the greatest since Young-of-the-year Gizzard Shad (815/ha) increased relative to 2016 to just below the long-term mean (883/ha), while age-0 Alewife was again almost non-existent (Figure 2.4.6). Densities of age-0 (2.5/ha) and age-1+ Emerald Shiner (0.3/ha) were very low, but up from 2016, which was lowest in the time series (Figure 2.4.7). Age-1+ Spottail Shiner density was the lowest of the time series (0.4/ha). Summary of Michigan Lake Erie Forage Trawls (J. Hessenauer) Michigan initiated a trawling program to assess the forage and age-0 sportfish community in Michigan waters of Lake Erie in August of This assessment samples eight two-minute index grids for one five or ten minute tow, typically sampling an area of approximately ha depending on tow time. The otter trawl has a 33 foot head rope and 3/8 inch terminal mesh and is deployed with a single warp and 150 foot bridle. Captured fish are passed through a 1.25 inch screen to grade out forage and age-0 sized sportfish. In 2017 all eight sites (Figure 2.4.8; Table 2.4.2) were sampled between August 7 th and August 9 th. The 2017 survey had the highest density of total forage sized and age-0 sport fish (3,315.4/ha) across the four-year time series of the survey (Table 2.4.3). An abundance of foragesized Gizzard Shad (730.9/ha), White Bass (101.8/ha) and White Perch (1,896/ha) relative to other years in the survey drove this trend (Table 2.4.3). We also observed the highest density of age-0 Walleye (16.6/ha) over the four-year time series. The catch of Spottail Shiner declined to their lowest density (2.2/ha) over the four-year time series. Abundance of age-0 Yellow Perch (331.6/ha) declined in 2017 relative to 2016, but were slightly higher than the four-year average. Since this was only the fourth trawl survey in the time series, it is difficult to put the catch rates that we observed during 2017 into broader context for Michigan waters of Lake Erie. Michigan plans to continue forage trawling at these sites annually to contribute to lake wide estimates of forage and age-0 sportfish abundance. 19
20 20
21 Table Relative abundance (arithmetic mean number per hectare) of selected age-0 species from fall trawl surveys in the central basin, Ohio and Pennsylvania, Lake Erie, from Ohio West (OH West) is the area from Huron, OH, to Fairport Harbor, OH. Ohio East (OH East) is the area from Fairport Harbor, OH to the Ohio-Pennsylvania state line. PA is the area from the Ohio-Pennsylvania state line to Presque Isle, PA. Species Survey Year Mean Yellow OH West Perch OH East PA White OH West Perch OH East PA Rainbow OH West Smelt OH East PA Round OH West Goby OH East PA Emerald OH West Shiner OH East PA Spottail OH West Shiner OH East PA Alewife OH West OH East PA Gizzard OH West Shad OH East PA Trout- OH West perch OH East PA The Pennsylvania Fish and Boat Commission was unable to sample in 2006, 2010, 2011 and
22 Table Relative abundance (arithmetic mean number per hectare) of selected age-1+ species from fall trawl surveys in the central basin, Ohio and Pennsylvania, Lake Erie, from Ohio West (OH West) is the area from Huron, OH, to Fairport Harbor, OH. Ohio East (OH East) is the area from Fairport Harbor, OH to the Pennsylvania state line. PA is the area from the Ohio-Pennsylvania state line to Presque Isle, PA. Species Survey Mean Yellow OH West Perch OH East Year PA White OH West Perch OH East PA Rainbow OH West Smelt OH East PA Round OH West Goby OH East PA Emerald OH West Shiner OH East PA Spottail OH West Shiner OH East PA Trout- OH West perch OH East PA The Pennsylvania Fish and Boat Commission was unable to sample in 2006, 2010, 2011 and
23 Table Mean catch-per-unit-effort (CPUE) and fishing power correction factors (FPC) by vessel-species-age group combinations. All FPCs are calculated relative to the R.V. Keenosay. Mean CPUE (#/ha) FPC 95% CI Vessel Species Age group Trawl Hauls R.V. Explorer Gizzard shad Age Y Emerald shiner Age Y Troutperch Age z Y White perch Age z Y White bass Age Y Yellow perch Age N Yellow perch Age N Walleye Age z Y Round goby Age z Y Freshwater Age z Y drum R.V. Gibraltar Gizzard shad Age Y Emerald shiner Age Y Troutperch Age N White perch Age N White bass Age Y Yellow perch Age Y Yellow perch Age Y Walleye Age z Y Round goby Age N Freshwater Age z Y drum R.V. Grandon Gizzard shad Age z Y Emerald shiner Age Y Troutperch Age z Y White perch Age z Y White bass Age z Y Yellow perch Age Y Yellow perch Age Y Walleye Age Y Round goby Age z Y Freshwater Age z Y drum R.V. Musky II Gizzard shad Age Y Emerald shiner Age Y Troutperch Age Y White perch Age z Y White bass Age Y Yellow perch Age N Yellow perch Age z Y Walleye Age z Y Round goby Age Y Apply rule a Freshwater drum Age z Y z - Indicates statistically significant difference from 1.0 (α=0.05); a Y means decision rule indicated FPC application was warranted;, N means decision rule indicated FPC application was not warranted 23
24 Table Michigan forage trawl sampling dates, locations, and site conditions. Date 2min Grid Start_Lat St_Long End_Lat End_Long Stime (24hr) Towtime (min) Start Depth (m) End Depth (m) Temp (oc) Secchi (m) Area (ha) 08/07/ : /08/ : /08/ : /08/ : /09/ : /09/ : /09/ : /09/ :
25 Table Average density (number of fish per ha) of forage sized and age-0 sportfish captured during the Michigan trawl survey. Forage sized and age-0 individuals are graded through a 1.25 inch screen. Common Name BROOK SILVERSIDE 8.1 EMERALD SHINER 2.1 FRESHWATER DRUM GIZZARD SHAD LOGPERCH MIMIC SHINER RAINBOW SMELT ROCK BASS 0.2 ROUND GOBY SILVER CHUB SMALLMOUTH BASS SPOTTAIL SHINER TROUT-PERCH TUBENOSE GOBY WALLEYE WHITE BASS WHITE PERCH WHITE SUCKER 0.3 YELLOW PERCH GRAND TOTAL
26 Figure Locations sampled with standard index bottom trawls by Ontario (OMNRF), New York (NYSDEC) and Pennsylvania (PFBC) to assess forage fish abundance in eastern Lake Erie during
 by")

27 Figure Mean density of prey fish (number per hectare) by functional group in the Ontario, New York and Pennsylvania waters of the eastern basin, Lake Erie, Note that the y-axis values are lower for Pennsylvania. 27
 and Pennsylvania")
 by functional group in the")
28 Figure Locations sampled with index bottom trawls by Ohio (ODNR) and Pennsylvania (PFBC) to assess forage fish abundance in central Lake Erie during Figure Mean density of prey fish (number per hectare) by functional group in the Ohio waters of the central basin, Lake Erie,
 by functional")

29 Figure Mean density of prey fish (number per hectare) by functional group in the Pennsylvania waters of the central basin, Lake Erie, Figure Trawl locations for the western basin interagency (OMNRF and ODNR) bottom trawl survey, August
")


30 Figure Mean density (number per hectare) of prey fish by functional group in western Lake Erie, August Figure Mean biomass (tonnes) of prey fish by functional group in western Lake Erie, August

31 Figure Spatial distribution of clupeids, soft-rayed, spiny-rayed, and total forage abundance (number per hectare) in western Lake Erie, Black dots are trawl sites, white areas are estimates of zero abundance, and contour levels vary with each functional fish group. Figure Density of age-0 Yellow Perch and Walleye in the western basin of Lake Erie, August
32 Figure Density of age-0 Alewife and Gizzard Shad in the western basin of Lake Erie, August Figure Density of age-0 and age-1+ shiners (Notropis spp.) in the western basin of Lake Erie, August

33 Figure Map of Michigan waters of Lake Erie. The start of each trawl is indicated by a black dot. 33
34 Charge 3: Continue hydroacoustic assessment of the pelagic forage fish community in Lake Erie, incorporating new methods in survey design and analysis while following the GLFC s Great Lakes Hydroacoustic Standard Operating Procedures where possible/feasible. 3.1 East Basin Hydroacoustic Survey (C.May) A fisheries hydroacoustic survey has been conducted in the East Basin since 1993 to provide estimates of the distribution and abundance of Rainbow Smelt. The current hydroacoustic data acquisition system consists of a Simrad EY60 surface unit with a 120 khz 7-degree split-beam general purpose transducer mounted on a fixed pole in a down facing orientation approximately 1 m below the water surface on the OMNRF research vessel, R/V Erie Explorer. The 2014 edition of this report details the history, design and analytical methods of the hydroacoustic survey (Forage Task Group 2014). Companion mid-water trawls have been completed by NYSDEC in the past but due to vessel issues, those data have not been collected since Results All 12 transects were completed July 17, and 24-25, with a basin-wide average density of 3,201 fish/ha, representing a moderate density of forage fish in the east basin since 2007 (Figure 3.1.1). The largest density of forage fish the size of age-1+ Rainbow Smelt occurred between Long Point and Erie (Figure 3.1.2). 3.2 Central Basin Hydroacoustic Survey (P. Kočovský and J. Deller) The Ontario Ministry of Natural Resources (OMNR), Ohio Department of Natural Resources (ODNR), and the U.S. Geological Survey (USGS) have collaborated to conduct joint hydroacoustic and midwater trawl surveys in central Lake Erie since The 2017 central basin hydroacoustic survey was planned according to the protocol and sample design established at the hydroacoustic workshop held in Port Dover, Ontario in December 2003 (Forage Task Group 2005). That survey design calls for eight cross-basin transects on which both hydroacoustic and trawl data are collected. Beginning in 2008, all hydroacoustic data were collected and analyzed following recommendations in the Standard Operating Procedures for Fisheries Acoustics Surveys in the Great Lakes (GLSOP; Parker-Stetter et al. 2009). The primary purpose of the central basin hydroacoustic survey is to estimate densities of Rainbow Smelt and Emerald Shiner, which are the primary pelagic forage species in the central basin. Hydroacoustics Hydroacoustic data were collected from the USGS R/V Muskie and the ODNR-DOW R/V Grandon. Acoustic transects corresponding to Loran-C TD lines were sampled from one half hour after sunset (approximately 2130) to no later than one half hour before sunrise (approximately 0530), depending on the length of the transect and vessel speed. The prescribed starting and ending points for the survey are the 10 m depth contour lines. Hydroacoustic data, from both vessels, were collected with BioSonics DTX echosounders and BioSonics Visual Acquisition (release 6.0) software. Data from the R/V Muskie were collected 34
35 using a 120 khz, 7.4 degree, split-beam transducer mounted inside a through hull transducer tube at a depth of 1.5 m below the water surface. Data from the R/V Grandon were collected with a 122 khz, 7.6 degree, split-beam transducer mounted to the starboard hull on a movable bracket, roughly equidistant between the bow and stern, with the transducer 1.3 meters below the surface. Sound was transmitted at four pulses per second with each pulse lasting 0.4 milliseconds. Global Positioning Systems (GPS) coordinates from the R/V Muskie were collected using a Garmin GPSMAP 76Cx, and from the R/V Grandon, with a Garmin 17HVS. Both vessels interfaced GPS coordinates with the echosounders to obtain simultaneous latitude and longitude coordinates. Temperature readings from just above the thermocline were used to calculate speed of sound in water because the largest proportion of fish occurred nearest this depth in the water column. Selecting the temperature nearest the thermocline, where fish were densest, results in the least cumulative error in depth of fish targets. Prior to data collection, a standard tungsten-carbide calibration sphere, specific to 120-kHz transducers, was used to calculate a calibration offset for calculating target strengths. Background noise was estimated by integrating beneath the first bottom echo at several locations for each transect, then averaging within a transect. The average noise within a transect was subtracted from total backscatter. Analysis of hydroacoustic data was conducted following guidelines established in the Standard Operating Procedures for Fisheries Acoustics Surveys in the Great Lakes (Parker-Stetter et al. 2009) using Echoview version 7.1 software. Proportionate area backscattering coefficient was scaled by mean target strength calculated from single targets identified using Single Target Detection Method 2 (Parker-Stetter et al. 2009) to generate density estimates for distance intervals. Distance intervals for each transect were 500 m. Two depth strata, epilimnetic and hypolimnetic, were established by examining distributions of single target strength by depth. Settings for pulse length determination level, minimum and maximum normalized pulse length, maximum beam compensation, and maximum standard deviation of major and minor axes followed Parker-Stetter et al. (2009). Minimum target strength threshold was -74 db. This value permitted inclusion of all targets at least -68 db within the half-power (6 db) beam angle. We used -68 db as the lowest target of interest based on distribution of in situ target strength and theoretical values for Rainbow Smelt of the lengths captured in midwater trawls (Horppila et al. 1996, Rudstam et al. 2003). The Nv statistic, a measure of the probability of observing more than one fish within the sampling volume (Sawada et al. 1993), which will result in overlapping echoes, was calculated for each interval-by-depth stratum cell to monitor the quality of in situ single target data. If Nv for an interval-by-depth stratum cell was greater than 0.1, the mean TS of the entire stratum within a transect where Nv values were less than 0.1 was used (Rudstam et al. 2009). Density estimates for fish species were calculated by multiplying acoustic density estimates within each cell by proportions calculated from trawls. For each cell we used proportions of each species and age group from the trawl sample from the same water stratum and from a similar total depth that was nearest the cell. Trawling The R/V Keenosay conducted up to nine 20-minute trawls on transects in Ontario waters concurrent with and on the same transect as the R/V Muskie acoustic data collection. The R/V Grandon conducted up to three 20-minute midwater trawls in Ohio waters concurrent with acoustic data collection on the remaining transects. Whenever possible, trawl effort was distributed above and below the thermocline to adequately assess species composition throughout the water column. The catch was sorted by species and age group, and relative proportions of each species and age 35
36 group were calculated for each trawl. Age group was determined based on age-length keys and length distributions. Age group classifications consisted of young-of-year (age-0) for all species, yearling-and-older (age-1+) for forage species, and age-2-and-older (age 2+) for predator species. Total lengths were measured from a subsample of individuals from each species and age group. Temperature and dissolved oxygen profiles were recorded at each trawl location. Results Seven cross-lake transects were sampled between 17 July and 21 July 2017 with hydroacoustics and midwater trawls (Figure 3.2.1). The remaining transect was not completed due to weather and vessel commitments to other projects. Forty-Five midwater trawls were completed during the survey. Midwater trawl catch on the east transects (58100, 57975,57850) were comprised primarily of age-0 Rainbow Smelt (Table 3.2.1). Young-of-the-year Rainbow Smelt were also a large component of midwater trawls on the west transects (57725, 57600, 57475, 57350), however there were a few instances where age-0 Gizzard Shad or age-0 Morone species (White Perch, White Bass) were the primary catch. The highest catch of age-1+ Rainbow Smelt occurred on transect 57600, in the middle portion of the basin, in trawls that were run 10 m or deeper. Yearling-and-older Rainbow Smelt were encountered in most of the remaining transects, however, their proportion in the midwater trawl catch remained low relative to other species and age groups. Young-or-the-year Yellow Perch composed sizable portions of midwater trawl catches on all transects. Emerald Shiner weas caught on the four western most transects in very low numbers. The highest catch of Emerald Shiner occurred on Transect (11 individuals) and (24 individuals). Other species caught in midwater trawls included Freshwater Drum, Walleye, Rainbow Trout, Burbot, Alewife and Round Goby. Acoustic target strength (TS) distributions showed differences in TS across depth strata. Highest acoustic densities occurred in the upper depth layers relative to the lower layer in all but one transect (Table 3.2.2). Higher densities of age-0 Rainbow Smelt were encountered in the lower layer (below the thermocline) compared to the upper layer in transect Age group composition for Rainbow Smelt in the trawl catch did not separate by depth on most transects. Only on the western most transect, 57350, were the age groups roughly separated by depth. On the remaining transects, both Rainbow Smelt age groups were generally mixed above and below the thermocline. Young-of-the-year Yellow Perch were primarily located in the lower layer of the water column on all transects. Young-of-the-year Gizzard Shad, White Perch and White Bass densities were higher in the upper layer on all transects, relative to the lower layer, and densities for these three species tended to be higher in the west transects relative to transects in the east. Spatial distribution across transects varied by species and age group. The highest densities of age-0 Yellow Perch were found on the southern portions of most transects throughout the basin (Figure 3.2.2). Young-of-the-year Rainbow Smelt densities tended to be higher in the eastern transects compared to the west, and uniformly distributed from north to south across the basin (Figure 3.2.3). Yearling-and-older Rainbow Smelt densities were concentrated off Erieau, Ontario on transects and (Figure 3.2.4). Hydroacoustic density estimates for Emerald Shiner have been generally declining since 2011, and have been caught in very low numbers since 2015 (Figure 3.2.5). In 2017 only 47 Emerald Shiner were captured in 45 midwater trawls. Young-of-the-year Rainbow Smelt densities decreased from 2016, but were similar to densities encountered from 2011 through Yearling-and-older Rainbow Smelt decreased from 2016, but were similar to densities encountered from 2012 through
37 Temperature and dissolved oxygen profiles collected concurrently with midwater trawls found one area of low oxygen at the south end of transect off Cleveland, OH (Figure 3.2.6). At this location, dissolved oxygen levels 1.5 m above the bottom dropped below 3 mg/l, a concentration which is known to influence fish behavior (Vanderploeg 2009). Based on target distributions from whole-transect echograms, the thermocline depth tended to be deeper on the south end of transects compared to the north end (Figure 3.2.6; 3.2.7). Temperature and dissolved oxygen profiles collected by the R/V Keenosay and R/V Grandon during the acoustic survey support the thermocline patterns on the echograms. Discussion In 2017 there was a high proportion of age-0 Gizzard Shad, White Bass, and White Perch caught in midwater trawls relative to previous years. The high proportion of these other species is most likely due to the timing of the 2017 hydroacoustic survey and the low densities of Rainbow Smelt. Central basin hydroacoustic surveys are scheduled based on the timing of the new moon in July and are usually run during the days before and after the peak of the phase to take advantage of darker nighttime periods (Parker-Stetter et al. 2009). The new moon in 2017 peaked July 26, which resulted in the survey being run later in the month relative to previous years. Typically, when hydroacoustic surveys are run later in July, age-0 Gizzard Shad, Emerald Shiner, White Bass, and White Perch will have grown enough to be recruited to midwater trawls and hydroacoustic sonar. Young-or-the-year Gizzard Shad, or the combination of age-0 Gizzard Shad, White Bass and White Perch were the highest proportion of the catch in eight midwater trawls, all on western transects ( ). While Rainbow Smelt were caught in rather high proportions on all transects, they were consistently highest on the eastern transects ( ). In addition, densities of both age groups of Rainbow Smelt were much lower in 2017 relative to the previous two years. In most years, there is a strict pattern of Rainbow Smelt age groups separating around the thermocline, with age-0 fish in the upper layer, and age-1+ fish in the lower layer. However, the partition between age groups of Rainbow Smelt was not as obvious as in the past as both age groups were frequently encountered in both layers (above and below the thermocline). A late July hydroacoustic survey would normally include catches of age-0 Emerald Shiner in addition to the normal contribution from age-1+ Emerald Shiner. This was not the case in Only 15 age-0 and 32 age-1+ Emerald Shiner were captured in midwater trawls. While this is an increase from 2016 (catch of 3 age-1+), Emerald Shiner abundance remains at extremely low levels for both age groups In contrast to the recruitment of age-0 Gizzard Shad, White Bass, and White Perch, age-0 Yellow Perch are routinely caught during hydroacoustic surveys regardless of the timing of the new moon phase in July. While the overall proportion of age-0 Yellow Perch was relatively small in individual trawls (usually < 10%), they were caught on all transects, at or below the thermocline, with the highest densities generally occurring on the southern ends of transects. In 2016, the highest densities for age-0 Yellow Perch occurred above the thermocline, in the central and western transects. Hydroacoustics has been used to assess forage fish in central Lake Erie for approximately 13 years. The current design of hydroacoustic data collection in central Lake Erie includes 8 north- tosouth-oriented, cross-lake transects between the 10-m depth contours. Ideally two hydroacoustic vessels each collect data along 4 transects, paired with two additional vessels using midwater trawls to collect fish specimens to identify fish species and relative abundances. The stated objective of the survey is to produce a basin-wide snapshot of abundance of pelagic species, primarily Rainbow 37
38 Smelt and Emerald Shiner. A detailed history of the survey can be found in the March 2017 Forage Task Group Report to the Lake Erie Committee (Forage Task Group 2017). In June of 2017 we initiated analysis of the design and conduct of the central basin hydroacoustics program to address the questions discussed in previous reports to the Lake Erie Committee (Forage Task Group 2017). The principal objective is to better define what are relevant sampling strata for key forage species based on the last 10 years of trawl data from the R/V Keenosay, R/V Musky II, and R/V Grandon. Preliminary analyses have shown some basin wide trends in species location. We are proceeding with more rigorous analysis to try to quantify habitat boundaries (e. g. nearshore vs. offshore habitat). Results of the analysis will be discussed at future Forage Task Group meetings, and recommendations to improve the central basin survey will presented to the Lake Erie Committee. 3.3 West Basin Acoustic Survey (G. Steinhart) Since 2004, the Ohio Department of Natural Resources Division of Wildlife has been conducting a hydroacoustic forage fish survey in the western basin of Lake Erie. This survey consists of three, cross-basin transects surveyed between one-half hour after sunset and one-half hour before sunrise. No trawling has been conducted in conjunction with acoustic data collection since Methods Three fixed cross basin transects were successfully sampled in Surveying began on 17 July 2017, but within 30 min the new Lake Erie BioSonics DTX surface unit failed. After borrowing a DTX surface unit from the University of Toledo, all transect were sampled: transect 2 on July, transect 1 on July, and transect 3 on July. All transects were surveyed using a single, downward-facing, 6.1-degree, 201-kHz split-beam transducer, a Garmin global positioning system, and a Panasonic CF-30 laptop computer. BioSonics will repair or replace our DTX surface unit for future surveys. The acoustic system was calibrated after the survey with a tungsten carbide reference sphere of known acoustic size. The mobile survey, conducted aboard the ODNR s R/V Almar, was initiated approximately 0.5 h after sunset and completed by 0.5 h prior to sunrise. Transects were navigated with waypoints programmed in a Lowrance GPS, and speed was maintained at 8-9 km/h. The transducer was mounted to a BioSonics towfish at 1-m below the surface starboard side of the boat. Data were collected using BioSonics Visual Acquisition 6 software. Collection settings during the survey were 10 pings/second, a pulse length of 0.2 msec, and a minimum threshold of -70 db. The sampling environment (water temperature) was set at the temperature 2-m deep on the evening of sampling. Data were written to a file and named by the date and time the file was collected. Files were automatically collected every 30 minutes. Latitude and longitude coordinates were written to the file as the data were collected to identify sample location. Data were analyzed using the Myriax software Echoview 4.5 using a modified process developed by the Ohio Division of Wildlife Inland Fisheries Research Unit. Target strength range was estimated using Love s dorsal aspect equation (Love 1971): Total length = 10 ((Target Strength )/19.1) * 1000 Biomass estimates were based on average target length as determined by the above equation. 38
39 Results In 2017, three cross-basin transects (approximately 140 km in total) were surveyed July Forage fish densities were marginally highest on the middle transect (9,007 fish/ha) and lowest on the eastern transect (1,626 fish/ha). Forage fish were slightly more abundant on the southern end of the western and eastern transects (Figure 3.3.1). Western basin forage fish density (4,726 fish/ha) was the lowest since and less than half of 2016 densities (10,907 fish/ha). Biomass (8.26 kg/ha); however, was slightly higher than 2016 (6.73 kg/ha), although still less than half the long-term mean (18.6 kg/ha; Figure 3.3.2). 39
40 Table Percent composition of fish captured in trawl samples collected by the R/V Keenosay, and R/V Grandon in the central basin Lake Erie in July Transect Trawl ID Depth Layer Latitude Longitude Yellow Perch Age-0 Rainbow Smelt Age-0 Rainbow Smelt Age % 98% 0% 1% % 93% 0% 4% % 92% 7% 1% % 98% 0% 1% % 97% 1% 1% % 74% 23% 1% % 95% 2% 0% % 89% 3% 1% % 79% 13% 1% % 91% 0% 9% % 68% 0% 20% % 70% 0% 9% % 97% 1% 2% % 86% 0% 14% % 89% 0% 7% % 80% 15% 3% % 97% 0% 2% % 96% 0% 3% % 95% 2% 1% % 92% 0% 1% % 92% 3% 1% % 47% 0% 47% % 32% 0% 68% % 49% 41% 1% % 18% 0% 82% % 71% 1% 27% % 59% 40% 1% % 89% 5% 4% % 3% 97% 0% % 39% 43% 16% % 44% 3% 54% % 43% 26% 19% % 2% 94% 2% % 79% 0% 17% % 0% 0% 100% % 4% 0% 85% % 31% 0% 68% % 95% 3% 2% % 22% 0% 78% % 93% 3% 2% % 70% 28% 1% % 13% 1% 85% % 90% 3% 4% % 82% 1% 13% % 37% 30% 7% 1 Other species (age, N captured): Gizzard Shad YOY (770), White Bass YOY (221), Clupeidae (7), Cyprinidae (31), Moronidae (168), Alewife (11), Emerald Shiner (47), Freshwater Drum YAO (23), Gizzard Shad YAO (1), Round Goby (1), Rainbow Trout (2), Walleye Adult (53), White Bass YAO (10), White Perch YOY (119), White Perch YAO (30), Yellow Perch YAO (1), Burbot YOY (1). Other species 1 all ages 40
41 Table Density (number per hectare) of key species by age class and depth layer for hydroacoustic transects in central basin Lake Erie, July Transect numbers refer to Loran-TD lines. Depth layers were determined by differences in acoustic target strength (TS) across depth strata within each transect. Species were applied from midwater trawl catch by nearest distance within depth layer Age Species Upper Lower Upper Lower Upper Lower Upper Lower Upper Lower Upper Lower Upper Lower Age-0 Rainbow Smelt Age- Rainbow 1+ Smelt Age-0 Yellow Perch Age-0 Gizzard Shad Age-0 White Bass Age-0 White Perch All others
 estimates of pelagic forage fish in cold-water habitat (all species, age-1+ Rainbow Smelt-sized) during the July east basin, Lake Erie hydroacoustic")
42 Figure Mean density (fish per hectare) estimates of pelagic forage fish in cold-water habitat (all species, age-1+ Rainbow Smelt-sized) during the July east basin, Lake Erie hydroacoustic survey, Figure Density estimates of age-1+ Rainbow Smelt (fish per hectare) per 800 m interval along hydroacoustic transects in the eastern basin, Lake Erie in
43 Figure Hydroacoustic transects (solid lines) and midwater trawling stations ( ) in the central basin, Lake Erie, July 17-21, Transect numbers are Loran-TD lines. Eri Figure Density estimates of age-0 Yellow Perch (number per hectare) per distance interval along hydroacoustic transects in the central basin, Lake Erie. Distance intervals were 500 m segments to ensure adequate numbers of single targets for in-situ analysis. Transects are Loran-TD lines sampled in
44 Figure Density estimates of age-0 Rainbow Smelt (number per hectare) per distance interval along hydroacoustic transects in the central basin, Lake Erie. Distance intervals were 500 m segments to ensure adequate numbers of single targets for in-situ analysis. Transects are Loran-TD lines sampled in Figure Density estimates of age-1+ Rainbow Smelt (number per hectare) per distance interval along hydroacoustic transects in the central basin, Lake Erie. Distance intervals were 500 m segments to ensure adequate numbers of single targets for in-situ analysis. Transects are Loran-TD lines sampled in
 estimates of pelagic forage fish during the")
45 Figure Mean density (number per hectare) estimates of pelagic forage fish during the July central basin, Lake Erie hydroacoustic survey,
 along transects run by the R/V Grandon")

46 Figure Echogram files generated from Echoview software version 6.1 that show total back scattering (Sv) along transects run by the R/V Grandon in the central basin, Top panel is eastern transect, bottom panel is western transect. Red circle indicates oxygen levels measured at less than 3 mg/l. 46
 along transects run by the R/V Muskie in the central basin, 2017.")
47 Figure Echogram files generated from Echoview software version 6.1 that show total back scattering (Sv) along transects run by the R/V Muskie in the central basin, Top panel is eastern transect, bottom panel is western transect. 47
48 Figure Acoustic survey transects and associated density (number per hectare) for the western basin of Lake Erie, Figure Mean density (number per hectare) and biomass (kilograms per hectare) estimates from the western basin acoustic survey, Estimates are for acoustic targets between -60dB and - 38dB. Error bars are standard errors. 48
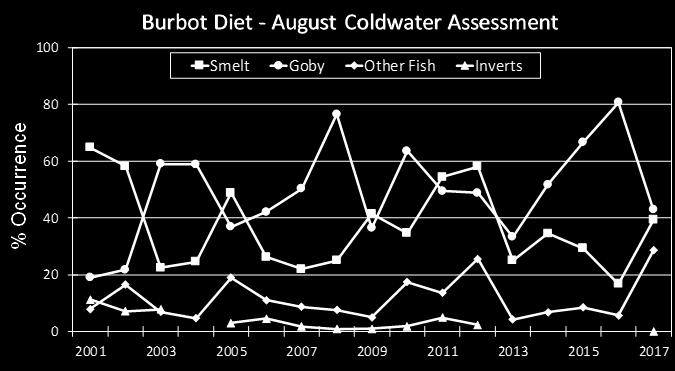
49 Charge 4: Report on the use of forage fish and new invasive species in the diets of selected commercially or recreationally important Lake Erie predator fishes. 4.1 Eastern Basin (C. May and J. Markham) Beginning in 1993, annual, summertime (June-August) visits were made to fish cleaning stations by the NYSDEC to gather stomach content information from angler-caught Walleye in the New York waters of Lake Erie. The number of Walleye stomachs examined annually ranged from 409 in 2000 to 34 in The percent of non-empty stomachs ranged from 57% in 1995 to 20% in During 2017, 227 Walleye stomachs were examined, of which 63 (28%) contained food remains. Round Goby was the dominant diet item by volume for angler-caught adult Walleye for the first time in the series; Rainbow Smelt have dominated Walleye diets in every previous year (Figure 4.1.1). The contribution by volume of identifiable species included five fish species: Round Goby (37%), Gizzard Shad (24%), Rainbow Smelt (13%), Moronidae Sp. (10%), and Emerald Shiner (1%). Also of note was the presence of Mayfly nymphs (Hexagenia spp.) for the first time since The prey items found in Walleye diets from summer index gillnets in Long Point Bay (34 non-empty stomachs examined) during 2017 were Rainbow Smelt (occurred in 91% of stomachs), Round Goby (6%) and Clupeids (6%). Round Goby has been a dominant component in the diets of Yellow Perch and Smallmouth Bass caught in gillnets in Long Point Bay since In Long Point Bay in 2017, Round Goby occurred in 68% of non-empty Yellow Perch (n=237) and 78% Smallmouth Bass (n=32) stomachs (Figure 4.1.2). Rainbow Smelt has been the dominant food item in lean strain Lake Trout since coldwater netting surveys began in the early 1980s in Lake Erie, occurring in 85-95% of the stomachs. However, Round Goby has become a more common prey item since they invaded the eastern basin of Lake Erie in the early 2000s, especially during years of low Smelt abundance. Klondike strain Lake Trout have typically shown a higher incidence of Round Goby in stomach contents compared to lean strain Lake Trout. During 2017, 341 lean strain Lake Trout and 6 Klondike strain Lake Trout stomachs were examined, of which 178 (52%) lean and 4 (67%) Klondike Lake Trout contained food remains. Rainbow Smelt remained the dominant forage species in lean strain Lake Trout, occurring in 88% of the non-empty stomach samples (Figure 4.1.3). Round Goby were the next most abundant diet item, occurring in 9% of the stomach samples. In Klondike strain Lake Trout, Rainbow Smelt was the only prey item found (Figure 4.1.4). Six Yellow Perch (3%) and one Gizzard Shad (<1%) were the only other identifiable fish species found in 2017, and these were in lean strain Lake Trout. One lean strain fish also contained Dreissenids in its stomach, possibly consumed while foraging for benthic fish species. Round Goby has increased in the diet of Burbot since this invasive species first appeared in Lake Erie s eastern basin in 1999, replacing Rainbow Smelt as the main prey item in Burbot diets in 10 of the last 14 years (Figure 4.1.5). In 2017, Round Goby (43%) and Rainbow Smelt (39%) were the most common fish species found in non-empty Burbot stomachs (n=28). Yellow Perch (18%) and Gizzard Shad (11%) were the only other identifiable fish species found in 2017 samples. In general, Burbot appear to have a more diverse diet than Lake Trout over this time series. Growth Mean length of age-2 and age-3 Smallmouth Bass sampled in autumn gill nets (New York) have remained stable over ten years and are among the highest in the 37-year time series. Beginning in the late 1990 s, roughly coincident with the arrival of Round Goby, Smallmouth Bass in Long Point Bay, Ontario, 49
50 exhibited a trend of increasing length-at-age (Figure 4.1.6). Following a peak in size-at-age for the older age classes in 2008, there was a moderate decreasing trend in size-at-age of Smallmouth Bass. However, size increased in Walleye length at age-1 and age-2 from gill net surveys targeting juveniles in New York has remained relatively stable for the past decade with both age-1 and age-2 Walleye currently at or near the long-term average. In general, age-0 and age-1 Yellow Perch have exhibited stable growth rates over the past ten years. Length-at-age of age-1 to age-6 Yellow Perch were above the time-series average ( ) in Ontario s Long Point Bay gillnet assessments in 2017, with the exception of age-3 fish, which were smaller than the long-term mean. Mean size-at-age (length and weight) of Lake Trout in 2017 were consistent with the recent 10-year average ( ) and condition coefficients (K) remain high. Klondike strain Lake Trout have significantly lower growth rates compared to lean strain Lake Trout. Lake Trout growth in Lake Erie continues to be stable and among the highest in the Great Lakes. 4.2 Central Basin (J. Deller) Diets of adult Walleye are collected from the central basin fall gill net survey in Ohio waters. In 2017, 205 non-empty stomachs were examined and analyzed for diet composition. Gizzard shad comprised 65.5% (by dry weight) of Walleye diets, followed by Rainbow Smelt (10.0%) (Figure 4.2.1). Emerald Shiner normally contribute up to 30% of Walleye diets. Emerald Shiner was not present in Walleye diets examined in In 2017, Emerald Shiner comprised 14.4% of Walleye diets, with the remaining diet items being Round Goby (4.4%) and unidentifiable fish remains (3.7%). Round Goby continue to comprise large portions of Smallmouth Bass and Yellow Perch diets in the central basin. In 2016, Round Goby accounted for 85.7% of Smallmouth Bass diets by dry weight (Figure 4.2.2). This was the second highest consumption rate by Smallmouth Bass in a 7-year time series. In 2017, Round Goby comprised over 27.5% of Adult Yellow Perch diets in the fall. Growth Growth rates of most age-0 predator and forage species in 2017 were below the long-term mean (10 years, ). Rainbow Smelt and Round Goby were the only species that were at or above long-term means. Mean length at age for Walleye from age-3 through age-8 was above long-term means. Mean length of White Bass and Yellow Perch are generally at or above long-term means through age-6, with no apparent trends in length-at-age for either species. 4.3 Western Basin (D. Panos, H. Bontrager, P. Kočovský and E. Weimer) In 2017, adult Walleye diets (by frequency of occurrence) taken from ODNR fall gill net catches consisted of Gizzard Shad (63%), Round Goby (10%), Invertebrates (10%), Yellow Perch (2%), and unidentifiable fish remains (15%) in the western basin. Yearling Walleye relied on Gizzard Shad (63%), Emerald Shiner (5%), and unidentifiable fish remains (32%). All age-0 Walleye diets from the fall gill net survey in 2017 were empty. Stomachs were collected by USGS from age-1+ Yellow Perch captured in bottom trawls from 42 sites throughout the western basin In June and September Fish were dissected in the field immediately after capture. Stomach contents were placed in Whirl-Pak bags and frozen at -70, then transferred to -20 after flash freezing. Contents were processed in the lab. Prey items were identified to the lowest taxonomic level possibly by coarse visual inspection (i.e., no effort was made to use taxonomic keys to identify species of Hexagenia), dried in a Heratherm drying oven at -60 until a constant mass was achieved, then weighed to the 50
51 nearest g. Frequency of occurrence was measured as percent of non-empty stomachs. Fifty-Six Yellow Perch stomachs were collected in June and 62 Yellow Perch stomachs in September. In June 12% of Yellow Perch stomachs were empty. In September 18% were empty. Analyses below are based on stomachs containing food. The most common taxon consumed by Yellow Perch in June was zooplankton (64%; Figure 4.3.1). This frequency increased to 68% in September. Specifically, the most common zooplankton consumed in June were Daphniidae (60%), Leptodoridae (48%), Calanoida (20%), and Bythotrephes sp. (16%). The only other zooplankton found was Sididae (4%, specifically Diaphanosoma). In September, the zooplankton with the highest frequency of occurrence was Daphniidae (46%). This was followed by Leptodoridae (32%), Bosminidae (27%), and Calanoida (23%). Less common September zooplankton included Cercopagididae (9%), Sididae (9%), Chydoridae (5%) and Cyclopoida (5%). In June, 56% of non-empty Yellow Perch stomachs contained benthic macroinvertebrates (Figure 4.3.1). This frequency dropped to 27% in September. In June, the most common benthic macroinvertebrate was Ephemeridae (specifically Hexagenia spp.; 32%). This was followed by Trichoptera (16%) and Chironomidae (16%). Less common benthic invertebrates in June included Nematoda (8%), Dreissenidae (8%), Ostracoda (4%), Hirudinea (4%), Amphipoda (4%), and unidentified invertebrates (4%). In September, the most common September benthic macroinvertebrate was Ephemeridae (27.3%, Hexagenia spp.). The only other September benthic macroinvertebrate taxon was Amphipoda (4%). There were no Trichoptera, Chironomidae, Nematoda, Dreissenidae, Ostracoda, or Hirudinea found in Yellow Perch stomachs from September. Fish prey occurrence decreased slightly from June (16%) to the September (14%; Figure 4.3.1). In June, the only identifiable fish prey was Round Goby, having a frequency of occurrence of 4% in June. Unidentified fish had an occurrence of 12% and 13% in June and September, respectively. Based on mean percent dry weights, benthic macroinvertebrates (50%) and zooplankton (46%) contributed the most to Yellow Perch diets in June (Figure 4.3.2). The highest contributing benthic macroinvertebrates were Ephemeridae (23%), Chironomidae (15%), and Dreissenidae (7%). All other macroinvertebrates contributed less than 3%. The zooplankton taxa Daphniidae and Leptodoridae contributed 32% and 13%, respectively. All other zooplankton taxa combined were less than 2% of the average individual s diets. Fish prey composed only 4% of an individual s diet (Round Goby was 0.3% and unidentified fish prey was 4%). The largest contributor to diets in September was zooplankton (68%), followed by benthic macroinvertebrates (21%) and unidentified fish prey (11%). The two main zooplankton contributors were Daphniae (28%) and Leptodoridae (27%; Figure 4.3.2). Taxa of lesser importance were Bosminidae (5%), Cercopagididae (5%), and Cyclopoida (2%). All other zooplankton contributed less than 2% each to the total dry weight of items consumed in September. Growth Overall, mean length of age-0 sport fish in 2017 decreased compared to 2016 (Figure 4.3.3). Lengths of select age-0 species in 2017 include Walleye (126 mm), Yellow Perch (68 mm), White Bass (58 mm), White Perch (56 mm), and Smallmouth Bass (66 mm). Walleye, White Bass, and Smallmouth Bass were below long term averages (138mm, 66mm, and 78mm respectively); Yellow Perch and White Perch were near long-term averages (67 mm and 58 mm respectively). 51
 of identifiable prey in stomachs of adult Walleye caught by")
 and")
52 Figure The percent contribution (by volume) of identifiable prey in stomachs of adult Walleye caught by summertime anglers in New York s portion of Lake Erie, Figure Percent occurrence of Round Goby in non-empty stomachs of adult Yellow Perch (top figure) and Smallmouth Bass (bottom figure) from OMNRF summer index gill nets set in summer months, Long Point Bay


53 Figure Percent occurrence of diet items from non-empty stomachs of Lean strain Lake Trout collected in eastern basin gill net assessments, August, Figure Percent occurrence of diet items from non-empty stomachs of Klondike strain Lake Trout collected in eastern basin gill net assessments, August, Figure Percent occurrence of diet items from non-empty stomachs of Burbot collected in eastern basin gill net assessments, August,

54 Figure Smallmouth Bass mean total length (mm) at ages 3 to 6 captured in OMNRF index gill nets set during summer months in Long Point Bay, Lake Erie, Males and females are combined. Smallmouth Bass ages were not available for 1992 samples. Figure Adult Walleye diet composition (Percent dry weight) from non-empty stomachs collected in gill nets from central basin, Ohio waters of Lake Erie,
 from")

55 Figure Adult Smallmouth Bass diet composition (Percent dry weight) from non-empty stomachs collected in gill nets from central basin, Ohio waters of Lake Erie, Figure Frequency of occurrence of prey taxa in diets of Yellow Perch from western Lake Erie, in June and September


56 Figure Percent composition of Yellow Perch diets (% dry weight) in western Lake Erie in June and September Figure Mean total length (mm) of select age-0 fishes in western Lake Erie, August
57 Charge 5: Develop and maintain a database to track Aquatic Invasive Species in Lake Erie (P. Kočovský) In 2016, the Lake Erie Committee added a new charge to Develop and maintain a database to track Aquatic Invasive Species (AIS) in Lake Erie. This charge was developed in recognition of the need for a systematic, centralized, lake-wide effort to track records of new, non-native species that might become invasive. The recognized need to better track status of the most recent invaders of management interest, such as Grass Carp, was the impetus for creating this new charge. Placing this charge with the Forage Task Group took advantage of the FTG s existing reporting structure, which includes sampling data from all agencies in all basins of Lake Erie, which has been a primary past source for detecting new invasive species, (e.g., Round Goby, White Perch). Our first efforts to fulfill this charge included adopting the USFWS service list of injurious freshwater species ( as the primary species to track and developing a relational database to track instances of new invasive species. All species on the USFWS list are believed to be absent from Canadian and US waters, with the exception of Prussian Carp, which are abundant and spreading in rivers in southern Alberta (Elgin et al. 2014, Docherty 2016). We also include Bighead Carp, Silver Carp, and Black Carp as species that are currently absent but potentially damaging to Lake Erie, Grass Carp, which have been reproducing in Lake Erie since at least 2011 (Chapman et al. 2013; Embke et al. 2016), and Rudd, which have reproducing populations in Ontario and New York waters connected to Lake Erie. We are also preparing a secondary list of candidate species, and we will include other non-native species not on the injurious species or candidate lists as they are reported. This report includes only species reported to member agencies and may not be complete. Reported non-native species One Rudd (Scardinius erythrophthalmus) was captured 14 June by electrofishing during sampling as part of a University of Toledo Master s research project. The fish was 375 mm and 1050 g and was deposited in the Ohio State museum (specimen number OSUM ). Rudd have been captured in and are believed to be reproducing in the upper Niagara River, and they have been captured elsewhere in the Lake Erie Basin (see Forage Task Group 2017) including western Lake Erie. The capture in 2017 does not represent a range expansion. Forty-two Grass Carp were captured in Lake Erie or its tributaries in 2017 (Figure 5.1.1). Seven diploid and nine triploid fish were captured in Michigan waters, all in commercial seines. Two diploid females were captured in North Maumee Bay in late July. All other fish were captured near cooling water effluent ponds near Monroe, Michigan. Twenty-six Grass Carp were captured in Ohio waters between early March and late August. Fifteen were captured by a commercial seine fisherman in the lower Sandusky River. Two were captured in commercial trap nets, one near Maumee Bay, the other on the east side of Catawba Island. The remaining eight were captured during a multi-agency effort to capture Grass Carp on the lower Sandusky River on August. All fish were either diploid or of unknown ploidy. No Grass Carp were reported from New York, Ontario, or Pennsylvania waters of Lake Erie. Pennsylvania remains the only jurisdiction from which Grass Carp have not been reported in Lake Erie. There are no apparent trends in number of total Grass Carp or number of diploid or triploid Grass Carp in Michigan waters between 2012 and In Ohio waters there is a trend of increasing overall numbers, with a decrease in triploid and an increase in diploid Grass Carp. One new non-native species was reported by FTG member agencies in On 20 March 2017 a private citizen delivered to New York State Department of Environmental Conservation a Clown Knifefish 57
58 (Chitala ornata) that he found in Van Buren Bay in New York waters of eastern Lake Erie. Clown Knifefish is a freshwater species native to the Ganges-Brahmaputra and Mahanadi river basins in southeast Asia (Nico et al. 2017). Wyman-Grothem (2017) rated this species as highly invasive based on the existence of an established population in Florida and ecological effects elsewhere, but climate match is low for the Great Lakes and most of conterminous US. Annual fish community surveys (electrofishing, gill nets, trawls, seines, and trap nets) provide extensive spatial coverage on Lake Erie (Figure 5.1.2). There were no Bighead or Silver carp captured in assessment surveys in In addition, neither species was reported from commercial or recreational fisheries. 58


59 Figure Numbers of Grass Carp captured in Lake Erie or its tributaries by jurisdiction, year, and reproductive status. Figure Annual agency assessment locations in Lake Erie. Standard survey assessment gears include electrofishing, gill nets, trawls, seines, and trap nets. Sampling is conducted by MDNR, NYSDEC, ODNR, OMNRF, PFBC and USGS. 59
Report of the Lake Erie Forage Task Group. March 2017
 Report of the Lake Erie Forage Task Group March 2017 Members: Zy Biesinger Geoff Steinhart Mark Clapsadl John Deller Andrew Briggs Jan-Michael Hessenauer Mike Hosack Patrick Kočovský Tom MacDougall Jim
Report of the Lake Erie Forage Task Group. March 2015
 Report of the Lake Erie Forage Task Group March 2015 Members: Mike Thomas - Michigan Department of Natural Resources, (MDNR) {Co-Chair} Zy Biesinger - United States Fish and Wildlife Service, (USFWS) {Co-Chair}
Report of the Lake Erie Forage Task Group. March 2012
 Report of the Lake Erie Forage Task Group March 2012 Members: Jim Markham - New York Department of Environmental Conservation, (NYS DEC) {Co-Chair} Mike Hosack - Pennsylvania Fish and Boat Commission,
Report of the Lake Erie Forage Task Group. March Members: Presented to:
 Report of the Lake Erie Forage Task Group March 2001 Members: Tim Johnson Mike Bur John Deller Don Einhouse Bob Haas Chuck Murray Lars Rudstam Mike Thomas Betsy Trometer Jeff Tyson Larry Witzel - Ontario
Report of the Lake Erie Forage Task Group. March 2010
 Report of the Lake Erie Forage Task Group March 2010 Members: Eric Weimer Mike Bur John Deller Bob Haas Tom MacDougall Jim Markham Chuck Murray Elizabeth Trometer Larry Witzel - Ohio Department of Natural
Status of Lake Erie s Western Basin Fish Populations: Trends and Environmental Conditions
 Status of Lake Erie s Western Basin Fish Populations: Trends and Environmental Conditions Jeff Tyson Ohio Department of Natural Resources Ohio Division of Wildlife Status of the Lake Erie s Western Basin
Hydroacoustic survey of Otsego Lake, 2004
 Hydroacoustic survey of Otsego Lake, 2004 Thomas E. Brooking 1 Mark D. Cornwell 2 INTRODUCTION Fishery managers must often rely on uncertain information regarding abundance and distribution of offshore
Hydroacoustic surveys of Otsego Lake s pelagic fish community,
 Hydroacoustic surveys of Otsego Lake s pelagic fish community, 2010 1 Holly A. Waterfield 2 and Mark Cornwell 3 INTRODUCTION Hydroacoustic surveys were conducted in May and November 2010 to estimate pelagic
Status of the Lake Erie Fish Community Jeff Tyson, Ohio Division of Wildlife
 Status of the Lake Erie Fish Community 2010 Jeff Tyson, Ohio Division of Wildlife Status of the Lake Erie Fish Community 2010 Physical Environment/Fish Community West to east gradient in depth, temperature,
Lake St. Clair Fish Community and Fishery
 Lake St. Clair Fish Community and Fishery Megan Belore Ontario Ministry of Natural Resources and Forestry Mike Thomas Michigan Department of Natural Resources Fish Community Fish Community Mixture of warm
Highlights of the Annual Lake Committee Meetings Great Lakes Fishery Commission proceedings, Toronto, Ontario
 Inland Seas Angler GREAT LAKES BASIN REPORT Special Report Lakes Erie & St. Clair A Publication of the Great Lakes Sport Fishing Council April 2018 http://www.great-lakes.org Vol. 29, No. 4.2 Highlights
Alewife (Alosa pseudoharengus) abundance in Onondaga Lake, A report to Onondaga County. January 2014
 abundance in Onondaga Lake, A report to Onondaga County. January 2014") Alewife (Alosa pseudoharengus) abundance in Onondaga Lake, 2013. A report to Onondaga County. January 2014 Lars G. Rudstam, Per G. Rudstam, Elizabeth M. Keller. Cornell Biological Field Station, Department
Alewife (Alosa pseudoharengus) abundance in Onondaga Lake, 2013. A report to Onondaga County. January 2014 Lars G. Rudstam, Per G. Rudstam, Elizabeth M. Keller. Cornell Biological Field Station, Department
APPENDIX 3E HYDROACOUSTIC ANALYSIS OF FISH POPULATIONS IN COPCO AND IRON GATE RESERVOIRS, CALIFORNIA NOVEMBER
 APPENDIX 3E HYDROACOUSTIC ANALYSIS OF FISH POPULATIONS IN COPCO AND IRON GATE RESERVOIRS, CALIFORNIA NOVEMBER 23 February 24 PacifiCorp Fish Resources FTR Appendix 3E.doc Hydroacoustic Analysis of Fish
Keuka Lake State of the Lake 2017
 Keuka Lake State of the Lake 2017 1 2 Lake Characteristics Third largest by area of the Finger Lakes 11,730 ac Deep and steep sided - max 185 ft mean 101 ft Two story fishery (warmwater/coldwater) 178,800
In each summer issue of Lake
 The 2000 Lake Erie Walleye Report by Rick Kubb In each summer issue of Lake Erie Walleye Magazine, we provide a synopsis of the walleye fishery in Lake Erie based on the scientific reports produced by
During the mid-to-late 1980s
 The 2001 Yellow Perch Report by Rick Kubb During the mid-to-late 1980s the yellow perch popula tions in Lake Erie were among the highest on record. Limit catches by fishermen were extremely common during
2011 Status of Major Stocks. Lake Erie Management Unit March 2012
 211 Status of Major Stocks Lake Erie Management Unit March 212 The Lake Erie Management Unit of the Ontario Ministry of Natural Resources is responsible for managing the fishery resources of the Ontario
Ohio Lake Erie Fisheries Report For 2002
 Ohio Lake Erie Fisheries Report For 2002 Summary and Excerpts from the March 2003 report by the Lake Erie Fisheries Units of the Ohio Department of Natural Resources, Division of Wildlife Note: Tables
ATLANTIC STATES MARINE FISHERIES COMMISSION. Winter Flounder Abundance and Biomass Indices from State Fishery-Independent Surveys
 ATLANTIC STATES MARINE FISHERIES COMMISSION Winter Flounder Abundance and Biomass Indices from State Fishery-Independent Surveys Technical Committee Report to the Winter Flounder Management Board February
STUDY PERFORMANCE REPORT
 STUDY PERFORMANCE REPORT State: Michigan Study No.: 427 Project No.: F-81-R-1 Title: Measurement of sportfishing harvest in lakes Michigan, Huron, Erie, and Superior Period Covered: October 1, 1999 to
Fine-Scale Survey of Right and Humpback Whale Prey Abundance and Distribution
 DISTRIBUTION STATEMENT A. Approved for public release; distribution is unlimited. Fine-Scale Survey of Right and Humpback Whale Prey Abundance and Distribution Joseph D. Warren School of Marine and Atmospheric
Onondaga Lake Fishery: 2011 Fact Sheet
 October, 2011 Onondaga County Department of Water Environment Protection SUNY College of Environmental Science and Forestry Joanne M. Mahoney, County Executive Tom Rhoads, P.E., Commissioner Onondaga Lake
Michigan Department of Natural Resources Status of the Fishery Resource Report Page 1
 Michigan Department of Natural Resources 2007-33 Status of the Fishery Resource Report Page 1 Grand Sable Lake Alger County, T49N, R14W, Sec. Many Lake Superior watershed, last year surveyed 2004 James
Status and Trends of the Lake Superior Fish Community,
 Status and Trends of the Lake Superior Fish Community, 1978-2015 An Overview of the USGS Lake Superior Monitoring and Research Program Owen Gorman, Mark Vinson & Daniel Yule Lake Superior Biological Station
FISH COMMUNITIES AND FISHERIES OF THE THOUSAND ISLANDS AND MIDDLE CORRIDOR
 St. Lawrence River Discussion Paper FISH COMMUNITIES AND FISHERIES OF THE THOUSAND ISLANDS AND MIDDLE CORRIDOR Issues Below is a synopsis of fish community issues and proposed management approaches. More
JadEco, LLC PO BOX 445 Shannon, IL 61078
 Introduction: With the assistance of Lake Holiday staff and volunteers, we were able to conduct an AC electrofishing survey on May 8, 27. Water temperatures were 2.3 C (8.5 F) and water clarity was decent
Fisheries Survey of Saratoga Lake
 Fisheries Survey of Saratoga Lake 7- Mark D. Cornwell Kevin Poole State University of New York College of Agriculture & Technology Department of Fisheries & Wildlife Cobleskill, NY ABSTRACT: This survey
LAKE WASHINGTON SOCKEYE SALMON STUDIES. Richard E. Thorne and James J. Dawson
 FRI-UW-7613 October 1976 LAKE WASHINGTON SOCKEYE SALMON STUDIES 1975 1976 by Richard E. Thorne and James J. Dawson Final Report Service Contract No. 648 Washington State Department of Fisheries For the
Summary of 2012 DNR and Partners Fisheries Surveys in St. Clair/Lake Erie and Fishery Forecast for 2013
 Summary of 2012 DNR and Partners Fisheries Surveys in St. Clair/Lake Erie and Fishery Forecast for 2013 LE/LSC Citizens Fishery Advisory Committee April 2, 2013 Michael Thomas Fisheries Research Biologist
Rat Cove and Brookwood Point littoral fish survey, 2002
 Rat Cove and Brookwood Point littoral fish survey, 2 Katie Wayman 1 INTRODUCTION During the summer of 2, efforts to monitor the Otsego Lake littoral fish community continued with trap netting at both Rat
Alewife (Alosa pseudoharengus) density as a predictor of open water utilization by walleye (Sander vitreus) in Otsego Lake, NY
 density as a predictor of open water utilization by walleye (Sander vitreus) in Otsego Lake, NY") Alewife (Alosa pseudoharengus) density as a predictor of open water utilization by walleye (Sander vitreus) in Otsego Lake, NY B.E. Bowers 1 INTRODUCTION Walleye (Sander vitreus) are typically associated
Alewife (Alosa pseudoharengus) density as a predictor of open water utilization by walleye (Sander vitreus) in Otsego Lake, NY B.E. Bowers 1 INTRODUCTION Walleye (Sander vitreus) are typically associated
Lambda Review Workshop Completion Report
 Lambda Review Workshop Completion Report Presented by the Standing Technical Committee to the Lake Erie Committee 03/07/2007 Introduction The Lake Erie Committee (LEC) is an international committee consisting
LAKE ONTARIO FISH COMMUNITIES AND FISHERIES: 2013 ANNUAL REPORT OF THE LAKE ONTARIO MANAGEMENT UNIT
 LAKE ONTARIO FISH COMMUNITIES AND FISHERIES: 2013 ANNUAL REPORT OF THE LAKE ONTARIO MANAGEMENT UNIT LAKE ONTARIO FISH COMMUNITIES AND FISHERIES: 2013 ANNUAL REPORT OF THE LAKE ONTARIO MANAGEMENT UNIT
Climate Change Impacts on Great Lakes Fishes
 Climate Change Impacts on Great Lakes Fishes Stuart A. Ludsin ludsin.1@osu.edu Changing Climate Webinar Series The Ohio State University 19 April 2011 Today s Presentation Great Lakes Fish Community A
Zooplankton Availability to. Larval Walleye (Sander vitreus) in Black Lake, MI, USA
 in Black Lake, MI, USA") Zooplankton Availability to Larval Walleye (Sander vitreus) in Black Lake, MI, USA Dana Jo DePlonty School of Biological Science Dr. Kristi Arend 1 Abstract Black Lake has very few small walleye even though
Zooplankton Availability to Larval Walleye (Sander vitreus) in Black Lake, MI, USA Dana Jo DePlonty School of Biological Science Dr. Kristi Arend 1 Abstract Black Lake has very few small walleye even though
CARL BLACKWELL LAKE MANAGEMENT PLAN
 CARL BLACKWELL LAKE MANAGEMENT PLAN Background Lake Carl Blackwell impounds Stillwater Creek, 10 miles west of Stillwater in Payne County, Oklahoma (Figure 1). The lake covers 3,370 surface acres and was
DEVELOPMENT OF A HYDROACOUSTIC SURVEY DESIGN TO QUANTIFY PREY FISH ABUNDANCE IN THE MINNESOTA WATERS OF LAKE SUPERIOR
 Minnesota Department of Natural Resources Investigational Report 53, 26 DEVELOPMENT OF A HYDROACOUSTIC SURVEY DESIGN TO QUANTIFY PREY FISH ABUNDANCE IN THE MINNESOTA WATERS OF LAKE SUPERIOR Tom Hrabik
Forage Fish in Chesapeake Bay: Status, Trends, Science and Monitoring
 Forage Fish in Chesapeake Bay: Status, Trends, Science and Monitoring GIT Meeting Chesapeake Biological Lab Solomons, MD 4 December 2013 Chesapeake Bay Watershed Agreement, Draft 11/3/13 Forage Fish Outcome:
BIG TWIN LAKE Kalkaska County (T28N, R05W, Section 18, and T28N, R06W, Section 13) Surveyed May 1999
 Surveyed May 1999") Michigan Department of Natural Resources Status of the Fishery Resource Report No. 2001-1, Year 2001 BIG TWIN LAKE Kalkaska County (T28N, R05W, Section 18, and T28N, R06W, Section 13) Surveyed May 1999
Michigan Department of Natural Resources Status of the Fishery Resource Report No. 2001-1, Year 2001 BIG TWIN LAKE Kalkaska County (T28N, R05W, Section 18, and T28N, R06W, Section 13) Surveyed May 1999
Little Calumet River Rapid Response Fish Identification and Enumeration Branch Summary Report
 Little Calumet River Rapid Response Fish Identification and Enumeration Branch Summary Report Introduction A rotenone rapid response was completed on a 2.6-mile section of the Little Calumet River immediately
Lake Ontario Fish Communities and Fisheries: 2016 Annual Report of the Lake Ontario Management Unit
 Lake Ontario Fish Communities and Fisheries: 216 Annual Report of the Lake Ontario Management Unit Cover Photos: (Left) MNRF s Ontario Explorer departing the Toronto Harbour, July 17, 216 (Right top) Ontario
2017 Lake Winnebago Bottom Trawling Assessment Report
 217 Lake Winnebago Bottom Trawling Assessment Report Adam Nickel, Winnebago System Gamefish Biologist, March 218 There were several highlights from the 217 Lake Winnebago bottom trawling survey, including
Mid-Continent Ecology Division Jack Kelly Peder Yurista. University of WI - Superior
 Lake Superior s Lower Trophic Levels Mary Balcer University of Wisconsin Superior Presented at Making a Great Lake Superior Conference Fisheries and Aquatic Ecology Section October 27 Contributors Great
STUDY PERFORMANCE REPORT
 STUDY PERFORMANCE REPORT State: Michigan Study No.: 427 Project No.: F-81-R-2 Title: Measurement of sportfishing harvest in lakes Michigan, Huron, Erie, and Superior Period Covered: October 1, 2000 to
Application of a New Method for Monitoring Lake Trout Abundance in Yukon: Summer Profundal Index Netting (SPIN)
") Application of a New Method for Monitoring Lake Trout Abundance in Yukon: Summer Profundal Index Netting (SPIN) Prepared by: Lars Jessup Nathan Millar November 2011 Application of a New Method for Monitoring
Application of a New Method for Monitoring Lake Trout Abundance in Yukon: Summer Profundal Index Netting (SPIN) Prepared by: Lars Jessup Nathan Millar November 2011 Application of a New Method for Monitoring
Dan O Keefe, Ph.D. Ottawa County Water Quality Forum November 19, 2018
 Dan O Keefe, Ph.D. Ottawa County Water Quality Forum November 19, 2018 Sea Grant Communication Products YouTube Channel Fish Notes enewsletter MSU Extension News Fact sheets and brochures Reports and white
Lake Ontario Fish Communities and Fisheries: 2017 Annual Report of the Lake Ontario Management Unit
 Lake Ontario Fish Communities and Fisheries: 2017 Annual Report of the Lake Ontario Management Unit Cover Photos: (Left) MNRF s Ontario Explorer on Lake Ontario (Right top) Walleye equipped with acoustic
DRIPPING SPRINGS LAKE 5 YEAR LAKE MANAGEMENT PLAN
 DRIPPING SPRINGS LAKE 5 YEAR LAKE MANAGEMENT PLAN FISHERIES DIVISION CENTRAL REGION OKLAHOMA DEPTMENT OF WILDLIFE CONSERVATION PREPARED BY: DANNY BOWEN OCTOBER 2013 1 Background Dripping Springs Lake impounds
Rainy Lake Open-water Creel Survey:
 Rainy Lake Open-water Creel Survey: 21 11 Darryl McLeod District Update 212-1 Introduction An open-water creel survey was conducted on the Ontario portion of Rainy Lake from May 15 th (the opening of the
Introduction: JadEco, LLC PO BOX 445 Shannon, IL 61078
 Introduction: was contacted to collected data on the fishery for Lake Holiday. AC Electroshocking was conducted at 2 locations on September 28, 2015. Fish population data was collected for a total of 100
MISSISSIPPI MAKEOVER A Plan for Restoration, Just Around the Bend
 MISSISSIPPI MAKEOVER A Plan for Restoration, Just Around the Bend Interim Report Card 2013 Project coordinated by the Dakota County Soil and Water Conservation District and sponsored by the Minnesota Pollution
STUDY PERFORMANCE REPORT
 STUDY PERFORMANCE REPORT State: Michigan Project No.: F-81-R-4 Study No.: 451 Title: Evaluation of lake trout stocks in Lake Huron Period Covered: October 1, 1996 to September 30, 2002 Study Objective:
Job 1 Part JOB 1, PART 2: SUMMARY OF CONOWINGO DAM WEST FISH LIFT OPERATIONS, 2009
 2.0 JOB 1, PART 2: SUMMARY OF CONOWINGO DAM WEST FISH LIFT OPERATIONS, 2009 Lawrence M. Miller Normandeau Associates U. S. Fish and Wildlife Service 1921 River Road Harrisburg, Pennsylvania Drumore, Pennsylvania
DOW# West Twin Lake
 DOW# 69-0696 West Twin Lake West Twin Lake has a surface area of 120.4 acres and is located on the east side of St. Louis County Road 31, south of Highway 2. West Twin Lake has a maximum depth of 18 feet
LAKE DIANE Hillsdale County (T8-9S, R3W, Sections 34, 3, 4) Surveyed May Jeffrey J. Braunscheidel
 Surveyed May Jeffrey J. Braunscheidel") Michigan Department of Natural Resources Status of the Fishery Resource Report No. 2003-4, 2003 LAKE DIANE Hillsdale County (T8-9S, R3W, Sections 34, 3, 4) Surveyed May 2001 Jeffrey J. Braunscheidel Environment
Michigan Department of Natural Resources Status of the Fishery Resource Report No. 2003-4, 2003 LAKE DIANE Hillsdale County (T8-9S, R3W, Sections 34, 3, 4) Surveyed May 2001 Jeffrey J. Braunscheidel Environment
NORTHWEST SCIENCE AND INFORMATION
 Science and Information Branch NORTHWEST SCIENCE AND INFORMATION Aquatics Update 2002-1 Fall Walleye Index Netting (FWIN) and Trap Netting Summary for Niobe Lake, 2000 by T. Cano Introduction Since 1981,
Michigan Dept. of Natural Resources Status of the Fishery Resource Report Page 1. Weber Lake Cheboygan County, T34N, R3W, Sec.
 Michigan Dept. of Natural Resources 2012-143 Status of the Fishery Resource Report Page 1 Weber Lake Cheboygan County, T34N, R3W, Sec. 31 Neal Godby, Fisheries Biologist Environment Weber Lake is a 28.5-acre
NYSDEC LAKE ERIE 2008 ANNUAL REPORT
 New York State Department of Environmental Conservation Division of Fish, Wildlife and Marine Resources NYSDEC LAKE ERIE 28 ANNUAL REPORT to the Lake Erie Committee and the Great Lakes Fishery Commission
LAKE ERIE COLDWATER TASK GROUP
 Members: REPORT OF THE LAKE ERIE COLDWATER TASK GROUP 28 March 218 Tom MacDougall James Markham Jim Boase Jeff Braunscheidel Andy Cook John Deller Chris Eilers Mark Haffley Richard Kraus Chelsea May Chuck
LAKE ERIE WALLEYE TASK GROUP
 Report for 2013 by the LAKE ERIE WALLEYE TASK GROUP March 2014 Prepared by members: Todd Wills James Markham Kevin Kayle Mark Turner Ann Marie Gorman Chris Vandergoot (co-chair) Megan Belore Andy Cook
STUDY PERFORMANCE REPORT
 SUDY PERFORMANCE REPOR State: Michigan Project No.: F-81-R-1 Study No.: 495 itle: Assessment of lake trout populations in Michigan waters of Lake Superior Period Covered: October 1, 1999 to September 3,
SA2 + Div. 3K Redfish
 Fisheries and Oceans Pêches et Océans Canada Canada DFO Science Stock Status Report A2-15(21) entered the fishery in 1975 and averaged about 16,5 t from 1978-1986. The steady reduction in catches from
STUDY PERFORMANCE REPORT
 STUDY PERFORMANCE REPORT State: Michigan Project No.: F-53-R-14 Study No.: 486 Title: Assessment of lake trout populations in Michigan s waters of Lake Michigan. Period Covered: April 1, 1997 to March
Why did the Rogers City fishery change?
 Why did the Rogers City fishery change? A description of the new excellent fishery The potential future for the Swan River egg take station Chair of the MDNR Lake Huron Citizens Fishery Advisory Committee
Great Lakes Coastal Wetland Communities: Vulnerabilities to Climate Change and Response to Adaptation Strategies
 Great Lakes Coastal Wetland Communities: Vulnerabilities to Climate Change and Response to Adaptation Strategies CCAF Wetlands Study Investigators: Susan Doka Fisheries & Oceans, Great Lakes Lab for Fisheries
Status of Yellow Perch in Lake Michigan
 Status of Yellow Perch in Lake Michigan 2016 2017 [Wisconsin DNR biologist Pradeep Hirethota with a nice Lake Michigan perch. This report is published in memory of Pradeep who passed away in December 2017.
Agenda and minutes. Minnesota 1837 Ceded Territory Fisheries Committee January 17, 2018, 10:00 a.m. WebEx
 Agenda and minutes Minnesota 1837 Ceded Territory Fisheries Committee January 17, 2018, 10:00 a.m. WebEx 1. Introductions 2. Review and approve agenda (Action) Agenda was approved 3. Distribute past meeting
Lower Lake Committees Meetings March 27-28, 2018 Hilton Toronto Markham Suites Hotel Markham, Ontario DRAFT AGENDA. Lake Ontario Committee Meeting
 Lower Lake Committees Meetings March 27-28, 2018 Hilton Toronto Markham Suites Hotel Markham, Ontario DRAFT AGENDA Lake Ontario Committee Meeting Tuesday, March 27 10:00 am 1. LOC Introductions - Andy
THE STATE OF LAKE ERIE IN 2009 SPECIAL PUBLICATION
 THE STATE OF LAKE ERIE IN 2009 SPECIAL PUBLICATION 2017-01 The Great Lakes Fishery Commission was established by the Convention on Great Lakes Fisheries between Canada and the United States, which was
Exploring the relationship between native smallmouth bass and invasive mussels in the Huron Erie Corridor
 Exploring the relationship between native smallmouth bass and invasive mussels in the Huron Erie Corridor Nick Popoff Michigan Department of Natural Resources What is a Fishery? Fish Peop le Habitat Fishery
23 March Ontario Ministry of Natural Resources and Forestry. New York Department of Environmental Conservation (Co-Chair)
") Members: REPORT OF THE LAKE ERIE COLDWATER TASK GROUP 23 March 2015 Tom MacDougall James Markham Zy Biesinger Jeff Braunscheidel Andy Cook Kevin Kayle Chuck Murray Kevin Tallon Mark Rogers Tim Sullivan
Members: REPORT OF THE LAKE ERIE COLDWATER TASK GROUP 23 March 2015 Tom MacDougall James Markham Zy Biesinger Jeff Braunscheidel Andy Cook Kevin Kayle Chuck Murray Kevin Tallon Mark Rogers Tim Sullivan
2016 ANNUAL FISH TRAWL SURVEY REPORT
 216 ANNUAL FISH TRAWL SURVEY REPORT The University of Rhode Island Graduate School of Oceanography The Graduate School of Oceanography (GSO) Fish trawl survey began weekly sampling two stations in Narragansett
SOONER LAKE MANAGEMENT PLAN
 SOONER LAKE MANAGEMENT PLAN Background Lake Sooner impounds Greasy Creek, 15 miles south of Ponca City in Noble and Pawnee Counties, Oklahoma (Figure 1). The Grease Creek basin that Sooner Lake impounds
SUMMARY OF CONOWINGO DAM WEST FISH LIFT OPERATIONS 2012
 SUMMARY OF CONOWINGO DAM WEST FISH LIFT OPERATIONS 2012 Michael L. Hendricks Pennsylvania Fish and Boat Commission 1735 Shiloh Rd. State College, Pa 16801 INTRODUCTION The shore-based trapping device at
STUDY PERFORMANCE REPORT
 TUDY PERFORMACE REPORT tate: Michigan Project o.: F-81-R-6 tudy o.: 23495 Title: Assessment of lake trout populations in Michigan waters of Lake uperior Period Covered: October 1, 24 to eptember 3, 25
Impacts of Aquatic Invasive Species on the Lake Superior Fishery. by Jeff Gunderson Minnesota Sea Grant Program
 Impacts of Aquatic Invasive Species on the Lake Superior Fishery by Jeff Gunderson Minnesota Sea Grant Program Can humans really impact the fishery of such a large waterbody? Lake Superior Fishery Change
Atlantic States Marine Fisheries Commission
 Atlantic States Marine Fisheries Commission 1050 N. Highland Street Suite 200A-N Arlington, VA 22201 703.842.0740 703.842.0741 (fax) www.asmfc.org MEMORANDUM To: From: Subject: January 18, 2018 South Atlantic
Cedar Lake Comprehensive Survey Report Steve Hogler and Steve Surendonk WDNR-Mishicot
 Cedar Lake- 2006 Comprehensive Survey Report Steve Hogler and Steve Surendonk WDNR-Mishicot ABSTRACT Cedar Lake is a 142 acre lake located in the southwest corner of Manitowoc County. It is a seepage lake
Hydroacoustic Analysis of Fish Populations in Copco and Iron Gate Reservoirs, California
 Hydroacoustic Analysis of Fish Populations in Copco and Iron Gate Reservoirs, California Prepared for: PacifiCorp Portland, Oregon Prepared by: J.M. Eilers and B.J. Eilers MaxDepth Aquatics, Inc. Bend,
Zooplankton community structure in the northern Gulf of Mexico: Implications for ecosystem management
 Zooplankton community structure in the northern Gulf of Mexico: Implications for ecosystem management By Andrew F. Millett Dauphin Island Sea Lab University of South Alabama W. Monty Graham, Glenn A. Zapfe,
Quemahoning Reservoir
 Pennsylvania Fish & Boat Commission Biologist Report Quemahoning Reservoir Somerset County May 2011 Trap Net, Gill Net and Electrofishing Survey Quemahoning Reservoir is an 899 acre impoundment located
LAKE ERIE WALLEYE TASK GROUP
 Report for 2017 by the LAKE ERIE WALLEYE TASK GROUP March 2018 Prepared by members: Todd Wills (co-chair) Jason Robinson Matt Faust Ann Marie Gorman Megan Belore Andy Cook Stephen Marklevitz (co-chair)
SKIATOOK LAKE MANAGEMENT PLAN
 SKIATOOK LAKE MANAGEMENT PLAN Background Skiatook Lake impounds Hominy Creek, 5 miles west of Skiatook in Osage County, Oklahoma (Figure 1). Skiatook Lake covers 10,540 surface acres and was constructed
Minnesota Department of Natural Resources Division of Fish and Wildlife Section of Fisheries. Stream Survey Report. Three Mile Creek 2011
 Minnesota Department of Natural Resources Division of Fish and Wildlife Section of Fisheries Stream Survey Report Three Mile Creek 2011 By Joseph D. Stewig Montrose Area Fisheries Office TABLE OF CONTENTS
2015 Winnebago System Walleye Report
 215 Winnebago System Walleye Report Adam Nickel, Winnebago Gamefish Biologist, March 216 As winter passes in the rear view mirror, it won t be long until the spring rush of the 216 walleye run is here.
Fall Walleye Index Netting at Jackson Lake, Alberta, 2010
 , 2010 Fisheries Management Lac La Biche Senior Fisheries Biologist(s): Dwayne Latty, Cold Lake Data Summary and Report by: Eric Hegerat, Fisheries Technician, Lac La Biche; Rebecca Skarsen, Fisheries
Diadromous Fish Assemblage Assessment in the Saco River Estuary, ME
 Diadromous Fish Assemblage Assessment in the Saco River Estuary, ME Kayla Smith James Sulikowski, Ph.D. and Carrie Byron, Ph.D. Dept of Marine Sciences Saco River Estuary Nursery ground Foraging stop-over
Co-operative Freshwater Ecology Unit 2004 Program
 Co-operative Freshwater Ecology Unit 2004 Program Nordic Fish Survey (2003 + 2004) A survey of fish communities present in 25 Sudbury lakes was performed using the international standard Nordic Method.
23 March Pennsylvania Fish and Boat Commission. Department of Fisheries and Oceans, Canada
 REPORT OF THE LAKE ERIE COLDWATER TASK GROUP 3 March 9 Members: James Markham Larry Witzel Andy Cook John Fitzsimons Jim Francis Kevin Kayle Tom MacDougall Chuck Murray Fraser Neave Jeff Slade Martin Stapanian
Fish Conservation and Management
 Fish Conservation and Management CONS 486 Managing biotic communities Gardening, poisoning, and shocking what would PETA think? Chapter 10 Ross Managing biotic communities Topics Organism additions Organism
Status of Lake St. Clair Submerged Plants, Fish Community, and Sport Fishery
 Michigan Department of Natural Resources Fisheries Research Report 20 Status of Lake St. Clair Submerged Plants, Fish Community, and Sport Fishery Michael V. Thomas and Robert C. Haas Michigan Department
Public Input to St. Lawrence River Fisheries Community Objectives
 Public Input to St. Lawrence River Fisheries Community Objectives Tommy L. Brown, Human Dimensions Research Unit, Cornell University Steven R. LaPan, New York State Department of Environmental Conservation,
Geology. Key Factors. Overfishing. Great Lakes Fishes. Historical Fishing. About 10,000 years since last glacial retreat very young ecologically
 Great Lakes Fishes Geology About 10,000 years since last glacial retreat very young ecologically Largest surface freshwater system on earth 21% of world s supply 84% of North America s supply Five unique
STUDY PERFORMANCE REPORT
 STUDY PERFORMANCE REPORT State: Michigan Project No.: F-81-R-3 Study No.: 491 Title: Evaluation of lake sturgeon Acipenser fulvescens populations in the St. Clair River and Lake St. Clair Period Covered:
Assessment Summary Report Gulf of Mexico Red Snapper SEDAR 7
 Assessment Summary Report Gulf of Mexico Red Snapper SEDAR 7 Stock Distribution: Red snapper are found throughout the Gulf of Mexico, the Caribbean Sea, and from the U.S. Atlantic Coast to northern South
Minnesota Department of Natural Resources. Jodie Hirsch- Division of Ecological and Water Resources David Staples- Division of Fish and Wildlife
 Zooplankton Community Changes in Mille Lacs Lake, Minnesota after Zebra Mussel (Dreissena polymorpha) and Spiny Waterflea (Bythotrephes longimanus) Infestations Minnesota Department of Natural Resources
Crooked Lake Oakland County (T4N, R9E, Sections 3, 4, 9) Surveyed May James T. Francis
 Surveyed May James T. Francis") Michigan Department of Natural Resources Status of the Fishery Resource Report No. 2004-1, 2004 Crooked Lake Oakland County (T4N, R9E, Sections 3, 4, 9) Surveyed May 2002 James T. Francis Environment Crooked
Michigan Department of Natural Resources Status of the Fishery Resource Report No. 2004-1, 2004 Crooked Lake Oakland County (T4N, R9E, Sections 3, 4, 9) Surveyed May 2002 James T. Francis Environment Crooked
Life Beyond the Spawning Grounds: Distribution & Food Web Relations of Herring & Forage Fishes in Puget Sound
 Life Beyond the Spawning Grounds: Distribution & Food Web Relations of Herring & Forage Fishes in Puget Sound Dave Beauchamp, USGS & UW-SAFS Liz Duffy, UW-SAFS (NRDC) Iris Kemp, UW-SAFS Collaborators:
Fall Walleye Index Netting at Blackett Lake, Alberta, 2010
 , 2010 Fisheries Management Lac La Biche Senior Fisheries Biologist(s): Dwayne Latty, Cold Lake Data Summary and Report by: Eric Hegerat, Fisheries Technician, Lac La Biche; Rebecca Skarsen, Fisheries
Baltic Stock Advice. 14 May John Simmonds ICES ACOM Vice Chair
 Baltic Stock Advice 14 May 2013 John Simmonds ICES ACOM Vice Chair Overview Basis of Stock Status Stocks Cod Flatfish (plaice dab, flounder, brill and turbot) Pelagics (herring and sprat) Salmon and trout