FOR. Prepared October 20, 2006 by the Atlantic States Marine Fisheries Commission's Northern Shrimp Technical Committee
|
|
|
- Hope Fowler
- 5 years ago
- Views:
Transcription
 Josef Idoine, (NMFS NEFSC) Dr.")
1 ASSESSMENT REPORT FOR GULF OF MAINE NORTHERN SHRIMP Prepared October 2, 26 by the Atlantic States Marine Fisheries Commission's Northern Shrimp Technical Committee Robert Glenn, (Massachusetts) Margaret Hunter, Chair (Maine) Josef Idoine, (NMFS NEFSC) Dr. Clare McBane, (New Hampshire) Braddock Spear (ASMFC) INTRODUCTION Biological Characteristics Distribution of adult female northern shrimp, from Ecosystem Relationships in the Gulf of Maine-Combined Expert Knowledge of Fishermen and Scientists. NAMA collaborative report 1:1-16, 26. Northern shrimp (Pandalus borealis) are hermaphroditic, maturing first as males at roughly 2½ years of age and then transforming to females at roughly 3½ years of age. In the Gulf of Maine, spawning takes place in offshore waters beginning in late July. By early fall, most adult females extrude their eggs onto the abdomen. Egg bearing females move inshore in late autumn and winter, where the eggs hatch. Juveniles remain in coastal waters for a year or more before migrating to deeper offshore waters, where they mature as males. The exact extent
2 and location of these migrations is variable and unpredictable. The males pass through a series of transitional stages before maturing as females. Some females may survive to repeat the spawning process in succeeding years. The females are the individuals targeted in the Gulf of Maine fishery. Natural mortality seems to be most pronounced immediately following hatching, and it is believed that most shrimp do not live past age 5. Fishery Management The Gulf of Maine fishery for northern shrimp is managed through interstate agreement between the states of Maine, New Hampshire and Massachusetts. The management framework evolved during under the auspices of the State/Federal Fisheries Management Program. In 198, this program was restructured as the Interstate Fisheries Management Program (ISFMP) of the Atlantic States Marine Fisheries Commission (ASMFC). The Fishery Management Plan (FMP) for Northern Shrimp was approved under the ISFMP in October 1986 (FMR No. 9., ASMFC). The full Commission in May 24 approved Amendment 1 to the FMP (FMR No. 42). Amendment 1, which entirely replaces the original FMP, establishes biological reference points for the first time in the shrimp fishery and expands the tools available to manage the fishery. Any new tools proposed to manage the shrimp fishery must be implemented through the ASMFC addendum process. Within the ISFMP structure, the Northern Shrimp Technical Committee (NSTC) provides annual stock assessments and related information to the ASMFC Northern Shrimp Section. Annually, the Section decides on management regimes after thorough consideration of the NSTC stock assessment, input from the Northern Shrimp Advisory Panel, and comment from others knowledgeable about the shrimp fishing industry. Management under the 1986 FMP was conducted primarily by seasonal closures and mesh size restrictions and was intended to optimize yield, recognizing that natural fluctuations in abundance will occur (FMP, p ii.). The goal of Amendment 1 is to manage the northern shrimp fishery in a manner that is biologically, economically, and socially sound, while protecting the resource, its users, and opportunities for participation by all stakeholders. 2
3 At its Fall 25 meeting, the Northern Shrimp Section approved a 14-day season: December 12, 25, through April 3, 26, inclusive. This will be referred to as the 26 season throughout this document. In addition, it continued to require the use of a finfish excluder device known as the "Nordmore Grate" throughout the shrimp fishing season. The Section also maintained the requirement that made it unlawful to use mechanical shaking devices to cull, grade, or separate catches of shrimp. The Section also made a commitment to set the 27 season for 14 days, provided certain triggers were not exceeded. The Section will reconsider the 27 fishing season length if, during the 26 fishing season: the number of fishing trips exceeds 5,6 landings exceed 5,2 metric tons, or fishing mortality exceeds.2. Fishery Assessment Stock assessments conducted since the 198 s have keyed on strong year classes, (i.e. those hatched in 1982, 1987, 1992, and 21). Each strong year class supports the shrimp fishery for about three years commencing about three years after hatching. The fishery was supported during the late 198s and early and mid 199s by the strong 1982, 1987 and 1992 year classes with other years depending on less robust year classes. The 1993 year class proved to be strong also, producing the first back-to-back strong year classes since the late 196 s. Based on the abundance of the 1992 and 1993 year classes, the NSTC recommended a full season for 1996, but recommended reductions in fishing effort for December, April and May for the 1997 fishery to afford some protection for small shrimp in the offshore areas. The NSTC recommended limiting the fishery to February and March for the 1998 season and a 4-day season during the months of February and March in 1999 to protect the berried females and young shrimp in light of a rapidly declining resource. The NSTC recommended two options for the 2 fishing season: 1) closed season; 2) open February 14-March 18 or February 16 - March 14 and May Due to an increase in the exploitable biomass in the 21 season, the Committee recommended a modest increase in landings and a corresponding extension of the season to 61 days. In 21, however, the low numbers of large shrimp, the lack of new recruits, and the presence of a single year class of 3
4 medium sized shrimp led the committee to advise that no fishing be conducted in the 22 season. In 22, the committee recommended no fishing season that would threaten the reproductive capacity of the 1999 year class or would allow significant catches of the 21 year class. Again, in 23 it advised no fishing season to protect the 21 year class and allow the depressed stock to recover. The Committee took a different approach in 24 with regard to its recommendations for the fishery. Instead of recommending a specific season length, it recommended maintaining a target fishing mortality rate below F=.22. In combination, it strongly urged the Section to craft a season that would not permit landings of more than 2,5 metric tons. This approach was well received by the Advisory Panel and Section and was repeated in 25, when the Committee recommended that 26 shrimp landings should be less than 5,2 metric tons. The following report presents the results of the Technical Committee's 26 stock assessment. Analyses and recommendations are based on: 1) research vessel survey data collected by the Committee during summer and by the Northeast Fisheries Science Center (NEFSC) during spring and autumn, 2) past commercial landings data collected by the National Marine Fisheries Service (NMFS) port agents, 3) biological sampling of the commercial landings by personnel from the participating states and the NMFS, and 4) data from vessel trip reports filed by shrimp fishers. In addition to previously used traditional methods of assessing the stock (i.e. landings data, commercial effort and CPUE estimates, indices of abundance, etc.), more innovative, quantitative tools, such as the Collie-Sissenwine Analysis, ASPIC surplus production, yield per recruit, and eggs per recruit models were introduced in 1997 and continue to be used to provide guidance for management of the stock. COMMERCIAL FISHERY TRENDS Landings Annual landings of Gulf of Maine northern shrimp declined from an average of 11,4 metric tons (mt) during to about 4 mt in 1977, culminating in a closure of the fishery in 1978 (Table 1). The fishery reopened in 1979 and landings increased steadily to over 5, mt 4
5 by Landings ranged from 2,3-4,4 mt during , and then rose dramatically to 9,2 mt in 1996, the highest since Landings declined between 1996 and 1999 to 1,816 mt. This was followed by a slight increase to 2,39 mt in the 2 season. The 21 fishing season landings dropped to 1,329 mt, and dropped further in the 25-day 22 season to 424 mt, the lowest northern shrimp landings since the fishery was closed in Landings in the day season were 1,211 mt, with 1,949 mt in a 4-day season in 24 and 2,553 mt (updated, but still preliminary data) in a 7-day season in 25. Landings in the 14-day season in 26 were 1,877 mt. (preliminary data), (Table 1a and Figure 1a). Maine landed 87% (2,215 mt) of the 25 season total while New Hampshire and Massachusetts landed 11% (29 mt) and 2% (49 mt), respectively (updated, but still preliminary data). Maine landed 94% (1,763 mt) of the 26 season total while New Hampshire and Massachusetts landed 5% (89 mt) and 1% (25 mt), respectively (preliminary data). The proportional distribution of landings among the states was similar to 23-25, but has shifted gradually since the 198 s when Massachusetts accounted for about 3% of the catch, (Table 1a and Figure 1a). The relative proportion of landings by month remained generally similar to past years. The month of February (28 open days) yielded the highest proportion of the catch and the greatest catch per open day. April 26 (3 open days) exhibited the lowest proportion of the catch and the lowest catch per open day, followed by the 2 open days in December 25 (Figure 1b and Table 2a). Most northern shrimp fishing in the Gulf of Maine is conducted by otter trawls, although traps are also employed off the central Maine coast. According to Vessel Trip Reports (VTRs), trappers accounted for 4 to 18% of Maine s landings in 21 to 25 (preliminary data), and 11% (preliminary data) in 26 (Table 2b). Size, Sex, and Maturity Stage Composition of Landings Size composition data (Figures 2-4), collected since the early 198's, indicate that trends in landings have been determined primarily by recruitment of strong (dominant) year classes. Landings more than tripled with recruitment of a strong 1982 year class in 1985 and The 5
6 1987 season landings of 5,253 mt (Table 1) were supported in large part by mature females (assumed age 5) from this year class. Landings declined sharply in 1988 with the passage of this year class through the fishery. A strong 1987 year class began to recruit to the fishery in spring of 1989 and was a major contributor to the fisheries (NSTC Assessment Reports, ). The 1992 year class was the first year class of notable size since 1987 and began recruiting to the fishery in March and April The 1992 year class was supplemented by a moderate sized 1993 year class, which partially supported the relatively large annual landings in 1995, 1996 and The early months of the 1998 season showed high catches from the last of the 1993 year class coming ashore as second year females. Landings were low in the 1999 season due to very poor recruitment in 1994 and 1995, and moderate recruitment in The increase in landings observed in 2 was dominated by first year berried females from the 1996 year class. The poor landings observed in 21 were composed primarily of egg-bearing females landed early in the season, and males caught in January, March, and April, the males accounting for approximately 3% of the catch during these months and representing the 1999 year class. This catch profile is indicative of the poor recruitment of the 1997 and 1998 year classes. In the 22 fishery, the 1997 and 1998 year classes (4- and 5- year old females) continued to be weak, the moderate 1999 year class (3-year old males, transitionals, and earlymaturing females) dominated the catches, and noticeable quantities of presumed 1-year-old shrimp (21 year class) were caught. 23 catches were composed primarily of 4-year-old females from the 1999 year class, early-maturing 2-year-old females (carrying what appeared to be viable eggs) and 2-year-old juveniles, males, and transitionals. 24 catches were composed primarily of egg-bearing, early-maturing, presumed 3-year-old females from the 21 year class and a few larger females probably from the 1999 year class. 25 season catches were composed primarily of egg-bearing females and female II s from the presumed 21 year class, and males, probably from the 23 year class (Figures 2-4). Catches in 26 were composed primarily of egg bearing and female II s, probably from the strong 21 year class. Catches in March and April had significant numbers of smaller shrimp, presumably from the 23 (transitionals and female I s) and 24 (juveniles and males) year classes (Figures 2 and 3). Maine trappers produced a smaller proportion of small shrimp in the landed catch than trawls, and generally were more apt to catch large females after egg hatch, as 6
7 in previous years (Figure 2). See the table below for average counts per pound by month and gear. 26 commercial shrimp fishery average counts per pound, from port samples Pandalus borealis only All shrimp species Dec. Jan. Feb. Mar. Apr. Dec. Jan. Feb. Mar. Apr. Maine trawls Maine traps no samples no samples Maine total Massachusetts no samples no samples New Hampshire Spatial and temporal differences in the timing of egg-hatch can be estimated by noting the relative abundance of ovigerous females to females that have borne eggs in the past but are no longer carrying them (female stage II). According to port samples, in December 25, in Maine, only 1.% of the trawled catch was female stage II, but for the month of January 26, this increased to 5.2% and for the month of February it increased to 27.%. In March female stage IIs further increased to 38.8%, but in April declined to 35.9% when the proportion of males, transitionals, and females Is in catches increased. Maine trappers caught 1.4% female stage II in January, 42.8% in February, 94.1% in March and 1% in April, consistently higher than the trawl catches each month (Figure 2). Maine trap catches also contained fewer small (males and transitionals < 24 mm) P. borealis than trawl catches (Figure 2). In Massachusetts and New Hampshire trawl catch samples combined, the percentage of female stage II shrimp was 2.9% in December 25, 32.9% in January 26, 7.6% in February, 55.4% in March and 56.4% in April (Figure 3), possibly reflecting the eastern Gulf lagging the west in the timing of egg hatch. As the 26 season progressed, all states showed a reduction in females carrying eggs with no eggs being carried in April. Discards Reports from port samplers indicate that discarding small shrimp at sea was not common in 26. However, there were reports of a few catches being dumped because of a lack of buyers. Because of the lack of detailed information, discarding is ignored in this assessment. 7
8 Black Gill Syndrome Shrimp collected during routine port-sampling in Maine in 23 exhibited a high incidence (greater than 7%) of Black Gill Syndrome, also called Black Gill Disease or Black Spot Syndrome. Affected shrimp displayed melanized, or blackened gills, with inflammation, necrosis, and significant loss of gill filaments. Black Gill Syndrome has also been documented recently in white shrimp in South Carolina ( and in the Gulf of Maine in the 196s and 197s (Apollonio and Dunton, 1969; Rinaldo & Yevitch, 1974). Its etiology is unknown, although fungal and ciliated protist parasites have been implicated. In samples collected in Maine during the 24, 25 and 26 fisheries, the incidence of Black Gill Syndrome was much lower, and detected cases were much less severe, than in 23. Effort and Distribution of Effort Since the late 197's, effort in the fishery (measured by numbers of trips in which shrimp gear is used) has increased and then declined on two occasions. The total number of trawl trips in the fishery peaked at 12,285 during the 1987 season (Table 3a, Figure 5). Increases in season length, shrimp abundance, and record ex-vessel prices, coupled with reduced abundance of groundfish all contributed to this increase. Effort subsequently fell to an average of 9,5 trips for the 1988, 1989, and 199 seasons, fell further to an average of 7,9 trips in the 1991 and 1992 seasons, and declined to 6, trips in the 1994 season. Effort nearly doubled between 1994 and 1996 and then declined again from the 1996 level of 11,791 to 3,811 trips in 1999, 3,335 in 2, 3,599 in 21, 1,1 in 22, 2,157 in 23, 2,277 in 24, 3,91 in 25 (preliminary) and 1,646 in 26 (preliminary) (Table 3a). The number of vessels participating in the fishery in recent years has varied from a high of 31 in 1997 to a low of 119 (preliminary) in 26. Year Vessels Year Vessels * * *preliminary
9 In 26, there were 6 vessels from Massachusetts, 12 from Maine, and 11 from New Hampshire, for a preliminary total of 119. Of these, 48 of the Maine boats were trapping. Maine trapping operations accounted for 4% to 8% of the state's total number of trips from 1987 to According to vessel trip reports (VTRs), trapping made up 17% to 28% of trips during 21-24, and 25% (preliminary) and 3% (preliminary) in 25 and 26, respectively (Table 3b). Prior to 1994, effort (numbers of trips by state and month) was estimated from landings data collected from dealers, and landings per trip information (LPUE) from dockside interviews of vessel captains: Landings Effort = LPUE Beginning in the spring of 1994, a vessel trip reporting system (VTR) supplemented the collection of effort information from interviews. From 1995 to 2, landings per trip (LPUE) from these logbooks were expanded to total landings from the dealer weighouts to estimate the total trips: Total. Landings Total. Trips = VTR. Trips VTR. Landings Since 2, VTR landings have exceeded dealer weighout landings, and the above expansion is not necessary. However, VTRs for 25 and 26 are still being received and processed. The vessel logbook database is currently incomplete and has not been thoroughly audited (for an evaluation of vessel trip report data see NEFSC 1996). Therefore, landings and effort estimates reported here for recent years should be considered extremely preliminary. The 1996 assessment report (Schick et al. 1996) provides a comparison of 1995 shrimp catch and effort data from both the NEFSC interview and logbook systems and addresses the differences between the systems at that time. It showed a slightly larger estimate from the logbook system than from the interview system. Thus effort statistics reported through 1994 are not directly comparable to those collected after However, patterns in effort can be examined if the difference between the systems is taken into account. An additional complication of the logbook system is that one portion of the shrimp fishery may not be adequately represented by the logbook system during Smaller vessels fishing exclusively in Maine coastal waters are not required to have federal groundfish permits and were not required to submit shrimp vessel trip reports until 2. 9
10 In the assessments, effort from unpermitted vessels was characterized by catch per unit effort of permitted vessels. Seasonal trends in distribution of trawl effort can be evaluated from port interview data. The relative magnitude of offshore fishing effort (deeper than 55 fathoms) has varied, reflecting seasonal movements of mature females (inshore in early winter and offshore following larval hatching), but also reflecting harvesters choices for fishing on concentrations of shrimp. In 24, a season which was conducted only from mid-january to mid-march, 1% of fishing trips in Massachusetts and New Hampshire were inshore, according to 16 port interviews. In Maine, 85% were inshore, based on 93 port interviews. During the 25 season, 56% of the 25 sampled trips from Massachusetts and New Hampshire were inshore, while in Maine, most trips in December were offshore (9%) but increasingly inshore through the season, with 89% inshore in March. In the 26 season, trips were generally offshore in December and April, inshore during January and February, and about 5% inshore in March, based on a total of 13 trawler interviews. Catch per Unit Effort Catch per unit effort (CPUE) indices have been developed from NMFS interview data ( ) and logbook data ( ) and are measures of resource abundance and availability. (See table below and Figure 5). They are typically measured in catch per hour or catch per trip. A trip is a less precise measure of effort, because trips from interviews and logbooks include both single day trips and multiple day trips (in the spring), and the proportion of such trips can vary from season to season. Pounds landed per trip increased from 844 pounds in 1983 to over 1,3 pounds in 1985 when the strong 1982 year class entered the fishery. CPUE subsequently dropped to below 75 pounds/trip in 1988 but increased to 1,53 pounds in 199 with entry of the strong 1987 year class. This index averaged 98 pounds between , declined to 767 pounds in 1993, and increased in 1994 to 1,73 pounds. The CPUEs, from logbooks, averaged 1,393 pounds. In 21, the catch per trip dropped to 74 pounds per trip, the lowest since 1988, and remained low, at 831 pounds, in 22. In 23, the catch per trip was 1,29 pounds, and in 24 1
11 it was 1,821 pounds per trip, one of the highest values in the past 3 years. In 25 it was 1,541 (preliminary) and in 26 it was 2,252 pounds per trip (preliminary), the highest in the time series (Figure 5 and table below). More precise CPUE indices (pounds landed per hour fished) have also been developed for both inshore (depth less than 55 fathoms) and offshore (depth more than 55 fathoms) areas using information collected by Maine's port sampling program, and agree well with the (less precise) catch per trip data from logbooks (see table below and Figure 5). Inshore CPUE for 26 was 572 lbs/hr, offshore was 345 lbs/hr, and the season average was 499 lbs/hr, all time-series highs. Catch per trip, though high, did not improve as much as catch per hour, probably because trips were short. Port samplers report that shrimp trawlers sometimes came in after one good tow, because of poor market demand. Maine CPUE in lbs./hour towed, from port sampling. Catch in lbs./trip is from NMFS weighout and logbook data for trawl catches for all states. Year Maine pounds per hour towing Pounds/trip Inshore (<55F) Offshore (>55F) Combined , , , , , , , , , , ,252 11
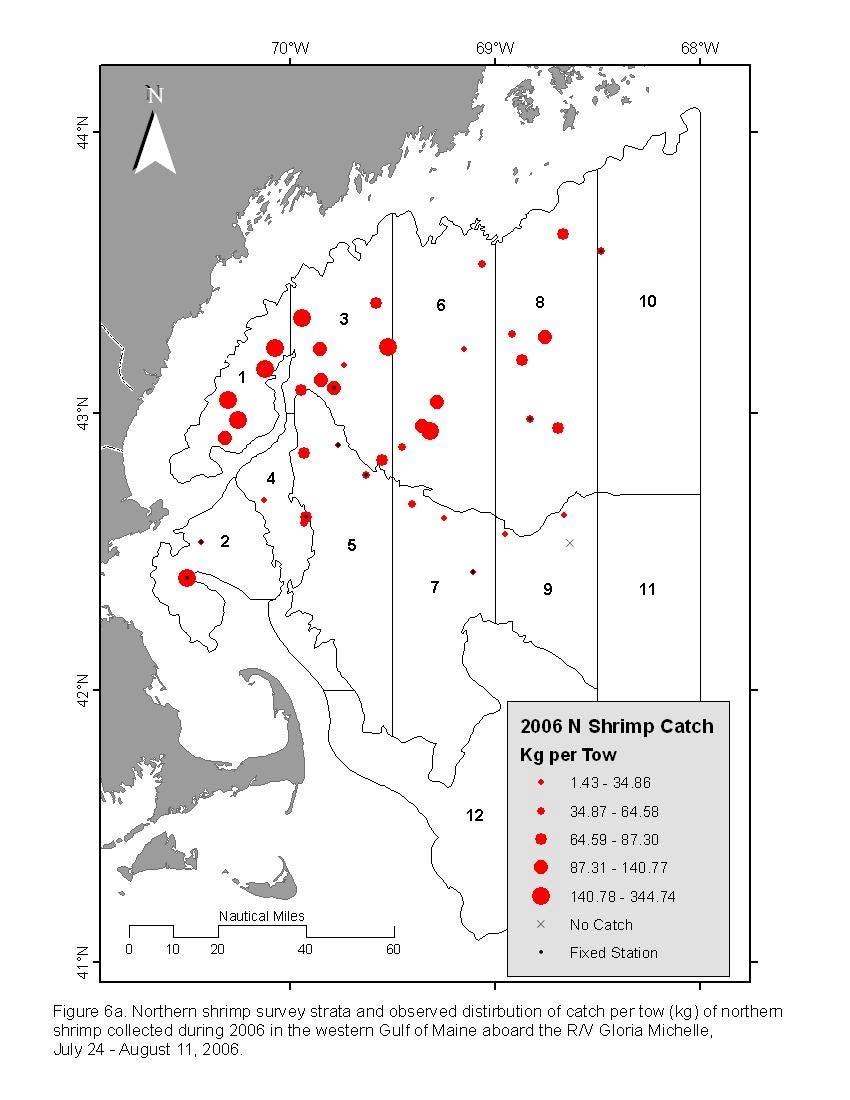
12 RESOURCE CONDITIONS Trends in abundance have been monitored since the late 196's from data collected in Northeast Fisheries Science Center (NEFSC) spring and autumn bottom trawl surveys and in summer surveys by the State of Maine (discontinued in 1983). A state-federal shrimp survey was initiated by the NSTC in The latter survey is conducted each summer aboard the R/V Gloria Michelle employing a stratified random sampling design and gear specifically designed for Gulf of Maine conditions. The NSTC has placed primary dependence on the summer survey for fishery-independent data used in stock assessments, although NEFSC autumn survey data have been valuable as well. There has generally been good agreement (r =.62) between the NEFSC autumn survey index (Figure 6b and Table 6, stratified mean catch per tow, kg) and fishery trends (Figure 7). This index was at all time highs at the beginning of the time series in the late 196 s and early 197 s when the Gulf of Maine Northern shrimp stock was at or near virgin levels. In the late 197 s the index declined precipitously as the fishery collapsed; this was followed by a substantial increase in the middle 198 s to early 199 s, with peaks in 1986, 199 and This reflects recruitment and growth of the strong 1982, 1987 and 1992 year classes and the above average 1993 year class. After declining to 1.1 kg/tow in 1996, the index rose sharply in 1998 and 1999 to 2.3 and 2.54 kg per tow respectively, both well above the time series mean of 1.51 kg/tow. This is likely due to recruitment of the 1996 year class to the survey gear at age 2 in 1998 and age 3 in Beginning in 2 the fall survey index declined precipitously for three consecutive years reaching a time series low of.17 kg/tow in 22, indicating very poor 1997, 1998, and 2 year classes. Since 22, the index has generally increased reaching 2.77 kg/tow in 26, the highest value observed since The improved fall survey indices observed since 22 are indicative of robust 21, 23, and 24 year classes. Abundance and biomass indices (stratified mean catch per tow in numbers and weight) for the state-federal summer survey from are given in Table 4 and Figures 6a and 8, and length-frequencies by year are provided in Figure 9. The log e transformed mean weight per tow averaged 15.8 kg/tow between 1984 and 199. Beginning in 1991 this index began to decline 12
13 and averaged 1.2 kg/tow between 1991 and The index then declined further, averaging 6.1 kg/tow from 1997 to 21, and reaching a time series low of 4.3 kg/tow in 21. In 22 the index increased to 9.2 kg/tow, and then declined to the second lowest value in the time series (5.5 kg/tow) in 23. Since 23, the index has increased markedly, reaching new time series highs in both 25 (23.3 kg/tow) and 26 (66. kg/tow) respectively. The total mean number per tow demonstrated the same general trends over the time series. The stratified mean catch per tow in numbers of 1.5-year old shrimp (Table 4, Figure 8, and graphically represented as the total number in the first size modes in Figure 9) represents a recruitment index. Although these shrimp are not fully recruited to the survey gear, this index appears sufficient as a preliminary estimate of year class strength. This survey index indicated strong year classes in 1987, 1992, and 21, and moderately strong year classes in 199, 1993, 1996, and The strong 1992 year class observed at (assumed) age 1.5 in the 1993 summer survey (Figure 9) was smaller than the dominant 1982 and 1987 year classes, but was followed by the above-average 1993 year class. These two year classes supported the fishery in The 1996 year class appeared comparable to the moderately strong 1993 year class (Table 4, Figures 8 and 9). The 1997 and 1998 age classes were very weak, both well below the time series mean of 343 individuals per tow. The above-average 1999 year class was comparable to the 1996 year class. In 21 the age 1.5 recruitment index was at its lowest level since 1984, with a stratified mean of 18 individuals per tow on the transformed scale, representing recruitment failure of the 2 year class. In 22 the age 1.5 recruitment index increased dramatically to 1,164, which was the time series high and represents an extremely strong 21 year class. It is interesting to note that, in the 22 summer survey, more small females (< 19 mm CL, assumed 1.5 years old) were caught than at any other time in the history of the survey (Figure 9). The index subsequently dropped to 11 individuals per tow in 23, indicating a very poor 22 year class, the worst in the time series. The index increased in 24 to 286 individuals per tow, and reached a time series high in 25 (1,753 individuals per tow). This is indicative of a moderate 23 year class and a very strong 24 year class. The 26 index dropped to (423 individuals per tow) indicating a moderate 25 year class. 13
14 The record 21 year class appeared in a greatly diminished state in the 23 survey, yet stabilized in the 24 and 25 surveys. The re-appearance of the 21 year class as indicated by the increased abundance of presumed 3.5 year old shrimp in the 24 summer survey, is evidence that the distribution of shrimp in the summer of 23 made them largely unavailable to the summer survey that year. This also supports anecdotal reports that shrimp stayed inshore in 23, in areas not visited by the survey. It is not so clear why the 21 year class appeared to increase again in abundance between 24 and 25 (Figure 9, rightmost mode in 24 and 25 surveys). The virtually absent 22 year class first observed in the 23 survey remained very weak in the 24 and 25 surveys, however. Individuals >22 mm will be fully recruited to the upcoming winter fishery (primarily age 3 and older) and thus survey catches of shrimp in this size category provide indices of harvestable numbers and biomass for the coming season. (Table 4, bottom, and Figure 8). The harvestable biomass index exhibited large peaks in 1985 and 199, reflecting the very strong 1982 and 1987 year classes respectively. This index has varied from year to year but generally trended down until 24. The 21 index of 1.5 kg/tow represented a time series low, and is indicative of poor 1997 and 1998 year classes. In 22 the index increased slightly to 2.9 kg/tow, reflecting recruitment of the moderate 1999 year class to the index. The index subsequently dropped to the second lowest value in the time series (1.7 kg/tow) in 23. Since 23, the fully recruited index has increased dramatically reaching a time series high in 26 (28.8 kg/tow). This increase may be related to the continued dominance of the record 21 year class, some of which may have survived into the summer of 26, and to an unexplained increase in the number of female stage 1 shrimp (Figure 9), probably the 23 year class. The committee notes that the 26 summer survey indices are based on 29 tows, compared with about 4 tows in previous years (Table 4). 14
15 ANALYTICAL STOCK ASSESSMENT Descriptive information for the Gulf of Maine shrimp fishery (total catch, port sampling, trawl selectivity, survey catches, and life history studies) were modeled to estimate fishing mortality, stock abundance, and candidate target fishing levels. The analytical stock assessment comprises three fishery models: the Collie-Sissenwine Analysis (CSA) (Collie and Sissenwine 1983; Collie and Kruse 1998) tracks the removals of shrimp using summer survey indices of recruits and fully-recruited shrimp scaled to total catch in numbers; surplus production analysis models the biomass dynamics of the stock with a longer time series of total landings and three survey indices of stock biomass; a yield-per-recruit and eggs-per-recruit model simulates the life history of shrimp (including growth rates, transition rates, natural mortality, and fecundity) and fishing mortality on recruited shrimp using estimates of trawl selectivity to estimate yield and egg production at various levels of fishing mortality, for guidance in determining the levels of fishing that are most productive and sustainable. CSA results are summarized in Table 5 and Figures 1 and 11. Abundance and catchability were relatively well estimated, and the model fit the data well. Estimates of recruitment to the fishery averaged.7 billion individuals, peaked at.8 billion before the 1989 and 199 fishing seasons, fell to.4 billion before the 1992 and 1993 seasons, and rose to.9 billion before the 1995 and 1996 fishing seasons, then declined steadily to less than.3 billion before the 22 fishing season. The current estimate, 6.3 billion (4.3 in 26), is the highest seen (from 1984 through 27). Fully-recruited abundance averaged 1. billion individuals and peaked at 1.1 billion before the 1991 season. Since that point, fully-recruited abundance declined steadily to.3 billion before 21, and then increased to 4.1 (1.1 in 26) billion in the current year. Total stock biomass estimates averaged about 14, mt, with a peak at 16, mt before the 1991 season, and a decrease to a time series low of 4,4 mt in 21. Total stock biomass has increased over recent years to its current value of 71,5 (32,1 in 26) mt (Table 5, Figures 1, 11). The recent two years of high abundance and low F are due, in part, to the same years of observed very high survey catches and very low reported landings that have leveraged those estimates to account for those observations. Since 22, both fall and summer survey indices have been increasing, and the reported landings have declined steadily since the mid-199s. 15
16 In this assessment, fishing mortality rates (F) are being expressed as harvest rate derived F s. This is based on advice by the most recent peer review of Northern shrimp assessment methodology (NEFSC, 23), which concluded that the harvest rate F is a more precise approximation than the log-ratio F used in previous assessments. Annual estimates of fishing mortality (F) averaged.25 (19% exploitation) for the 1985 to 1994 fishing seasons, peaked at 1.6 (57% exploitation) in the 1997 season and decreased to.3 (22% exploitation) in the 21 season (Table 5; Figures 1, 11). In 22 F dropped to.8 (7% exploitation), due in part to a short season and poor stock conditions. Continued poor stock conditions (in terms of exploitable shrimp) along with an exceptional recruitment pulse resulted in F rising to.23 (18% exploitation) in 24. The 26 estimate of F is.3 (3% exploitation). Recent patterns in F reflect the pattern in nominal fishing effort (Tables 3 and 5, Figures 5 and 1). Precision of CSA estimates was assessed by bootstrap analysis, in which survey measurement errors were randomly shuffled 2 times to provide simulated replications of the model. Bootstrap results suggest that estimates of abundance, biomass and mortality were relatively precise. Because of a lack of detailed information about discards, there were no analyses of discarding for this assessment. An alternative method of estimating stock size and F was used to corroborate results from CSA analysis. A surplus production model (ASPIC) was fit to seasonal catch and survey biomass indices from 1968 to 26 (summarized in Table 6). F in 26 (F =.9) is below the fishing mortality target/threshold (F =.22) established in Amendment 1 to the northern shrimp Fishery Management Plan. The 26 starting biomass (19,62 mt) was at its highest level since 1995, and is above the average observed in the time period between 1985 and 1994 when the Gulf of Maine Northern shrimp biomass was stable (15,453 mt). 16
17 Precision of surplus production model estimates was assessed by bootstrap analysis, in which survey measurement errors were randomly sampled 1 times to provide simulated replications of the model. Bootstrap results suggest that estimates of biomass and mortality were relatively precise. Estimates of F and Biomass from the surplus production model generally confirmed the pattern of estimates from the CSA model between 1985 and 25 (Figures 12 & 13). However, the 26 and 27 estimates of biomass from the CSA diverge greatly from the surplus production estimates for the first time. This divergence casts some uncertainty on the accuracy of the magnitude of the biomass estimates from the CSA model in the terminal years. The terminal year values of fishing mortality and biomass in both models are typically poorly estimated. Furthermore, in this particular instance, the CSA biomass estimates are likely sensitive to the unprecedented high summer survey abundance index values observed in 25 and 26. As such, managers should view the magnitude of the 26 and 27 CSA biomass estimates with caution. Without question the 27 project biomass of northern shrimp is high, but possibly not quite as high as projected by the CSA model. Yield per recruit and percent maximum spawning potential were estimated for the Gulf of Maine northern shrimp fishery (Figure 14). Yield per recruit was maximum at F=.77 (F max ) (48% exploitation) (Table 7). The increase in yield per unit F decreased to one tenth the initial increase at F=.46 (F.1 ) (33% exploitation). Maximum spawning potential (i.e., with no F) was 2,395 eggs per recruit. Spawning potential was reduced by half at F=.25 (F 5%, 2% exploitation). As concluded by the Stock Assessment Review Committee (SARC) in 1997, the stock was not replacing itself when spawning potential was reduced to less than 2% of maximum, and the stock collapsed when egg production was reduced further. Reproductive success for Gulf of Maine northern shrimp may be a function of population fecundity and spring seawater temperature (Figure 15). Therefore, F 2% may be an appropriate overfishing threshold, which would result in a target F well below.6. A sustainable target F may be the average F from 1985 to 1994, which was.25 (which allows 5% egg production per recruit) (Table 7, Figure 13). 17
18 SUMMARY Landings in the Gulf of Maine northern shrimp fishery declined since the mid 199 s, from a high for the decade of 9,166 mt in 1996 to a low of 424 mt in 22, the result of low abundances of shrimp and reductions in fishing effort. Since then, landings have increased to 2,553 mt in the 7-day 25 season (preliminary) and 1,877 mt in the 14-day 26 season (preliminary). The 26 season was characterized by very high catch rates, low participation, and poor market demand. The number of fishing vessels and trawl trips have dropped from about 31 and 1,734 respectively in 1997 to 119 and 1,646 in 26 (preliminary), although vessel reporting, particularly from the Maine small boat fleet, has probably improved. Fishing mortality rates (F), as calculated by CSA, have declined from 1.6 in 1997 to.3 in 26 (preliminary). F was above the average (the target or threshold F in the FMP) every year from 1995 through 21. Current landings, vessels, and trips are calculated from vessel trip reports (VTRs). Note that 25 landings were incomplete when calculated from VTRs in October of 25 (Tables 1-2, 25 assessment), and went up by 19% when recalculated in September 26 (Tables 1-2 here). Thus it must be assumed that 26 vessel trip reports are also incomplete at this time, particularly for Maine harvesters who do not hold federal permits. However, it can be concluded that the 26 fishery was conducted both inshore and offshore, with very limited participation, outstanding catches per trip and per hour, and a predominance of assumed 5-year-old female shrimp from the 21 year class. Exploitable biomass as estimated from CSA declined from 13,9 mt at the beginning of the 1996 season to a time series low of 4,4 before 21. Since then the biomass estimate has risen to 13, mt before 25, as a result of the appearance of the strong 21 year class, and to 71,5 mt for the 27 season, the high for the CSA time series by far. The technical committee notes that there is a high degree of uncertainty around terminal year estimates, however, and that the CSA and surplus production model estimates of biomass for 27 diverge widely. 18
19 Size composition data from both the fishery and summer surveys indicate that good landings have followed the recruitment of strong (dominant) year classes. Poor landings from 1998 to 24, as well as low biomass estimates, can be attributed in part to the below-average recruitment of the 1994, 1995, 1997, 1998, 2, and 22 year classes. In 27, the strong 21 year class (assumed 6-year-old females) may still be present in part, the 22 year class (assumed 5-year-old females) will be very weak, the strong 23 year class (4- year-old females) will contribute most to landings, and the exceptionally strong 24 year class and medium 23 year class will be males and juveniles. RECOMMENDATIONS The Northern Shrimp Technical Committee bases its recommendations to the Section on its assessment of current stock status, the biology of the species, and the stated management goal of protecting and maintaining the stock at levels that will support a viable fishery (Amendment 1 to the FMP, June 24). The committee recommends that the Section continue its recent efforts to maintain fishing mortality at conservative rates, that is, below the FMP target/threshold value of.22. The strong 24 and 23 year classes present welcome opportunities to continue rebuilding the stock. Recruitment failure of the 22 year class continues to be a concern, as is the mediocre first appearance of the 25 year class. At its Fall 25 meeting, the Northern Shrimp Section made a commitment to set the 27 season for 14 days, provided certain triggers were not exceeded. The Section would reconsider the 27 fishing season length if, during the 26 fishing season: the number of fishing trips exceeds 5,6 landings exceed 5,2 metric tons, or fishing mortality exceeds.2. 19
20 The 5,2mt landings limit was suggested by this committee in the 25 assessment document. Although landings and trips data for the 26 season are incomplete at this time, it is obvious that none of these triggers were exceeded during the 26, 14-day season. Since, according to all available data, stock strength continues to improve, the committee does not oppose another 14 day season for 27. Short-term commercial prospects are favorable: the abundance of shrimp greater than 22 mm is at its highest level since the summer survey began in If these larger shrimp follow traditional patterns of migrating and aggregating behavior, a 26 fishery can anticipate good catches at current levels of fishing effort, of predominantly 4-year-old female shrimp. However, if the large shrimp fail to separate themselves from the smaller ones, and if the fishery is conducted when the year classes are mixed, a mixy product will result, and an opportunity to husband the 24 and 23 year classes will be lost. The committee notes that the unusually high 23 year class abundance estimate from the 26 survey conflicts with the previous two years lower survey estimates (Figure 9). The 26 survey also produced abundance and biomass indices 2-3 times greater than historical highs. The survey was conducted with fewer tows than usual (Table 4), and it is possible that the 26 survey results are biased. These inconsistencies contribute a high level of uncertainty to this year s assessment. Again, the committee urges managers to take whatever action is necessary to ensure a timelier reporting of landings. The committee also urges managers to ensure that the summer shrimp survey is adequately funded in the future. REFERENCES Apollonio, S., and E.E. Dunton The northern shrimp Pandalus borealis, in the Gulf of Maine. Dept. Sea and Shore Fisheries MS, Augusta, Maine, 82p. 2
21 Atlantic States Marine Fisheries Commission. 24. Amendment 1 to the interstate fishery management plan for northern shrimp. ASMFC Fishery Management Rep. No. 42, 69p. Collie, J.S. and G.H. Kruse Estimating king crab (Paralithodes camtschaticus) abundance from commercial catch and research survey data. In Proceedings of the North Pacific Symposium on Invertebrate Stock Assessment and Management. Edited by G.S. Jamieson and A. Cambell. Can. Spec. Publ. Fish. Aquat. Sci pp Collie, J.S. and M.P. Sissenwine Estimating population size from relative abundance data measured with error. Can. J. Fish. Aquat. Sci. 4: NEFSC (Northeast Fisheries Science Center) Report of the 22 nd Northeast Regional Stock Assessment Workshop (22 nd SAW) Stock Assessment Review Committee (SARC) Consensus Summary of Assessments. Woods Hole, MA. NEFSC Reference Document pp NEFSC (Northeast Fisheries Science Center). 23. Report of the 36 th Northeast Regional Stock Assessment Workshop (36 th SAW) Stock Assessment Review Committee (SARC) Consensus Summary of Assessments. Woods Hole, MA. NEFSC Reference Document 3-6. pp Rinaldo, R.G. and P. Yevich Black spot gill syndrome of the northern shrimp Pandalus borealis. J Invertebrate Pathology 24(2): Schick, D.F., S. Cadrin, D. McCarron, A. Richards and B. Smith MS. Assessment Report for Gulf of Maine Northern Shrimp Atlantic States Marine Fisheries Commission s Northern Shrimp Technical Committee. October 18, p. 21
22 ACKNOWLEDGMENTS The Committee sincerely thanks all those people who have contributed to this assessment through their time and efforts as part of the scientific crew on the R/V Gloria Michelle shrimp survey, and as port samplers, sample processors, and data entry personnel. Their hard work has made this effort possible. 22
23 Table 1. Commercial landings (mt) of northern shrimp in the western Gulf of Maine, Year Maine Massachusetts New Hampshire Total $/Lb , , , , , , , , , , , , , , , , , , , , , ,43.7 3, , ,177. 2, , , , *(853.3) *(655.3) 32.8 *(21.6) 1,574.5 *(1,53.2) ,22. (892.5) 58. (458.4) 36.5 (46.2) 1,566.5 (1,397.1) ,564.7 (2,394.9) (525.1) 96.8 (3.7) 3,226.8 (2,95.7) ,956.9 (2,946.4) 1,3.6 (968.) 27.4 (216.5) 4,194.9 (4,13.9) ,47.3 (3,268.2) 1,85.6 (1,136.3) (23.5) 4,684. (4,635.) ,534.2 (3,673.2) 1,338.7 (1,422.2) (157.8) 5,25.4 (5,253.2) ,272.4 (2,257.2) (619.6) (154.5) 3,77. (3,31.3) ,542.6 (2,384.) (699.9) (231.5) 3,66.5 (3,315.4) ,961.5 (3,236.1) (974.3) (451.2) 4,42. (4,661.6) ,431.1 (2,488.1) (81.1) 28.2 (282.2) 3,366.9 (3,571.4) ,973.9 (3,54.1) (289.1) 1.1 (1.) 3,365.6 (3,443.6) ,562.8 (1,492.2) 3.3 (292.8) (357.4) 2,34.7 (2,142.9) ,815.5 (2,239.3) (247.5) 52.9 (428.) 3,71.8 (2,914.8) (5,22.7) (678.8) (764.9) (6,466.4) (7,737.) (658.) (771.) (9,166.1) (6,5.) (362.8) (666.3) (7,79.1) (3,482.) (247.2) (445.2) (4,174.4) (1,523.4) (75.7) (217.) (1,816.1).93 2 (2,67.3) (19.9) (212.3) (2,389.5) (1,73.4) (49.2) (26.4) (1,329.1) **(364.8) **(7.7) (51.2) **(423.7) **(1,81.2) **(23.1) (16.7) **(1,211.) **(1,756.) **(17.5) (175.2) **(1,948.7) **(2,214.6) **(48.6) (289.9) **(2,553.2) 26 **(1,762.5) **(25.2) (88.9) **(1,876.6) *Numbers in parentheses are computed on a seasonal basis. **Includes removals by experimental studies 25 and 26 are preliminary. 23
24 Table 2a. Distribution of landings (metric tons) in the Gulf of Maine northern shrimp fishery by state and month, Season Season Dec Jan Feb Mar Apr May Other Total Dec Jan Feb Mar Apr May Other Total 1987 Season, 182 days, Dec 1 - May Season, 128 days, Dec 1 - Apr 3, 1 day per week off Maine , ,68.2 Maine , , ,22.7 Mass ,427.9 Mass N.H N.H Total , , ,266. Total 1, , ,56.6 1, , Season, 183 days, Dec 1 - May Season, 152 days, Dec 1- May 31, 1 day per week off Maine ,258.4 Maine 1, , , ,737.1 Mass Mass N.H N.H Total ,92.3 1, ,35.6 Total 1, , , , Season, 182 days, Dec 1 - May Season, 156 days, Dec 1- May 27, two 5-day and four 4-day blocks off Maine ,384. Maine 1, , , ,5. Mass Mass N.H N.H Total , ,315.4 Total 1, , , , Season, 182 days, Dec 1 - May Season, 15 days, Dec 8-May 22, weekends off except Mar 14-15, Dec and Mar off. Maine ,235.7 Maine , ,482. Mass Mass N.H N.H Total , ,665.1 Total , , , Season, 182 days, Dec 1 - May Season, 9 days, Dec 15 - May 25, weekends, Dec 24 - Jan 3, Jan 27-31, Feb 24-28, Mar 16-31, and Apr 29 - May 2 off. Maine ,488.1 Maine ,523.4 Mass Mass N.H N.H Total , ,571.2 Total , Season, 153 days, Dec 15 - May 15 2 Season, 51 days, Jan 17 - Mar 15, Sundays off Maine , ,54.2 Maine , ,67.3 Mass Mass N.H N.H Total ,76.1 1, ,443.7 Total , , Season, 138 days, Dec 14 - April 3 21 Season, 83 days, Jan 9 - Apr 3, Mar 18 - Apr 16 off, experimental offshore fishery in May Maine ,492.2 Maine ,73.4 Mass Mass N.H N.H Total ,142.8 Total , Season, 122 days, Dec 15 - Apr Season, 25 days, Feb 15 - Mar 11 Maine ,239.3 Maine Mass Mass N.H N.H Total , ,914.8 Total
25 Table 2a continued. Season Dec Jan Feb Mar Apr May Other Total 23 Season, 38 days, Jan 15 - Feb 27, Fridays off Maine ,81.2 Mass N.H Total , Season, 4 days, Jan 19 - Mar 12, Saturdays and Sundays off Maine ,756. Mass N.H Total ,948.7 *25 Season, 7 days, Dec 19-3, Fri-Sat off, Jan 3 - Mar 25, Sat-Sun off Maine ,214.6 Mass N.H Total , ,553.2 *26 Season, 14 days, Dec 12 - Apr 3 Maine ,762.5 Mass N.H Total ,876.6 * Preliminary data 25
26 Table 2b. Distribution of landings (metric tons) in the Maine northern shrimp fishery by gear type and month, Season Dec Jan Feb Mar Apr May Other Total % of season total 21 Season, 83 days, Jan 9 - Apr 3, Mar 18 - Apr 16 off, experimental offshore fishery in May Trawl % Trap % Total , Season, 25 days, Feb 15 - Mar 11 Trawl % Trap % Total Season, 38 days, Jan 15 - Feb 27, Fridays off Trawl % Trap % Total , Season, 4 days, Jan 19 - Mar 12, Saturdays and Sundays off Trawl , % Trap % Total ,756. *25 Season, 7 days, Dec 19-3, Fri-Sat off, Jan 3 - Mar 25, Sat-Sun off Trawl , % Trap % Total ,214.6 *26 Season, 14 days, Dec 12 - Apr 3 Trawl , % Trap % Total ,762.5 * Preliminary data 26
27 Table 3a. Distribution of fishing effort (number of trawl trips) in the Gulf of Maine northern shrimp fishery by state and month, Season Season Dec Jan Feb Mar Apr May Other Total Dec Jan Feb Mar Apr May Other Total 1987 Season, 182 days, Dec 1 - May Season, 128 days, Dec 1 - Apr 3, 1 day per week off Maine 993 2,373 3,73 2, ,653 Maine 879 2,341 2,641 1, ,892 Mass ,283 Mass ,71 N.H N.H ,52 Total 1,385 2,891 3,662 2, ,285 Total 1,213 3,57 3,195 1,853 1,147 1, Season, 183 days, Dec 1 - May Season, 152 days, Dec 1- May 31, 1 day per week off Maine 972 2,183 2,72 1, ,421 Maine 1,341 2,3 3,19 1, ,923 Mass ,178 Mass ,373 N.H N.H ,495 Total 1,72 2,74 3,382 1, ,24 Total 1,971 2,589 3,94 1, , Season, 182 days, Dec 1 - May Season, 156 days, Dec 1- May 31, two 5-day and four 4-day blocks off Maine 958 2,479 2, ,38 Maine 1,674 1,753 2,737 1, ,665 Mass ,637 Mass N.H N.H ,292 Total 1,181 3,327 3,46 1, ,561 Total 2,135 2,224 3,283 1, , Season, 182 days, Dec 1 - May Season, 15 days, Dec 8-May 22, weekends off except Mar 14-15, Dec and Mar off. Maine 1,36 1,71 1,529 1, ,396 Maine 852 1,548 1, ,313 Mass ,374 Mass N.H N.H Total 1,361 2,532 2,86 2,345 1, ,758 Total 1,86 1,964 1, , Season, 182 days, Dec 1 - May Season, 9 days, Dec 15 - May 25, weekends, Dec 24 - Jan 3, Jan 27-31, Feb 24-28, Mar 16-31, and Apr 29 - May 2 off. Maine 568 1,286 2,7 1, ,551 Maine , ,92 Mass ,613 Mass N.H N.H Total 1,111 1,987 2,66 1, ,968 Total , , Season, 153 days, Dec 15 - May 15 2 Season, 51 days, Jan 17 - Mar 15, Sundays off Maine 411 1,966 2,7 1, ,758 Maine 653 1, ,892 Mass Mass N.H N.H Total 566 2,456 2,921 1, ,798 Total 712 2, , Season, 138 days, Dec 14 - April 3 21 Season, 83 days, Jan 9 - Apr 3, Mar 18 - Apr 15 off, experimental offshore fishery in May Maine 249 1,12 1,777 1, ,387 Maine 1,531 1, ,922 Mass Mass N.H ,4 N.H Total 385 1,548 2,32 1, ,158 Total 1,947 1, , Season, 122 days, Dec 15 - Apr Season, 25 days, Feb 15 - Mar 11 Maine 265 1,34 1,889 1, ,681 Maine Mass Mass N.H N.H Total 492 1,72 2,32 1, ,99 Total ,1 27
28 Table 3a continued. Season Dec Jan Feb Mar Apr May Other Total 23 Season, 38 days, Jan 15 - Feb 27, Fridays off Maine 773 1,2 49 1,842 Mass N.H Total 89 1, , Season, 4days, Jan 19 - Mar 12, Saturdays and Sundays off Maine ,967 Mass N.H Total , ,277 *25 Season, 7 days, Dec 19-3, Fri-Sat off, Jan 3 - Mar 25, Sat-Sun off Maine ,558 Mass N.H Total , ,91 *26 Season, 14 days, Dec 12 - Apr 3 Maine ,472 Mass N.H Total ,646 * Preliminary data 28
29 Table 3b. Distribution of fishing trips in the Maine northern shrimp fishery by gear type and month, Season Dec Jan Feb Mar Apr May Other Total % of total 21 Trawl 1,531 1, ,922 83% Trap % Total 1,722 1, , Trawl % Trap % Total ,56 23 Trawl 773 1,2 49 1,842 72% Trap % Total 1,26 1,486 2, Trawl ,967 82% Trap % Total , ,394 *25 Trawl ,558 75% Trap % Total ,37 1,277 3,416 *26 Trawl ,472 7% Trap % Total ,12 * preliminary data 29
30 Table 4. Stratified* mean numbers and weights per tow of northern shrimp collected during R/V Gloria Michelle summer surveys, Untransformed N Age-1.5 >22 mm** >22 mm** Total Total Year Tows Number Number Weight (kg) Number Weight (kg) , , , , , , , ,812 1, , , , , , , , , , , , , , , , , ,551 1, , , , , , , , , , , ,584 1, , , , Log e transformed N Age-1.5 >22 mm** >22 mm** Total Total Year Tows Number Number Weight (kg) Number Weight (kg) , , , , , , , , , , , , , , , , , , Mean , Median , *Based on strata 1, 3, 5, 6, 7 and 8. **Will be fully recruited to the winter fishery. 3
31 Table 5. Summary of results from CSA analysis, Gulf of Maine northern shrimp. New Fully- Fishing Recruits Recruited Biomass Exploitation Season (millions) (millions) F (NR+FR) (mt) Rate % % , % % % , % , % , % % % % % % % % % % % % % % 26 4,33 1, % 27 6,363 4, Overall average % average % 31
32 Table 6. Summary of results from surplus production analysis, Gulf of Maine northern shrimp. Input Results Fishing Fall Maine Summer Catch Biomass F B/Bmsy F/Fmsy Season (kg/tow) (kg/tow) (kg/tow) (mt) (mt) ,78 44, ,14 43, ,33 35, ,59 29, ,22 24, ,691 18, ,24 12, ,142 7, ,387 3, , , , , ,71 8, ,53 1, ,397 12, ,951 14, ,131 15, ,635 15, ,266 15, ,36 13, ,315 14, ,665 15, ,571 14, ,444 15, ,143 15, ,915 18, ,466 19, ,166 18, ,79 13, ,174 9, ,816 7, ,39 8, ,329 8, , ,211 12, ,949 15, ,553 17, ,877 19, ,65.75 Average ,153 15, average 21, average 15, average 17,
33 Table 7. Yield and egg production per recruit of Gulf of Maine northern shrimp, for an example fishing mortality F =.2, natural mortality M =.25, and 1, age recruits. Input Data Results Length Transition Fishery Male Female Fecundity Total Male Female Male Female Yield Egg Age (mm) Rate (% Fem) Selectivity wt (g) wt (g) at length N N N Catch Catch (g) Production , , , , , , , , , ,299 total 2,773 1,377,725 total/recruit ,378 % of max Ref. Point F YPR %EPR Count per pound F max Age Male Female F F example F 5% F 4% F 3% F 2% F 1%
34 14, Landings in metric tons 12, 1, 8, 6, 4, Total Maine Massachusetts New Hampshire 2, Year Figure 1a. Gulf of Maine northern shrimp landings by year and state. 34
35 Landings in metric tons ME NH MA Dec Jan Feb Mar Apr Landings in millions of shrimp Male & juv Transitionals Female 1 Ovigerous Female 2 Dec Jan Feb Mar Apr Figure 1b. Gulf of Maine northern shrimp landings by month in the 26 season. Landings are in metric tons by month (above), and in millions of shrimp by development stage (below). 35
36 Percent Frequency December Trawls, Landings=132.4 mt, Samples=14 Males & Juvs 17.8% Ovigerous 8.1% Trans & Fem I 1.1% Female II 1.% Percent Frequency January Trawls, Landings = 54.4 mt, Samples = 29 Males & Juvs 9.2% Ovigerous 85.% Trans & Fem I.7% Female II 5.2% Percent Frequency January Traps, Landings = 13.3 mt, Samples = 6 Males & Juvs.% Ovigerous 89.1% Trans & Fem I.5% Female II 1.4% Percent Frequency February Trawls, Landings = 67.2 mt, Samples=26 Males & Juvs 1.7% Ovigerous 7.9% Trans & Fem I.4% Female II 27.% Percent Frequency February Traps, Landings = mt, Samples = 13 Males & Juvs.% Ovigerous 56.9% Trans & Fem I.3% Female II 42.8% Percent Frequency March Trawls, Landings = mt, Samples = 21 Males & Juvs 33.8% Ovigerous 6.2% Trans & Fem I 21.1% Female II 38.8% Percent Frequency March Traps, Landings = 64.9 mt, Samples = 13 Males & Juvs.% Ovigerous 5.9% Trans & Fem I.% Female II 94.1% Percent Frequency April Trawls, Landings = 76.1 mt, Samples = 9 Males & Juvs 3.3% Ovigerous.% Trans & Fem I 33.8% Female II 35.9% <= Dorsal Carapace Length (mm) Percent Frequency April Traps, Landings =.7 mt, Samples = 1 Males & Juvs.% Ovigerous.% Trans & Fem I.% Female II 1.% <= Dorsal Carapace Length (mm) Figure 2. Length-frequency distribution from samples of Maine northern shrimp catches during the 26 season. Landings are preliminary. 36
37 Percent Frequency December, Landings = 7.9 mt, Samples = 3 Males & Juvs 3.4% Ovigerous 85.1% Trans & Fem I 8.6% Female II 2.9% Percent Frequency January, Landings = 35.9 mt, Samples = 5 Males & Juvs 2.9% Ovigerous 47.9% Trans & Fem I 16.3% Female II 32.9% Percent Frequency February, Landings = 14.1 mt, Samples = 9 Males & Juvs 11.5% Ovigerous 7.9% Trans & Fem I 1.% Female II 7.6% Percent Frequency March, Landings = 49.9 mt, Samples = 1 Males & Juvs 8.3% Ovigerous.3% Trans & Fem I 36.% Female II 55.4% Percent Frequency April, Landings = 6.5 mt, Samples = 4 Males & Juvs 5.% Ovigerous.% Trans & Fem I 38.7% Female II 56.4% <= Dorsal Carapace Length (mm) Figure 3. Size-frequency distribution from samples of Massachusetts and New Hampshire northern shrimp catches during the 26 season. Landings are preliminary. 37
38 Landings (millions of shrimp) male & juv transitional female 1 ovigerous female Dorsal carapace length in mm. Figure 4. Gulf of Maine northern shrimp landings by length, development stage, and fishing season. Landings are preliminary throughout. 38
39 Landings (millions of shrimp) male & juv transitional female 1 ovigerous female Dorsal carapace length in mm. Figure 4 continued. 39
40 Landings (millions of shrimp) male & juv transitional female 1 ovigerous female Dorsal carapace length in mm. Figure 4 continued. 4
41 Landings (millions of shrimp) male & juv transitional female 1 ovigerous female Dorsal carapace length in mm. Figure 4 continued. 41
42 Landings (millions of shrimp) Male & juv Transitionals Female 1 Ovigerous Female Dorsal carapace length in mm. Figure 4 continued. 42
43 18 Total Trawl Trips (thousands) Landings (mt) per Trawl Trip mt/trip kg/hr Landings (kg) per Trawl Hour Figure 5. Nominal fishing effort (trawl trips) (above) and catch per unit effort (below), in the Gulf of Maine northern shrimp fishery by year. 25 and 26 data are preliminary. 43
44 44

45 45
FOR. Prepared October 28, 2008 by the Atlantic States Marine Fisheries Commission's Northern Shrimp Technical Committee
 ASSESSMENT REPORT FOR GULF OF MAINE NORTHERN SHRIMP 28 Prepared October 28, 28 by the Atlantic States Marine Fisheries Commission's Northern Shrimp Technical Committee Margaret Hunter, Chair (Maine) Robert
FOR. Prepared November 21, 2013 by the Atlantic States Marine Fisheries Commission's Northern Shrimp Technical Committee
 ASSESSMENT REPORT FOR GULF OF MAINE NORTHERN SHRIMP 213 Prepared November 21, 213 by the Atlantic States Marine Fisheries Commission's Northern Shrimp Technical Committee Kelly Whitmore, Chair (Massachusetts)
FOR. Prepared October 27, 2016 By the Atlantic States Marine Fisheries Commission's Northern Shrimp Technical Committee
 STOCK STATUS REPORT FOR GULF OF MAINE NORTHERN SHRIMP 216 Prepared October 27, 216 By the Atlantic States Marine Fisheries Commission's Northern Shrimp Technical Committee Robert Eckert, Chair (New Hampshire
Chesapeake Bay Jurisdictions White Paper on Draft Addendum IV for the Striped Bass Fishery Management Plan
 Chesapeake Bay Jurisdictions White Paper on Draft Addendum IV for the Striped Bass Fishery Management Plan Maryland Department of Natural Resources, District of Columbia s Fisheries and Wildlife Division,
2002 REVIEW OF THE ATLANTIC STATES MARINE FISHERIES COMMISSION FISHERY MANAGEMENT PLAN FOR BLUEFISH (Pomatomus saltatrix)
") 2002 REVIEW OF THE ATLANTIC STATES MARINE FISHERIES COMMISSION FISHERY MANAGEMENT PLAN FOR BLUEFISH (Pomatomus saltatrix) Prepared by: Michael Lewis (ASMFC) Bluefish Plan Review Team Elliot Atstupenas
2002 REVIEW OF THE ATLANTIC STATES MARINE FISHERIES COMMISSION FISHERY MANAGEMENT PLAN FOR BLUEFISH (Pomatomus saltatrix) Prepared by: Michael Lewis (ASMFC) Bluefish Plan Review Team Elliot Atstupenas
ASMFC Stock Assessment Overview: American Lobster
 Introduction The 215 benchmark stock assessment for lobster is the most comprehensive evaluation of stock status to date. It differs from previous stock assessments in that it combines the Gulf of Maine
Atlantic Striped Bass Draft Addendum V. Atlantic Striped Bass Board May 9, 2017
 Atlantic Striped Bass Draft Addendum V Atlantic Striped Bass Board May 9, 2017 Timeline May 2017: Consider Approval of Draft Addendum V for Public Comment May July 2017: Public Comment period August 2017:
ASMFC Stock Assessment Overview: Red Drum
 Purpose The purpose of this document is to improve the understanding and transparency of the Commission s stock assessment process and results. It is the first of several that will be developed throughout
Gulf of St. Lawrence (4RST) Greenland Halibut
 Greenland Halibut") Fisheries and Oceans Science Pêches et Océans Sciences DFO Science Stock Status Report A4-3 () 52 5 48 46 Québec Nouveau-Brunswick Québec 4T 4S 4R 3Pn 4Vn Terre-Neuve 3Ps 3K 3L Gulf of St. Lawrence (4RST)
Fisheries and Oceans Science Pêches et Océans Sciences DFO Science Stock Status Report A4-3 () 52 5 48 46 Québec Nouveau-Brunswick Québec 4T 4S 4R 3Pn 4Vn Terre-Neuve 3Ps 3K 3L Gulf of St. Lawrence (4RST)
HADDOCK ON THE SOUTHERN SCOTIAN SHELF AND IN THE BAY OF FUNDY (DIV. 4X/5Y)
") Canadian Science Advisory Secretariat Science Advisory Report 26/47 HADDOCK ON THE SOUTHERN SCOTIAN SHELF AND IN THE BAY OF FUNDY (DIV. 4X/5Y) Context Haddock (Melanogrammus aeglefinus) are found on both
Canadian Science Advisory Secretariat Science Advisory Report 26/47 HADDOCK ON THE SOUTHERN SCOTIAN SHELF AND IN THE BAY OF FUNDY (DIV. 4X/5Y) Context Haddock (Melanogrammus aeglefinus) are found on both
2000 REVIEW OF THE ATLANTIC STATES MARINE FISHERIES COMMISSION FISHERY MANAGEMENT PLAN FOR BLUEFISH (Pomatomus saltatrix)
") 2000 REVIEW OF THE ATLANTIC STATES MARINE FISHERIES COMMISSION FISHERY MANAGEMENT PLAN FOR BLUEFISH (Pomatomus saltatrix) Prepared by: Robert Beal (ASMFC) Bluefish Plan Review Team Elliot Atstupenas (USFWS)
2000 REVIEW OF THE ATLANTIC STATES MARINE FISHERIES COMMISSION FISHERY MANAGEMENT PLAN FOR BLUEFISH (Pomatomus saltatrix) Prepared by: Robert Beal (ASMFC) Bluefish Plan Review Team Elliot Atstupenas (USFWS)
ASMFC Stock Assessment Overview: Red Drum
 Introduction This document presents a summary of the 217 stock assessments for red drum. These assessments were initially conducted through the Southeast Data, Assessment and Review (SEDAR) process using
Annual Pink Shrimp Review
 Annual Pink Shrimp Review Oregon Department of Fish and Wildlife ODFW Marine Region, Marine Science Dr., Bldg. #3, Newport, OR 97365 (503) 867-4741 TO: FROM: OREGON SHRIMP INDUSTRY BOB HANNAH, PINK SHRIMP
Species Profile: Red Drum Benchmark Assessment Finds Resource Relatively Stable with Overfishing Not Occurring
 Red Drum Sciaenops ocellatus Management Unit: New Jersey - Florida Interesting Facts: * The name is derived from their color and the fact that during spawning time males produce a drum-like noise by vibrating
Atlantic States Marine Fisheries Commission
 Atlantic States Marine Fisheries Commission Vision: Sustainably Managing Atlantic Coastal Fisheries Meeting Summary Joint ASMFC Summer Flounder, Scup and Black Sea Bass Board and MAFMC March 6 & 7, 2019
Shrimp of the Estuary and the Gulf of St. Lawrence
 DFO Science Stock Status Report C4-6 54 52 North Shore Latitude 5 48 12 New Brunswick 1 Gaspé Peninsula Anticosti P.E.I. 9 8 Newfoundland Shrimp of the Estuary and the Gulf of St. Lawrence 46 44 Nova Scotia
ASMFC Stock Assessment Overview: Atlantic Menhaden
 Introduction This document presents a summary of the 217 Stock Assessment Update for Atlantic menhaden. The assessment is an update to the 215 Benchmark Stock Assessment that was peer reviewed by an independent
Hakes Assessment SARC 51. Whiting NEFMC PDT Meeting February 14, 2011 Milford, MA
 Hakes Assessment SARC 51 Whiting NEFMC PDT Meeting February 14, 2011 Milford, MA Revisions and Updates to Assessment Summary Document Silver hake Revised assessment document Silver hake assessment summary
ADDENDUM I TO AMENDMENT 3 OF THE INTERSTATE FISHERY MANAGEMENT PLAN FOR WEAKFISH
 ATLANTIC STATES MARINE FISHERIES COMMISSION ADDENDUM I TO AMENDMENT 3 OF THE INTERSTATE FISHERY MANAGEMENT PLAN FOR WEAKFISH Prepared by the Weakfish Plan Review Team Approved October 18, 2000 TABLE OF
Advice June 2014
 5.3.23 Advice June 2014 ECOREGION STOCK Celtic Sea and West of Scotland Plaice in Division VIIa (Irish Sea) Advice for 2015 Based on ICES approach to data-limited stocks, ICES advises that catches should
2001 REVIEW OF THE ATLANTIC STATES MARINE FISHERIES COMMISSION FISHERY MANAGEMENT PLAN FOR WEAKFISH (Cynoscion regalis)
") 2001 REVIEW OF THE ATLANTIC STATES MARINE FISHERIES COMMISSION FISHERY MANAGEMENT PLAN FOR WEAKFISH (Cynoscion regalis) Plan Review Team Rick Cole, DE Louis Daniel, NC Charles Lesser, DE Rob O Reilly,
2001 REVIEW OF THE ATLANTIC STATES MARINE FISHERIES COMMISSION FISHERY MANAGEMENT PLAN FOR WEAKFISH (Cynoscion regalis) Plan Review Team Rick Cole, DE Louis Daniel, NC Charles Lesser, DE Rob O Reilly,
ATLANTIC STATES MARINE FISHERIES COMMISSION. Winter Flounder Abundance and Biomass Indices from State Fishery-Independent Surveys
 ATLANTIC STATES MARINE FISHERIES COMMISSION Winter Flounder Abundance and Biomass Indices from State Fishery-Independent Surveys Technical Committee Report to the Winter Flounder Management Board February
ASSESSMENT OF SHRIMP STOCKS IN THE ESTUARY AND GULF OF ST. LAWRENCE IN 2011
 Canadian Science Advisory Secretariat Science Advisory Report 212/6 ASSESSMENT OF SHRIMP STOCKS IN THE ESTUARY AND GULF OF ST. LAWRENCE IN 211 Figure 1. Shrimp fishing areas in the Estuary and Gulf of
SA2 + Div. 3K Redfish
 Fisheries and Oceans Pêches et Océans Canada Canada DFO Science Stock Status Report A2-15(21) entered the fishery in 1975 and averaged about 16,5 t from 1978-1986. The steady reduction in catches from
SOUTH PACIFIC COMMISSION. TWENTY-SECOND REGIONAL TECHNICAL MEETING ON FISHERIES (Noumea, New Caledonia, 6-10 August 1990)
") Page 1 ORIGINAL : ENGLISH SOUTH PACIFIC COMMISSION TWENTY-SECOND REGIONAL TECHNICAL MEETING ON FISHERIES (Noumea, New Caledonia, 6-10 August 1990) STOCK STATUS OF SKIPJACK TUNA IN THE WESTERN TROPICAL
Page 1 ORIGINAL : ENGLISH SOUTH PACIFIC COMMISSION TWENTY-SECOND REGIONAL TECHNICAL MEETING ON FISHERIES (Noumea, New Caledonia, 6-10 August 1990) STOCK STATUS OF SKIPJACK TUNA IN THE WESTERN TROPICAL
W rking towards healthy rking
 Working towards healthy, self-sustaining sustaining populations for all Atlantic coast fish species or successful restoration well in progress by 2015 Terms of Reference Atlantic Striped Bass Management
North Carolina. Striped Mullet FMP. Update
 North Carolina Striped Mullet FMP Update Presentation for the Marine Fisheries Commission January 24, 2008 COMMERCIAL HARVEST 4,000,000 2,000,000 3,500,000 3,000,000 Landings (lb) Value ($) 1,800,000
A. SOUTHERN NEW ENGLAND / MID-ATLANTIC (SNE/MA) WINTER FLOUNDER ASSESSMENT SUMMARY FOR 2011
 WINTER FLOUNDER ASSESSMENT SUMMARY FOR 2011") A. SOUTHERN NEW ENGLAND / MID-ATLANTIC (SNE/MA) WINTER FLOUNDER ASSESSMENT SUMMARY FOR 2011 State of Stock: In 2010 the SNE/MA winter flounder stock was overfished but overfishing was not occurring. The
A. SOUTHERN NEW ENGLAND / MID-ATLANTIC (SNE/MA) WINTER FLOUNDER ASSESSMENT SUMMARY FOR 2011 State of Stock: In 2010 the SNE/MA winter flounder stock was overfished but overfishing was not occurring. The
West Coast Rock Lobster. Description of sector. History of the fishery: Catch history
 West Coast Rock Lobster Description of sector History of the fishery: The commercial harvesting of West Coast rock lobster commenced in the late 1800s, and peaked in the early 1950s, yielding an annual
PACIFIC BLUEFIN TUNA STOCK ASSESSMENT
 PACIFIC BLUEFIN TUNA STOCK ASSESSMENT SUMMARY 19-21 December 2012 Webinar PACIFIC BLUEFIN TUNA STOCK ASSESSMENT SUMMARY 1. Stock Identification and Distribution Pacific bluefin tuna (Thunnus orientalis)
ASSESSMENT OF THE WEST COAST OF NEWFOUNDLAND (DIVISION 4R) HERRING STOCKS IN 2011
 HERRING STOCKS IN 2011") Canadian Science Advisory Secretariat Science Advisory Report 212/24 ASSESSMENT OF THE WEST COAST OF NEWFOUNDLAND (DIVISION 4R) HERRING STOCKS IN 211 Context Figure 1. Map of unit areas of NAFO Division
Canadian Science Advisory Secretariat Science Advisory Report 212/24 ASSESSMENT OF THE WEST COAST OF NEWFOUNDLAND (DIVISION 4R) HERRING STOCKS IN 211 Context Figure 1. Map of unit areas of NAFO Division
NEW ENGLAND FISHERY MANAGEMENT COUNCIL. Herring PDT Report May 1, 2003 Holiday Inn, Mansfield, MA
 NEW ENGLAND FISHERY MANAGEMENT COUNCIL Herring PDT Report May 1, 2003 Holiday Inn, Mansfield, MA The Herring Plan Development Team (PDT) met jointly with the ASMFC Herring Technical Committee (TC) on May
Advice October 2013
 5.4.21.3 Advice October 213 ECOREGION Celtic Sea and West of Scotland STOCK Nephrops on Porcupine Bank (FU 16) Advice for 214 ICES advises on the basis of the MSY approach that catches from FU 16 in 214
ICES Advice on fishing opportunities, catch, and effort Celtic Seas and Greater North Sea ecoregions Published 30 June 2016
 ICES Advice on fishing opportunities, catch, and effort Celtic Seas and Greater North Sea ecoregions Published 30 June 2016 5.3.57 Sea bass (Dicentrarchus labrax) in divisions 4.b c, 7.a, and 7.d h (central
Advice June 2012
 2.4.1 Advice June 212 ECOREGION STOCK Iceland and East Greenland Beaked redfish (Sebastes mentella) in Subareas V, XII, and XIV and NAFO Subareas 1+2 (Deep pelagic stock > 5 m) Advice for 213 The advice
Biological Review of the 2014 Texas Closure
 Biological Review of the 2014 Texas Closure Report to the Gulf of Mexico Fishery Management Council by James M. Nance, Ph.D. Southeast Fisheries Science Center Galveston Laboratory January 2015 Introduction
Assessment Summary Report Gulf of Mexico Red Snapper SEDAR 7
 Assessment Summary Report Gulf of Mexico Red Snapper SEDAR 7 Stock Distribution: Red snapper are found throughout the Gulf of Mexico, the Caribbean Sea, and from the U.S. Atlantic Coast to northern South
3.4.3 Advice June Barents Sea and Norwegian Sea Cod in Subareas I and II (Norwegian coastal waters cod)
") 3.4.3 Advice June 2013 ECOREGION STOCK Barents Sea and Norwegian Sea Cod in Subareas I and II (Norwegian coastal waters cod) Advice for 2014 ICES advises on the basis of the Norwegian rebuilding plan,
3.4.3 Advice June 2013 ECOREGION STOCK Barents Sea and Norwegian Sea Cod in Subareas I and II (Norwegian coastal waters cod) Advice for 2014 ICES advises on the basis of the Norwegian rebuilding plan,
Year Avg. TAC Can Others Totals
 SKATE IN DIVISIONS 3L, 3N, 3O AND SUBDIVISION 3Ps Background There are 8 to 1 species of skate in the waters around Newfoundland. Of these, thorny skate (Raja radiata) is by far the most common, comprising
Dauphin Lake Fishery. Status of Walleye Stocks and Conservation Measures
 Dauphin Lake Fishery Status of Walleye Stocks and Conservation Measures Date: December, 21 Dauphin Lake Fishery Status of Walleye Stocks and Conservation Measures Background: Walleye stocks in Dauphin
Eastern and South Shore Nova Scotia Lobster LFAs The Fishery. DFO Atlantic Fisheries Stock Status Report 96/117E.
 Maritimes Region DFO Atlantic Fisheries Stock Status Report 96/117E Eastern and South Shore Nova Scotia Lobster LFAs 31-33 Background Lobsters first entering the fishery in LFAs 31, 32, and 33 are probably
Paper prepared by the Secretariat
 COMMISSION FOURTEENTH REGULAR SESSION Manila, Philippines 3 7 December 2017 REFERENCE DOCUMENT FOR REVIEW OF CMM 2005-03 AND FOR THE DEVELOPMENT OF HARVEST STRATEGIES UNDER CMM 2014-06 North Pacific Albacore
Establish interim harvest reductions that end overfishing and rebuild the spawning stock biomass by 2015.
 Interim Management Measures for Achieving Sustainable Harvest I. Issue Establish interim harvest reductions that end overfishing and rebuild the spawning stock biomass by 2015. II. Background The 2009
Gulf of Maine Northern Shrimp Survey
 November 21, 2003 CRUISE RESULTS Gulf of Maine Northern Shrimp Survey July 27 - August 8, 2003 Introduction This report summarizes results of the 2003 survey cruise for northern shrimp, Pandalus borealis,
Atlantic States Marine Fisheries Commission ADDENDUM XXI TO THE SUMMER FLOUNDER, SCUP AND BLACK SEA BASS FISHERY MANAGEMENT PLAN FOR PUBLIC COMMENT
 Atlantic States Marine Fisheries Commission ADDENDUM XXI TO THE SUMMER FLOUNDER, SCUP AND BLACK SEA BASS FISHERY MANAGEMENT PLAN FOR PUBLIC COMMENT Black Sea Bass Recreational Management in 211 ASMFC Vision
Atlantic States Marine Fisheries Commission
 Atlantic States Marine Fisheries Commission 1050 N. Highland Street Suite 200A-N Arlington, VA 22201 703.842.0740 703.842.0741 (fax) www.asmfc.org MEMORANDUM To: From: Subject: January 18, 2018 South Atlantic
2007 REVIEW OF THE ATLANTIC STATES MARINE FISHERIES COMMISSION FISHERY MANAGEMENT PLAN FOR. SPOT (Leiostomus xanthurus) 2006 FISHING YEAR
 2006 FISHING YEAR") 2007 REVIEW OF THE ATLANTIC STATES MARINE FISHERIES COMMISSION FISHERY MANAGEMENT PLAN FOR SPOT (Leiostomus xanthurus) 2006 FISHING YEAR Prepared by Nichola Meserve (ASMFC) The Spot Plan Review Team Joe
2007 REVIEW OF THE ATLANTIC STATES MARINE FISHERIES COMMISSION FISHERY MANAGEMENT PLAN FOR SPOT (Leiostomus xanthurus) 2006 FISHING YEAR Prepared by Nichola Meserve (ASMFC) The Spot Plan Review Team Joe
2013 REVIEW OF THE ATLANTIC STATES MARINE FISHERIES COMMISSION'S INTERSTATE FISHERY MANAGEMENT PLAN FOR WINTER FLOUNDER
 2013 REVIEW OF THE ATLANTIC STATES MARINE FISHERIES COMMISSION'S INTERSTATE FISHERY MANAGEMENT PLAN FOR WINTER FLOUNDER (Pseudopleuronectes americanus) 2012 FISHING YEAR (May 2012 April 2013) Approved
Cod in the Northern Gulf of St. Lawrence
 DFO Sciences Stock Status Report A4-1 (1998) 52. 51. 5. Latitude 49. 48. 47. 4S 4R 3Pn Background Cod in the northern Gulf of (Divisions 3Pn, 4RS) undertake distant annual migrations. In winter, the fish
NEW ENGLAND FISHERY MANAGEMENT COUNCIL. Annual Monitoring Report for Fishing Year 2014 With a Red Hake Operational Assessment for Calendar Year 2014
 6. Small Mesh Mulitspecies - (Sept. 29 - Oct. 1, 2015) - M #2 NEW ENGLAND FISHERY MANAGEMENT COUNCIL Annual Monitoring Report for Fishing Year 2014 With a Red Hake Operational Assessment for Calendar Year
ASMFC Stock Assessment Overview: Black Drum
 Introduction This document presents a summary of the 215 benchmark stock assessment for black drum. The assessment was peerreviewed by an independent panel of scientific experts through the ASMFC integrated
Shrimp of the Estuary and the Gulf of St. Lawrence
 DFO Sciences Laurentian Region Stock Status Report C4-6 (1998) 54 52 North Shore Latitude 5 48 12 New Brunswick 1 Gaspé Peninsula Anticosti P.E.I. 9 8 Newfoundland Shrimp of the Estuary and the Gulf of
Gulf of Maine Research Institute Responsibly Harvested Seafood from the Gulf of Maine Region
 Gulf of Maine Research Institute Responsibly Harvested Seafood from the Gulf of Maine Region Report on Gulf of Maine and Georges Bank American Lobster The fishery is managed by a competent authority and
2013 REVIEW OF THE ATLANTIC STATES MARINE FISHERIES COMMISSION'S INTERSTATE FISHERY MANAGEMENT PLAN FOR WINTER FLOUNDER
 2013 REVIEW OF THE ATLANTIC STATES MARINE FISHERIES COMMISSION'S INTERSTATE FISHERY MANAGEMENT PLAN FOR WINTER FLOUNDER (Pseudopleuronectes americanus) 2012 FISHING YEAR (May 2012 April 2013) Draft for
Annual Pink Shrimp Review
 Annual Pink Shrimp Review Oregon Department of Fish and Wildlife ODFW Marine Region, Marine Science Dr., Bldg. #3, Newport, OR 97365 (53) 867-4741 TO: FROM: OREGON SHRIMP INDUSTRY BOB HANNAH, PINK SHRIMP
WORKING GROUP ON STOCK ASSESSMENTS 5 TH MEETING DOCUMENT SAR-5-08 TARGET SIZE FOR THE TUNA FLEET IN THE EASTERN PACIFIC OCEAN
 INTER-AMERICAN TROPICAL TUNA COMMISSION COMISIÓN INTERAMERICANA DEL ATÚN TROPICAL WORKING GROUP ON STOCK ASSESSMENTS 5 TH MEETING LA JOLLA, CALIFORNIA (USA) 11-13 MAY 2004 DOCUMENT SAR-5-08 TARGET SIZE
Fish Conservation and Management
 Fish Conservation and Management CONS 486 Northern Atlantic Cod: A management and conservation failure Chapter 12 Ross Cod fisheries: rich in history During the early to mid 1900 s, the cod fishery was
ICCAT Secretariat. (10 October 2017)
") ICCAT Secretariat (10 October 2017) Bluefin tuna: Background information Managed by International Commission for the Conservation of Atlantic Tunas (ICCAT): Two stocks (mixing occurring, but extent not
ICCAT Secretariat (10 October 2017) Bluefin tuna: Background information Managed by International Commission for the Conservation of Atlantic Tunas (ICCAT): Two stocks (mixing occurring, but extent not
SHRIMP OF THE ESTUARY AND GULF OF ST. LAWRENCE IN 2004
 Canadian Science Advisory Secretariat Science Advisory Report 25/35 SHRIMP OF THE ESTUARY AND GULF OF ST. LAWRENCE IN 24 Figure 1: Shrimp fishing areas in the Estuary and the Gulf of St. Lawrence. Context
NORTHERN SHRIMP ON THE EASTERN SCOTIAN SHELF (SFA 13-15)
") Canadian Science Advisory Secretariat Science Advisory Report 25/6 NORTHERN SHRIMP ON THE EASTERN SCOTIAN SHELF (SFA 13-15) Context The northern or pink shrimp, Pandalus borealis, is the only shrimp species
Canadian Science Advisory Secretariat Science Advisory Report 25/6 NORTHERN SHRIMP ON THE EASTERN SCOTIAN SHELF (SFA 13-15) Context The northern or pink shrimp, Pandalus borealis, is the only shrimp species
Overview 10/8/2015. October Pelagic Advice Pelagic AC 7 October 2015
 October Pelagic Advice Pelagic AC 7 October 2015 John Simmonds ICES ACOM Vice Chair Overview WG 1 Blue whiting NSS herring North Sea horse makerel WG 2 Stocks Northeast Atlantic mackerel Western horse
Atlantic States Marine Fisheries Commission. Amendment 3 to the Interstate Fishery Management Plan for Northern Shrimp
 Atlantic States Marine Fisheries Commission Amendment 3 to the Interstate Fishery Management Plan for Northern Shrimp October 2017 Vision: Sustainably Managing Atlantic Coastal Fisheries Amendment 3 to
ICES Advice on fishing opportunities, catch, and effort Celtic Seas and Greater North Sea Ecoregions Published 24 October 2017
 ICES Advice on fishing opportunities, catch, and effort Celtic Seas and Greater North Sea Ecoregions Published 24 October 2017 DOI: 10.17895/ices.pub.3334 Seabass (Dicentrarchus labrax) in divisions 4.b
THORNY SKATE IN DIVISIONS 3L, 3N, 3O AND SUBDIVISION 3Ps
 Newfoundland and Labrador Region Stock Status Report 2003/023 stomachs of skate captured in the vicinity of commercial fisheries. THORNY SKATE IN DIVISIONS 3L, 3N, 3O AND SUBDIVISION 3Ps Background There
Draft Discussion Document. May 27, 2016
 Draft Discussion Document May 27, 2016 Action to consider modifications to the sub-acl of GB haddock allocated to the Atlantic herring fishery and associated accountability measures AP/ CMTE Input 1. Review
Sheepshead Fishery Overview South Atlantic State/Federal Management Board May 2014 Introduction Life History Landings
 Sheepshead Fishery Overview South Atlantic State/Federal Management Board May 2014 Introduction The Atlantic States Marine Fisheries Commission (ASMFC) does not currently manage sheepshead (Archosargus
Plaice (Pleuronectes platessa) in Division 7.e (western English Channel)
 in Division 7.e (western English Channel)") Celtic Seas and Greater North Sea ecoregions Published 30 June 2016 Version 2: 15 May 2017 5.3.51 Plaice (Pleuronectes platessa) in Division 7.e (western English Channel) ICES stock advice ICES advises
Celtic Seas and Greater North Sea ecoregions Published 30 June 2016 Version 2: 15 May 2017 5.3.51 Plaice (Pleuronectes platessa) in Division 7.e (western English Channel) ICES stock advice ICES advises
2012 Maryland FMP Report (July 2013) Section 15. Red Drum (Sciaenops ocellatus)
 Section 15. Red Drum (Sciaenops ocellatus)") 1981 1983 1985 1987 1989 1991 1995 1997 1999 2001 2003 2005 2007 2009 2011 Pounds 2012 Maryland FMP Report (July 2013) Section 15. Red Drum (Sciaenops ocellatus) Chesapeake Bay FMP In 2012, red drum were
1981 1983 1985 1987 1989 1991 1995 1997 1999 2001 2003 2005 2007 2009 2011 Pounds 2012 Maryland FMP Report (July 2013) Section 15. Red Drum (Sciaenops ocellatus) Chesapeake Bay FMP In 2012, red drum were
STOCK STATUS OF SOUTHERN BLUEFIN TUNA
 7 th Expert Consultation on Indian Ocean Tunas, Victoria, Seychelles, 9-14 November, 1998 STOCK STATUS OF SOUTHERN BLUEFIN TUNA Tsuji, S. 1 Introduction The Commission for the Conservation of Southern
Spurdog (Squalus acanthias) in the Northeast Atlantic
 in the Northeast Atlantic") ICES Advice on fishing opportunities, catch, and effort Northeast Atlantic Published 11 October 2016 9.3.17 Spurdog (Squalus acanthias) in the Northeast Atlantic ICES stock advice ICES advises that when
ICES Advice on fishing opportunities, catch, and effort Northeast Atlantic Published 11 October 2016 9.3.17 Spurdog (Squalus acanthias) in the Northeast Atlantic ICES stock advice ICES advises that when
2.3.1 Advice May Capelin in Subareas V and XIV and Division IIa west of 5 W (Iceland East Greenland Jan Mayen area).
.") 2.3.1 Advice May 2014 ECOREGION Iceland and East Greenland STOCK Capelin in Subareas V and XIV and Division IIa west of 5 W (Iceland East Greenland Jan Mayen area) Advice for 2014/2015 ICES advises on
2.3.1 Advice May 2014 ECOREGION Iceland and East Greenland STOCK Capelin in Subareas V and XIV and Division IIa west of 5 W (Iceland East Greenland Jan Mayen area) Advice for 2014/2015 ICES advises on
Atlantic States Marine Fisheries Commission An Overview. Tina Berger, Director of Communications
 Atlantic States Marine Fisheries Commission An Overview By Tina Berger, Director of Communications Presentation Overview Commission Overview ASMFC Programs Species Highlights American Eel Atlantic Menhaden
2002 REVIEW OF THE ATLANTIC STATES MARINE FISHERIES COMMISSION FISHERY MANAGEMENT PLAN FOR WEAKFISH (Cynoscion regalis)
") 2002 REVIEW OF THE ATLANTIC STATES MARINE FISHERIES COMMISSION FISHERY MANAGEMENT PLAN FOR WEAKFISH (Cynoscion regalis) Plan Review Team Carrie Selberg, ASMFC, Chair Rick Cole, DE Louis Daniel, NC Rob
2002 REVIEW OF THE ATLANTIC STATES MARINE FISHERIES COMMISSION FISHERY MANAGEMENT PLAN FOR WEAKFISH (Cynoscion regalis) Plan Review Team Carrie Selberg, ASMFC, Chair Rick Cole, DE Louis Daniel, NC Rob
Shrimp of the Estuary and Gulf of St. Lawrence in 2003
 Stock Status Report /9 54 52 North Shore Shrimp of the Estuary and Gulf of St. Lawrence in 23 Latitude 5 48 46 44 12 New Brunswick 1 Gaspé Peninsula Anticosti Nova Scotia P.E.I. 9 8 Newfoundland Background
9.4.5 Advice September Widely distributed and migratory stocks Herring in the Northeast Atlantic (Norwegian spring-spawning herring)
") 9.4.5 Advice September 212 ECOREGION STOCK Widely distributed and migratory stocks Herring in the Northeast Atlantic (Norwegian spring-spawning herring) Advice for 213 ICES advises on the basis of the
9.4.5 Advice September 212 ECOREGION STOCK Widely distributed and migratory stocks Herring in the Northeast Atlantic (Norwegian spring-spawning herring) Advice for 213 ICES advises on the basis of the
6 th Meeting of the Scientific Committee Puerto Varas, Chile, 9-14 September 2018
 6 th Meeting of the Scientific Committee Puerto Varas, Chile, 9-14 September 218 SC6-Doc23_rev1 China s Annual Report, part I (Jack mackerel) Gang Li, Xiaorong Zou & Luoliang Xu Annual Report of China
10.3 Advice May 2014
 1.3 Advice May 214 ECOREGION STOCK North Atlantic Atlantic salmon from North America Advice for 214 Because the NASCO Framework of Indicators of North American stocks for 213 (run in January 214) did not
Recent stock recovery and potential future developments in. Sebastes mentella in the Barents- and Norwegian Seas.
 Recent stock recovery and potential future developments in the fishery, The rise management, of the assessment beaked and redfish population of Sebastes mentella in the Barents- and Norwegian Seas. Benjamin
Advice October 2014
 5.3.21.3 Advice October 2014 ECOREGION Celtic Sea and West of Scotland STOCK Nephrops on Porcupine Bank (FU 16) Advice for 2015 ICES advises on the basis of the MSY approach that catches from FU 16 in
Southern Gulf of St. Lawrence (4T) Herring
 Herring") Fisheries Pêches and Oceans et Océans DFO Science Stock Status B3-1 (22) Southern Gulf of St. Lawrence (4T) Herring Background Herring are a pelagic species which form schools during feeding and spawning
Fisheries Pêches and Oceans et Océans DFO Science Stock Status B3-1 (22) Southern Gulf of St. Lawrence (4T) Herring Background Herring are a pelagic species which form schools during feeding and spawning
Advice June 2013 Version 2,
 5..37 Advice June 3 Version, 5--3 ECOREGION STOCK Celtic Sea and West of Scotland Sole in Divisions VIIf,g (Celtic Sea) Advice for ICES advises on the basis of the MSY approach that catches in should be
TAC Reported Landings * - By-catch only
 DFO Atlantic Fisheries Stock Status Report 96/68E 4Vn 3Ps 4W 4Vs EASTERN SCOTIAN SHELF HADDOCK Background Haddock on the eastern Scotian Shelf and southern Gulf of St. Lawrence are considered as a single
Whiting (Merlangius merlangus) in Division 6.a (West of Scotland)
 in Division 6.a (West of Scotland)") ICES Advice on fishing opportunities, catch, and effort Celtic Seas Ecoregion Published 30 June 2016 5.3.65 Whiting (Merlangius merlangus) in Division 6.a (West of Scotland) ICES stock advice ICES advises
ICES Advice on fishing opportunities, catch, and effort Celtic Seas Ecoregion Published 30 June 2016 5.3.65 Whiting (Merlangius merlangus) in Division 6.a (West of Scotland) ICES stock advice ICES advises
NEW ENGLAND FISHERY MANAGEMENT COUNCIL. Annual Monitoring Report for Fishing Year 2014 With a Red Hake Operational Assessment for Calendar Year 2014
 NEW ENGLAND FISHERY MANAGEMENT COUNCIL Annual Monitoring Report for Fishing Year 2014 With a Red Hake Operational Assessment for Calendar Year 2014 1.0 Executive Summary This Annual Monitoring Report
Why has the cod stock recovered in the North Sea?
 Why has the cod stock recovered in the North Sea? Summary The expansion of European fisheries during the 1970s and 1980s resulted in high fishing pressure on stocks of cod, haddock, whiting and saithe
Atlantic States Marine Fisheries Commission
 Atlantic States Marine Fisheries Commission ADDENDUM XXVI TO THE SUMMER FLOUNDER, SCUP, BLACK SEA BASS FISHERY MANAGEMENT PLAN Summer Flounder Recreational Management in 2015 ASMFC Vision: Sustainably
History and Status of the Oregon Dungeness Crab Fishery
 History and Status of the Oregon Dungeness Crab Fishery History and Status of the Oregon Dungeness Crab Fishery by Darrell Demory Oregon Department of Fish and Wildlife Oregon Department of Fish and Wildlife
Advice June Sole in Division IIIa and Subdivisions (Skagerrak, Kattegat, and the Belts)
") 6.3.26 Advice June 2014 ECOREGION STOCK North Sea Sole in Division IIIa and Subdivisions 22 24 (Skagerrak, Kattegat, and the Belts) Advice for 2015 ICES advises on the basis of the MSY approach that catches
6.3.26 Advice June 2014 ECOREGION STOCK North Sea Sole in Division IIIa and Subdivisions 22 24 (Skagerrak, Kattegat, and the Belts) Advice for 2015 ICES advises on the basis of the MSY approach that catches
Advice May Herring in Subdivisions and 32 (excluding Gulf of Riga herring)
") 8.3.10 Advice May 2014 ECOREGION STOCK Baltic Sea Herring in Subdivisions 25 29 and 32 (excluding Gulf of Riga herring) Advice for 2015 ICES advises on the basis of the MSY approach that catches in 2015
8.3.10 Advice May 2014 ECOREGION STOCK Baltic Sea Herring in Subdivisions 25 29 and 32 (excluding Gulf of Riga herring) Advice for 2015 ICES advises on the basis of the MSY approach that catches in 2015
EU request to ICES on in-year advice on haddock (Melanogrammus aeglefinus) in Division 7.a (Irish Sea)
 in Division 7.a (Irish Sea)") ICES Special Request Advice Celtic Seas Ecoregion Published 1 March 2017 EU request to ICES on in-year advice on haddock (Melanogrammus aeglefinus) in Division 7.a (Irish Sea) Advice summary Please note:
ICES Special Request Advice Celtic Seas Ecoregion Published 1 March 2017 EU request to ICES on in-year advice on haddock (Melanogrammus aeglefinus) in Division 7.a (Irish Sea) Advice summary Please note:
Fishing mortality in relation to highest yield. Fishing mortality in relation to agreed target
 3.4 Stock summaries 3.4. Northeast Arctic cod State of the stock Spawning biomass in relation to precautionary limits Full reproductive capacity Fishing mortality in relation to precautionary limits/management
Draft Fishery Management Plan for Atlantic Migratory Group Cobia for Public Comment. ASMFC Summer Meeting Alexandria, Virginia August 2, 2017
 Draft Fishery Management Plan for Atlantic Migratory Group Cobia for Public Comment ASMFC Summer Meeting Alexandria, Virginia August 2, 2017 Primary FMP Objectives Complement SAFMC Coastal Migratory Pelagics
Technical Briefing. Northern Cod (NAFO Div. 2J3KL) Newfoundland & Labrador March 23, 2018
 Newfoundland & Labrador March 23, 2018") Technical Briefing Northern Cod (NAFO Div. 2J3KL) Newfoundland & Labrador March 23, 2018 Outline Purpose of this briefing Science advice & the precautionary approach Summary of stock status How we estimate
Technical Briefing Northern Cod (NAFO Div. 2J3KL) Newfoundland & Labrador March 23, 2018 Outline Purpose of this briefing Science advice & the precautionary approach Summary of stock status How we estimate
Haddock (Melanogrammus aeglefinus) in divisions 7.b k (southern Celtic Seas and English Channel)
 in divisions 7.b k (southern Celtic Seas and English Channel)") ICES Advice on fishing opportunities, catch, and effort Celtic Seas, Greater North Sea, and Oceanic Northeast Atlantic ecoregions Published 29 June 2018 https://doi.org/10.17895/ices.pub.4453 Haddock (Melanogrammus
ICES Advice on fishing opportunities, catch, and effort Celtic Seas, Greater North Sea, and Oceanic Northeast Atlantic ecoregions Published 29 June 2018 https://doi.org/10.17895/ices.pub.4453 Haddock (Melanogrammus
NEW ENGLAND FISHERY MANAGEMENT COUNCIL. Annual Monitoring Report for Fishing Year 2017
 NEW ENGLAND FISHERY MANAGEMENT COUNCIL for Fishing Year 2017 1.0 Executive Summary This (AMR) was prepared by Greater Atlantic Regional Fisheries Office (GARFO) and the Northeast Fisheries Science Center
SCIENTIFIC COUNCIL MEETING JUNE Assessment of Demersal Redfish in NAFO Subarea 1
 NOT TO BE CITED WITHOUT PRIOR REFERENCE TO THE AUTHOR(S) Northwest Atlantic Fisheries Organization Serial No. N5126 NAFO SCR Doc. 5/4 SCIENTIFIC COUNCIL MEETING JUNE 25 Assessment of Demersal Redfish in
JOB 3: LOBSTER FISHERY DATA COLLECTION FINAL REPORT
 JOB 3: LOBSTER FISHERY DATA COLLECTION FINAL REPORT ABSTRACT Starting in 2006, all individuals who purchased lobster harvest licenses were required to report catch and effort data either by trip-level
Black Sea Bass (Centropristis striata)
") 2014 REVIEW OF THE ATLANTIC STATES MARINE FISHERIES COMMISSION FISHERY MANAGEMENT PLAN FOR THE 2013 BLACK SEA BASS FISHERY Black Sea Bass (Centropristis striata) Prepared by: Kirby Rootes-Murdy, ASMFC
2014 REVIEW OF THE ATLANTIC STATES MARINE FISHERIES COMMISSION FISHERY MANAGEMENT PLAN FOR THE 2013 BLACK SEA BASS FISHERY Black Sea Bass (Centropristis striata) Prepared by: Kirby Rootes-Murdy, ASMFC
Presented to the ASMFC Horseshoe Crab Management Board October 17, 2017
 Horseshoe Crab Technical Committee Report Bait Use Surveys of the American Eel and Channeled Whelk Fisheries Presented to the ASMFC Horseshoe Crab Management Board October 17, 2017 Survey Goals Discover
2001 STATUS OF ATLANTIC MENHADEN STOCK AND FISHERY
 2001 STATUS OF ATLANTIC MENHADEN STOCK AND FISHERY Report of the Atlantic Menhaden Technical Committee July 1, 2001 1. Executive Summary The Atlantic Menhaden Technical Committee met in Richmond, Virginia