Landing Obligation Economic Impact Assessment (EIA) Landing Obligation Economic Impact Assessment (EIA) Final Report Final Report (using 2013
|
|
|
- Myrtle Patrick
- 5 years ago
- Views:
Transcription
 Final Report Final Report (using 2013")
1 Landing Obligation Economic Impact Assessment (EIA) Landing Obligation Economic Impact Assessment (EIA) Final Report Final Report (using 2013 baseline)
 Hazel Curtis (Seafish) Rod Cappell (Poseidon ARM) Sébastien Metz (Sakana Consultants) Sea Fish Industry Authority 18 Logie Mill Logie Green Road Edinburgh, EH7")
2 Landing Obligation Economic Impact Assessment (EIA) Final Report February 2016 Jennifer Russell (Anderson Solutions Consulting Ltd) Simon Mardle (Fishor Consulting Ltd) Hazel Curtis (Seafish) Rod Cappell (Poseidon ARM) Sébastien Metz (Sakana Consultants) Sea Fish Industry Authority 18 Logie Mill Logie Green Road Edinburgh, EH7 4HS
3 TABLE OF CONTENTS 1. INTRODUCTION PURPOSE OF THE ECONOMIC IMPACT ASSESSMENT CONTEXT... 2 The Landing Obligation... 2 Landing Obligation and its Link to Business Performance... 2 The Bioeconomic Scenario Analysis... 3 Potential Mitigation NOT A PREDICTION! STRUCTURE OF THE REPORT THE UK FLEET SIX HOME NATION FLEET SEGMENTS ASSIGNING THE FLEET TO A HOME NATION REVENUE EARNED BY THE FLEET SEGMENTS IN MODELLING THE IMPACT OF THE LANDING OBLIGATION INTRODUCTION KEY CHARACTERISTICS OF THE MODEL... 8 Scope of the Model... 8 Summary of Assumptions FLEET SEGMENTATION SEA AREAS QUOTA TOP-UP THE CHOKE POINT CATCH RATES AND IMPACT OF CHANGES IN STOCK BIOMASS FUTURE TACS AND MSY REVENUE TWO SCENARIO ANALYSES: INITIAL QUOTA ALLOCATION (IQA) AND END OF YEAR LANDINGS (EOY) Initial Quota Allocation (IQA) End of Year Landings (EoY) TRANSITIONAL PERIOD, EFFORT DISCARD RATES SCENARIO DEFINITIONS Baseline Scenarios Single Policy Lever Scenarios Combined Policy Lever Scenarios ENGLAND WHITEFISH TRAWL/SEINE SCENARIO ANALYSIS CHARACTERISTICS OF THE ENGLAND WHITEFISH TRAWL/SEINE FLEET SEGMENT WORST CASE SCENARIO, BASELINE SCENARIO B IMPACT OF POLICY LEVER SCENARIOS: FLEET REVENUE Summary Findings: Fleet Revenue IMPACT OF POLICY LEVER SCENARIOS: CHOKE STOCKS IMPACT OF POLICY LEVER SCENARIOS: TOP 5 CHOKE STOCKS UNDER SCENARIO 4C Summary Findings: Top 5 Choke Stocks IMPACT OF QUOTA TRADING PATTERNS IN ENGLAND NEPHROPS TRAWL SCENARIO ANALYSIS CHARACTERISTICS OF THE ENGLAND NEPHROPS TRAWL FLEET SEGMENT... 31
4 5.2. WORST CASE SCENARIO, BASELINE SCENARIO B IMPACT OF POLICY LEVER SCENARIOS: FLEET REVENUE Summary Findings: Fleet Revenue IMPACT OF POLICY LEVER SCENARIOS: CHOKE STOCKS IMPACT OF POLICY LEVER SCENARIOS: TOP 5 CHOKE STOCKS UNDER SCENARIO 4C Summary Findings: Top 5 Choke Stocks IMPACT OF QUOTA TRADING PATTERNS IN ENGLAND BEAM TRAWL SCENARIO ANALYSIS CHARACTERISTICS OF THE ENGLAND BEAM TRAWL FLEET SEGMENT WORST CASE SCENARIO, BASELINE SCENARIO B IMPACT OF POLICY LEVER SCENARIOS: FLEET REVENUE Summary Findings: Fleet Revenue IMPACT OF POLICY LEVER SCENARIOS: CHOKE STOCKS IMPACT OF POLICY LEVER SCENARIOS: TOP 5 CHOKE STOCKS UNDER SCENARIO 4C Summary Findings: Top 5 Choke Stocks IMPACT OF QUOTA TRADING PATTERNS IN NORTHERN IRELAND NEPHROPS TRAWL SCENARIO ANALYSIS CHARACTERISTICS OF THE NORTHERN IRELAND NEPHROPS TRAWL FLEET SEGMENT WORST CASE SCENARIO, BASELINE SCENARIO B IMPACT OF POLICY LEVER SCENARIOS: FLEET REVENUE Summary Findings: Fleet Revenue IMPACT OF POLICY LEVER SCENARIOS: CHOKE STOCKS IMPACT OF POLICY LEVER SCENARIOS: TOP 5 CHOKE STOCKS UNDER SCENARIO 4C Summary Findings: Top 5 Choke Stocks IMPACT OF QUOTA TRADING PATTERNS IN SCOTLAND WHITEFISH TRAWL/SEINE SCENARIO ANALYSIS CHARACTERISTICS OF THE SCOTLAND WHITEFISH TRAWL/SEINE FLEET SEGMENT WORST CASE SCENARIO, BASELINE SCENARIO B IMPACT OF POLICY LEVER SCENARIOS: FLEET REVENUE Summary Findings: Fleet Revenue IMPACT OF POLICY LEVER SCENARIOS: CHOKE STOCKS IMPACT OF POLICY LEVER SCENARIOS: TOP 5 CHOKE STOCKS UNDER SCENARIO 4C Summary Findings: Top 5 Choke Stocks IMPACT OF QUOTA TRADING PATTERNS IN SCOTLAND NEPHROPS TRAWL SCENARIO ANALYSIS CHARACTERISTICS OF THE SCOTLAND NEPHROPS TRAWL FLEET SEGMENT WORST CASE SCENARIO, BASELINE SCENARIO B IMPACT OF POLICY LEVER SCENARIOS: FLEET REVENUE Summary Findings: Fleet Revenue IMPACT OF POLICY LEVER SCENARIOS: CHOKE STOCKS IMPACT OF POLICY LEVER SCENARIOS: TOP 5 CHOKE STOCKS UNDER SCENARIO 4C Summary Findings: Top 5 Choke Stocks IMPACT OF QUOTA TRADING PATTERNS IN CATCHING THE QUOTA CONTEXT FINDINGS KEY FINDINGS... 95
5 11.1. KEY FINDINGS ADDITIONAL MITIGATION APPENDIX A: QUOTA TOP-UP MULTIPLIER AND ELIGIBILITY FOR INTERSPECIES FLEXIBILITY APPENDIX B: DISCARD RATES APPENDIX C: LANDINGS BY PORT REGION IN UNDER SCENARIOS B3 AND 4C
6 1. INTRODUCTION Introduction Seafish has undertaken a project to investigate potential impacts from the introduction of the landing obligation. The proposal to undertake an economic impact assessment was supported by stakeholders including government and industry. The project consisted of two main phases: A choke analysis of PO fleet segments and a choke analysis of home nation fleet segments. The choke analysis investigated what would have happened had the landing obligation been imposed in 2011, 2012 and 2013; and The second phase was a bioeconomic scenario analysis for 50 UK fleet segments to estimate the potential future consequences of the landing obligation; and to assess the relative benefit that different policy levers could have on an annual basis up to and including The final report is focused on the outcomes from phase two: the bioeconomic scenario analysis. The analysis presented in the report is informed by data from PURPOSE OF THE ECONOMIC IMPACT ASSESSMENT The landing obligation is a requirement to land all catches of quota species and the regulation incorporates provisions that are designed to support the effective implementation of the landing obligation, these additional provisions include: quota top-up (previously referred to as quota uplift in Interim Reports 1 and 2) to reflect that TACs will reflect total catch instead of catch minus discards; and exemptions and derogations from the landing obligation (from now on referred to as policy levers). When the economic impact assessment commenced in late 2014, the purpose of the landing obligation was clear and policy levers designed to avoid unintended consequences and mitigate the impact on the fleet had been introduced: quota top-up, de minimis, interspecies flexibility and survivability. However there was limited information on the detail of how the landing obligation would be implemented and on the potential impact of the landing obligation. Seafish developed the economic impact assessment with four primary goals: analyse the potential consequences of the landing obligation for the UK fleet if there is no substantive change in fishing patterns; explore the potential value of different policy levers to the UK fleet; identify potential choke stocks and their associated choke points in different sea areas, and for different fleet segments; and communicate the areas of greatest challenge with regards to mitigating the impact of the landing obligation in the UK. 1 The bioeconomic scenario analysis can be updated with new data and new scenarios if appropriate. 1
7 1.2. CONTEXT THE LANDING OBLIGATION Article 15 of the reformed Common Fisheries Policy (EC Reg. 1380/2013) introduces a regulatory requirement for the EU fishing fleet to land all catches subject to catch limits or quotas (the landing obligation). Introduction The landing obligation was implemented for EU pelagic fisheries from January For demersal fisheries, the landing obligation came into force using a phased approach on January 1 st 2016, with full implementation by January 1 st A significant proportion of the demersal fleet in the UK is fishing in a highly mixed fishery. This inevitably means that there are fish that a fisherman wants to catch and fish that a fisherman would rather not catch. Target stocks can vary between different fleet segments however in general fishermen want to avoid: undersize fish (below minimum conservation reference size); fish which there is no economically viable market for; and fish that the vessel owner has no quota for. This may be because the quota for a particular stock has been fully used up or because the vessel has no quota for a stock. Fishermen avoid unwanted fish through their knowledge of the behaviour of stocks, through communication between vessels or via POs on recent catches, and by using gear designed to avoid catching or to release undersize fish and certain species. However, regardless of these efforts, it remains inevitable that in a mixed fishery unwanted fish will be caught. When unwanted fish are caught they are commonly discarded, indeed fishermen are obliged to discard undersize fish and have to discard fish for which they cannot obtain quota. In 2019, when all demersal quota stocks become subject to the landing obligation, all catches of quota stocks must be landed. All catch must be landed regardless of whether the fish are below the minimum conservation reference size, are from a stock for which the vessel owner cannot access quota, or are a species for which there is no viable market. This requirement is likely to leave many fishermen with significant operational challenges as they try to find new ways to avoid unwanted catch and manage any unwanted catch that comes aboard. LANDING OBLIGATION AND ITS LINK TO BUSINESS PERFORMANCE With uncertainty around how much more can be done to avoid unwanted catch in a mixed fishery and with TACs that lag behind changes in fish stocks, the landing obligation can be considered a risk to business performance in the UK fleet. Once fully implemented, the landing obligation will mean that the landings composition of demersal quota stocks more closely reflects catch composition (some exemptions are expected). As described, landings and discards have been determined by a range of factors including quota management, regulation and economic drivers. Therefore, unless fishermen can avoid the fish previously discarded, it is anticipated that landings in the future will include undersize fish and a larger proportion of fish for which there is little or no market. It is reasonable to expect an effect on vessel business performance if this occurs. Business performance will also be affected if a vessel chokes on a stock for which the owner cannot obtain quota. Once a vessel has fully caught its quota holdings for one stock, and cannot access further quota for that stock, we have assumed that the vessel will be required to stop fishing in the sea area where the stock might be caught, regardless of how much quota the vessel holds for other stocks in the same sea area. This 2
8 Introduction is referred to as the choke point and the stock which causes the choke point is referred to as the primary choke stock. The bioeconomic scenario analysis undertaken by Seafish is focused on the potential effect of choke stocks on business performance. There is no analysis in this project of the business performance implications of handling unwanted fish onboard. THE BIOECONOMIC SCENARIO ANALYSIS The bioeconomic scenario analysis has been undertaken to better understand the potential consequences for the UK fleet from the introduction of the landing obligation and the potential impact of choke stocks. If the UK fleet were to catch demersal quota stocks as it did in 2013, the analysis indicates the potential future consequences of the landing obligation on the UK fleet and the relative value of different policy levers. The bioeconomic scenario analysis tests the consequences for the UK fleet under 11 different policy lever scenarios. The analysis uses a specially-designed bioeconomic model, based on the FISHRENT structure, and informed assumptions to undertake the analysis. The model does incorporate how the landing obligation under each scenario might lead to changes in fishing mortality and the biomass of ICES-assessed stocks (19 of the 51 stocks included in the model). With the exception of changes to the biomass of ICES-assessed stocks, and the catchability of those stocks, the model assumes that fishing activity remains stable, for example the number of vessels, the sales price for stocks and the catch rates per day at sea for stocks that are not assessed by ICES all remain as recorded in However, landings composition and revenue do change in response to previously discarded fish now being retained. The analysis also highlights which stocks are estimated to create the greatest choke problem for different fleet segments. The scientific knowledge on stocks varies: 19 of the 51 stocks in the model were fully ICES-assessed in 2013, the state of 26 stocks was unknown and there is some knowledge on the remaining six stocks. In 2019, when all quota stocks become subject to the landing obligation, the importance and potential impact of data poor stocks is greatly increased. The bioeconomic scenario analysis had to use the best available information on these stocks. Assumptions in the analysis include that there will be no quota top-up for 34 of the stocks in the model and that interspecies flexibility will not be available for stocks not in, or not known to be in, safe biological limits. POTENTIAL MITIGATION Mitigating any unintended impacts of the landing obligation is a priority for all stakeholders. Three sources of potential mitigation are identified: policy responses, fleet responses and market responses. The analysis presented in the report only relates to the consequences of the landing obligation and the mitigation that might be offered by policy responses proposed in discard plans, reflecting Article 15 of the reformed CFP (Figure 1-1). 3


9 Introduction Figure 1-1: Potential responses to mitigate the unintended consequences of the landing obligation Fleet Responses Vessel operators can be expected to take action to avoid unwanted catch although the potential impact of such action is not yet known. Once there is a clearer understanding of what action the fleet could take or is taking the bioeconomic scenario analysis could be updated to reflect actual or anticipated changes in catch composition as a result of such action. New gear technology is one way that fishing businesses might respond to the challenges of the landing obligation. Trials of new gear types are underway and once the impact of these gear types is better understood the bioeconomic scenario analysis could be updated to include new catch rates for stocks. Of particular importance will be findings on whether new gear technology can help to avoid choke stocks. Tactical decisions while at sea may also help to delay or avoid choke points but each skipper s ability to respond to the impact of the landing obligation may be unique to that vessel and the particular choke stocks it faces. A change in tactical decision-making across the UK fleet would be difficult to usefully model and may only be better understood through monitoring activities once the regulation is active. A third potential response by vessel owners, or at a PO level, is quota trading in order to access additional quota for potential choke stocks. The potential benefit of quota trading will depend on the extent to which different vessels, POs and nations experience different choke stocks, and whether sufficient TAC is available at an EU level to address unavoidable catch of choke stocks NOT A PREDICTION! Readers are advised to consider the analysis as a projection of the potential consequences of the landing obligation if there are no fleet or market responses. With regards to the different policy levers, the analysis is best viewed as a simulation to explore the relative value of proposed policy levers; and which identifies issues of resilience, viability and vulnerability in UK fleet segments at a home nation level. The analysis is not intended to be a prediction of what will actually occur as a result of the landing obligation. The actual outcomes could be better or worse than the analysis presented because: how quota top-up will be calculated and allocated is not yet known; how the exemptions and derogations proposed in the landing obligation will be implemented in practice is not yet clear; 4
10 knowledge of catch composition is limited to observed discard rates; how catch of zero-tac stocks will be addressed is not yet known; Introduction how fleet and market responses may further mitigate the impacts of the landing obligation is not yet known; and additional policy responses could be proposed and implemented STRUCTURE OF THE REPORT The report addresses the four primary goals for the analysis: Chapter 2 provides background on the fleet segments presented in the report. Chapter 3 explains the scope of the bioeconomic scenario analysis and the main assumptions used in the analysis. Chapters 4 to 9 present the findings of the bioeconomic scenario analysis for six fleet segments. Each chapter has the same structure and includes: o o o o o o characteristics of the fleet segment; findings from the worst case scenario tested in the model; the impact of five policy lever scenarios on the revenue of the fleet; the impact of five policy lever scenarios on choke stocks; the top five choke stocks that the fleet segment could encounter; and A comparison of the revenue results and choke points for the fleet segment between the scenario analysis based on end of year landings (EoY) and the scenario analysis based on initial quota allocation (IQA). Chapter 11 presents analysis of how much of the available UK quota could be caught prior to fleet segments encountering the choke points estimated for Chapter 12 provides an overview of the findings and highlights the areas of greatest challenge if the potential impact of the landing obligation is to be mitigated in the UK. Appendix A details the quota top-up multipliers used for each of the 51 stocks included in the model and whether or not the stock is considered eligible for interspecies flexibility in the model. Appendix B details the discard rates for each stock and each fleet segment. Appendix C presents an additional analysis and translates the findings of the bioeconomic scenario analysis into landings at different port regions in the UK. 5
11 2. THE UK FLEET The UK Fleet 2.1. SIX HOME NATION FLEET SEGMENTS The final report presents findings from the bioeconomic scenario analysis for six fleet segments. The six segments have been created by aggregating the findings for 25 PO fleet segments included in the model. The segments reflect three fisheries: Norway lobster (nephrops), common sole and plaice, and cod, haddock, whiting and saithe. The vessels included in the analysis landed 86% of landings of demersal quota stocks made by UK vessels in The six fleet segments are: England whitefish trawl/seine (scenario findings are shown in Chapter 4); England nephrops trawl (scenario findings are shown in Chapter 5); England beam trawl (scenario findings are shown in Chapter 6); Northern Ireland nephrops trawl (scenario findings are shown in Chapter 7); Scotland whitefish trawl/seine (scenario findings are shown in Chapter 8); and Scotland nephrops trawl (scenario findings are shown in Chapter 9). The PO fleet segments included in the six segments are from 22 UK POs as shown in Table 2-1. The 25 fleet segments analysed in the model include three fleet segments that aggregate vessels from different POs. These three aggregated fleet segments were necessary as each of the PO fleet segments included had fewer than five vessels in Table 2-1: Fleet segments included in the bioeconomic scenario analysis Whitefish trawl/seine Nephrops trawl Beam trawl England and Wales Anglo-Scottish FPO Cornish FPO Eastern England FPO South Western FPO Whitefish trawl vessels were aggregated into a single fleet segment from: Fleetwood FPO Lowestoft FPO The FPO Anglo-Scottish FPO Eastern England FPO Cornish FPO North Sea Fishermen s Organisation South Western FPO Wales and West Coast FPO 1 Beam trawl vessels were aggregated into a single fleet segment from: East of England FPO Interfish Lowestoft FPO North Atlantic FPO The FPO Northern Ireland Anglo-North Irish FPO Northern Ireland FPO Scotland Aberdeen FPO North East of Scotland Fishermen s Organisation Scottish Fishermen's Organisation Shetland FPO Whitefish trawl vessels were aggregated into a single fleet segment from: Lunar PO Northern PO Orkney FPO The Fife FPO North East of Scotland Fishermen s Organisation Northern PO Scottish Fishermen's Organisation The Fife FPO West of Scotland FPO 6


12 The UK Fleet 1 The WWCFPO fleet segment was moved to the beam trawl fleet segment from the demersal trawl/seine segment for the purpose of the bioeconomic scenario analysis as the primary catch of the fleet is plaice ASSIGNING THE FLEET TO A HOME NATION The aggregated results for each of the six home nation fleet segments are created from the combination of PO fleet segments (see Table 2-1). To create the home nation fleet segments each PO has been allocated to a home nation. It is known that POs are not necessarily wholly aligned to home nations as vessels in a PO could potentially be from more than one home nation. The analysis in Table 2-2 shows that, for the majority of vessels, their registered home nation is also the nation that their PO is aligned to. For example 131 of 153 vessels registered in England and Wales are members of a PO aligned to England and Wales. Table 2-2: Number of vessels by registered home nation cross-referenced with location of PO in 2013 Location of PO England and Wales Northern Ireland Scotland Registered country of vessels England and Wales Northern Ireland Scotland REVENUE EARNED BY THE FLEET SEGMENTS IN 2013 In terms of revenue, three of the six home nation fleet segments eared 78% of the total revenue of all six segments: the Scotland whitefish trawl/seine fleet earned 40% of the total revenue of all six fleet segments in 2013; the England beam trawl fleet earned 19% of the total revenue of all six fleet segments in 2013; and the Scotland nephrops trawl fleet earned 19% of the total revenue of all six fleet segments in 2013 (Figure 2-1). Scot Nep Tr, 19 % Eng Whi Tr/S, 11 % Eng Nep Tr, 2% Eng Bm Tr, 19% Scot Whi Tr/S, 40 % NI Nep Tr, 8% Figure 2-1: Revenue of each home nation fleet segment in 2013 as a percentage of total revenue in 2013 Note: The revenue estimates in this analysis include revenue from activities in addition to landings of demersal quota stocks 7
13 Modelling the Impact of the Landing Obligation 3. MODELLING THE IMPACT OF THE LANDING OBLIGATION Chapter 3 provides a more detailed introduction to the bioeconomic scenario analysis and key assumptions used. The eleven policy scenarios are also explained. An understanding of the assumptions and the scenarios will greatly assist the reader to interpret the findings presented in the remainder of the report. The assumptions explained in Chapter 3 are those that we believe to be critical to understanding the results. Information is also provided in response to questions asked since Interim Report Two was published INTRODUCTION The analysis has been undertaken using a bioeconomic model to estimate the potential impact of the landing obligation and the relative benefit of the various policy levers associated with the landing obligation. The bioeconomic scenario analysis assumes that the only sources of impact on the different fleet segments are: changes to fisheries management i.e. the landing obligation and associated policy levers as defined in the various scenarios; and changes in the biomass of ICES-assessed stocks as a result of expected changes in fishing mortality. Changes to biomass alters catch and TACs in the model. All other factors are held constant in the model and are informed by activity in 2013 e.g. catch rates for quota stocks not assessed by ICES, price for landings and number of vessels. The model does not anticipate how the impact of the landing obligation might be mitigated by fleet responses. However, it could be possible in the future to adjust catch composition within the model to reflect increased TACs or changes to catch composition when sufficient information exists to inform such changes KEY CHARACTERISTICS OF THE MODEL The bioeconomic model used to produce the scenario analysis has been designed to enable a high level of detail to be produced by fleet segment, by stock and by sea area across the whole of the UK. The model has the following characteristics: SCOPE OF THE MODEL The model incorporates 51 demersal quota stocks. 19 of the 51 stocks are ICES-assessed. The list of stocks is included in Appendix A. The model incorporates 50 fleet segments, including PO fleet segments and non-sector fleet segments. Each PO may have one or more fleet segments included in the model e.g. a nephrops trawl fleet segment and a whitefish trawl fleet segment. Not all fleet segments are included in the presented analysis. The model differentiates activity in three sea areas: Area IV (North Sea), Area VI (West of Scotland) and Area VII. The different sub-areas within Area VII are not differentiated. The scenario analysis consists of eleven different scenarios (see Section 3.14). The model produces results for each year from 2013 up to and including
14 SUMMARY OF ASSUMPTIONS Modelling the Impact of the Landing Obligation The activity data used to inform the bioeconomic model is from Therefore the discard rates, catch composition and ICES advice for stocks are for See Chapter 13 to find out about Seafish plans to update the baseline year used in the model. The estimates for quota top-up have been created from ICES catch advice for The TACs for data poor stocks are not expected to receive quota top-up. See section 3.5. The impact of each scenario is determined by the effect that the scenario has on potential choke stocks. A choke stock occurs if the quota of a stock is expected to be fully used before the fleet segment would normally be expected to conclude its fishing for the year. The point at which the quota of a stock is fully used is referred to as the choke point. See section 3.6 for further detail. The fishing activity and financial data for the 50 different fleet segments in the UK is taken from Seafish information on the fleet segments in The analysis assumes that a fleet segment will be required to halt fishing activity in a sea area once a choke point has occurred. Maximum effort (days at sea) for each PO fleet segment is fixed in the scenario analysis at days at sea fished in There are two versions of the bioeconomic scenario analysis, one is based on initial quota allocation (IQA) to fleet segments and one is based on end of year landings (EoY) by fleet segments. The purpose of doing the analysis twice is to understand the importance of historic patterns of in-year quota trading on the outcome. See section 3.10 for further detail. Since Interim Report Two was published the scenario analysis has been revised to incorporate the agreed phasing proposals for 2016 and proposals/assumptions for 2017 and Further detail on the assumptions used for the period is provided in Section Since Interim Report Two was published the number of species in the analysis that are exempt from the landing obligation under survivability, scenario 3, has reduced from six to one (skate) as initial discussions that all flatfish could be exempt are no longer considered realistic. See section The scenario analysis assumes that all vessels in a PO or non-sector fleet segment are average vessels. Therefore the model assumes that each vessel in a fleet segment is identical and has equal access to the quota allocated to their fleet segment, and that each vessel in the PO or non-sector fleet segment has the same catch rates and discard rates. See section 3.3. Annual changes in stock biomass and TACs are limited to 5% in the model. See sections 3.7 and Error! Reference source not found.. If the vessels in a fleet segment did not land any catch of a demersal quota stock, i.e. 100% of the catch was discarded across the whole fleet segment, then the analysis for the fleet segment will not include that stock. The excluded stock could be an additional choke stock for the segment FLEET SEGMENTATION The smallest unit of activity within the model is PO, or non-sector, fleet segments i.e. the model does not simulate the diversity of vessels within a PO fleet segment. The model assumes that all vessels within a PO fleet segment have equal access to the quota attached to the fleet segment and that they all share the same catch rates. The choke point is therefore calculated on the activity of an average vessel in a PO fleet segment. The findings presented in the six home nation fleet segments included in the report are aggregated from the findings of 25 PO fleet segments 9
15 Modelling the Impact of the Landing Obligation Fleet segments with less than 5 vessels have been aggregated into a home nation fleet segment appropriate to those vessels. For example if a PO located in Scotland has two whitefish trawl/seine vessels these vessels have been included in a specially created Scotland whitefish trawl/seine fleet segment with other vessels from other POs that are not included in individual PO fleet segments. See Chapter 2 for further detail SEA AREAS The model undertakes analysis in three sea areas Area IV (North Sea), Area VI (West of Scotland) and Area VII. Area VII is treated as a single sea area. The catch rates for stocks that are specific to sub-areas in area seven are calculated on the basis of total days at sea in the whole of Area VII. For example, a fleet segment s catch rate for plaice VIIfg is calculated from the segment s total catch (landings plus estimated discards) of plaice VIIfg and the total days at sea in Area VII i.e. not just the days in sub-area fg. Therefore the activity of each fleet segment in Area VII is averaged out and in the model area VII is effectively a single sea area. This could have a negative impact in the calculation of the choke point for the fleet segment if the identified primary choke stock is seasonal and only, for example, fished intensively at the end of the year QUOTA TOP-UP Quota top-up (formerly referred to as quota uplift in the Interim Reports) is assumed to be fully applied in the year that a stock becomes subject to the landing obligation. For example, the quota top-up for haddock in Area IV is applied in 2016, the quota top-up for cod in Area IV is applied in 2017 and the quota top-up for megrim, and other stocks not brought in to the landing obligation during the transitional period, is applied in Quota top-up is allocated to all fleet segments that are deemed eligible within the analysis regardless of whether or not a particular fleet segment is required to land the stock in that year, i.e. nephrops trawl vessels will receive an quota top-up for Area IV cod in 2017 even though they are not required to land all catch of Area IV cod until In the IQA scenario analysis the distribution of quota top-up across the UK is undertaken based on the quota allocated to each fleet segment at the beginning of the year. In the EoY scenario analysis the distribution of quota top-up is based on end of year landings, as a proxy for quota held. In the model, fleet segments with no recorded landings of a stock in 2013 will not benefit from quota top-up for that stock. A quota top-up multiplier has been applied to stocks considered likely to receive quota top-up on the basis of ICES advice for Seventeen of the 51 stocks included in the model are expected to receive quota top-up. See Appendix A for the quota top-up multipliers applied in the scenario analysis THE CHOKE POINT Historically catch of a stock in excess of quota holdings would have to be discarded. Under the landing obligation this can no longer occur. Once a vessel has fully caught their quota holdings for one stock, and cannot access further quota for that stock, it is assumed that the vessel will be required to stop fishing in the sea area where the stock might be caught, regardless of how much quota the vessel holds for other stocks in the same sea area. This is referred to as the choke point and the stock which causes the choke point is referred to as the primary choke stock. In the bioeconomic scenario analysis the choke point is measured using the number of fishing days a fleet segment is expected to be at sea for before the choke point occurs. The bioeconomic model is used to simulate when a choke point could occur for each fleet segment in each sea area, in each year and under each scenario. Different fleet segments can be expected to have different choke points and potentially different primary choke stocks. 10
16 Modelling the Impact of the Landing Obligation In the impact assessment, the calculated choke point is the main driver in determining the impact of the landing obligation CATCH RATES AND IMPACT OF CHANGES IN STOCK BIOMASS For stocks not assessed by ICES, the total catch of each stock prior to the choke point is estimated from a combination of catch rate per day (landings + discards in 2013) and effort (days). For ICES-assessed stocks the total catch is estimated from catchability, effort and biomass. Catch rates and catchability is tailored to each of the 50 fleet segments included in the model. The following description explains how the catch of a ICES-assessed stock could change as a result of biomass changes and the effect this would have in the model. If an assessed stock has previously been caught in volumes that are larger than will be possible under the landing obligation, because choke stocks halt fishing activity before the quota is fully caught, then the biomass of that stock can be expected to increase (if historic data suggests catch, fishing mortality and biomass are linked). Vessels catching a stock with an increasing biomass can be expected to catch more of this stock per day and therefore total catch per day, and landings, will increase. The bioeconomic model takes into account any changes in the expected biomass of a stock when calculating the expected catch of a particular stock throughout the period to An increase in biomass can also be expected to increase the TAC for an ICES-assessed stock, and again the model adjusts TAC to reflect rising biomass however if the catch of a stock is restricted by choke stocks that halt fishing activity before quota is fully caught, an increase in TAC would have no benefit. In the model biomass changes are limited to 5% per annum. Changes to TAC are also limited to 5% per annum. These assumptions are applied in order to maintain relatively stable catch rates, to take account of general dynamics and avoid uncertainty in parameters (including issues such as predator prey interactions), thus reducing uncertainty and fluctuations in the model results FUTURE TACS AND MSY TACs in the period modelled ( ) are informed by TACs in Section 3.7 described how the TACs for stocks assessed by ICES can be altered during the period modelled in response to changes to the biomass of a stock. For stocks expected to receive a quota top-up this is incorporated in the TAC for the stock when the stock becomes subject to the landing obligationerror! Reference source not found.. Except for when quota top-up is applied to the TAC of a stock, the model limits the annual change in TAC to a maximum of 5% of the previous TAC per annum. If the current mortality of a stock does not yet meet the mortality required for maximum sustainable yield (MSY) as defined by ICES, the TAC of a stock is adjusted down in the model until MSY is achieved. TAC adjustments to achieve MSY are also limited to a maximum of 5% per annum and the achievement of MSY is not linked to a timeframe in the model REVENUE Price for the landings of each stock is held constant at the average price achieved by each of the 50 fleet segments in For each fleet segment, revenue is calculated by applying the average price per stock to the total estimated landings of a stock. Revenue estimates in the model assume that all landings can achieve the average price achieved in However, landings in future may include fish that are under the minimum conservation reference size and therefore cannot be sold for human consumption. These landings would not achieve the average price achieved in The volume of under MCRS landings as a proportion of total landings is difficult to predict 11
17 Modelling the Impact of the Landing Obligation as it will be dependent on the extent to which vessels can implement technological and operational changes to avoid under MCRS fish. The potential effect of inflation is not estimated. Where revenue appears to be relatively high compared to revenue in 2013 and the number of days at sea expected to be available for a fleet segment, this is because the analysis expects there to be an increase in landings through either biomass improvements, and therefore TACs and total catch, or as a result of quota top-up TWO SCENARIO ANALYSES: INITIAL QUOTA ALLOCATION (IQA) AND END OF YEAR LANDINGS (EOY) Interim Report Two on the six home nation fleet segments presented a bioeconomic scenario analysis informed by end of year landings in End of year landings is assumed to be a proxy for quota held by different PO fleet segments at year end, i.e. after trading. However, it is unlikely that quota trading will continue as before once all demersal quota stocks are subject to the landing obligation in For example, quota stocks that were not previously in demand but are choke stocks under the landing obligation could become valuable in 2019; and fleet segments that previously traded out a high proportion of their whitefish quota to focus on nephrops or flatfish may hold on to whitefish quota to delay or avoid a potential choke stock. The effect on quota trading and whether additional or alternative quota trading could be used to meet emerging needs is not known. To understand the potential impact of historic patterns of trading the bioeconomic scenario analysis was undertaken twice. Once based on the initial quota allocation (IQA) to each fleet segment, to reflect the position if no trading takes place, and once based on end of year landings (EoY), to reflect trading continuing as before. To include all results from both analyses would create a substantial amount of data for the reader. In the Final Report the focus is on the EoY position. However each analysis chapter includes a choke point and revenue analysis that compares the findings from the IQA and EoY analyses. The eventual impact of quota trading on the potential choke point could reasonably be expected to lie somewhere in between the IQA and EoY outlooks. One outlook is not necessarily better for all fleet segments than the other. For some fleet segments the outlook is better under the IQA analysis and for others, who are more dependent on trading in quota, the outlook is better under the EoY analysis. The two sections below describe the assumptions used to determine how much quota a fleet segment has available under both the IQA and EoY analysis. INITIAL QUOTA ALLOCATION (IQA) The initial quota allocation analysis assumes that the fleet segment cannot access quota in addition to the quota allocated to the PO at the beginning of the year, i.e. no trading or swaps will occur. The results of the analysis are compared to the days at sea and revenue earned in 2013 which are based on a full year of activity in 2013 i.e. activity and earnings in 2013 was supported by trading and swaps. Therefore the scenario analysis based on initial quota allocation compares a situation in the future when no trading takes place to results from 2013, when trading did take place. This does not necessarily mean the findings from the IQA analysis are always worse than the findings from the EoY analysis. The scenario analysis based on IQA is informed by how much quota was held by a PO at the beginning of All quota is managed by a PO or a fishery administration. However, not all quota in a PO may be held on behalf of its member vessels and the quota which is held on behalf of members is unlikely to be available 12
18 Modelling the Impact of the Landing Obligation to all members equally as some may be held for specific vessels. However, as the bioeconomic model is built up from PO fleet segments some assumptions about access to initial quota allocation were required: Quota held by specific vessels is allocated to the fleet segment which the vessel is allocated to; Quota held by the PO, and not held on behalf of specific vessels, is distributed to PO fleet segments based on the proportion of landings in 2013 of each stock by the vessels allocated to each fleet segment. The bioeconomic scenario analysis assumes that the quota allocated to each fleet segment is available to all vessels in the PO fleet segment equally. It is understood that this may not reflect the intricacies of quota management but is the best methodology available for the scale of simulation that has been undertaken. END OF YEAR LANDINGS (EOY) The End of Year (EoY) scenario analysis was prepared to simulate the impact of the landing obligation and the policy levers on the PO fleet segments if, under the landing obligation, the fleet segment is still able to access the same quota available to them in The landings made by all vessels in a PO fleet segment in 2013 is used as a proxy for the quota held by that PO fleet segment in 2013, after the effects of quota trading and swaps. The bioeconomic scenario analysis assumes that the quota held by each fleet segment is available to all vessels in the PO fleet segment equally. No further assumptions were required TRANSITIONAL PERIOD, Landing Obligation Economic Impact Assessment (LOEIA), Interim Report Two: Scenario Analysis published by Seafish on 31 August 2015 made assumptions about which stocks would be subject to the landing obligation during the transitional period ( ). These assumptions were based on the information contained in Article 15. Since the model was first developed the Regional Groups have submitted more detailed proposals for the transitional period ( ) or only for The analyses included in the Final Report are based on the proposals submitted by the Regional Groups. In North Western Waters the scenario analysis uses the agreed rules for 2016 to produce the assumptions for Areas VI and VII. The analysis then assumes that all other stocks specified in Article 15 as subject to the landing obligation prior to 2019 become subject to the landing obligation in Areas VI and VII in The year in which stocks are assumed to be subject to the landing obligation for each fleet segment is shown in Table 3-1. The assumptions on the transitional period are the same for the IQA scenario analysis and the EoY scenario analysis. 13
19 Table 3-1: Transitional rules for 2016 and assumed rules for 2017 and 2018 Fishery Haddock, cod, whiting, saithe Nephrops Plaice and Sole Fleet Segment Whitefish trawl/seine Nephrops trawl Beam trawl** Sea Area IV Modelling the Impact of the Landing Obligation Demersal quota stocks subject to the landing obligation, Plaice, Haddock, Whiting, Cod, Sole, Saithe (*Saithe) Nephrops Haddock, Cod, Haddock 6A & 7A Whiting, Saithe VI & VII IV Nephrops, Sole Whiting, Haddock Plaice, Saithe, Cod VI & Nephrops, Haddock VII 6A IV Plaice Nephrops, Sole, Haddock, Whiting Saithe, Cod VI & Plaice, Sole VII IV Hake Longliners and Hake VI & Gillnetters Hake, Sole VII *Saithe is included in the proposals for vessels with over 50% average landings of saithe during a reference period, the obligation to land saithe in 2016 is not included in the analysis as, under the analysis for 2013, only two vessels in the UK whitefish trawl/seine fleet may fall under this requirement. **Beam trawls are assumed to follow BT1 for transition (For BT2 sole is scheduled to be implemented in 2016 and plaice in 2018) EFFORT The bioeconomic model assumes that for each PO fleet segment the total number of days at sea recorded in each sea area by its member vessels in 2013 is the maximum number of days that the PO fleet segment can be at sea in each sea area in the future. Throughout the period of the analysis, effort only differs from 2013 days at sea if a choke point occurs DISCARD RATES The ICES advice and discard rates used in the model relate to Discard rates are based on survey data from Marine Scotland, Centre for Fisheries and Aquatic Science (CEFAS) and Agri-food and Biosciences Institute (AFBI). The discard rates used for each fleet segment type are presented in Appendix B. Discards in 2013, as a result of minimum landing sizes, are included in the discard rate assumption. Observed discard rates are critical to the calculation of catch rate and therefore potential choke point. However recorded discard rates are based on a sample of trips. This does introduce some uncertainty and may not always reflect what fishermen are experiencing. For example hake is recognised to be a growing problem in the North Sea because there is a very small UK quota, 348 tonnes in 2013 (although hake in Area VI has a much larger quota and this can be used in Area IV), and reports of recent catches suggest there is a substantial and growing biomass that makes it increasingly difficult for fishermen to avoid the stock. In the bioeconomic scenario analysis hake IV rarely appears as a primary choke stock under baseline or policy lever scenarios in the North Sea. The discard rate used in the analysis for hake for the Scotland whitefish PO fleet segments in the North Sea (Area IV) is 36%, as observed in However, a study undertaken of vessels in the Shetland fleet in 2013/14 suggests that the discard rate could be as high as 90% in parts of the North Sea SCENARIO DEFINITIONS The bioeconomic scenario analysis includes eleven scenarios. The scenarios have been developed by the project team and do not necessarily represent what will actually occur under each of the exemptions and 14
20 Modelling the Impact of the Landing Obligation derogations. Although there is more clarity on the likely interpretation of the exemptions and derogations now, there remains some uncertainty. However, to reflect recent developments the survivability scenario has been reduced to only include skates and rays and the most likely de minimis scenario is now considered to be 1C, De Minimis Strict. The scenarios are divided into three types: baseline scenarios; single policy lever scenarios; and combined policy lever scenarios. Each type and the individual scenarios are described below. BASELINE SCENARIOS There are three baseline scenarios. Baseline scenarios are those that could exist prior to the introduction of any policy lever scenarios which incorporate de minimis, interspecies flexibility or survivability. Therefore, of the eleven scenarios, the baseline scenarios present the worst outlook for the fleet segments. Scenario B1 Baseline Scenario B1 presents the effect of introducing the landing obligation with no associated policy adjustments, except the transitional rules prior to Scenario B2 Baseline Scenario B2 presents the effect of scenario B1 plus a catch allowance for stocks which have no quota allocated to POs, referred to as zero-tac stocks in the remainder of this report. The catch allowance in baseline scenario B2 means that a stock for which no quota is allocated can be caught, i.e. cod VIa, cod VIband Whiting in Area VI, but catch is restricted to no more than 1.5% of total PO fleet segment catch. Scenario B3 Baseline Scenario B3 presents the effect of scenario B2 plus the application of quota top-up, where available. Quota top-up is calculated according to ICES information from 2012 (see Appendix A) and applied to each stock in the year that the stock first becomes subject to the landing obligation. 100% of quota top-up is allocated to fleet segments. As in scenario B2, a zero-tac stock can be caught e.g. cod 6A, cod 6B and whiting in Area VI, but catch is restricted to no more than 1.5% of total PO fleet segment catch. The single and combined policy lever scenarios which follow are all applied to baseline scenario B3. Therefore the findings under each single and combined policy lever scenario incorporate a catch allowance for zero-tac stocks and quota top-up. SINGLE POLICY LEVER SCENARIOS Scenarios 1A to 3 estimate the potential impact of the exemptions and derogations referred to as de minimis, interspecies flexibility and survivability. These exemptions and derogations are all introduced in Article 15 and the term used for them in the report is policy levers. The scenario analysis applied five single policy lever scenarios under which each exemption and derogation operates in isolation. When the model was first developed de minimis had the broadest potential scope as a question remained over what the 5%, referenced in Article 15, was going to be a percentage of. Therefore three different de minimis scenarios were tested to demonstrate its potential scope. However, as time has progressed it has become clear that the strictest definition of de minimis most closely reflects likely reality. Further, the de minimis strict scenario applied in the model appears more generous as de minimis may be in reality. In the model it is assumed that de minimis will be available for all stocks and that the exemption of 15
21 Modelling the Impact of the Landing Obligation 5% would be applied in addition to TAC. However recent developments and comments from the Commission suggest: de minimis will be an exemption of last resort; and de minimis exemptions will be deducted from TAC. For these reasons the only de minimis scenario presented in the report is scenario 1C, de minimis strict. However all three de minimis scenarios that were tested are described below. Article 15 allows for a transitional increase in de minimis and therefore in the model in 2016 the percentage of catch that can be discarded is 7%, in 2017 the percentage is 6% and in 2018 the percentage becomes and then remains 5%. The analysis presented references de minimis as an exemption of 5% but all three de minimis scenarios have incorporated the transitional approach as described. Scenario 1A De Minimis Lax presents the outcome if the landing obligation is introduced as per scenario B3 plus a de minimis exemption that means 5% of the total catch of demersal quota stocks by a PO fleet segment can be discarded. The de minimis exemption modelled in scenario 1A is not stock specific and is calculated on the total catch of the PO fleet segment, not the quota or catch of a specific stock. Scenario 1B De Minimis Mid presents the outcome if the landing obligation is introduced as per baseline scenario B3 plus a de minimis exemption that means a stock can be discarded as long as total discards of that stock in the UK do not exceed 5% of the EU TAC for the stock. In the model all stocks are theoretically included in this exemption, however in the model it is only used for choke stocks. Scenario 1C De Minimis Strict presents the outcome if the landing obligation is introduced as per baseline scenario B3 plus a de minimis exemption that means a stock can be discarded as long as total discards in the UK do not exceed 5% of the UK quota for the stock. In the model all stocks are theoretically included in this exemption, however in the model it is only used for choke stocks. The bioeconomic model allocates the de minimis allowance to every fleet segment in the UK, including nonsector fleet segments. The allocation is undertaken using an incremental increase of one day to every fleet segment per stock. Each fleet segment s expected catch of the stock in one day is the volume allocated from the de minimis exemption. The increase of one day to each fleet segment continues until the UK fleet segments cannot receive another full day as the remaining de minimis allowance is insufficient to support another one full day of fishing across the UK. Scenario 2 Interspecies flexibility presents the outcome if the landing obligation is introduced as per baseline scenario B3 plus a derogation that means the catch of a stock that exceeds the quota held by a PO fleet segment AND is a stock that is considered to be within safe biological limits (as informed by ICES and shown in Appendix A) can be covered by quota from another stock (up to a maximum of 9% per stock) from the same, or a different, sea area. TACs in future years will reflect any expected stock biomass impacts. Although all stocks within safe biological limits can receive a transfer of quota, in reality interspecies flexibility is only applied to choke stocks and only until a stock that is not within safe biological limits becomes the primary choke stock. For example in the model cod quota from Area IV can be transferred to delay a choke point created by saithe in Area VI. This can be achieved because saithe is considered to be within safe biological limits. Note: In this example, the additional catch of saithe, in excess of the quota allocated, would be taken into account in the analysis through the biomass calculations for saithe. Any change in the biomass of saithe has the potential to affect the future catch of saithe and the saithe TAC. 16
22 Modelling the Impact of the Landing Obligation Scenario 3 Survivability presents the outcome if the landing obligation is introduced as per baseline scenario B3 plus an exemption that means all catch in excess of quota holdings for stocks that are considered to have a good chance of survival can be discarded. Scenario 3 in the PO analysis assumes that only skates and rays can be discarded under this exemption. This is a more restricted definition than was used in the published interim report. The scenario analysis presented in Interim Report Two assumed that skates and rays, plaice, sole, lemon sole, dabs and turbot would be exempt from the landing obligation under the survivability scenario. COMBINED POLICY LEVER SCENARIOS If introduced, the policy levers described in scenarios 1A to 3 are expected to operate in combination, rather than in isolation. Therefore the analysis has combined each of the three de minimis scenarios with the interspecies flexibility scenario and the survivability scenario to create three combined policy lever scenarios. Scenario 4a De minimis LAX, interspecies flexibility and survivability (scenarios 1A, 2 and 3) are all applied to baseline scenario B3 to estimate the combined impact of the different policy levers. Scenario 4b De minimis MID, interspecies flexibility and survivability (scenarios 1B, 2 and 3) are all applied to baseline scenario B3 to estimate the combined impact of the different policy levers. Scenario 4c De minimis STRICT, interspecies flexibility and survivability (scenarios 1C, 2 and 3) are all applied to baseline scenario B3 to estimate the combined impact of the different policy levers. As stated above, at this time de minimis strict (scenario 1C) is thought to most closely resemble the proposals for implementing de minimis and therefore only the findings for combined policy lever scenario 4C are presented in the remainder of this report. 17
23 England Whitefish Trawl/Seine Scenario Analysis 4. ENGLAND WHITEFISH TRAWL/SEINE SCENARIO ANALYSIS The England whitefish trawl/seine fleet segment is made up of five PO fleet segments defined in the model. The findings presented in the chapter are an aggregation of the findings for these PO fleet segments under five of the policy lever scenarios tested. The analysis presents the potential consequences of the landing obligation for the England whitefish trawl/seine fleet segment, should the fleet continue to fish as it did in 2013, and the mitigation that could be offered by different policy lever scenarios. All scenarios assume the fleet continues to fish in the same way as it did in Unless otherwise stated, all analyses presented are from the end of year scenario analysis, which incorporates patterns of quota trading by the fleet segment in Chapter 4 presents the following analyses for the England whitefish trawl/seine fleet segment: Characteristics of the fleet segment; Findings from the worst case scenario tested in the model i.e. the potential consequence of the landing obligation should no policy measures such as quota top-up be applied and should the fleet continue to fish as it did in 2013; The impact of five policy scenarios on the revenue of the fleet; The impact of five policy scenarios on the choke stocks that could be encountered by the England whitefish trawl/seine fleet segment in its main sea areas and under each scenario; The top five choke stocks that the fleet segment could encounter under two scenarios in 2016, 2017, 2018 and 2019 and how the choke point might be delayed if a solution can be found for the primary choke stocks; and A comparison of the revenue results and choke points for the fleet segment between the scenario analysis based on end of year landings (EoY) and the scenario analysis based on initial quota allocation (IQA). 18
24 England Whitefish Trawl/Seine Scenario Analysis 4.1. CHARACTERISTICS OF THE ENGLAND WHITEFISH TRAWL/SEINE FLEET SEGMENT Number of vessels in 2013: 84 vessels Days at sea in 2013: Area IV (North Sea) 3,694 days Area VI (West of Scotland) 121 days Area VII 10,128 days Total 13,943 days Top 5 stocks landed in 2013 (by value in 000s): Haddock IV 4,175 Cod IV 3,731 Anglerfish VII 3,171 Saithe IV 2,914 Plaice IV 2,598 Total Revenue in 2013 ( 000s): Demersal quota stocks 25,582 PO fleet segments included in the fleet segment: Anglo-Scottish FPO Cornish FPO Eastern England FPO South Western FPO Other England Whitefish Trawl/Seine Vessels Other England Whitefish Trawl/Seine Vessels is a fleet segment created from PO whitefish trawl/seine fleet segments with fewer than five vessels. Other Whitefish Trawl/Seine Vessels includes vessels from the following POs: Fleetwood FPO Lowestoft FPO The FPO 4.2. WORST CASE SCENARIO, BASELINE SCENARIO B1 The model uses all of the data available to simulate when a choke point could occur for the England whitefish trawl/seine fleet segment in each sea area, in each year and under each scenario. The worst case scenario applied in the model, baseline scenario B1, represents the introduction of the landing obligation without any mitigating policy actions i.e. no catch allowances for zero-tac stocks, no quota top-up, no exemptions or derogations and it is assumed that the fleet will continue to fish as it did in Under baseline scenario B1 the revenue of the England whitefish trawl/seine fleet segment is relatively unaffected in 2016 as revenue is expected to be 104% of 2013 levels. However by 2019, when all demersal quota stocks become subject to the landing obligation the revenue of the fleet segment could fall to 20% of
25 England Whitefish Trawl/Seine Scenario Analysis revenue under the worst case scenario included in the model. Baseline scenario B1 is not reported on in the remaining analysis as it considered extremely unlikely that no policy levers will be applied IMPACT OF POLICY LEVER SCENARIOS: FLEET REVENUE The bioeconomic scenario analysis investigates the relative value of different policy levers to the England whitefish trawl/seine fleet segment. The potential revenue impact on the fleet of the following five scenarios is presented: baseline scenario B3 (after quota top-up and catch allowances for zero-tac stocks but before exemptions and derogations); single policy lever scenario 1C de minimis STRICT, where 5% of UK quota for a choke stock can be discarded and not counted against total TAC; single policy lever scenario 2 interspecies flexibility, where a choke stock that is known to be within safe biological limits can receive a quota transfer from another stock on a kg for kg basis; single policy lever scenario 3 survivability exemption for skates and rays; and combined policy lever scenario 4C combined effect of single policy levers 1C, 2 and 3. Further detail on the scenarios can be found in Chapter 3, Section The estimated revenue under each scenario is shown as a percentage of the revenue earned by the fleet in Only revenue from demersal quota stocks is included in the analysis presented. Of the five scenarios, baseline scenario B3 will always show the weakest revenue, and combined policy lever 4C will always show the strongest revenue. If the revenue estimated under a policy lever scenario is greater than revenue estimated under baseline scenario B3 then the policy lever is generating a positive impact for the fleet segment by delaying or removing choke points. SUMMARY FINDINGS: FLEET REVENUE Figure 4-1 shows that in 2016 the estimated revenue for the England whitefish trawl/seine fleet segment under all scenarios, including baseline scenario B3, is higher (109%) than the revenue earned by the fleet from demersal quota landings in The model limits effort to the number of days used by the England whitefish trawl/seine fleet segment in 2013 therefore estimated revenue in excess of 100% of 2013 revenue occurs because: the fleet is benefitting from quota top-up for eligible quota stocks and therefore catch that was previously discarded can now be landed and sold; or a biomass improvement for ICES-assessed stocks has increased total catch; and there are no choke stocks expected or any choke stock has a minimal impact on effort. In 2017 under baseline scenario B3, choke stocks could limit revenue to 95% of 2013 revenue. However the application of either policy lever scenario 1C (de minimis) or scenario 2 (interspecies flexibility) delays the choke points and as a result revenue could exceed the revenue earned in 2013 (111% and 112% respectively). In 2018, scenario 1C (de minimis) and scenario 2 (interspecies flexibility) continue to delay the choke points expected under baseline scenario B3. However for the choke stocks expected in 2018, interspecies flexibility is expected to have greater benefit than de minimis. In 2019 when the landing obligation is fully implemented for demersal quota stocks, it is estimated that under baseline scenario B3 choke stocks could reduce the revenue of the England whitefish trawl/seine fleet 20
26 Estimated revenue from demersal quota landings as a % of 2013 revenue from demersal quota landings England Whitefish Trawl/Seine Scenario Analysis segment to 26% of 2013 revenue. In isolation, policy lever scenario 1C (de minimis) has the most effect and combines with the other scenarios to increase potential revenue to 35% of 2013 revenue under scenario 4C. 120% 100% 80% 60% 40% 20% 0% Baseline B3 109% 95% 79% 26% 24% 23% 22% Scenario 1c 109% 111% 85% 34% 30% 28% 27% Scenario 2 109% 112% 108% 27% 26% 25% 24% Scenario 3 109% 95% 79% 26% 24% 23% 22% Scenario 4c 109% 114% 110% 35% 32% 30% 28% Figure 4-1: Relative impact of different policy lever scenarios on the estimated revenue from demersal quota stock landings by the England whitefish trawl/seine fleet segment, (analysis based on end of year landings) 4.4. IMPACT OF POLICY LEVER SCENARIOS: CHOKE STOCKS The graph above highlights that as the fleet segment moves towards full implementation of the landing obligation in 2019 that the revenue of the fleet segment could fall below revenue earned in Revenue is restricted to less than 100% of the revenue earned in 2013 because the England whitefish trawl/seine fleet segment is expected to encounter a choke stock before it can equal the number of days the fleet fished in The next four tables present the revenue findings for the England whitefish trawl/seine fleet segment alongside the choke stocks, and their associated choke point, in each sea area. The sea areas presented for the England whitefish trawl/seine fleet segment are the sea areas where the fleet fished for more than 10% of its total days at sea in Each table contains the findings from the bioeconomic scenario analysis for one year (2016, 2017, 2018 or 2019). Each table presents: The estimated revenue that could be earned by the fleet under each scenario, as summarised in the analysis above; The expected choke stock(s) in each sea area under each scenario; The estimated choke point for each choke stock, shown as a percentage of 2013 days at sea in each sea area; and An explanation as to why the scenario has, or does not have, an impact on the fleet segment. 21
27 Table 4-1: Bioeconomic Scenario Analysis Findings for 2016 England Whitefish Trawl/Seine Fleet Segment (analysis based on end of year landings) Estimated revenue from Scenarios Primary choke stock and choke point demersal quota stocks Revenue as % points Choke point Comment Primary Choke Ref Description % of 2013 above Area as % of 2013 Stock(s) revenue scenario B3 days B3 1C 2 3 4C Introduction of LO with catch allowance for zero-tac stocks and quota top-up De minimis strict: 5% of UK share of TAC can be discarded Interspecies flexibility for stocks considered to be in safe biological limits Survivability: skates and rays only Combination of scenarios 1C, 2 and England Whitefish Trawl/Seine Scenario Analysis IV No choke - In 2016 revenue under baseline scenario B3 is estimated to exceed revenue earned from demersal quota stocks in 2013 by nine percentage points. This is because no VII No choke - choke stocks are expected and quota top-up means that fish previously discarded can be landed and sold Policy levers are not required as no choke stocks are identified for Policy levers are not required as no choke stocks are identified for Policy levers are not required as no choke stocks are identified for Policy levers are not required as no choke stocks are identified for
28 England Whitefish Trawl/Seine Scenario Analysis Table 4-2: Bioeconomic Scenario Analysis Findings for England Whitefish Trawl/Seine Fleet Segment (analysis based on end of year landings) Estimated revenue from Scenarios Primary choke stock and choke point demersal quota stocks Revenue as % points Choke point Comment Primary Choke Ref Description % of 2013 above Area as % of 2013 Stock(s) revenue scenario B3 days Introduction of LO with catch IV Sole IV 79 In 2016 revenue under baseline scenario B3 is estimated to be 95% of revenue B3 allowance for zero-tac stocks 95 - earned from demersal quota stocks in 2013 as choke stocks could be encountered and quota top-up VII Whiting VIIb-k 83 in Areas IV and VII. 1C De minimis strict: 5% of UK share of TAC can be discarded IV Sole IV 99 VII Whiting VIIb-k 88 Under de minimis strict the revenue of the fleet could be 16 percentage points higher than under baseline scenario B3 and exceed the revenue earned by the fleet in Although choke stocks are still encountered the application of quota uplift boosts revenue as catch that was previously discarded can now by landed and sold. De minimis strict is not expected to change the primary choke stock in Areas IV and VII but could delay the choke points by 20 and 5 percentage points respectively, compared to baseline scenario B Interspecies flexibility for stocks considered to be in safe biological limits Survivability: skates and rays only Under interspecies flexibility the revenue of the fleet could be 17 percentage IV No choke - points higher than under baseline scenario B3 and exceed the revenue earned by the fleet in Interspecies flexibility is used in Area IV to remove sole as a potential choke stock and no other choke stocks are identified for Area IV in Interspecies flexibility can also be used in Area VII to delay the choke point caused VII Whiting VIIb-k 88 by whiting VIIb-k, compared to baseline scenario B3. However, there is insufficient unused quota to fully avoid it as a choke stock. IV Sole IV 79 Sole IV and Whiting VIIb-k are not considered survivable in scenario 3 therefore the VII Whiting VIIb-k 83 scenario has no benefit compared to baseline scenario B3. 4C Combination of scenarios 1C, 2 and IV No choke - The combination of de minimis strict, interspecies flexibility and survivability does create additional revenue benefit compared to any single policy lever working in isolation. The benefit occurs in Area VII as the choke point is delayed by 7 VII Whiting VIIb-k 95 percentage points compared to scenarios 1C and 2. 23
29 England Whitefish Trawl/Seine Scenario Analysis Table 4-3: Bioeconomic Scenario Analysis Findings for England Whitefish Trawl/Seine Fleet Segment (analysis based on end of year landings) Estimated revenue from Scenarios Primary choke stock and choke point demersal quota stocks Revenue as % points Choke point Comment Primary Choke Ref Description % of 2013 above Area as % of 2013 Stock(s) revenue scenario B3 days Introduction of LO with catch IV Saithe IV 54 In 2016 revenue under baseline scenario B3 is estimated to be 79% of revenue B3 allowance for zero-tac stocks 79 - earned from demersal quota stocks in 2013 as choke stocks could be encountered and quota top-up VII Whiting VIIb-k 83 in Areas IV and VII. 1C 2 3 4C De minimis strict: 5% of UK share of TAC can be discarded Interspecies flexibility for stocks considered to be in safe biological limits Survivability: skates and rays only Combination of scenarios 1C, 2 and IV VII Saithe IV Whiting VIIb-k Under de minimis strict the revenue of the fleet could be 6 percentage points higher than under baseline scenario B3. De minimis strict would not change the primary choke stocks in Areas IV and VII but it would delay the choke points in both sea areas. The delay would equate to an additional 7 percentage points of 2013 effort in Area IV and 5 percentage points in Area VII. Under interspecies flexibility the revenue of the fleet could be 29 percentage IV Saithe IV 86 points higher than under baseline scenario B3 and exceed the revenue earned by the fleet in Interspecies flexibility could be used in both Area IV and Area VII but there is VII Whiting VIIb-k 88 insufficient unused quota to fully eliminate the choke. Scenario 2 could delay the choke point in 2018 by 32 percentage points in Area IV and 5 percentage points in Area VII, compared to baseline scenario B3. IV Saithe IV 54 Neither saithe nor whiting are considered survivable in scenario 3 therefore the scenario has no benefit compared to baseline scenario B3. VII Whiting VIIb-k 83 IV Saithe IV 88 VII Whiting VIIb-k 95 The combination of de minimis strict, interspecies flexibility and survivability does create additional revenue benefit in Areas IV and VII compared to any single policy lever and is estimated to exceed revenue earned in 2013 by 10%. The combination does not change the primary choke stocks expected under other scenarios in Areas IV and VII but the scenario does delay the choke points compared to the next best single policy lever, scenario 2. 24
30 Table 4-4: Bioeconomic Scenario Analysis Findings for England Whitefish Trawl/Seine Fleet Segment (analysis based on end of year landings) Estimated revenue from Scenarios demersal quota stocks 2 Primary choke stock and choke point Revenue as % points Choke point Comment Primary Choke Ref Description % of 2013 above Area as % of 2013 Stock(s) revenue scenario B3 days B3 1C 2 3 4C Introduction of LO with catch allowance for zero-tac stocks and quota top-up De minimis strict: 5% of UK share of TAC can be discarded Interspecies flexibility for stocks considered to be in safe biological limits Survivability: skates and rays only Combination of scenarios 1C, 2 and IV Dab IV 5 VII Plaice VIIde 55 IV Dab IV 10 VII Plaice VIIde 64 England Whitefish Trawl/Seine Scenario Analysis In 2016 under baseline scenario B3 revenue is estimated to be 26% of revenue earned from demersal quota stocks in 2013 as dab and plaice could be choke choke in Areas IV and VII respectively. Dab in Area IV is expected to create a choke point for the England whitefish fleet in only 5% of the number of days at sea used in Under de minimis strict the revenue of the fleet could be 19 percentage points higher than under baseline scenario B3 De minimis strict is not expected to change the primary choke stock in Areas IV and VII, but would delay the choke point for dab in Area IV by 5 percentage points and for plaice VIIde in Area VII by 9 percentage points, compared to baseline scenario B3. IV VII Dab IV Plaice VIIde 5 55 Under interspecies flexibility the revenue of the fleet could be one percentage point higher than under baseline scenario B3. Interspecies flexibility cannot be used for dab in Area IV as the stock was not known to be in safe biological limits in 2013 and cannot be used for plaice in Area VII. The small improvement in revenue is created by a positive impact from interspecies flexibility in Area VI. The choke stocks and choke points in Area VI are not presented as the fleet spent less than 10% of its time in Area VI in IV Dab IV 5 Dab and plaice are not considered survivable in scenario 3 therefore the scenario VII Plaice VIIde 55 has no benefit compared to baseline scenario B3. The combination of de minimis strict, interspecies flexibility and survivability could IV Dab 10 create additional revenue benefit (1 percentage point) compared to single policy lever scenario 1C. However the choke points in Areas IV and VII remain the same as under scenario 1C. The small revenue benefit occurs because the fleet did VII Plaice VIIde 64 spend some time in Area VI and interspecies flexibility removes hake as a potential choke stock in Area VI which delays the choke point by 29 days for the whole fleet. 2 Revenue for the fleet includes revenue earned from demersal quota stocks in all three sea areas (IV, VI and VII), information on choke stocks and choke points is only provided for the sea areas where the fleet spent more than 10% of total days in
31 England Whitefish Trawl/Seine Scenario Analysis 4.5. IMPACT OF POLICY LEVER SCENARIOS: TOP 5 CHOKE STOCKS UNDER SCENARIO 4C The table which follows presents the top five choke stocks for the England whitefish trawl/seine fleet segment and their estimated choke point under combined policy lever 4C in 2016, 2017, 2018 and The choke points are presented in the number of fishing days available to the aggregated fleet segment for a particular stock. The days shown are the sum of the choke points calculated for each stock for individual PO fleet segments included in the England whitefish trawl/seine fleet segment. The stock with the earliest choke point, i.e. the least number of days across all PO fleet segments included in the England whitefish trawl/seine fleet segment, is identified as the primary choke stock for the aggregated fleet segment. It is possible that each PO fleet segment has a different primary choke stock and the choke point will vary for different PO fleet segments. The purpose of presenting the top five choke stocks is: to show which other stocks, in addition to the primary choke stock, could create a potential choke point for the England whitefish trawl/seine fleet segment; and to provide information on the top 5 potential chokes so that if the reader considers that a solution can be found for the primary choke stock, or believes that the primary choke stock is wrong, it is possible to identify when the next choke point could occur and the stock that could cause it. It is possible that more than one primary choke stock exists, i.e. the top two, three or four choke stocks all share the same choke point. This is more likely to occur under the combined policy lever scenario as the exemptions and derogations can balance the choke point between stocks. SUMMARY FINDINGS: TOP 5 CHOKE STOCKS Table 4-5 presents the top five choke stocks expected under the best case scenario in the presented analysis, combined policy lever scenario 4C. In 2019 under scenario 4C the primary choke stocks for the England whitefish trawl/seine fleet segment are expected to be: dabs in Area IV, with the choke point expected at 10% of the days fished in Area IV in 2013; and plaice VIIde in Area VII, with the choke point expected at 64% of the days fished in Area VII in Should avoidance measures be expected to address these choke stocks, or if it is believed that the true discard rate for the stock is less than the discard rate used in the analysis, then the second choke stocks could become more important. Once all policy levers have been applied and a choke point has occurred, the model does not continue to try to find policy solutions for the second, third or fourth choke stocks. Therefore if the primary choke stocks can be addressed through other mitigation measures, or are believed unlikely to occur in the future, then policy levers might be available to delay the choke point identified for the secondary choke stocks in the table. For example, the analysis shows if dabs IV can be removed as the primary choke stock the choke point could be delayed by at least 42 percentage points, and the primary choke stock could be saithe IV. Furthermore in the model, saithe IV is considered eligible for interspecies flexibility and a further delay may be possible. In Area VII, if the England whitefish trawl/seine fleet segment can avoid choking on all plaice stocks the next choke stock could be whiting VIIb-k which has an estimated choke point of 83% of the days fished in Furthermore, interspecies flexibility could apply to whiting VIIb-k to further delay the estimated choke point. 3 The scenario analysis treats Area VII as a single sea area and activity in each sub-area of Area VII is averaged across the year. See Chapter 3, Section 3.4 for further information on the analysis in Area VII. 26
32 England Whitefish Trawl/Seine Scenario Analysis Table 4-5: England whitefish trawl/seine fleet segment - Top five choke stocks in Areas IV and VII in 2016, 2017, 2018 and 2019 under combined policy lever scenario 4C Area IV (North Sea) Area VII Choke Stock Choke Point Choke Point Choke Point Choke Point Choke Stock Choke Stock Choke Stock Days % of 2013 Days % of 2013 Days % of 2013 Days % of 2013 No choke No choke Saithe IV 3,244 88% Dabs IV % Sole IV 3,474 94% Saithe IV 1,923 52% Haddock IV 3,513 95% Hake IV 2,496 68% Cod IV 3,666 99% Ling IV 2,556 69% Tusk IV 2,663 72% No choke Whiting VIIb-k 9,631 95% Whiting VIIb-k 9,591 95% Plaice VIIde 6,454 64% Haddock VIIb-k 10,048 99% Saithe VII 10,028 99% Plaice VIIfg 6,886 68% Saithe VII 10, % Haddock VIIb-k 10,029 99% Plaice VIIh-k 8,170 81% Whiting VIIb-k 8,448 83% Pollack VII 9,893 98% 27
33 4.6. IMPACT OF QUOTA TRADING PATTERNS IN 2013 England Whitefish Trawl/Seine Scenario Analysis The findings presented for the England whitefish trawl/seine fleet segment above are from the bioeconomic scenario analysis that is based on end of year landings by the fleet segment. However, the bioeconomic scenario analysis was undertaken twice: Once based on initial quota allocation (IQA) in 2013 to the 50 fleet segments in the model; and Once based on end of year landings (EoY) by each fleet segment in End of year landings was taken as proxy for quota held at year end and therefore incorporates the impact of in-year quota trading. The purpose of undertaking the analysis twice was to understand the extent that historic patterns of quota trading from 2013 could change the outlook for the fleet segments once the landing obligation is implemented. See Chapter 3, section 3.10 for further explanation of the differences between and the characteristics of the two analyses. The quota trading which occurred in 2013 is not a fleet response to the landing obligation but the comparison does show how quota trading can have an influence on the outcome for different fleets and highlights vulnerability should quota trading be substantively affected by the landing obligation. The figures which follow compare findings for the England whitefish trawl/seine fleet segment under combined policy lever scenario 4C from the IQA and EoY analyses: Figure 4-2 compares the estimated number of days the fleet could be fishing prior to a choke point being encountered in Areas IV, VI and VII under the IQA and EoY analyses in the years ; and Figure 4-3 compares the estimated revenue that could be earned by the England whitefish trawl/seine fleet segment before choke under the IQA and EoY analyses in the years The findings from both analyses are shown as a percentage of days at sea and revenue in
34 England Whitefish Trawl/Seine Scenario Analysis 120% 100% 80% 100% 96% 96% 93% 85% 79% 60% 40% 50% 43% 20% 0% IQA Choke Point EOY Choke Point Figure 4-2: England whitefish trawl/seine fleet segment: comparison of choke point between IQA and EOY bioeconomic scenario analyses. Choke point shown as a % of days at sea in % 100% 109% 114% 110% 80% 60% 80% 82% 72% 40% 20% 0% 35% 31% IQA Revenue EOY Revenue Figure 4-3: England whitefish trawl/seine fleet segment: comparison of estimated revenue from demersal quota stocks between IQA and EOY bioeconomic scenario analyses. Revenue shown as a % of revenue earned from demersal quota stocks in
35 5. ENGLAND NEPHROPS TRAWL SCENARIO ANALYSIS England Nephrops Trawl Scenario Analysis The England nephrops trawl fleet segment is made up of two PO fleet segments. The findings presented in the chapter are an aggregation of the findings for these PO fleet segments under five of the policy lever scenarios tested. The analysis presents the potential consequences of the landing obligation for the England nephrops trawl fleet segment, should the fleet continue to fish as it did in 2013, and the mitigation that could be offered by different policy lever scenarios. All scenarios assume the fleet continues to fish in the same way as it did in Unless otherwise stated, all analyses presented are from the end of year scenario analysis, which incorporates patterns of quota trading by the fleet segment in Chapter 5 presents the following analyses for the England nephrops trawl fleet segment: Characteristics of the fleet segment; Findings from the worst case scenario tested in the model i.e. the potential consequence of the landing obligation should no policy measures such as quota top-up be applied and should the fleet continue to fish as it did in 2013; The impact of five policy scenarios on the revenue of the fleet; The impact of five policy scenarios on the choke stocks that could be encountered by the England nephrops trawl fleet segment in its main sea areas and under each scenario; The top five choke stocks that the fleet segment could encounter under two scenarios in 2016, 2017, 2018 and 2019 and how the choke point might be delayed if a solution can be found for the primary choke stocks; and A comparison of the revenue results and choke points for the fleet segment between the scenario analysis based on end of year landings (EoY) and the scenario analysis based on initial quota allocation (IQA). 30
36 England Nephrops Trawl Scenario Analysis 5.1. CHARACTERISTICS OF THE ENGLAND NEPHROPS TRAWL FLEET SEGMENT Number of vessels in 2013: 28 vessels Days at sea in 2013: Area IV (North Sea) 3,018 days Area VI (West of Scotland) 656 days Area VII 0 days Total 3,674 days Top 5 stocks landed in 2013 (by value in 000s): Nephrops IV 3,312 Nephrops VI 772 Haddock IV 297 Whiting IV 186 Anglerfish IV 98 Total Revenue in 2013 ( 000s): Demersal quota stocks 4,874 PO fleet segments included in the fleet segment: Anglo-Scottish FPO Eastern England FPO 5.2. WORST CASE SCENARIO, BASELINE SCENARIO B1 The model uses all of the data available to simulate when a choke point could occur for the England nephrops trawl fleet segment in each sea area, in each year and under each scenario. The worst case scenario, baseline scenario B1, represents the introduction of the landing obligation without any mitigating policy actions i.e. no catch allowances for zero-tac stocks, no quota top-up, no exemptions or derogations and it is assumed that the fleet will continue to fish as it did in Under baseline scenario B1 the revenue of the England nephrops trawl fleet segment is expected to be 79% of 2013 levels. However by 2019, when all demersal quota stocks become subject to the landing obligation the revenue of the fleet segment could fall to 13% of 2013 revenue under the worst case scenario included in the model. Baseline scenario B1 is not reported on in the remaining analysis as it considered extremely unlikely that no policy levers will be applied IMPACT OF POLICY LEVER SCENARIOS: FLEET REVENUE The bioeconomic scenario analysis investigates the relative value of different policy levers to the England nephrops trawl fleet segment. The potential revenue impact on the fleet of the following five scenarios is presented: baseline scenario B3 (after quota top-up and catch allowances for zero-tac stocks but before exemptions and derogations); single policy lever scenario 1C de minimis STRICT, where 5% of UK quota for a choke stock can be discarded and not counted against total TAC; 31
37 England Nephrops Trawl Scenario Analysis single policy lever scenario 2 interspecies flexibility, where a choke stock that is known to be within safe biological limits can receive a quota transfer from another stock on a kg for kg basis; single policy lever scenario 3 survivability exemption for skates and rays; and combined policy lever scenario 4C combined effect of single policy levers 1C, 2 and 3. Further detail on the scenarios can be found in Chapter 3, Section The estimated revenue under each scenario is shown as a percentage of the revenue earned by the fleet in Only revenue from demersal quota stocks is included in the analysis presented. Of the five scenarios, baseline scenario B3 will always show the weakest revenue, and combined policy lever 4C will always show the strongest revenue. If the revenue estimated under a policy lever scenario is greater than revenue estimated under baseline scenario B3 then the policy lever is generating a positive impact for the fleet segment by delaying or removing choke points. SUMMARY FINDINGS: FLEET REVENUE Figure 5-1 shows that in 2016 the estimated revenue for the England nephrops trawl fleet segment under scenario 2 and scenario 4C is higher (104%) than the revenue earned by the fleet from demersal quota landings in The model limits effort to the number of days used by the England nephrops trawl fleet segment in 2013 therefore estimated revenue in excess of 100% of 2013 revenue occurs because: the fleet is benefitting from quota top-up for eligible quota stocks and therefore catch that was previously discarded can now be landed and sold; or a biomass improvement for ICES-assessed stocks has increased total catch; and there are no choke stocks expected or any choke stock has a minimal impact on effort. In 2016 choke stocks are expected under baseline scenario B3 and without the benefit of the policy lever scenarios the revenue of the fleet could be 83% of revenue earned in In 2017 under baseline scenario B3, choke stocks could limit revenue to 84% of 2013 revenue. However the application of either policy lever scenario 1C (de minimis) or scenario 2 (interspecies flexibility) delays the choke points and as a result revenue could exceed the revenue earned in 2013 (106% and 107% respectively). In 2018, scenario 1C (de minimis) continues to delay the choke points expected under baseline scenario B3. However for the choke stocks expected in 2018, interspecies flexibility is expected to have limited benefit. However in combination the policy scenarios can increase estimated revenue to 90% of 2013 revenue under scenario 4C. In 2019 when the landing obligation is fully implemented, it is estimated that under baseline scenario B3 choke stocks could reduce the revenue of the England nephrops trawl fleet segment to 14% of 2013 revenue. In isolation, policy lever scenario 1C (de minimis) has the most effect and combines with the other scenarios to increase potential revenue to 20% of 2013 revenue. 32
38 Estimated revenue from demersal quota landings as a % of 2013 revenue from demersal quota landings England Nephrops Trawl Scenario Analysis 120% 100% 80% 60% 40% 20% 0% Baseline B3 83% 84% 55% 14% 14% 14% 14% Scenario 1c 88% 106% 90% 20% 20% 20% 20% Scenario 2 104% 107% 56% 14% 14% 14% 14% Scenario 3 83% 84% 55% 14% 14% 14% 14% Scenario 4c 104% 107% 90% 20% 21% 21% 21% Figure 5-1: Relative impact of different policy lever scenarios on the estimated revenue from demersal quota stock landings by the England nephrops trawl fleet segment, IMPACT OF POLICY LEVER SCENARIOS: CHOKE STOCKS The graph above highlights that as the fleet segment moves towards full implementation of the landing obligation in 2019 that the revenue of the fleet segment could fall below revenue earned in Revenue is restricted to less than 100% of the revenue earned in 2013 because the England nephrops trawl fleet segment is expected to encounter a choke stock before it can equal the number of days the fleet fished in The next four tables present the revenue findings for the England nephrops trawl fleet segment alongside the choke stocks, and their associated choke point, in each sea area. The sea areas presented for the England nephrops trawl fleet segment are the sea areas where the fleet fished for more than 10% of its total days at sea in Each table contains the findings from the bioeconomic scenario analysis for one year (2016, 2017, 2018 or 2019). Each table presents: The estimated revenue that could be earned by the fleet under each scenario, as summarised in the analysis above; The expected choke stock(s) in each sea area under each scenario; The estimated choke point for each choke stock, shown as a percentage of 2013 days at sea in each sea area; and An explanation as to why the scenario has, or does not have, an impact on the fleet segment. 33
39 Table 5-1: Bioeconomic Scenario Analysis Findings for 2016 England Nephrops Trawl Fleet Segment (analysis based on end of year landings) Estimated revenue from Scenarios Primary choke stock and choke point demersal quota stocks Revenue as % points Choke point Comment Primary Choke Ref Description % of 2013 above Area as % of 2013 Stock(s) revenue scenario B3 days B3 1C 2 3 4C Introduction of LO with catch allowance for zero-tac stocks and quota top-up De minimis strict: 5% of UK share of TAC can be discarded Interspecies flexibility for stocks considered to be in safe biological limits Survivability: skates and rays only Combination of scenarios 1C, 2 and England Nephrops Trawl Scenario Analysis IV Sole IV 73 In 2016 revenue under baseline scenario B3 is estimated to be 83% of revenue earned from demersal quota stocks in Sole could create a choke point in VI No choke - Area IV in 73% of the days fished in Area IV in No choke stock is expected in Area VI. Under de minimis strict the revenue of the fleet could be 5 percentage points IV Sole IV 80 higher than under baseline scenario B3. The benefit of de minimis is limited as a large proportion is being allocated to the beam trawl fleet. De minimis strict is not required in Area VI as there is no choke stock expected in VI No choke In Area IV scenario 1C would not change the primary choke stock but would delay the choke point by 7 percentage points compared to baseline scenario B3. Under interspecies flexibility the revenue of the fleet could be 21 percentage IV No choke - points higher than under baseline scenario B3 and exceed the revenue earned by the fleet in Interspecies flexibility is not required in Area VI as there is no choke stock expected VI No choke - in Interspecies flexibility could be used for sole in Area IV and it could remove sole as a choke stock. No other choke stocks are expected. IV Sole IV 73 Sole is not considered survivable in scenario 3 therefore the scenario has no benefit compared to baseline scenario B3. VI No choke - IV No choke - The combination of de minimis strict, interspecies flexibility and survivability does not create additional revenue benefit compared to the single policy lever scenario VI No choke - of interspecies flexibility. 34
40 England Nephrops Trawl Scenario Analysis Table 5-2: Bioeconomic Scenario Analysis Findings for 2017 England Nephrops Trawl Fleet Segment (analysis based on end of year landings) Estimated revenue from Scenarios Primary choke stock and choke point demersal quota stocks Revenue as % points Choke point Comment Primary Choke Ref Description % of 2013 above Area as % of 2013 Stock(s) revenue scenario B3 days Introduction of LO with catch IV Sole IV 73 In 2017 revenue under baseline scenario B3 is estimated to be 83% of revenue B3 allowance for zero-tac stocks 84 - earned from demersal quota stocks in 2013 as choke stocks could be encountered and quota top-up VI No choke - in Areas IV and VI. 1C 2 3 4C De minimis strict: 5% of UK share of TAC can be discarded Interspecies flexibility for stocks considered to be in safe biological limits Survivability: skates and rays only Combination of scenarios 1C, 2 and IV VI No choke No choke - - Under de minimis strict the revenue of the fleet could be 24 percentage points higher than under baseline scenario B3 and exceed the revenue earned by the fleet in The reasons for the increase are that de minimis strict could remove sole as the primary choke stock in Area IV, no other choke stocks are expected and quota top-up means that catch previously discarded can be landed and sold. The benefit of de minimis is much greater in 2017 than 2016 because the beam trawl fleet chokes on a different stock and cannot benefit from de minimis for sole IV. Policy levers are not required in Area VI as no choke stocks are identified for Under interspecies flexibility the revenue of the fleet could be 23 percentage IV No choke - points higher than under baseline scenario B3 and exceed the revenue earned by the fleet in The reasons for the increase are that interspecies flexibility could remove sole as the primary choke stock in Area IV, no other choke stocks are expected and quota top-up means that catch previously discarded can be landed VI No choke - and sold. Policy levers are not required in Area VI as no choke stocks are identified for IV Sole IV 73 Sole is not considered survivable in scenario 3 therefore the scenario has no VI No choke - benefit compared to baseline scenario B3. The combination of de minimis strict, interspecies flexibility and survivability does IV No choke - create additional revenue benefit compared to any single policy lever, although the increase is only one percentage point compared to scenario 1C. As expected under scenario 1C and scenario 2, in scenario 4C sole is removed as a potential choke stock in Area IV and no other choke stocks are identified. Combined with quota VI No choke - top-up the expected revenue of the fleet exceeds revenue earned in 2013 by 7 percentage points as catch previously discarded can be landed and sold. 35
41 England Nephrops Trawl Scenario Analysis Table 5-3: Bioeconomic Scenario Analysis Findings for 2018 England Nephrops Trawl Fleet Segment (analysis based on end of year landings) Estimated revenue from Scenarios Primary choke stock and choke point demersal quota stocks Revenue as % points Choke point Comment Primary Choke Ref Description % of 2013 above Area as % of 2013 Stock(s) revenue scenario B3 days Introduction of LO with catch IV Cod IV 39 In 2018 revenue under baseline scenario B3 is estimated to be 55% of revenue B3 allowance for zero-tac stocks 55 - earned from demersal quota stocks in 2013 as cod could be a choke stock in Area and quota top-up VI No choke - IV. No choke stock is expected in Area VI. 1C 2 3 4C De minimis strict: 5% of UK share of TAC can be discarded Interspecies flexibility for stocks considered to be in safe biological limits Survivability: skates and rays only Combination of scenarios 1C, 2 and Under de minimis strict the revenue of the fleet could be 35 percentage points IV Cod, plaice IV 80 higher than under baseline scenario B3 but would still be less than revenue earned in De minimis strict would not remove cod as a primary choke stock in Area IV but it would substantially delay the choke point to 80% of 2013 days. Plaice in Area IV would also become a potential primary choke stock at that level of fishing VI No choke - effort. Policy levers are not required in Area VI as no choke stocks are identified for IV Cod IV 39 Interspecies flexibility cannot be used for cod in Area IV as the stock was not considered to be in safe biological limits in VI No choke - IV Cod IV 39 Cod is not considered survivable in scenario 3 therefore the scenario has no benefit compared to baseline scenario B3. VI No choke - IV Cod, plaice, sole, saithe IV 80 VI No choke - The combination of de minimis strict, interspecies flexibility and survivability does create additional revenue benefit compared to any single policy lever, and under scenario 4C revenue is estimated to be 90% of 2013 revenue. The combination does not change the primary choke stock, cod in Area IV, expected under the other scenarios but does delay the choke point to 80% of 2013 days at sea. At this level of effort plaice, sole and saithe could also become primary choke stocks in Area IV in
42 Table 5-4: Bioeconomic Scenario Analysis Findings for 2019 England Nephrops Trawl Fleet Segment (analysis based on end of year landings) Estimated revenue from Scenarios Primary choke stock and choke point demersal quota stocks Revenue as % points Choke point Comment Primary Choke Ref Description % of 2013 above Area as % of 2013 Stock(s) revenue scenario B3 days B3 1C 2 3 4C Introduction of LO with catch allowance for zero-tac stocks and quota top-up De minimis strict: 5% of UK share of TAC can be discarded Interspecies flexibility for stocks considered to be in safe biological limits Survivability: skates and rays only Combination of scenarios 1C, 2 and England Nephrops Trawl Scenario Analysis IV Skate, dab IV 16 Once the landing obligation is fully implemented in 2019, revenue under baseline scenario B3 is estimated to be 14% of revenue earned from demersal quota stocks Hake, saithe, VI 49 in This is because choke stocks are expected very early in Area IV and in plaice, ling VI Area VI choke stocks could occur in half the days fished in IV VI Skate, dab, hake IV Hake, saithe, plaice, ling VI IV Skate, dab IV 16 VI Hake, plaice, ling VI 49 IV Dab IV 16 VI Hake, saithe, plaice, ling VI 49 IV Dab IV 18 VI Hake, plaice, ling VI 49 Under de minimis strict the revenue of the fleet could be 6 percentage points higher than under baseline scenario B3. De minimis strict would not change the primary choke stocks or the choke point in Area VI. However, it would delay the choke point in Area IV by one percentage point compared to baseline scenario B3 and at this level of fishing activity hake would also become a primary choke stock in Area IV. Interspecies flexibility is not expected to have any impact in Interspecies flexibility cannot be used for any of the identified choke stocks in 2019 as the stocks were either not known to be in safe biological limits (non-assessed stocks) or were not in safe biological limits (for ICES-assessed stocks) in Survivability is not expected to have any revenue benefit in Skate is considered to be survivable so is removed as a primary choke stock in Area IV. However dab remains as a primary choke stock so the choke point does not change. Survivability has no impact in Area VI. The combination of de minimis strict, interspecies flexibility and survivability does not create additional revenue benefit compared to the single policy lever scenario of de minimis strict. However, saithe is removed as one of the primary choke stocks as a result of interspecies flexibility. 37
43 England Nephrops Trawl Scenario Analysis 5.5. IMPACT OF POLICY LEVER SCENARIOS: TOP 5 CHOKE STOCKS UNDER SCENARIO 4C The table which follows presents the top five choke stocks for the England nephrops trawl fleet segment and their estimated choke point under combined policy lever 4C in 2016, 2017, 2018 and The choke points are presented in the number of fishing days available to the aggregated fleet segment for a particular stock. The days shown are the sum of the choke points calculated for each stock for individual PO fleet segments included in the England nephrops trawl fleet segment. The stock with the earliest choke point, i.e. the least number of days across all PO fleet segments included in the England nephrops trawl fleet segment, is identified as the primary choke stock for the aggregated fleet segment. It is possible that each PO fleet segment has a different primary choke stock. The purpose of presenting the top five choke stocks is: to show which other stocks, in addition to the primary choke stock, could create a potential choke point for the England nephrops trawl fleet segment; and to provide information on the top 5 potential chokes so that if the reader considers that a solution can be found for the primary choke stock, or believes that the primary choke stock is wrong, it is possible to identify when the next choke point could occur and the stock that could cause it. It is possible that more than one primary choke stock exists, i.e. the top two, three or four choke stocks all share the same choke point. This is more likely to occur under the combined policy lever scenarios as the exemptions and derogations can help to balance the choke point between stocks. SUMMARY FINDINGS: TOP 5 CHOKE STOCKS Table 5-5 presents the top five choke stocks expected under the best case scenario in the presented analysis, combined policy lever scenario 4C. In 2019 under scenario 4C the primary choke stocks for the England nephrops trawl fleet segment are expected to be: dabs in Area IV, with the choke point expected at 18% of the days fished in Area IV in 2013; and plaice, ling and hake in Area VI, with the choke point expected at 49% of the days fished in Area VI in Should avoidance measures be expected to address these choke stocks, or if it is believed that the true discard rate for the stock is less than the discard rate used in the analysis, then the secondary choke stocks could become more important. Once all policy levers have been applied and a choke point has occurred, the model does not continue to try to find policy solutions for the second, third or fourth choke stocks. Therefore if the primary choke stocks can be addressed through other mitigation measures, or are believed unlikely to occur in the future, then policy levers could be applied to delay the choke point identified for the secondary choke stocks in the table. For example, the analysis shows if dabs IV can be removed as the primary choke stock the choke point could be delayed by at least 25 percentage points, and the primary choke stock could become turbot IV. Some further benefit may be possible due to de minimis but the extent of benefit will be dependent on the demand for de minimis on turbot from other UK fleet segments. In Area VI plaice, ling and hake are all identified as primary choke stocks. If a choke on all of these stocks could be avoided the next choke stock could be megrim which in the model is considered eligible for interspecies flexibility and therefore the choke point could be delayed further. 38
44 England Nephrops Trawl Scenario Analysis Table 5-5: England nephrops trawl fleet segment - Top five choke stocks in Areas IV and VI in 2016, 2017, 2018 and 2019 under combined policy lever scenario 4C Area IV (North Sea) Area VI (West of Scotland) Choke Stock Choke Point Choke Point Choke Point Choke Point Choke Stock Choke Stock Choke Stock Days % of 2013 Days % of 2013 Days % of 2013 Days % of 2013 No choke No choke Cod IV 2,419 80% Dabs IV % Plaice IV 2,420 80% Turbot IV 1,300 43% Sole IV 2,420 80% Cod IV 1,324 44% Saithe IV 2,427 80% Lemon sole IV 1,523 50% Haddock IV 2,888 96% Ling IV 1,556 52% No choke No choke No choke Plaice VI % Ling VI % Hake VI % Megrim VI % Anglerfish VI % 39
45 England Beam Trawl Scenario Analysis 5.6. IMPACT OF QUOTA TRADING PATTERNS IN 2013 The findings presented for the England nephrops trawl fleet segment above are from the bioeconomic scenario analysis that is based on end of year landings by the fleet segment. However, the bioeconomic scenario analysis was undertaken twice: Once based on initial quota allocation (IQA) in 2013 to the 50 fleet segments in the model; and Once based on end of year landings (EoY) by each fleet segment in End of year landings was taken as proxy for quota held at year end and therefore incorporates the impact of in-year quota trading. The purpose of undertaking the analysis twice was to understand the extent that historic patterns of quota trading from 2013 could change the outlook for the fleet segments once the landing obligation is implemented. See Chapter 3, section 3.10 for further explanation of the differences between and the characteristics of the two analyses. The quota trading which occurred in 2013 is not a fleet response to the landing obligation but the comparison does show how quota trading can have an influence on the outcome for different fleets and highlights potential vulnerability should quota trading be substantively affected by the landing obligation. The figures which follow compare findings for the England nephrops trawl fleet segment under combined policy lever scenario 4C from the IQA and EoY analyses: Figure 5-2 compares the estimated number of days the fleet could be fishing prior to a choke point being encountered in Areas IV, VI and VII under the IQA and EoY analyses in the years ; and Figure 5-3 compares the estimated revenue that could be earned by the England nephrops trawl fleet segment before choke under the IQA and EoY analyses in the years The findings from both analyses are shown as a percentage of days at sea and revenue in
46 England Beam Trawl Scenario Analysis 120% 100% 80% 100% 94% 100% 94% 94% 84% 60% 40% 20% 0% 43% 23% IQA Choke Point EOY Choke Point Figure 5-2: England nephrops trawl fleet segment: comparison of choke point between IQA and EOY bioeconomic scenario analyses. Choke point shown as a % of days at sea in % 100% 80% 106% 108% 108% 104% 107% 90% 60% 40% 20% 0% 42% 20% IQA Revenue EOY Revenue Figure 5-3: England nephrops trawl fleet segment: comparison of estimated revenue from demersal quota stocks between IQA and EOY bioeconomic scenario analyses. Revenue shown as a % of revenue earned from demersal quota stocks in
47 6. ENGLAND BEAM TRAWL SCENARIO ANALYSIS England Beam Trawl Scenario Analysis The England beam trawl fleet segment is made up of five PO fleet segments defined in the model. The findings presented in the chapter are an aggregation of the findings for these PO fleet segments under five of the policy lever scenarios tested. The analysis presents the potential consequences of the landing obligation for the England beam trawl fleet segment, should the fleet continue to fish as it did in 2013, and the mitigation that could be offered by different policy lever scenarios. All scenarios assume the fleet continues to fish in the same way as it did in Unless otherwise stated, all analyses presented are from the end of year scenario analysis, which incorporates patterns of quota trading by the fleet segment in Chapter 6 presents the following analyses for the England beam trawl fleet segment: Characteristics of the fleet segment; Findings from the worst case scenario tested in the model i.e. the potential consequence of the landing obligation should no policy measures such as quota top-up be applied and should the fleet continue to fish as it did in 2013; The impact of five policy scenarios on the revenue of the fleet; The impact of five policy scenarios on the choke stocks that could be encountered by the England beam trawl fleet segment in its main sea areas and under each scenario; The top five choke stocks that the fleet segment could encounter under two scenarios in 2016, 2017, 2018 and 2019 and how the choke point might be delayed if a solution can be found for the primary choke stocks; and A comparison of the revenue results and choke points for the fleet segment between the scenario analysis based on end of year landings (EoY) and the scenario analysis based on initial quota allocation (IQA). 42
48 England Beam Trawl Scenario Analysis 6.1. CHARACTERISTICS OF THE ENGLAND BEAM TRAWL FLEET SEGMENT Number of vessels in 2013: 68 vessels Days at sea in 2013: Area IV (North Sea) 3,966 days Area VI (West of Scotland) 1 day Area VII 11,682 days Total 15,649 days Top 5 stocks landed in 2013 (by value in 000s): Plaice IV 16,042 Anglerfish VII 9,502 Megrim VII 4,690 Sole VIIe 4,084 Sole IV 3,052 Total Revenue in 2013 ( 000s): Demersal quota stocks 46,486 PO fleet segments included in the fleet segment: Cornish FPO North Sea Fishermen s Organisation South Western FPO Wales and West Coast FPO Other England Beam Trawl Vessels Other England Beam Trawl Vessels is a fleet segment created from PO beam trawl fleet segments with fewer than five vessels. Other England Beam Trawl Vessels includes vessels from the following POs: East of England FPO Interfish Lowestoft FPO North Atlantic FPO The FPO 43
49 6.2. WORST CASE SCENARIO, BASELINE SCENARIO B1 England Beam Trawl Scenario Analysis The model uses all of the data available to simulate when a choke point could occur for the England beam trawl fleet segment in each sea area, in each year and under each scenario. The worst case scenario, baseline scenario B1, represents the introduction of the landing obligation without any mitigating actions i.e. no catch allowances for zero-tac stocks, no quota top-up, no exemptions or derogations and it is assumed that the fleet will continue to fish as it did in Under baseline scenario B1 the revenue of the England beam trawl fleet segment is relatively unaffected in 2016 as revenue is expected to be 101% of 2013 levels. However by 2019, when all demersal quota stocks become subject to the landing obligation the revenue of the fleet segment could fall to 40% of 2013 revenue under the worst case scenario included in the model. Baseline scenario B1 is not reported on in the remaining analysis as it considered extremely unlikely that no policy levers will be applied IMPACT OF POLICY LEVER SCENARIOS: FLEET REVENUE The bioeconomic scenario analysis investigates the relative value of different policy levers to the England beam trawl fleet segment. The potential revenue impact on the fleet of the following five scenarios is presented: baseline scenario B3 (after quota top-up and catch allowances for zero-tac stocks but before exemptions and derogations); single policy lever scenario 1C de minimis STRICT, where 5% of UK quota for a choke stock can be discarded and not counted against total TAC; single policy lever scenario 2 interspecies flexibility, where a choke stock that is known to be within safe biological limits can receive a quota transfer from another stock on a kg for kg basis; single policy lever scenario 3 survivability exemption for skates and rays; and combined policy lever scenario 4C combined effect of single policy levers 1C, 2 and 3. Further detail on the scenarios can be found in Chapter 3, Section The estimated revenue under each scenario is shown as a percentage of the revenue earned by the fleet in Only revenue from demersal quota stocks is included in the analysis presented. Of the five scenarios, baseline scenario B3 will always show the weakest revenue, and combined policy lever 4C will always show the strongest revenue. If the revenue estimated under a policy lever scenario is greater than revenue estimated under baseline scenario B3 then the policy lever is generating a positive impact for the fleet segment by delaying or removing choke points. SUMMARY FINDINGS: FLEET REVENUE Figure 6-1 shows that in 2016 the estimated revenue for the England beam trawl fleet segment under all scenarios, including baseline scenario B3, is higher (114%) than the revenue earned by the fleet from demersal quota landings in The model limits effort to the number of days used by the England beam trawl fleet segment in 2013 therefore estimated revenue in excess of 100% of 2013 revenue occurs because: the fleet is benefitting from quota top-up for eligible quota stocks and therefore catch that was previously discarded can now be landed and sold; or a biomass improvement for ICES-assessed stocks has increased total catch; and there are no choke stocks expected or any choke stock has a minimal impact on effort. 44
50 Estimated revenue from demersal quota landings as a % of 2013 revenue from demersal quota landings England Beam Trawl Scenario Analysis In 2016 choke stocks are expected under baseline scenario B3 but revenue remains above 2013 revenue (114%). Revenue is higher under scenario 4C because anticipated choke points have been delayed by the policy lever scenarios. In 2017 under baseline scenario B3, choke stocks could limit revenue to 70% of 2013 revenue. However the application of policy lever scenario 1C (de minimis) delays the choke points and as a result revenue could exceed the revenue earned in 2013 (111%). In 2018, scenario 1C (de minimis) continues to delay the choke points expected under baseline scenario B3 and under combined policy lever scenario 4C de minimis works with other policy levers to increase estimated revenue to 97% of 2013 revenue. In 2019 when the landing obligation is fully implemented, it is estimated that under baseline scenario B3 choke stocks could reduce the revenue of the England beam trawl fleet segment to 48% of 2013 revenue. In isolation, policy lever scenario 1C (de minimis) has the most effect and increases potential revenue to 77% of 2013 revenue. 140% 120% 100% 80% 60% 40% 20% 0% Baseline B3 114% 70% 67% 48% 50% 51% 51% Scenario 1c 117% 111% 95% 77% 75% 75% 73% Scenario 2 120% 74% 76% 51% 51% 51% 51% Scenario 3 114% 70% 67% 48% 50% 51% 51% Scenario 4c 120% 112% 97% 77% 75% 74% 73% Figure 6-1: Relative impact of different policy lever scenarios on the estimated revenue from demersal quota stock landings by the England beam trawl fleet segment, IMPACT OF POLICY LEVER SCENARIOS: CHOKE STOCKS The graph above highlights that as the fleet segment moves towards full implementation of the landing obligation in 2019 that the revenue of the fleet segment could fall below revenue earned in Revenue is restricted to less than 100% of the revenue earned in 2013 because the England beam trawl fleet segment is expected to encounter a choke stock before it can equal the number of days the fleet fished in The next four tables present the revenue findings for the England beam trawl fleet segment alongside 45
51 England Beam Trawl Scenario Analysis the choke stocks, and their associated choke point, in each sea area. The sea areas presented for the England beam trawl fleet segment are the sea areas where the fleet fished for more than 10% of its total days at sea in Each table contains the findings from the bioeconomic scenario analysis for one year (2016, 2017, 2018 or 2019). Each table presents: The estimated revenue that could be earned by the fleet under each scenario, as summarised in the analysis above; The expected choke stock(s) in each sea area under each scenario; The estimated choke point for each choke stock, shown as a percentage of 2013 days at sea in each sea area; and An explanation as to why the scenario has, or does not have, an impact on the fleet segment. 46
52 Table 6-1: Bioeconomic Scenario Analysis Findings for 2016 England Beam Trawl Fleet Segment (analysis based on end of year landings) Estimated revenue from Scenarios Primary choke stock and choke point demersal quota stocks Revenue as % points Choke point Comment Primary Choke Ref Description % of 2013 above Area as % of 2013 Stock(s) revenue scenario B3 days B3 1C 2 3 4C Introduction of LO with catch allowance for zero-tac stocks and quota top-up De minimis strict: 5% of UK share of TAC can be discarded Interspecies flexibility for stocks considered to be in safe biological limits Survivability: skates and rays only Combination of scenarios 1C, 2 and IV Sole IV 74 VI No choke - VII No choke - IV Sole IV 83 VI No choke - VII No choke - IV Sole IV 89 VI No choke - VII No choke - England Beam Trawl Scenario Analysis In 2016 revenue under baseline scenario B3 is estimated to exceed revenue earned from demersal quota stocks in 2013 by 14 percent. This is because no choke stocks are expected in Area VI and VII and quota top-up means that fish previously discarded can be landed and sold. Sole is expected to be a choke stock in Area IV and will therefore restrict potential revenue from Area IV. Under de minimis strict the revenue of the fleet could be 3 percentage points higher than under baseline scenario B3. This is achieved by delaying the choke point caused by sole in Area IV. Policy levers are not required in Areas VI and VII as no choke stocks are identified for Under interspecies flexibility the revenue of the fleet could be 6 percentage points higher than under baseline scenario B3 and exceed the revenue earned by the fleet in This is achieved because interspecies flexibility could delay the choke point caused by sole in Area IV. IV Sole IV 74 Sole is not considered survivable in scenario 3 therefore the scenario has no VI No choke - benefit compared to baseline scenario B3. VII No choke - IV Sole IV 91 The combination of de minimis strict, interspecies flexibility and survivability does not appear to create additional revenue benefit in 2016 compared to scenario 2, VI No choke - interspecies flexibility. The combination does not change the primary choke stock VII No choke - of sole in Area IV but it does delay the choke point. 47
53 England Beam Trawl Scenario Analysis Table 6-2: Bioeconomic Scenario Analysis Findings for 2017 England Beam Trawl Fleet Segment (analysis based on end of year landings) Estimated revenue from Scenarios Primary choke stock and choke point demersal quota stocks Revenue as % points Choke point Comment Primary Choke Ref Description % of 2013 above Area as % of 2013 Stock(s) revenue scenario B3 days IV Whiting IV 32 In 2017 revenue under baseline scenario B3 is estimated to be 70% of revenue Introduction of LO with catch VI No choke - earned from demersal quota stocks in 2013 as choke stocks could be encountered B3 allowance for zero-tac stocks 70 - Plaice VIIfg, in Areas IV and VII. and quota top-up VII 78 plaice VIIh-k Under de minimis strict the revenue of the fleet from demersal quota stocks could IV Whiting, sole IV 80 be 41 percentage points higher than under baseline scenario B3 and exceed the revenue earned by the fleet in De minimis strict: 5% of UK VI No choke - 1C De minimis strict would delay the choke point in Area IV and Area VII. The primary share of TAC can be discarded Plaice VIIfg, choke stocks would remain the same but with increased fishing effort under VII plaice VIIh-k, 90 scenario 1C, sole IV and plaice VIIde would also become primary choke stocks. plaice VIIde Policy levers are not required in Area VI as no choke stocks are identified for C Interspecies flexibility for stocks considered to be in safe biological limits Survivability: skates and rays only Combination of scenarios 1C, 2 and IV Whiting IV 32 VI No choke - VII Plaice VIIfg, plaice VIIh-k 78 Under interspecies flexibility the revenue of the fleet is estimated to be 74% of revenue earned from demersal quota stocks in 2013, 4 percentage points higher than under baseline scenario B3. Interspecies flexibility cannot be used for any of the identified choke stocks. The apparently impossible revenue benefit is being achieved because one PO fleet segment does not experience whiting IV as its primary choke stock therefore the aggregated choke point for whiting IV remains the same but there is more fishing opportunity at a PO level because interspecies flexibilty has been able to relieve the primary choke stock facing this one PO. IV Whiting IV 32 Whiting and plaice are not considered survivable in scenario 3 therefore the VI No choke - scenario has no benefit compared to baseline scenario B3. VII Plaice VIIfg, plaice VIIh-k 78 IV Whiting IV 80 The combination of de minimis strict, interspecies flexibility and survivability does VI No choke - create additional fishing opportunity compared to the single policy lever scenario of de minimis strict, scenario 1C. The benefit occurs because at least one PO is VII Plaice VIIfg, 90 able to delay its primary choke stock, which is not the same as the choke stock for plaice VIIh-k the aggregated home nation fleet segment. 48
54 England Beam Trawl Scenario Analysis Table 6-3: Bioeconomic Scenario Analysis Findings for 2018 England Beam Trawl Fleet Segment (analysis based on end of year landings) Estimated revenue from Scenarios Primary choke stock and choke point demersal quota stocks Revenue as % points Choke point Comment Primary Choke Ref Description % of 2013 above Area as % of 2013 Stock(s) revenue scenario B3 days IV Whiting IV 32 In 2018 under baseline scenario B3 revenue is estimated to be 67% of revenue Introduction of LO with catch VI No choke - earned from demersal quota stocks in 2013 as choke stocks could be encountered B3 allowance for zero-tac stocks 67 - Plaice VIIfg, in Areas IV and VII. and quota top-up VII 78 plaice VIIh-k Under de minimis strict the revenue of the fleet could be 28 percentage points Whiting, plaice IV 40 higher than under baseline scenario B3. IV De minimis strict would not remove any of the primary choke stocks but it would delay the choke point in both Areas IV and VII. With a delay to the choke point De minimis strict: 5% of UK VI No choke - plaice IV also becomes a primary choke stock. 1C Despite the choke stocks under scenario 1C in 2018 being similar to the choke share of TAC can be discarded stocks under 1C in 2017, the choke point is occurring earlier, particularly in Area IV. This is because once the choke point for plaice IV has been delayed by the Plaice VIIfg, VII 85 maximum possible, the model does not look for mitigation for the whiting choke plaice VIIh-k point because there would be no benefit to the fleet segment. Policy levers are not required in Area VI as no choke stocks are identified for C Interspecies flexibility for stocks considered to be in safe biological limits Survivability: skates and rays only Combination of scenarios 1C, 2 and IV Whiting IV 32 Under interspecies flexibility the revenue of the fleet could be 9 percentage points VI No choke - higher than under baseline scenario B3. VII Plaice VIIfg, plaice VIIh-k 78 IV Whiting IV 32 Whiting and plaice are not considered survivable in scenario 3 therefore the VI No choke - scenario has no benefit compared to baseline scenario B3. VII Plaice VIIfg, plaice VIIh-k 78 IV Whiting, plaice IV VI No choke - VII Plaice VIIfg, plaice VIIh-k The combination of de minimis strict, interspecies flexibility and survivability does create additional revenue benefit compared to any single policy lever. The combination does not change the primary choke stocks for the aggregated fleet segment. The benefit occurs because under the combined policy lever scenarios at least one PO is able to delay its primary choke stock, which is not the same as the choke stock for the aggregated home nation fleet segment. 49
55 Table 6-4: Bioeconomic Scenario Analysis Findings for 2019 England Beam Trawl Fleet Segment (analysis based on end of year landings) Estimated revenue from Scenarios Primary choke stock and choke point demersal quota stocks Revenue as % points Choke point Comment Primary Choke Ref Description % of 2013 above Area as % of 2013 Stock(s) revenue scenario B3 days B3 Introduction of LO with catch allowance for zero-tac stocks and quota top-up 48 - England Beam Trawl Scenario Analysis IV Whiting IV 32 In 2016 under baseline scenario B3 revenue is estimated to be 48% of revenue earned from demersal quota stocks in 2013 as choke stocks could be encountered in Areas IV and VII. VI No choke - VII Whiting VIIb-k 70 1C De minimis strict: 5% of UK share of TAC can be discarded IV Whiting, plaice IV VI No choke - 38 VII Whiting VIIb-k 76 Under de minimis strict the revenue of the fleet could be 29 percentage points higher than under baseline scenario B3. De minimis strict would not remove any of the primary choke stocks but it would delay the choke point in both Areas IV and VII. With a delay to the choke point plaice IV also becomes a primary choke stock. Policy levers are not required in Area VI as no choke stocks are identified for C Interspecies flexibility for stocks considered to be in safe biological limits Survivability: skates and rays only Combination of scenarios 1C, 2 and IV Whiting IV 32 VI No choke - VII Plaice VIIfg, plaice VIIh-k 78 Under interspecies flexibility the revenue of the fleet could be 3 percentage points higher than under baseline scenario B3. Interspecies flexibility cannot be used for whiting IV as the stock was not in safe biological limits in 2013, as determined by ICES. Interspecies flexibility could be used for whiting VIIb-k and as a result it is removed as the primary choke stock in Area VII. Plaice VIIfg and plaice VIIh-k become the primary choke stocks and the choke point is delayed to 78% of the days fished in IV Whiting IV 32 Whiting is not considered survivable in scenario 3 therefore the scenario has no VI No choke - benefit compared to baseline scenario B3. VII Whiting VIIb-k 70 IV Whiting, plaice IV VI No choke - VII Plaice VIIh-k, plaice VIIfg The combination of de minimis strict, interspecies flexibility and survivability does not create additional revenue benefit compared to de minimis strict. The combination does not change the primary choke stock or choke point expected under scenario 1C in Area IV. However it does remove whiting VIIb-k (through interspecies flexibility) as a potential choke stock in Area VII and the primary choke stocks become plaice VIIfg and plaice VIIh-k. There is no revenue benefit recorded because at least one individual fleet segment is choking at an earlier stage on a different choke stock. 50
56 England Nephrops Trawl Scenario Analysis 6.5. IMPACT OF POLICY LEVER SCENARIOS: TOP 5 CHOKE STOCKS UNDER SCENARIO 4C The table which follows presents the top five choke stocks for the England beam trawl fleet segment and their estimated choke point under combined policy lever 4C in 2016, 2017, 2018 and The choke points are presented in the number of fishing days available to the aggregated fleet segment for a particular stock. The days shown are the sum of the choke points calculated for each stock for individual PO fleet segments included in the England beam trawl fleet segment. The stock with the earliest choke point, i.e. the least number of days across all PO fleet segments included in the England beam trawl fleet segment, is identified as the primary choke stock for the aggregated fleet segment. It is possible that each PO fleet segment has a different primary choke stock. The purpose of presenting the top five choke stocks is: to show which other stocks, in addition to the primary choke stock, could create a potential choke point for the England beam trawl fleet segment; and to provide information on the top 5 potential chokes so that if the reader considers that a solution can be found for the primary choke stock, or believes that the primary choke stock is wrong, it is possible to identify when the next choke point could occur and the stock that could cause it. It is possible that more than one primary choke stock exists, i.e. the top two, three or four choke stocks all share the same choke point. This is more likely to occur under the combined policy lever scenarios as the exemptions and derogations can help to balance the choke point between stocks. SUMMARY FINDINGS: TOP 5 CHOKE STOCKS 51
57 England Nephrops Trawl Scenario Analysis Table 6-5 presents the top five choke stocks expected under the best case scenario in the presented analysis, combined policy lever scenario 4C. In 2019 under scenario 4C the primary choke stocks for the England beam trawl fleet segment are expected to be: whiting and plaice in Area IV, with the choke point expected at 38% of the days fished in Area IV in 2013; and plaice VIIfg and plaice VIIh-k in Area VII (closely followed by plaice VIIde), with the choke point expected at 83% of the days fished in Area VII in Should avoidance measures be expected to address these choke stocks, or if it is believed that the true discard rate for the stock is less than the discard rate used in the analysis, then the second choke stocks could become more important. Once all policy levers have been applied and a choke point has occurred, the model does not continue to try to find policy solutions for the second, third or fourth choke stocks. Therefore if the primary choke stocks can be addressed through other mitigation measures, or are believed unlikely to occur in the future, then policy levers could be applied to delay the choke point identified for the secondary choke stocks in the table. For example, the analysis shows if whiting and plaice in Area IV can be removed as choke stocks the choke point could be delayed by at least 35 percentage points, and the primary choke stock could become cod IV. In the model, cod IV is not considered eligible for interspecies flexibility so only de minimis could offer a further delay to the choke point. The estimated choke point in Area VII is relatively late, compared to other fleet segments in 2019, and is driven by plaice stocks. Should a solution be found for plaice stocks and nephrops in Area VII, there are no further choke stocks expected. 4 The scenario analysis treats Area VII as a single sea area and activity in each sub-area of Area VII is averaged across the year. See Chapter 3, Section 3.4 for further information on the analysis in Area VII. 52
58 England Nephrops Trawl Scenario Analysis Table 6-5: England beam trawl fleet segment - Top five choke stocks in Areas IV and VII in 2016, 2017, 2018 and 2019 under combined policy lever scenario 4C Area IV (North Sea) Area VII Choke Stock Choke Point Choke Point Choke Point Choke Point Choke Stock Choke Stock Choke Stock Days % of 2013 Days % of 2013 Days % of 2013 Days % of 2013 Sole IV 3,613 91% Whiting IV 3,186 80% Whiting IV 1,568 40% Whiting IV 1,521 38% Sole IV 3,187 80% Plaice IV 1,568 40% Plaice IV 1,521 38% Cod IV 3,120 79% Cod IV 2,906 73% Sole IV 3,161 80% Sole IV 2,944 74% Saithe IV 3,781 95% Dabs IV 2,996 76% No choke Plaice VIIfg 10,495 90% Plaice VIIh-k 9,966 85% Plaice VIIfg 9,715 83% Plaice VIIh-k 10,495 90% Plaice VIIfg 9,966 85% Plaice VIIh-k 9,715 83% Plaice VIIde 10,574 91% Plaice VIIde 10,401 89% Plaice VIIde 9,943 85% No further choke - - No further choke - - Nephrops VII 10,518 90% No further choke
59 6.6. IMPACT OF QUOTA TRADING PATTERNS IN 2013 England Beam Trawl Scenario Analysis The findings presented for the England beam trawl fleet segment above are from the bioeconomic scenario analysis that is based on end of year landings by the fleet segment. However, the bioeconomic scenario analysis was undertaken twice: Once based on initial quota allocation (IQA) in 2013 to the 50 fleet segments in the model; and Once based on end of year landings (EoY) by each fleet segment in End of year landings was taken as proxy for quota held at year end and therefore incorporates the impact of in-year quota trading. The purpose of undertaking the analysis twice was to understand the extent that historic patterns of quota trading from 2013 could change the outlook for the fleet segments once the landing obligation is implemented. See Chapter 3, section 3.10 for further explanation of the differences between and the characteristics of the two analyses. The quota trading which occurred in 2013 is not a fleet response to the landing obligation but the comparison does show how quota trading can have an influence on the outcome for different fleets and highlights potential vulnerability should quota trading be substantively affected by the landing obligation. The figures which follow compare findings for the England beam trawl fleet segment under combined policy lever scenario 4C from the IQA and EoY analyses: Figure 6-2 compares the estimated number of days the fleet could be fishing prior to a choke point being encountered in Areas IV, VI and VII under the IQA and EoY analyses in the years ; and Figure 4-3 compares the estimated revenue that could be earned by the England beam trawl fleet segment before choke under the IQA and EoY analyses in the years The findings from both analyses are shown as a percentage of days at sea and revenue in
60 England Beam Trawl Scenario Analysis 140% 120% 100% 80% 60% 40% 20% 0% 100% 98% 87% 78% 74% 72% 64% 63% IQA Choke Point EOY Choke Point Figure 6-2: England beam trawl fleet segment: comparison of choke point between IQA and EOY bioeconomic scenario analyses. Choke point shown as a % of days at sea in % 120% 100% 80% 60% 128% 120% 112% 112% 100% 97% 81% 77% 40% 20% 0% IQA Revenue EOY Revenue Figure 6-3: England beam trawl fleet segment: comparison of estimated revenue from demersal quota stocks between IQA and EOY bioeconomic scenario analyses. Revenue shown as a % of revenue earned from demersal quota stocks in
61 Northern Ireland Nephrops Trawl Scenario Analysis 7. NORTHERN IRELAND NEPHROPS TRAWL SCENARIO ANALYSIS The Northern Ireland nephrops trawl fleet segment is made up of two PO fleet segments. The findings presented in the chapter are an aggregation of the findings for these PO fleet segments under five of the policy lever scenarios tested. The analysis presents the potential consequences of the landing obligation for the Northern Ireland nephrops trawl fleet segment, should the fleet continue to fish as it did in 2013, and the mitigation that could be offered by different policy lever scenarios. All scenarios assume the fleet continues to fish in the same way as it did in Unless otherwise stated, all analyses presented are from the end of year scenario analysis, which incorporates patterns of quota trading by the fleet segment in Chapter 7 presents the following analyses for the Northern Ireland nephrops trawl fleet segment: Characteristics of the fleet segment; Findings from the worst case scenario tested in the model i.e. the potential consequence of the landing obligation should no policy measures such as quota top-up be applied and should the fleet continue to fish as it did in 2013; The impact of five policy scenarios on the revenue of the fleet; The impact of five policy scenarios on the choke stocks that could be encountered by the Northern Ireland nephrops trawl fleet segment in its main sea areas and under each scenario; The top five choke stocks that the fleet segment could encounter under two scenarios in 2016, 2017, 2018 and 2019 and how the choke point might be delayed if a solution can be found for the primary choke stocks; and A comparison of the revenue results and choke points for the fleet segment between the scenario analysis based on end of year landings (EoY) and the scenario analysis based on initial quota allocation (IQA). 56
62 Northern Ireland Nephrops Trawl Scenario Analysis 7.1. CHARACTERISTICS OF THE NORTHERN IRELAND NEPHROPS TRAWL FLEET SEGMENT Number of vessels in 2013: 112 vessels Days at sea in 2013: Area IV (North Sea) 1,379 days Area VI (West of Scotland) 3,233 days Area VII 11,046 days Total 15,658 days Top 5 stocks landed in 2013 (by value in 000s): Nephrops VII 12,492 Nephrops VI 3,393 Nephrops IV 2,515 Anglerfish VII 384 Cod VIIa 214 Total Revenue in 2013 ( 000s): Demersal quota stocks 19,693 PO fleet segments included in the fleet segment: Anglo-North Irish FPO Northern Ireland FPO 7.2. WORST CASE SCENARIO, BASELINE SCENARIO B1 The model uses all of the data available to simulate when a choke point could occur for the Northern Ireland nephrops trawl fleet segment in each sea area, in each year and under each scenario. The worst case scenario, baseline scenario B1, represents the introduction of the landing obligation without any mitigating actions i.e. no catch allowances for zero-tac stocks, no quota top-up, no exemptions or derogations and it is assumed that the fleet will continue to fish as it did in Under baseline scenario B1 the revenue of the Northern Ireland nephrops trawl fleet segment is expected to be 92% of 2013 levels. However by 2019, when all demersal quota stocks become subject to the landing obligation the revenue of the fleet segment could fall to 5% of 2013 revenue under the worst case scenario included in the model. Baseline scenario B1 is not reported on in the remaining analysis as it considered extremely unlikely that no policy levers will be applied IMPACT OF POLICY LEVER SCENARIOS: FLEET REVENUE The bioeconomic scenario analysis investigates the relative value of different policy levers to the Northern Ireland nephrops trawl fleet segment. The potential revenue impact on the fleet of the following five scenarios is presented: baseline scenario B3 (after quota top-up and catch allowances for zero-tac stocks but before exemptions and derogations); single policy lever scenario 1C de minimis STRICT, where 5% of UK quota for a choke stock can be discarded and not counted against total TAC; 57
63 Northern Ireland Nephrops Trawl Scenario Analysis single policy lever scenario 2 interspecies flexibility, where a choke stock that is known to be within safe biological limits can receive a quota transfer from another stock on a kg for kg basis; single policy lever scenario 3 survivability exemption for skates and rays; and combined policy lever scenario 4C combined effect of single policy levers 1C, 2 and 3. Further detail on the scenarios can be found in Chapter 3, Section The estimated revenue under each scenario is shown as a percentage of the revenue earned by the fleet in Only revenue from demersal quota stocks is included in the analysis presented. Of the five scenarios, baseline scenario B3 will always show the weakest revenue, and combined policy lever 4C will always show the strongest revenue. If the revenue estimated under a policy lever scenario is greater than revenue estimated under baseline scenario B3 then the policy lever is generating a positive impact for the fleet segment by delaying or removing choke points. SUMMARY FINDINGS: FLEET REVENUE Figure 7-1 shows that in 2016 the estimated revenue for the Northern Ireland nephrops trawl fleet segment under all scenarios, including baseline scenario B3 (107%), is higher than the revenue earned by the fleet from demersal quota landings in The model limits effort to the number of days used by the Northern Ireland nephrops trawl fleet segment in 2013 therefore estimated revenue in excess of 100% of 2013 revenue occurs because: the fleet is benefitting from quota top-up for eligible quota stocks and therefore catch that was previously discarded can now be landed and sold; or a biomass improvement for ICES-assessed stocks has increased total catch; and there are no choke stocks expected or any choke stock has a minimal impact on effort. In 2016 choke stocks are expected under baseline scenario B3 and the application of policy lever scenarios could increase potential revenue to 111% under combined policy lever scenario 4C. In 2017 and 2018 the analysis is very similar to the revenue results for the Northern Ireland nephrops trawl fleet segment in No choke stocks are expected to be encountered under combined policy lever scenario 4C. In 2019 when the landing obligation is fully implemented, it is estimated that under baseline scenario B3 choke stocks could dramatically reduce the revenue of the Northern Ireland nephrops trawl fleet segment to 7% of 2013 revenue. In isolation, the policy lever scenarios have limited or no effect but in combination provide a small benefit which increases potential revenue to 10% of 2013 revenue. 58
64 Estimated revenue from demersal quota landings as a % of 2013 revenue from demersal quota landings Northern Ireland Nephrops Trawl Scenario Analysis 120% 100% 80% 60% 40% 20% 0% Baseline B3 107% 107% 103% 7% 7% 7% 7% Scenario 1c 109% 111% 109% 8% 8% 8% 8% Scenario 2 111% 111% 103% 7% 7% 7% 7% Scenario 3 107% 107% 103% 7% 7% 7% 7% Scenario 4c 111% 111% 109% 10% 10% 10% 10% Figure 7-1: Relative impact of different policy lever scenarios on the estimated revenue from demersal quota stock landings by the Northern Ireland nephrops trawl fleet segment, IMPACT OF POLICY LEVER SCENARIOS: CHOKE STOCKS The graph above highlights that as the fleet segment moves towards full implementation of the landing obligation in 2019 that the revenue of the fleet segment could fall below revenue earned in Revenue is restricted to less than 100% of the revenue earned in 2013 because the Northern Ireland nephrops trawl fleet segment is expected to encounter a choke stock before it can equal the number of days the fleet fished in The next four tables present the revenue findings for the Northern Ireland nephrops trawl fleet segment alongside the choke stocks, and their associated choke point, in each sea area. The sea areas presented for the Northern Ireland nephrops trawl fleet segment are the sea areas where the fleet fished for more than 10% of its total days at sea in Each table contains the findings from the bioeconomic scenario analysis for one year (2016, 2017, 2018 or 2019). Each table presents: The estimated revenue that could be earned by the fleet under each scenario, as summarised in the analysis above; The expected choke stock(s) in each sea area under each scenario; The estimated choke point for each choke stock, shown as a percentage of 2013 days at sea in each sea area; and An explanation as to why the scenario has, or does not have, an impact on the fleet segment. 59
65 Northern Ireland Nephrops Trawl Scenario Analysis Table 7-1: Bioeconomic Scenario Analysis Findings for 2016 Northern Ireland Nephrops Trawl Fleet Segment (analysis based on end of year landings) Estimated revenue from Scenarios Primary choke stock and choke point demersal quota stocks Revenue as % points Choke point Comment Primary Choke Ref Description % of 2013 above Area as % of 2013 Stock(s) revenue scenario B3 days B3 1C 2 3 4C Introduction of LO with catch allowance for zero-tac stocks and quota top-up De minimis strict: 5% of UK share of TAC can be discarded Interspecies flexibility for stocks considered to be in safe biological limits Survivability: skates and rays only Combination of scenarios 1C, 2 and VI No choke - In 2016 revenue under baseline scenario B3 is estimated to exceed revenue earned from demersal quota stocks in 2013 by 7 percentage points. This is because no VII No choke - choke stocks are expected in Areas VI and VII and quota top-up means that fish previously discarded can be landed and sold. Policy levers are not required in Area VI and Area VII as no choke stocks are VI No choke - identified in However, under de minimis strict the revenue of the fleet could be 2 percentage points higher than under baseline scenario B3. This occurs because in Area IV, where the fleet spent 1,379 days in 2013, sole IV is expected to be a choke stock. VII No choke - Revenue is improved under scenario 1C because de minimis can delay the choke point caused by sole in Area IV. Area IV choke analysis is not shown because Area IV represented less than 10% of the fleet segment s days at sea in Under interspecies flexibility the revenue of the fleet could be 4 percentage points VI No choke - higher than under baseline scenario B3. Again, this is linked to the impact that the scenario can have in Area IV as under interspecies flexibility sole IV is removed as a VII No choke - potential choke stock and the fleet segment can fish for the same days as it fished in Area IV in VI No choke - None of the identified choke stocks are considered to be survivable in scenario 3 VII No choke - therefore the scenario has no revenue benefit compared to baseline scenario B3. VI No choke - The combination of de minimis strict, interspecies flexibility and survivability does not create additional revenue benefit compared to the single policy lever scenario VII No choke - of interspecies flexibility. 60
66 Table 7-2: Bioeconomic Scenario Analysis Findings for 2017 Northern Ireland Nephrops Trawl Fleet Segment (analysis based on end of year landings) Estimated revenue from Scenarios Primary choke stock and choke point demersal quota stocks Revenue as % points Choke point Comment Primary Choke Ref Description % of 2013 above Area as % of 2013 Stock(s) revenue scenario B3 days B3 1C 2 3 4C Introduction of LO with catch allowance for zero-tac stocks and quota top-up De minimis strict: 5% of UK share of TAC can be discarded Interspecies flexibility for stocks considered to be in safe biological limits Survivability: skates and rays only Combination of scenarios 1C, 2 and Northern Ireland Nephrops Trawl Scenario Analysis VI No choke - In 2017 revenue under baseline scenario B3 is estimated to exceed revenue earned from demersal quota stocks in 2013 by 7 percentage points. This is because no VII No choke - choke stocks are expected in Areas VI and VII and quota top-up means that fish previously discarded can be landed and sold. Policy levers are not required in Area VI and Area VII as no choke stocks are VI No choke - identified in However, under de minimis strict the revenue of the fleet could be 4 percentage points higher than under baseline scenario B3. This occurs because in Area IV, where the fleet spent 1,379 days in 2013, sole IV is expected to be a choke stock. VII No choke - Revenue is improved under scenario 1C because de minimis can delay the choke point caused by sole in Area IV. Area IV choke analysis is not shown because Area IV represented less than 10% of the fleet segment s days at sea in Under interspecies flexibility the revenue of the fleet could be 4 percentage points VI No choke - higher than under baseline scenario B3. Again, this is linked to the impact that the scenario can have in Area IV as under interspecies flexibility sole IV and haddock IV VII No choke - are removed as a potential choke stocks and the fleet segment can fish for the same days as it fished in Area IV in VI No choke - None of the identified choke stocks are considered to be survivable in scenario 3 VII No choke - therefore the scenario has no revenue benefit compared to baseline scenario B3. VI No choke - The combination of de minimis strict, interspecies flexibility and survivability does not create additional revenue benefit compared to the single policy lever scenario VI No choke - of interspecies flexibility and de minimis strict. 61
67 Table 7-3: Bioeconomic Scenario Analysis Findings for 2018 Northern Ireland Nephrops Trawl Fleet Segment (analysis based on end of year landings) Estimated revenue from Scenarios Primary choke stock and choke point demersal quota stocks Revenue as % points Choke point Comment Primary Choke Ref Description % of 2013 above Area as % of 2013 Stock(s) revenue scenario B3 days B3 1C 2 3 4C Introduction of LO with catch allowance for zero-tac stocks and quota top-up De minimis strict: 5% of UK share of TAC can be discarded Interspecies flexibility for stocks considered to be in safe biological limits Survivability: skates and rays only Combination of scenarios 1C, 2 and Northern Ireland Nephrops Trawl Scenario Analysis VI No choke - In 2017 revenue under baseline scenario B3 is estimated to exceed revenue earned from demersal quota stocks in 2013 by 3 percentage points. This is because no choke stocks are expected in Areas VI and VII and quota top-up means that fish VII No choke - previously discarded can be landed and sold. However, the benefit is less in 2018 than in 2017 and This is because the fleet is choking in Area IV on cod in 39% of the days fished in Area IV in Policy levers are not required in Area VI and Area VII as no choke stocks are identified in VI No choke - However, under de minimis strict the revenue of the fleet could be 6 percentage points higher than under baseline scenario B3. This occurs because in Area IV, where the fleet spent 1,379 days in 2013, cod IV is expected to be a choke stock. Revenue is improved under scenario 1C because de minimis can delay the choke VII No choke - point caused by cod in Area IV to 80% of the days fished in Area IV in Area IV choke analysis is not shown because Area IV represented less than 10% of the fleet segment s days at sea in VI No choke - Interspecies flexibility is not required in Areas VI and VII because there are no choke stocks and cannot have any benefit in Area IV as cod was not considered to VII No choke - be in safe biological limits in 2013, as determined by ICES. VI No choke - None of the identified choke stocks are considered to be survivable in scenario 3 VII No choke - therefore the scenario has no revenue benefit compared to baseline scenario B3. VI No choke - The combination of de minimis strict, interspecies flexibility and survivability does not create additional revenue benefit compared to the single policy lever scenario VI No choke - of de minimis strict (1C). 62
68 Table 7-4: Bioeconomic Scenario Analysis Findings for 2019 Northern Ireland Nephrops Trawl Fleet Segment (analysis based on end of year landings) Estimated revenue from Scenarios Primary choke stock and choke point demersal quota stocks Revenue as % points Choke point Comment Primary Choke Ref Description % of 2013 above Area as % of 2013 Stock(s) revenue scenario B3 days B3 1C 2 3 4C Introduction of LO with catch allowance for zero-tac stocks and quota top-up De minimis strict: 5% of UK share of TAC can be discarded Interspecies flexibility for stocks considered to be in safe biological limits Survivability: skates and rays only Combination of scenarios 1C, 2 and VI Plaice, ling, sole, pollack VI VII Whiting VIIa 5 VI Plaice, ling, sole, pollack VI VII Whiting VIIa 5 VI Plaice, ling, sole, pollack VI VII Whiting VIIa 5 VI Plaice, ling, sole, pollack VI VII Whiting VIIa 5 VI Plaice, ling, sole, pollack VI VII Whiting VIIa Northern Ireland Nephrops Trawl Scenario Analysis In 2016 revenue under baseline scenario B3 is estimated to be 7% of revenue earned from demersal quota stocks in 2013 as choke stocks could be encountered in Areas IV, VI and VII. Under de minimis strict the revenue of the fleet could be one percentage points higher than under baseline scenario B3. This occurs because of a slight delay to the choke point caused by whiting VIIa and a change in the choke stock in Area IV. The fleet spent 1,379 days in Area IV in 2013 and de minimis could change the choke stock from skate to hake, and delay the choke point to 14% of the days fished in Area IV in 2013, rather than 5% under baseline scenario B3.. Area IV choke analysis is not shown because Area IV represented less than 10% of the fleet segment s days at sea in Interspecies flexibility cannot be used for any of the identified choke stocks under baseline scenario B3 in Area IV, VI or VII as the stocks were not (for ICES-assessed stocks) or were not known to be (for non-assessed stocks) in safe biological limits in The choke stocks in Area VI and VII are not considered survivable in scenario 3. Skate is removed as a choke stock in Area IV but hake becomes the primary choke stock very quickly and only delays the choke point for the whole fleet by 23 days. This has only negligible benefit and therefore there is no notable improvement to the revenue of the fleet compared to baseline scenario B3. The combination of de minimis strict, interspecies flexibility and survivability does create additional revenue benefit compared to any single policy lever. The additional benefit occurs fully in Area IV. In Area IV once skate is exempt from the landing obligation (under scenario 3), interspecies flexibility and de minimis can work together more effectively on potential choke stocks such as hake and delay the choke point from 5% of 2013 days (scenario B3) to 38% of 2013 days in Area IV under scenario 4C. Under scenario 4C the primary choke stock in Area IV is dab. 63
69 England Nephrops Trawl Scenario Analysis 7.5. IMPACT OF POLICY LEVER SCENARIOS: TOP 5 CHOKE STOCKS UNDER SCENARIO 4C The table which follows presents the top five choke stocks for the Northern Ireland nephrops trawl fleet segment and their estimated choke point under combined policy lever 4C in 2016, 2017, 2018 and The choke points are presented in the number of fishing days available to the aggregated fleet segment for a particular stock. The days shown are the sum of the choke points calculated for each stock for individual PO fleet segments included in the Northern Ireland nephrops trawl fleet segment. The stock with the earliest choke point, i.e. the least number of days across all PO fleet segments included in the Northern Ireland nephrops trawl fleet segment, is identified as the primary choke stock for the aggregated fleet segment. It is possible that each PO fleet segment has a different primary choke stock. The purpose of presenting the top five choke stocks is: to show which other stocks, in addition to the primary choke stock, could create a potential choke point for the Northern Ireland nephrops trawl fleet segment; and to provide information on the top 5 potential chokes so that if the reader considers that a solution can be found for the primary choke stock, or believes that the primary choke stock is wrong, it is possible to identify when the next choke point could occur and the stock that could cause it. It is possible that more than one primary choke stock exists, i.e. the top two, three or four choke stocks all share the same choke point. This is more likely to occur under the combined policy lever scenarios as the exemptions and derogations can help to balance the choke point between stocks. SUMMARY FINDINGS: TOP 5 CHOKE STOCKS Table 7-5 presents the top five choke stocks expected under the best case scenario in the presented analysis, combined policy lever scenario 4C. In 2019 under scenario 4C the primary choke stocks for the Northern Ireland nephrops trawl fleet segment are expected to be: plaice, ling, sole and pollack in Area VI, with the choke point expected at 5% of the days fished in Area VI in 2013; and whiting VIIa in Area VII, with the choke point expected at 5% of the days fished in Area VII in Should avoidance measures be expected to address these choke stocks, or if it is believed that the true discard rate for the stock is less than the discard rate used in the analysis, then the second choke stocks could become more important. Once all policy levers have been applied and a choke point has occurred, the model does not continue to try to find policy solutions for the second, third or fourth choke stocks. Therefore if the primary choke stocks can be addressed through other mitigation measures, or are believed unlikely to occur in the future, then policy levers could be applied to delay the choke point identified for the secondary choke stocks in the table. For example, the analysis shows if plaice, ling, sole and pollack can all be removed as the primary choke stocks in Area VI, hake would very quickly create another choke point at 7%. In the model hake VI is considered eligible for interspecies flexibility so the choke point of this stock could be delayed. In Area VII, if the Northern Ireland nephrops trawl fleet segment can avoid choking on whiting VIIa, plaice stocks could still create a very early choke point for the fleet and in the model these stocks are not considered to be eligible for interspecies flexibility but some benefit from de minimis might be possible.. 5 The scenario analysis treats Area VII as a single sea area and activity in each sub-area of Area VII is averaged across the year. See Chapter 3, Section 3.4 for further information on the analysis in Area VII. 64
70 England Nephrops Trawl Scenario Analysis Table 7-5: Northern Ireland nephrops trawl fleet segment - Top five choke stocks in Area VI and VII in 2016, 2017, 2018 and 2019 under combined policy lever scenario 4C Area VI (West of Scotland) Area VII Choke Stock Choke Point Choke Point Choke Point Choke Point Choke Stock Choke Stock Choke Stock Days % of 2013 Days % of 2013 Days % of 2013 Days % of 2013 No choke No choke No choke Plaice VI 162 5% Ling VI 162 5% Sole VI 162 5% Pollack VI 162 5% Hake VI 219 7% No choke No choke No choke Whiting VIIa 564 5% Plaice VIIa 1,105 10% Plaice VIIfg 1,658 15% Cod VIIa 3,756 34% Haddock VIIa 4,639 42% 65
71 7.6. IMPACT OF QUOTA TRADING PATTERNS IN 2013 Northern Ireland Nephrops Trawl Scenario Analysis The findings presented for the Northern Ireland nephrops trawl fleet segment above are from the bioeconomic scenario analysis that is based on end of year landings by the fleet segment. However, the bioeconomic scenario analysis was undertaken twice: Once based on initial quota allocation (IQA) in 2013 to the 50 fleet segments in the model; and Once based on end of year landings (EoY) by each fleet segment in End of year landings was taken as proxy for quota held at year end and therefore incorporates the impact of in-year quota trading. The purpose of undertaking the analysis twice was to understand the extent that historic patterns of quota trading from 2013 could change the outlook for the fleet segments once the landing obligation is implemented. See Chapter 3, section 3.10 for further explanation of the differences between and the characteristics of the two analyses. The quota trading which occurred in 2013 is not a fleet response to the landing obligation but the comparison does show how quota trading can have an influence on the outcome for different fleets and highlights potential vulnerability should quota trading be substantively affected by the landing obligation. The figures which follow compare findings for the Northern Ireland nephrops trawl fleet segment under combined policy lever scenario 4C from the IQA and EoY analyses: Figure 7-2 compares the estimated number of days the fleet could be fishing prior to a choke point being encountered in Areas IV, VI and VII under the IQA and EoY analyses in the years ; and Figure 7-3 compares the estimated revenue that could be earned by the Northern Ireland nephrops trawl fleet segment before choke under the IQA and EoY analyses in the years The findings from both analyses are shown as a percentage of days at sea and revenue in
72 Northern Ireland Nephrops Trawl Scenario Analysis 140% 120% 100% 80% 60% 40% 20% 0% 100% 100% 100% 100% 100% 98% 14% 7% IQA Choke Point EOY Choke Point Figure 7-2: Northern Ireland nephrops trawl fleet segment: comparison of choke point between IQA and EOY bioeconomic scenario analyses. Choke point shown as a % of days at sea in % 120% 100% 117% 117% 117% 111% 111% 109% 80% 60% 40% 20% 0% 21% 10% IQA Revenue EOY Revenue Figure 7-3: Northern Ireland nephrops trawl fleet segment: comparison of estimated revenue from demersal quota stocks between IQA and EOY bioeconomic scenario analyses. Revenue shown as a % of revenue earned from demersal quota stocks in
73 Scotland Whitefish Trawl/Seine Scenario Analysis 8. SCOTLAND WHITEFISH TRAWL/SEINE SCENARIO ANALYSIS The Scotland whitefish trawl/seine fleet segment is made up of five PO fleet segments defined in the model. The findings presented in the chapter are an aggregation of the findings for these PO fleet segments under five of the policy lever scenarios tested. The analysis presents the potential consequences of the landing obligation for the Scotland whitefish trawl/seine fleet segment, should the fleet continue to fish as it did in 2013, and the mitigation that could be offered by different policy lever scenarios. All scenarios assume the fleet continues to fish in the same way as it did in Unless otherwise stated, all analyses presented are from the end of year scenario analysis, which incorporates patterns of quota trading by the fleet segment in Chapter 8 presents the following analyses for the Scotland whitefish trawl/seine fleet segment: Characteristics of the fleet segment; Findings from the worst case scenario tested in the model i.e. the potential consequence of the landing obligation should no policy measures such as quota top-up be applied and should the fleet continue to fish as it did in 2013; The impact of five policy scenarios on the revenue of the fleet; The impact of five policy scenarios on the choke stocks that could be encountered by the Scotland whitefish trawl/seine fleet segment in its main sea areas and under each scenario; The top five choke stocks that the fleet segment could encounter under two scenarios in 2016, 2017, 2018 and 2019 and how the choke point might be delayed if a solution can be found for the primary choke stocks; and A comparison of the revenue results and choke points for the fleet segment between the scenario analysis based on end of year landings (EoY) and the scenario analysis based on initial quota allocation (IQA). 68
74 Scotland Whitefish Trawl/Seine Scenario Analysis 8.1. CHARACTERISTICS OF THE SCOTLAND WHITEFISH TRAWL/SEINE FLEET SEGMENT Number of vessels in 2013: 109 vessels Days at sea in 2013: Area IV (North Sea) 14,978 days Area VI (West of Scotland) 3,038 days Area VII 888 days Total 18,904 days Top 5 stocks landed in 2013 (by value in 000s): Haddock IV 28,054 Cod IV 17,524 Anglerfish IV 8,205 Whiting IV 7,561 Saithe IV 5,277 Total Revenue in 2013 ( 000s): Demersal quota stocks 94,786 PO fleet segments included in the fleet segment: Aberdeen FPO North East of Scotland Fishermen s Organisation Scottish Fishermen s Organisation Shetland FPO Other Scotland whitefish trawl/seine vessels Other Scotland whitefish trawl/seine vessels is a fleet segment created from PO whitefish trawl/seine fleet segments with fewer than five vessels. Other Scotland whitefish trawl/seine vessels includes vessels from the following POs: Lunar Northern PO Orkney FPO The Fife FPO 69
75 8.2. WORST CASE SCENARIO, BASELINE SCENARIO B1 Scotland Whitefish Trawl/Seine Scenario Analysis The model uses all of the data available to simulate when a choke point could occur for the Scotland whitefish trawl/seine fleet segment in each sea area, in each year and under each scenario. The worst case scenario, baseline scenario B1, represents the introduction of the landing obligation without any mitigating actions i.e. no catch allowances for zero-tac stocks, no quota top-up, no exemptions or derogations and it is assumed that the fleet will continue to fish as it did in Under baseline scenario B1 the revenue of the Scotland whitefish trawl/seine fleet segment is relatively unaffected in 2016 as revenue is expected to be 102% of 2013 levels. However by 2019, when all demersal quota stocks become subject to the landing obligation the revenue of the fleet segment could fall to 28% of 2013 revenue under the worst case scenario included in the model. Baseline scenario B1 is not reported on in the remaining analysis as it considered extremely unlikely that no policy levers will be applied IMPACT OF POLICY LEVER SCENARIOS: FLEET REVENUE The bioeconomic scenario analysis investigates the relative value of different policy levers to the Scotland whitefish trawl/seine fleet segment. The potential revenue impact on the fleet of the following five scenarios is presented: baseline scenario B3 (after quota top-up and catch allowances for zero-tac stocks but before exemptions and derogations); single policy lever scenario 1C de minimis STRICT, where 5% of UK quota for a choke stock can be discarded and not counted against total TAC; single policy lever scenario 2 interspecies flexibility, where a choke stock that is known to be within safe biological limits can receive a quota transfer from another stock on a kg for kg basis; single policy lever scenario 3 survivability exemption for skates and rays; and combined policy lever scenario 4C combined effect of single policy levers 1C, 2 and 3. Further detail on the scenarios can be found in Chapter 3, Section The estimated revenue under each scenario is shown as a percentage of the revenue earned by the fleet in Only revenue from demersal quota stocks is included in the analysis presented. Of the five scenarios, baseline scenario B3 will always show the weakest revenue, and combined policy lever 4C will always show the strongest revenue. If the revenue estimated under a policy lever scenario is greater than revenue estimated under baseline scenario B3 then the policy lever is generating a positive impact for the fleet segment by delaying or removing choke points. SUMMARY FINDINGS: FLEET REVENUE Figure 8-1 shows that in 2016 the estimated revenue for the Scotland whitefish trawl/seine fleet segment under all scenarios, including baseline scenario B3, is higher (113%) than the revenue earned by the fleet from demersal quota landings in The model limits effort to the number of days used by the Scotland whitefish trawl/seine fleet segment in 2013 therefore estimated revenue in excess of 100% of 2013 revenue occurs because: the fleet is benefitting from quota top-up for eligible quota stocks and therefore catch that was previously discarded can now be landed and sold; or a biomass improvement for ICES-assessed stocks has increased total catch; and there are no choke stocks expected or any choke stock has a minimal impact on effort. 70
76 Estimated revenue from demersal quota landings as a % of 2013 revenue from demersal quota landings Scotland Whitefish Trawl/Seine Scenario Analysis In 2017 under baseline scenario B3, choke stocks exist but estimated revenue remains above 2013 revenue (109%). The application of either policy lever scenario 1C (de minimis) or scenario 2 (interspecies flexibility) delays the choke points estimated revenue is 119% and 122% of 2013 revenue respectively. In 2018, scenario 1C (de minimis) and scenario 2 (interspecies flexibility) continue to delay the choke points expected under baseline scenario B3, however for the choke stocks expected in 2018 interspecies flexibility is expected to have greater benefit than de minimis. In 2019 when the landing obligation is fully implemented, it is estimated that under baseline scenario B3 choke stocks could reduce the revenue of the Scotland whitefish trawl/seine fleet segment to 39% of 2013 revenue. In isolation, the policy lever scenarios have some but limited effect. However in combination, the scenarios increase potential revenue to 58% of 2013 revenue. 140% 120% 100% 80% 60% 40% 20% 0% Baseline B3 113% 109% 76% 39% 40% 41% 40% Scenario 1c 113% 119% 81% 41% 43% 44% 44% Scenario 2 113% 122% 117% 43% 45% 46% 47% Scenario 3 113% 109% 76% 44% 43% 41% 40% Scenario 4c 113% 121% 114% 58% 60% 62% 64% Figure 8-1: Relative impact of different policy lever scenarios on the estimated revenue from demersal quota stock landings by the Scotland whitefish trawl/seine fleet segment, IMPACT OF POLICY LEVER SCENARIOS: CHOKE STOCKS The graph above highlights that as the fleet segment moves towards full implementation of the landing obligation in 2019 that the revenue of the fleet segment could fall below revenue earned in Revenue is restricted to less than 100% of the revenue earned in 2013 because the Scotland whitefish trawl/seine fleet segment is expected to encounter a choke stock before it can equal the number of days the fleet fished in The next four tables present the revenue findings for the Scotland whitefish trawl/seine fleet segment alongside the choke stocks, and their associated choke point, in each sea area. The sea areas presented for the Scotland whitefish trawl/seine fleet segment are the sea areas where the fleet fished for more than 10% of its total days at sea in
77 Scotland Whitefish Trawl/Seine Scenario Analysis Each table contains the findings from the bioeconomic scenario analysis for one year (2016, 2017, 2018 or 2019). Each table presents: The estimated revenue that could be earned by the fleet under each scenario, as summarised in the analysis above; The expected choke stock(s) in each sea area under each scenario; The estimated choke point for each choke stock, shown as a percentage of 2013 days at sea in each sea area; and An explanation as to why the scenario has, or does not have, an impact on the fleet segment. 72
78 Table 8-1: Bioeconomic Scenario Analysis Findings for 2016 Scotland Whitefish Trawl/Seine Fleet Segment (analysis based on end of year landings) Estimated revenue from Scenarios Primary choke stock and choke point demersal quota stocks Revenue as % points Choke point Comment Primary Choke Ref Description % of 2013 above Area as % of 2013 Stock(s) revenue scenario B3 days B3 1C 2 3 4C Introduction of LO with catch allowance for zero-tac stocks and quota top-up De minimis strict: 5% of UK share of TAC can be discarded Interspecies flexibility for stocks considered to be in safe biological limits Survivability: skates and rays only Combination of scenarios 1C, 2 and Scotland Whitefish Trawl/Seine Scenario Analysis IV No choke - In 2016 revenue under baseline scenario B3 is estimated to exceed revenue earned from demersal quota stocks in 2013 by 13 percentage points. This is because no VI No choke - choke stocks are expected and quota top-up means that fish previously discarded can be landed and sold. IV No choke - Policy levers are not required as no choke stocks are identified for VI No choke - IV No choke - Policy levers are not required as no choke stocks are identified for VI No choke - IV No choke - Policy levers are not required as no choke stocks are identified for VI No choke - IV No choke - Policy levers are not required as no choke stocks are identified for VI No choke - 73
79 Table 8-2: Bioeconomic Scenario Analysis Findings for 2017 Scotland Whitefish Trawl/Seine Fleet Segment (analysis based on end of year landings) Estimated revenue from Scenarios Primary choke stock and choke point demersal quota stocks Revenue as % points Choke point Comment Primary Choke Ref Description % of 2013 above Area as % of 2013 Stock(s) revenue scenario B3 days B3 1C Introduction of LO with catch allowance for zero-tac stocks and quota top-up De minimis strict: 5% of UK share of TAC can be discarded IV Sole IV 89 VI Saithe VI 74 IV No choke - VI Saithe VI 74 Scotland Whitefish Trawl/Seine Scenario Analysis In 2017 revenue under baseline scenario B3 is estimated to exceed revenue earned from demersal quota stocks in 2013 by 9 percentage points. Choke stocks are expected in both Areas IV and Area VI but the benefit of quota top-up is expected to support the fleet to earn revenue in excess of the revenue earned from demersal quota stocks in Quota top-up means that catch previously discarded can be landed and sold. Under de minimis strict (scenario 1C) the revenue of the fleet could be 10 percentage points higher than under baseline scenario B3 and exceed the revenue earned by the fleet in This is because scenario 1C can remove sole as a choke stock in Area IV and no other choke stocks are expected. In Area VI de minimis does not provide a benefit to this fleet segment because the majority of de minimis for saithe is allocated to another fleet segment C Interspecies flexibility for stocks considered to be in safe biological limits Survivability: skates and rays only Combination of scenarios 1C, 2 and IV VI No choke Saithe VI - 94 Under interspecies flexibility the revenue of the fleet could be 13 percentage points higher than under baseline scenario B3 and exceed the revenue earned by the fleet in Interspecies flexibility could be used for sole in Area IV and could remove it as the primary choke stock. Interspecies flexibility could also be used for saithe in Area VI and it could delay the choke point in 2017 by 20 percentage points, compared to baseline scenario B3, and support the fleet to fish in Area VI at close to the number of days fished in 2013 (94%). IV Sole IV 89 Sole and saithe are not considered survivable in scenario 3 therefore the scenario VI Saithe VI 74 has no benefit compared to baseline scenario B3. IV No choke - The combination of de minimis strict, interspecies flexibility and survivability does not create additional revenue benefit compared to the single policy lever scenario VI Saithe VI 93 of interspecies flexibility. 74
80 Scotland Whitefish Trawl/Seine Scenario Analysis Table 8-3: Bioeconomic Scenario Analysis Findings for 2018 Scotland Whitefish Trawl/Seine Fleet Segment (analysis based on end of year landings) Estimated revenue from Scenarios Primary choke stock and choke point demersal quota stocks Revenue as % points Choke point Comment Primary Choke Ref Description % of 2013 above Area as % of 2013 Stock(s) revenue scenario B3 days Introduction of LO with catch IV Saithe IV 54 In 2018 revenue under baseline scenario B3 is estimated to be 76% of revenue B3 allowance for zero-tac stocks 76 - earned from demersal quota stocks in 2013 as choke stocks could be encountered and quota top-up VI Saithe VI 74 in Areas IV and VI. 1C 2 3 4C De minimis strict: 5% of UK share of TAC can be discarded Interspecies flexibility for stocks considered to be in safe biological limits Survivability: skates and rays only Combination of scenarios 1C, 2 and IV VI Saithe IV Saithe VI Under de minimis strict the revenue of the fleet could be 5 percentage points higher than under baseline scenario B3. De minimis strict would not change the primary choke stock in Area IV or Area VI. However, it would delay the choke point in Area IV compared to baseline scenario B3 and this is sufficient to support the improvement in revenue. Under interspecies flexibility the revenue of the fleet could be 41 percentage points higher than under baseline scenario B3 and exceed the revenue earned by IV Saithe IV 90 the fleet in Interspecies flexibility could be used for saithe in Area IV and Area VI and it could delay the choke point in Area IV by 36 percentage points and by 18 percentage points, compared to baseline scenario B3. Although scenario 2 does not suppor VI Saithe VI 92 the fleet to fish for the same number of days as fished in 2013, the quota top-up means that fish previously discarded can be landed and sold and this supports higher revenues than experienced in IV Saithe IV 54 Saithe is not considered survivable in scenario 3 therefore the scenario has no VI Saithe VI 74 benefit compared to baseline scenario B3. IV Saithe IV 89 The combination of de minimis strict, interspecies flexibility and survivability does appear to create one percentage point of additional revenue benefit compared to VI Saithe VI 91 the single policy lever scenario of interspecies flexibility. Small variances between scenarios in the findings for an aggregated fleet segment are due to different allocations of de minimis across the UK fleet. 75
81 Scotland Whitefish Trawl/Seine Scenario Analysis Table 8-4: Bioeconomic Scenario Analysis Findings for 2019 Scotland Whitefish Trawl/Seine Fleet Segment (analysis based on end of year landings) Estimated revenue from Scenarios Primary choke stock and choke point demersal quota stocks Revenue as % points Choke point Comment Primary Choke Ref Description % of 2013 above Area as % of 2013 Stock(s) revenue scenario B3 days Introduction of LO with catch IV Skate 39 In 2019 revenue under baseline scenario B3 is estimated to be 39% of revenue B3 allowance for zero-tac stocks 39 - earned from demersal quota stocks in 2013 as choke stocks could be encountered and quota top-up VI Hake 46 in Areas IV and VI. 1C 2 3 4C De minimis strict: 5% of UK share of TAC can be discarded Interspecies flexibility for stocks considered to be in safe biological limits Survivability: skates and rays only Combination of scenarios 1C, 2 and IV Skate IV 41 VI Hake VI 46 IV Skate IV 39 VI Plaice VI 69 IV Saithe IV 49 VI Hake VI 46 IV Dab IV 55 VI Plaice VI 69 Under de minimis strict the revenue of the fleet could be 2 percentage points higher than under baseline scenario B3. De minimis strict scenario does not change the primary choke stock in either Area IV or VI, nor the choke point in Area VI. However, the scenario does delay the choke point in Area IV by 2 percentage points and therefore, compared to baseline scenario B3, de minimis strict has some effect in Under interspecies flexibility the revenue of the fleet could be 4 percentage points higher than under baseline scenario B3. Interspecies flexibility scenario cannot be used for skate in Area IV as the stock was not known to be in safe biological limits in Interspecies flexibility could be used for hake in Area VI and it could delay the choke point in 2019 by 23 percentage points, compared to baseline scenario B3. Under survivability the revenue of the fleet could be 5 percentage points higher than under baseline scenario B3. In the model skates and rays are considered to be survivable and therefore are exempt from the landing obligation. Under scenario 3, in Area IV the choke stock becomes saithe and the choke point is delayed by 10 percentage points, compared to baseline scenario B3. Hake is not considered survivable in scenario 3 therefore the scenario has no benefit in Area VI. The combination of de minimis strict, interspecies flexibility and survivability does create additional revenue benefit compared to any single policy lever. The combination results in a new primary choke stock in Area IV and the same result in Area VI that is expected under scenario 2. The choke stock in Area IV becomes dab and the choke point occurs at 55% of the days fished in Area IV in In Area VI the choke stock is plaice and the choke point occurs at 69% of the days fished in
82 England Nephrops Trawl Scenario Analysis 8.5. IMPACT OF POLICY LEVER SCENARIOS: TOP 5 CHOKE STOCKS UNDER SCENARIO 4C The table which follows presents the top five choke stocks for the Scotland whitefish trawl/seine fleet segment and their estimated choke point under combined policy lever 4C in 2016, 2017, 2018 and The choke points are presented in the number of fishing days available to the aggregated fleet segment for a particular stock. The days shown are the sum of the choke points calculated for each stock for individual PO fleet segments included in the Scotland whitefish trawl/seine fleet segment. The stock with the earliest choke point, i.e. the least number of days across all PO fleet segments included in the Scotland whitefish trawl/seine fleet segment, is identified as the primary choke stock for the aggregated fleet segment. It is possible that each PO fleet segment has a different primary choke stock. The purpose of presenting the top five choke stocks is: to show which other stocks, in addition to the primary choke stock, could create a potential choke point for the Scotland whitefish trawl/seine fleet segment; and to provide information on the top 5 potential chokes so that if the reader considers that a solution can be found for the primary choke stock, or believes that the primary choke stock is wrong, it is possible to identify when the next choke point could occur and the stock that could cause it. It is possible that more than one primary choke stock exists, i.e. the top two, three or four choke stocks all share the same choke point. This is more likely to occur under the combined policy lever scenarios as the exemptions and derogations can help to balance the choke point between stocks. SUMMARY FINDINGS: TOP 5 CHOKE STOCKS Table 8-5 presents the top five choke stocks expected under the best case scenario in the presented analysis, combined policy lever scenario 4C. In 2019 under scenario 4C the primary choke stocks for the Scotland whitefish trawl/seine fleet segment are expected to be: dabs in Area IV, with the choke point expected at 55% of the days fished in Area IV in 2013; and plaice in Area VI, with the choke point expected at 69% of the days fished in Area VI in Should avoidance measures be expected to address these choke stocks, or if it is believed that the true discard rate for the stock is less than the discard rate used in the analysis, then the second choke stocks could become more important. Once all policy levers have been applied and a choke point has occurred, the model does not continue to try to find policy solutions for the second, third or fourth choke stocks. Therefore if the primary choke stocks can be addressed through other mitigation measures, or are believed unlikely to occur in the future, then policy levers could be applied to delay the choke point identified for the secondary choke stocks in the table. For example, the analysis shows if dabs IV can be removed as the primary choke stock the choke point could be delayed by at least 6 percentage points, and the primary choke stock could be tusk IV. In the model tusk IV is not considered eligible for interspecies flexibility and de minimis may offer limited benefit as the TAC is very low so a further delay may be dependent on alternative mitigation efforts. In Area VI, if the Scotland whitefish trawl/seine fleet segment can avoid choking on plaice the next choke stocks could be saithe and ling which would delay the choke point to three-quarters of the days fished in Area VI in In the model, interspecies flexibility is not available for ling VI and with a low UK quota there could be no, or limited benefit, available from the de minimis scenario applied in the model. 77
83 England Nephrops Trawl Scenario Analysis Table 8-5: Scotland whitefish trawl/seine fleet segment - Top five choke stocks in Areas IV and VI in 2016, 2017, 2018 and 2019 under combined policy lever scenario 4C Area IV (North Sea) Area VI (West of Scotland) Choke Stock Choke Point Choke Point Choke Point Choke Point Choke Stock Choke Stock Choke Stock Days % of 2013 Days % of 2013 Days % of 2013 Days % of 2013 No choke No choke Saithe IV 13,345 89% Dabs IV 8,251 55% Sole IV 14,182 95% Tusk IV 9,204 61% Haddock IV 14,442 96% Saithe IV 9,824 66% Cod IV 14, % Hake IV 10,030 67% Ling IV 10,256 68% No choke Saithe VI 2,814 93% Saithe VI 2,780 91% Plaice VI 2,105 69% Saithe VI 2,236 74% Ling VI 2,269 75% Megrim VI 2,787 92% Anglerfish VI 2,994 99% 78
84 8.6. IMPACT OF QUOTA TRADING PATTERNS IN 2013 Scotland Whitefish Trawl Scenario Analysis The findings presented for the Scotland whitefish trawl/seine fleet segment above are from the bioeconomic scenario analysis that is based on end of year landings by the fleet segment. However, the bioeconomic scenario analysis was undertaken twice: Once based on initial quota allocation (IQA) in 2013 to the 50 fleet segments in the model; and Once based on end of year landings (EoY) by each fleet segment in End of year landings was taken as proxy for quota held at year end and therefore incorporates the impact of in-year quota trading. The purpose of undertaking the analysis twice was to understand the extent that historic patterns of quota trading from 2013 could change the outlook for the fleet segments once the landing obligation is implemented. See Chapter 3, section 3.10 for further explanation of the differences between and the characteristics of the two analyses. The quota trading which occurred in 2013 is not a fleet response to the landing obligation but the comparison does show how quota trading can have an influence on the outcome for different fleets and highlights potential vulnerability should quota trading be substantively affected by the landing obligation. The figures which follow compare findings for the Scotland whitefish trawl/seine fleet segment under combined policy lever scenario 4C from the IQA and EoY analyses: Figure 8-2 compares the estimated number of days the fleet could be fishing prior to a choke point being encountered in Areas IV, VI and VII under the IQA and EoY analyses in the years ; and Figure 8-3 compares the estimated revenue that could be earned by the Scotland whitefish trawl/seine fleet segment before choke under the IQA and EoY analyses in the years The findings from both analyses are shown as a percentage of days at sea and revenue in
85 Scotland Whitefish Trawl Scenario Analysis 140% 120% 100% 80% 60% 40% 20% 0% 100% 89% 99% 90% 78% 73% 59% 52% IQA Choke Point EOY Choke Point Figure 8-2: Scotland whitefish trawl/seine fleet segment: comparison of choke point between IQA and EOY bioeconomic scenario analyses. Choke point shown as a % of days at sea in % 120% 100% 80% 60% 113% 121% 87% 88% 114% 84% 59% 58% 40% 20% 0% IQA Revenue EOY Revenue Figure 8-3: Scotland whitefish trawl/seine fleet segment: comparison of estimated revenue from demersal quota stocks between IQA and EOY bioeconomic scenario analyses. Revenue shown as a % of revenue earned from demersal quota stocks in
86 9. SCOTLAND NEPHROPS TRAWL SCENARIO ANALYSIS Scotland Nephrops Trawl Scenario Analysis The Scotland nephrops trawl fleet segment is made up of five PO fleet segments. The findings presented in the chapter are an aggregation of the findings for these PO fleet segments under five of the policy lever scenarios tested. The analysis presents the potential consequences of the landing obligation for the Scotland nephrops trawl fleet segment, should the fleet continue to fish as it did in 2013, and the mitigation that could be offered by different policy lever scenarios. All scenarios assume the fleet continues to fish in the same way as it did in Unless otherwise stated, all analyses presented are from the end of year scenario analysis, which incorporates patterns of quota trading by the fleet segment in Chapter 9 presents the following analyses for the Scotland nephrops trawl fleet segment: Characteristics of the fleet segment; Findings from the worst case scenario tested in the model i.e. the potential consequence of the landing obligation should no policy measures such as quota top-up be applied and should the fleet continue to fish as it did in 2013; The impact of five policy scenarios on the revenue of the fleet; The impact of five policy scenarios on the choke stocks that could be encountered by the Scotland nephrops trawl fleet segment in its main sea areas and under each scenario; The top five choke stocks that the fleet segment could encounter under two scenarios in 2016, 2017, 2018 and 2019 and how the choke point might be delayed if a solution can be found for the primary choke stocks; and A comparison of the revenue results and choke points for the fleet segment between the scenario analysis based on end of year landings (EoY) and the scenario analysis based on initial quota allocation (IQA). 81
87 Scotland Nephrops Trawl Scenario Analysis 9.1. CHARACTERISTICS OF THE SCOTLAND NEPHROPS TRAWL FLEET SEGMENT Number of vessels in 2013: 170 vessels Days at sea in 2013: Area IV (North Sea) 9,998 days Area VI (West of Scotland) 17,553 days Area VII 615 days Total 28,166 days Top 5 stocks landed in 2013 (by value in 000s): Nephrops VI 21,744 Nephrops IV 14,580 Anglerfish IV 1,885 Haddock IV 1,513 Whiting IV 1,054 Total Revenue in 2013 ( 000s): Demersal quota stocks 43,914 PO fleet segments included in the fleet segment: North East of Scotland Fishermen s Organisation Northern Producers Organisation Scottish Fishermen s Organisation The Fife FPO West of Scotland FPO 9.2. WORST CASE SCENARIO, BASELINE SCENARIO B1 The model uses all of the data available to simulate when a choke point could occur for the Scotland nephrops trawl fleet segment in each sea area, in each year and under each scenario. The worst case scenario, baseline scenario B1, represents the introduction of the landing obligation without any mitigating actions i.e. no catch allowances for zero-tac stocks, no quota top-up, no exemptions or derogations and it is assumed that the fleet will continue to fish as it did in Under baseline scenario B1 the revenue of the Scotland nephrops trawl fleet segment is expected to be 75% of 2013 levels. However by 2019, when all demersal quota stocks become subject to the landing obligation the revenue of the fleet segment could fall dramatically to 4% of 2013 revenue under the worst case scenario included in the model. Baseline scenario B1 is not reported on in the remaining analysis as it considered extremely unlikely that no policy levers will be applied IMPACT OF POLICY LEVER SCENARIOS: FLEET REVENUE The bioeconomic scenario analysis investigates the relative value of different policy levers to the Scotland nephrops trawl fleet segment. The potential revenue impact on the fleet of the following five scenarios is presented: baseline scenario B3 (after quota top-up and catch allowances for zero-tac stocks but before exemptions and derogations); 82
88 Scotland Nephrops Trawl Scenario Analysis single policy lever scenario 1C de minimis STRICT, where 5% of UK quota for a choke stock can be discarded and not counted against total TAC; single policy lever scenario 2 interspecies flexibility, where a choke stock that is known to be within safe biological limits can receive a quota transfer from another stock on a kg for kg basis; single policy lever scenario 3 survivability exemption for skates and rays; and combined policy lever scenario 4C combined effect of single policy levers 1C, 2 and 3. Further detail on the scenarios can be found in Chapter 3, Section The estimated revenue under each scenario is shown as a percentage of the revenue earned by the fleet in Only revenue from demersal quota stocks is included in the analysis presented. Of the five scenarios, baseline scenario B3 will always show the weakest revenue, and combined policy lever 4C will always show the strongest revenue. If the revenue estimated under a policy lever scenario is greater than revenue estimated under baseline scenario B3 then the policy lever is generating a positive impact for the fleet segment by delaying or removing choke points. SUMMARY FINDINGS: FLEET REVENUE Figure 9-1 shows that in 2016 the estimated revenue for the Scotland nephrops trawl fleet segment under scenario 3 (interspecies flexibility) is higher (104%) than the revenue earned by the fleet from demersal quota landings in The model limits effort to the number of days used by the Scotland nephrops trawl fleet segment in 2013 therefore estimated revenue in excess of 100% of 2013 revenue occurs because: the fleet is benefitting from quota top-up for eligible quota stocks and therefore catch that was previously discarded can now be landed and sold; or a biomass improvement for ICES-assessed stocks has increased total catch; and there are no choke stocks expected or any choke stock has a minimal impact on effort. In 2016 choke stocks are expected under baseline scenario B3 and the revenue of the fleet could be 89% of revenue earned in 2013 revenue (109%). In 2017 under baseline scenario B3, choke stocks could limit revenue to 90% of 2013 revenue. However the application of either policy lever scenario 1C (de minimis) or scenario 2 (interspecies flexibility) delays the choke points and as a result revenue could exceed the revenue earned in 2013 (102% and 107% respectively). In 2018, scenario 1C (de minimis) continues to delay the choke points expected under baseline scenario B3, however for the choke stocks expected in 2018 interspecies flexibility is expected to have limited benefit. In 2019 when the landing obligation is fully implemented, it is estimated that under baseline scenario B3 choke stocks could dramatically reduce the revenue of the Scotland nephrops trawl fleet segment to 6% of 2013 revenue. In isolation, the policy lever scenarios have limited or no effect but in combination provide a small benefit which increases potential revenue to 10% of 2013 revenue. 83
89 Estimated revenue from demersal quota landings as a % of 2013 revenue from demersal quota landings Scotland Nephrops Trawl Scenario Analysis 120% 100% 80% 60% 40% 20% 0% Baseline B3 89% 90% 75% 6% 6% 6% 6% Scenario 1c 92% 102% 94% 7% 8% 8% 8% Scenario 2 104% 107% 76% 6% 6% 6% 6% Scenario 3 89% 90% 75% 6% 6% 6% 6% Scenario 4c 104% 106% 94% 10% 10% 10% 10% Figure 9-1: Relative impact of different policy lever scenarios on the estimated revenue from demersal quota stock landings by the Scotland neprhops trawl fleet segment, IMPACT OF POLICY LEVER SCENARIOS: CHOKE STOCKS The graph above highlights that as the fleet segment moves towards full implementation of the landing obligation in 2019 that the revenue of the fleet segment could fall below revenue earned in Revenue is restricted to less than 100% of the revenue earned in 2013 because the Scotland nephrops trawl fleet segment is expected to encounter a choke stock before it can equal the number of days the fleet fished in The next four tables present the revenue findings for the Scotland nephrops trawl fleet segment alongside the choke stocks, and their associated choke point, in each sea area. The sea areas presented for the Scotland nephrops trawl fleet segment are the sea areas where the fleet fished for more than 10% of its total days at sea in Each table contains the findings from the bioeconomic scenario analysis for one year (2016, 2017, 2018 or 2019). Each table presents: The estimated revenue that could be earned by the fleet under each scenario, as summarised in the analysis above; The expected choke stock(s) in each sea area under each scenario; The estimated choke point for each choke stock, shown as a percentage of 2013 days at sea in each sea area; and An explanation as to why the scenario has, or does not have, an impact on the fleet segment. 84
90 Scotland Nephrops Trawl Scenario Analysis Table 9-1: Bioeconomic Scenario Analysis Findings for 2016 Scotland Nephrops Trawl Fleet Segment (analysis based on end of year landings) Estimated revenue from Scenarios Primary choke stock and choke point demersal quota stocks Revenue as % points Choke point Comment Primary Choke Ref Description % of 2013 above Area as % of 2013 Stock(s) revenue scenario B3 days Introduction of LO with catch IV Sole IV 66 In 2016 revenue under baseline scenario B3 is estimated to be 89% of revenue B3 allowance for zero-tac stocks 89 - earned from demersal quota stocks in 2013 as a choke stock could be encountered and quota top-up VI No choke - in Area IV. 1C 2 3 4C De minimis strict: 5% of UK share of TAC can be discarded Interspecies flexibility for stocks considered to be in safe biological limits Survivability: skates and rays only Combination of scenarios 1C, 2 and IV VI Sole IV No choke 72 - Under de minimis strict the revenue of the fleet could be 3 percentage points higher than under baseline scenario B3. De minimis strict is not expected to change the primary choke stock in Area IV but it could delay the choke point by 6 percentage points, compared to baseline scenario B3. No choke stock is expected in Area VI in 2016 therefore the scenario is not required in Area VI. Under interspecies flexibility the revenue of the fleet could be 15 percentage IV No choke - points higher than under baseline scenario B3 and exceed the revenue earned by the fleet in VI No choke - Interspecies flexibility could be used for sole in Area IV and the benefit could be sufficient to remove sole IV as a potential choke stock. IV Sole IV 66 Sole is not considered survivable in scenario 3 therefore the scenario has no VI No choke - benefit compared to baseline scenario B3. IV No choke - The combination of de minimis strict, interspecies flexibility and survivability does not create additional revenue benefit compared to the single policy lever scenario VI No choke - of interspecies flexibility. 85
91 Scotland Nephrops Trawl Scenario Analysis Table 9-2: Bioeconomic Scenario Analysis Findings for 2017 Scotland Nephrops Trawl Fleet Segment (analysis based on end of year landings) Estimated revenue from Scenarios Primary choke stock and choke point demersal quota stocks Revenue as % points Choke point Comment Primary Choke Ref Description % of 2013 above Area as % of 2013 Stock(s) revenue scenario B3 days Introduction of LO with catch IV Sole IV 66 In 2016 revenue under baseline scenario B3 is estimated to be 90% of revenue B3 allowance for zero-tac stocks 90 - earned from demersal quota stocks in 2013 as a choke stock could be encountered and quota top-up VI No choke - in Area IV. 1C 2 3 4C De minimis strict: 5% of UK share of TAC can be discarded Interspecies flexibility for stocks considered to be in safe biological limits Survivability: skates and rays only Combination of scenarios 1C, 2 and Under de minimis strict the revenue of the fleet could be 12 percentage points IV Sole IV 91 higher than under baseline scenario B3 and exceed the revenue earned by the fleet in The choke point is delayed further than in 2016 because the beam trawl fleet is receiving less of the de minimis allocation for sole IV as it faces a different choke stock in De minimis strict is not expected to change the primary choke stock in Area IV but VI No choke - it could delay the choke point by 25 percentage points, compared to baseline scenario B3. No choke stock is expected in Area VI in 2017 therefore the scenario is not required in Area VI. Under interspecies flexibility the revenue of the fleet could be 17 percentage IV No choke - points higher than under baseline scenario B3 and exceed the revenue earned by the fleet in VI No choke - Interspecies flexibility could be used for sole in Area IV and the benefit could be sufficient to remove sole IV as a potential choke stock. IV Sole IV 66 Sole is not considered survivable in scenario 3 therefore the scenario has no VI No choke - benefit compared to baseline scenario B3. IV No choke - The combination of de minimis strict, interspecies flexibility and survivability does VI No choke - not create additional revenue benefit compared to the single policy lever scenario of interspecies flexibility. 86
92 Scotland Nephrops Trawl Scenario Analysis Table 9-3: Bioeconomic Scenario Analysis Findings for 2018 Scotland Nephrops Trawl Fleet Segment (analysis based on end of year landings) Estimated revenue from Scenarios Primary choke stock and choke point demersal quota stocks Revenue as % points Choke point Comment Primary Choke Ref Description % of 2013 above Area as % of 2013 Stock(s) revenue scenario B3 days Introduction of LO with catch IV Cod IV 36 In 2018 revenue under baseline scenario B3 is estimated to be 75% of revenue B3 allowance for zero-tac stocks 75 - earned from demersal quota stocks in 2013 as choke stocks could be encountered and quota top-up VI No choke - in Area IV. 1C 2 3 4C De minimis strict: 5% of UK share of TAC can be discarded Interspecies flexibility for stocks considered to be in safe biological limits Survivability: skates and rays only Combination of scenarios 1C, 2 and IV Cod, plaice, sole IV VI No choke - 75 IV Cod IV 38 VI No choke - Under de minimis strict the revenue of the fleet could be 19 percentage points higher than under baseline scenario B3. De minimis strict scenario would not remove cod IV as a primary choke stock but could delay the choke point by 29 percentage points. With a delayed choke point it is estimated that plaice IV and sole IV could also become primary choke stocks in Area IV. Policy levers are not required in Area VI as no choke stocks are identified for Under interspecies flexibility the revenue of the fleet could be one percentage point higher than under baseline scenario B3. The interspecies flexibility scenario cannot be used for cod in Area IV therefore the small difference between scenario 2 and baseline scenario B3 occurs because at least one PO fleet segment included in the aggregated home nation segment had a different primary choke stock and has been able to delay its choke point. IV Cod IV 36 Cod not considered survivable in scenario 3 therefore the scenario has no benefit VI No choke - compared to baseline scenario B3. IV Cod, plaice, The combination of de minimis strict, interspecies flexibility and survivability does 75 sole IV not create additional revenue benefit in 2018 compared to single policy lever VI No choke - scenario 1C, de minimis strict. 87
93 Table 9-4: Bioeconomic Scenario Analysis Findings for 2019 Scotland Nephrops Trawl Fleet Segment (analysis based on end of year landings) Estimated revenue from Scenarios Primary choke stock and choke point demersal quota stocks Revenue as % points Choke point Comment Primary Choke Ref Description % of 2013 above Area as % of 2013 Stock(s) revenue scenario B3 days B3 1C 2 Introduction of LO with catch allowance for zero-tac stocks and quota top-up De minimis strict: 5% of UK share of TAC can be discarded Interspecies flexibility for stocks considered to be in safe biological limits Scotland Nephrops Trawl Scenario Analysis IV Hake, skate IV 6 In 2019 revenue under baseline scenario B3 is estimated to be 6% of revenue earned from demersal quota stocks in 2013 as choke stocks could be encountered Plaice, ling, VI 5 very early in Areas IV and VI. saithe VI IV Hake, skate IV 8 VI Plaice, ling, saithe VI IV Skate IV 6 VI Plaice, ling VI 5 5 Under de minimis strict the revenue of the fleet could be one percentage point higher than under baseline scenario B3. De minimis strict would not change the primary choke stocks in Area IV or VI or the choke point in Area VI. However the scenario could change the choke point in Area IV therefore, compared to baseline scenario B3, de minimis strict has some, albeit limited, effect in Interspecies flexibility cannot be used for skate in Area IV or plaice and ling in Area VI as all three primary choke stocks were not known to be in safe biological limits in C Survivability: skates and rays only Combination of scenarios 1C, 2 and IV Hake IV 6 Skate is considered survivable in scenario 3 but because hake is also expected to VI Plaice, ling, be a primary choke stock in Area IV the scenario has no benefit compared to 5 saithe VI baseline scenario B3. The combination of de minimis strict, interspecies flexibility and survivability does IV Dab IV 14 create additional revenue benefit. The combination does not change the choke point expected in Area VI. However, in Area IV, the combination of interspecies flexibility and survivability does remove skate and hake as primary choke stocks VI Plaice, ling VI 5 and the primary choke stock becomes dab which delays the choke point by 8 percentage points compared to baseline scenario B3. 88
94 England Nephrops Trawl Scenario Analysis 9.5. IMPACT OF POLICY LEVER SCENARIOS: TOP 5 CHOKE STOCKS UNDER SCENARIO 4C The table which follows presents the top five choke stocks for the Scotland nephrops trawl fleet segment and their estimated choke point under combined policy lever 4C in 2016, 2017, 2018 and The choke points are presented in the number of fishing days available to the aggregated fleet segment for a particular stock. The days shown are the sum of the choke points calculated for each stock for individual PO fleet segments included in the Scotland nephrops trawl fleet segment. The stock with the earliest choke point, i.e. the least number of days across all PO fleet segments included in the Scotland nephrops trawl fleet segment, is identified as the primary choke stock for the aggregated fleet segment. It is possible that each PO fleet segment has a different primary choke stock. The purpose of presenting the top five choke stocks is: to show which other stocks, in addition to the primary choke stock, could create a potential choke point for the Scotland nephrops trawl fleet segment; and to provide information on the top 5 potential chokes so that if the reader considers that a solution can be found for the primary choke stock, or believes that the primary choke stock is wrong, it is possible to identify when the next choke point could occur and the stock that could cause it. It is possible that more than one primary choke stock exists, i.e. the top two, three or four choke stocks all share the same choke point. This is more likely to occur under the combined policy lever scenarios as the exemptions and derogations can help to balance the choke point between stocks. SUMMARY FINDINGS: TOP 5 CHOKE STOCKS Table 9-5 presents the top five choke stocks expected under the best case scenario in the presented analysis, combined policy lever scenario 4C. In 2019 under scenario 4C the primary choke stocks for the Scotland nephrops trawl fleet segment are expected to be: dabs in Area IV, with the choke point expected at 14% of the days fished in Area IV in 2013; and plaice and ling in Area VI, with the choke point expected at 5% of the days fished in Area VI in Should avoidance measures be expected to address these choke stocks, or if it is believed that the true discard rate for the stock is less than the discard rate used in the analysis, then the second choke stocks could become more important. Once all policy levers have been applied and a choke point has occurred, the model does not continue to try to find policy solutions for the second, third or fourth choke stocks. Therefore if the primary choke stocks can be addressed through other mitigation measures, or are believed unlikely to occur in the future, then policy levers could be applied to delay the choke point identified for the secondary choke stocks in the table. For example, the analysis shows if dabs IV can be removed as the primary choke stock the choke point could be delayed by at least 20 percentage points, and the primary choke stock might be hake IV. However in the model, hake IV is considered eligible for interspecies flexibility and it may be possible that a further delay to the identified choke point for hake IV could occur and cod could then become the primary choke stock. In Area VI, if the Scotland nephrops trawl fleet segment can avoid choking on plaice and ling the next choke point could occur quickly as a result of a lack of quota for sole VI and hake VI. In the model interspecies flexibility is available for these stocks but with a low UK quota there are likely to be no, or very limited, policy solutions that could be applied to pollack VI 89
95 England Nephrops Trawl Scenario Analysis Table 9-5: Scotland nephrops trawl fleet segment - Top five choke stocks in Areas IV and VI in 2016, 2017, 2018 and 2019 under combined policy lever scenario 4C Area IV (North Sea) Area VI (West of Scotland) Choke Stock Choke Point Choke Point Choke Point Choke Point Choke Stock Choke Stock Choke Stock Days % of 2013 Days % of 2013 Days % of 2013 Days % of 2013 No choke No choke Sole IV 7,485 75% Dabs IV 1,352 14% Cod IV 7,485 75% Hake IV 3,428 34% Plaice IV 7,485 75% Cod IV 3,661 37% Saithe IV 7,815 78% Tusk IV 3,690 37% Haddock IV 9,496 95% Turbot IV 3,860 39% No choke No choke No choke Plaice VI 878 5% Ling VI 878 5% Sole VI 1,157 7% Hake VI 1,188 7% Pollack VI 1,978 11% 90
96 Scotland Nephrops Trawl Scenario Analysis 9.6. IMPACT OF QUOTA TRADING PATTERNS IN 2013 The findings presented for the Scotland nephrops trawl fleet segment above are from a bioeconomic scenario analysis that is based on end of year landings by the fleet segment. However, the bioeconomic scenario analysis was undertaken twice: Once based on initial quota allocation (IQA) in 2013 to the 50 fleet segments in the model; and Once based on end of year landings (EoY) by each fleet segment in End of year landings was taken as proxy for quota held at year end and therefore incorporates the impact of in-year quota trading. The purpose of undertaking the analysis twice was to understand the extent that patterns of quota trading from 2013 could change the outlook for the fleet segments once the landing obligation is implemented. See Chapter 3, section 3.10 for further explanation of the differences between and the characteristics of the two analyses. The quota trading which occurred in 2013 is not a fleet response to the landing obligation but the comparison does show how quota trading can have an influence on the outcome for different fleets and highlights potential vulnerability should quota trading be substantively affected by the landing obligation. The figures which follow compare findings for the Scotland nephrops trawl fleet segment under combined policy lever scenario 4C from the IQA and EoY analyses: Figure 9-2 compares the estimated number of days the fleet could be fishing prior to a choke point being encountered under the IQA and EoY analyses in Areas IV, VI and VII in the years ; and Figure 9-3 compares the estimated revenue that could be earned by the Scotland nephrops trawl fleet segment before choke under the IQA and EoY analyses in the years The findings from both analyses are shown as a percentage of days at sea and revenue in
97 Scotland Nephrops Trawl Scenario Analysis 120% 100% 80% 60% 40% 100% 100% 98% 93% 91% 87% 20% 0% 20% 8% IQA Choke Point EOY Choke Point Figure 9-2: Scotland nephrops trawl fleet segment: comparison of choke point between IQA and EOY bioeconomic scenario analyses. Choke point shown as a % of days at sea in % 100% 80% 60% 40% 104% 106% 103% 101% 94% 88% 20% 0% 13% 10% IQA Revenue EOY Revenue Figure 9-3: Scotland nephrops trawl fleet segment: comparison of estimated revenue from demersal quota stocks between IQA and EOY bioeconomic scenario analyses. Revenue shown as a % of revenue earned from demersal quota stocks in
98 10. CATCHING THE QUOTA Catching the Quota The analysis contained in the previous six chapters shows the potential risk to the fleet segments from choke stocks. The analysis contained in Chapter 10 estimates: the landings that could be made in 2019 by all vessels in the six fleet segments before each fleet segment encounters its own choke points under two of the scenarios tested; the estimated quota that could to be available to the six fleet segments in 2019 under two scenarios: baseline scenario B3 and combined policy lever scenario 4C; and As a consequence, the amount of quota that could remain uncaught by the six fleet segments in 2019 under the policy scenarios tested CONTEXT Baseline scenario B3 does not include the exemptions and derogations referred to as policy levers in the report but does include: A catch allowance for zero-tac stocks in Area VI; and Quota top-up for 17 of the 51 stocks included in the model. Combined policy lever scenario 4C is the closest approximation among our scenarios of how the landing obligation is likely to be implemented. Combined policy lever scenario 4C incorporates: A catch allowance for zero-tac stocks in Area VI; Quota top-up for 17 of the 51 stocks included in the model; De minimis strict, which allows 5% of the UK quota for a stock to be discarded and not counted against quota; Interspecies flexibility which allows quota from one stock to be used to alleviate a choke point caused by another stock. The scenario analysis assumes that 18 of the 51 quota stocks are within safe biological limits and can therefore receive a transfer of quota under interspecies flexibility; and A survivability exemption for skates and rays. The scenario analysis only incorporates the impacts expected from: changes to fisheries management i.e. the landing obligation and associated policy levers as defined in the various scenarios; and changes in the biomass of ICES-assessed stocks as a result of expected changes in fishing mortality. Changes to biomass alters catch rates and TACs in the model. All other factors are held constant in the model and are informed by activity in 2013 e.g. price for landings and number of vessels. The model does not anticipate how the impact of the landing obligation might be mitigated by fleet responses to the landing obligation FINDINGS The pie charts below show the difference between the potential impact of the landing obligation in baseline scenario B3, which includes quota top-up, and combined policy lever scenario 4C, including quota top-up plus policy levers of de minimis, interspecies flexibility and survivability. The difference between scenarios B3 and 4C is that landings could be higher in 4C approximately 71,000 tonnes, compared to 46,000 tonnes in scenario B3. Therefore, the potential benefit of de minimis, interspecies flexibility and survivability as 93

99 Catching the Quota defined in combined policy lever scenario 4C is that the fleets can catch 39% ofthe volume of estimated quota in 2019, 15% percentage points higher than the fleets would catch without those policy levers in place. Should scenario 4C resemble what could happen once the landing obligation is implemented, it is estimated that 39% of the available UK quota could be landed in Unless additional policy adjustments occur, the analysis suggests that by 2019, technological development and changes in the operational decision-making of vessel owners and skippers would be required to catch the remaining quota an estimated 61% of demersal quota under scenario 4C. The incentive to find solutions is very clear, however the challenge to vessel owners is substantial and with less than three years until 2019, fishermen must find new ways to catch demersal quota stocks that will avoid unwanted catch and enable the optimum catch from the quota available. It should be noted that because of the potential biomass impacts of reduced fishing mortality, caused by choke stocks, the TACs for ICES-assessed stocks are rising over time in the model. However, if choke points are not improving because the TACs of data poor stocks are not increasing, fleet segments could actually be catching a lower proportion of TAC as time goes on. Figure 10-1: Total estimated landings by the six home nation fleet segments prior to all choke points being reached in 2019, as a proportion of the UK quota which the fleet segments could be expected to hold in 2019 under the EoY analysis. Results are shown for baseline scenario B3 and combined policy lever scenario 4C 94
100 Estimated revenue from demersal quota landings as a % of 2013 revenue from demersal quota landings 11. KEY FINDINGS Conclusions With the details of the implementation of the demersal landing obligation up to 2019 still being worked out, Seafish has undertaken an analysis to establish what challenges choke stocks could create and in particular: assess the potential consequences of the landing obligation, as it is currently understood, on the business performance of the UK fleet; and better understand the potential of policy levers, proposed in conjunction with the landing obligation, to mitigate any negative impacts expected KEY FINDINGS The bioeconomic scenario analysis is focused on the effect of policy decisions and assumes no change to other aspects, including how the UK fleet catches demersal quota stocks under the landing obligation. The analysis shows that: The landing obligation is likely to have relatively limited impact on the UK fleet in 2016 and, despite some choke points, total revenue would exceed revenue earned in 2013 because the fleet can land and sell catch that was previously discarded (the analysis holds fish prices at 2013 levels). In 2017 and 2018, as more stocks become subject to the landing obligation, the landing obligation is likely to have a notable negative impact as more choke stocks would be encountered under baseline scenario B3 by most fleet segments in 2017 and The Northern Ireland nephrops trawl fleet segment is the one exception as, in the model, the fleet is not expected to encounter choke stocks until The policy levers of de minimis and interspecies flexibility, as defined in the bioeconomic scenario analysis, would create benefit compared to baseline scenario B3 in 2017 (19%) and 2018 (30%). See Figure Once all demersal quota stocks become subject to the landing obligation on 1 January 2019, the negative impacts on the UK fleet are likely to be substantially greater and policy levers included in the model do not address the choke points caused by data-poor quota stocks. See Figure % 120% 100% 80% 112% 115% 107% 96% 106% 76% 60% 40% 20% 0% 46% 30% Baseline B3 Scenario 4c Figure 11-1: All six home nation fleet segments: Impact of baseline scenario B3 and combined policy lever scenario 4C on the estimated revenue from demersal quota stock landings,
101 Conclusions Under the best case policy lever scenario tested, combined policy lever 4C, the revenue earned from demersal quota stocks by the six home nation fleet segments in 2019 could be: o o o o o o 35% of revenue earned in 2013 for the England whitefish trawl/seine fleet segment; 20% of revenue earned in 2013 for the England nephrops trawl fleet segment; 77% of revenue earned in 2013 for the England beam trawl fleet segment; 10% of revenue earned in 2013 for the Northern Ireland nephrops trawl fleet segment; 58% of revenue earned in 2013 for the Scotland whitefish trawl/seine fleet segment; and 10% of revenue earned in 2013 for the Scotland nephrops trawl fleet segment. The nephrops trawl fleets are expected to experience proportionally the most significant negative impact in 2019 and the policy levers offer very little mitigation. Indeed for most of the nephrops fleet segments the outlook under the best case scenario tested (4C) is little different from the worst case baseline scenario (B1) which means that catch allowances for zero-tac stocks and quota top-up also make a very limited difference. The two largest fleet segments in terms of landings, the England beam trawl and Scotland whitefish fleets, are also expected to experience substantial negative impacts under the best case scenario tested. Without further mitigation, revenue in 2019 could be three-quarters of that earned by the beam trawl fleet in 2013 and just over half of the revenue earned in 2013 by the Scotland whitefish fleet. In 2019, a substantial proportion of primary choke stocks identified in the model are data-poor stocks and for most fleet segments would be considered bycatch stocks. If choke points created by data-poor stocks can be removed, the outlook would improve but some challenges would remain. If UK vessels continue to fish as they did in 2013, 61% of the quota held by the six home nation fleet segments could remain uncaught in 2019 under the best case policy lever scenario, scenario 4C. The potential impact of choke stocks on the activity and revenue of the UK fleet clearly demonstrates the need to find additional mitigating measures before 2019 in order to reduce the potential negative impacts of the landing obligation ADDITIONAL MITIGATION The policy levers tested in the scenarios are not the only way to mitigate the impact of the landing obligation. Vessel management will also have a critical role to play. The majority of producer organisations and vessel owners will have decisions to make about how to comply with and meet the challenges of the landing obligation. Potential responses could include: different patterns of quota trading and quota management; different decision-making processes onboard in relation to targeting and avoidance; and gear technology developments to improve selectivity. However, it is not yet known what impact these responses could have on business performance and whether compliance and investment would always result in profitable vessel businesses. The scale of the challenge and the remaining uncertainty means that business and fleet restructuring could also be a response to, or a result of, the landing obligation. Market conditions may respond positively and/or negatively to the various effects of the landing obligation. Large retailers and food service organisations could perhaps mitigate some negative impact through 96
102 Conclusions adopting more flexible procurement procedures; and enhanced information transfer between these customers and the UK fleet could better ensure what can be caught and what is sought is aligned from an early stage. There could also be further policy initiatives to mitigate the impact of the landing obligation. In 2019, when all demersal quota stocks become subject to the landing obligation, in many cases it is data poor stocks that create a choke on the operations of UK fleet segments. It is anticipated in the bioeconomic scenario analysis that quota stocks that are data poor stocks will not benefit from quota top-up and will not be eligible to receive quota under interspecies flexibility. If de minimis or survivability also cannot be used, then it is possible that a stock that is considered to be a bycatch, and for which there is limited scientific information, could choke a fleet segment long before the quota of the fleet segment s target stocks has been fully used. A policy initiative to address choke points created by low TAC, data-poor, largely unavoidable bycatch stocks could have a substantive impact on the outcomes for the fleet. 97
103 APPENDIX A: QUOTA TOP-UP MULTIPLIER AND ELIGIBILITY FOR INTERSPECIES FLEXIBILITY 6 Appendix A Stock EU TAC 2013 UK Quota 2013 Quota Top-up Eligible for Interspecies Multiplier Flexibility Haddock IV 45,040 29, Yes Cod IV 26,475 10, No Whiting IV 18,932 11, No Saithe IV 91,220 7, Yes Plaice IV 97,070 25, Yes Hake IV 1, Yes Anglerfish IV 8,703 7, No Megrim IV 1,937 1, Yes Nephrops IV 17,350 15, No Lemon sole IV 6,931 3, No Dabs IV 18,434 1, No Turbot IV 4, No Skate IV 1, No Sole IV 14, Yes Ling IV 2,428 1, No Tusk IV No Haddock Via 4,211 3, Yes Haddock VIb Yes Cod Via No Cod VIb No Whiting VI No Saithe VI 9,464 3, Yes Plaice VI No Hake VI 30,900 5, Yes Anglerfish VI 4,924 1, No Megrim VI 3,387 1, Yes Nephrops VI 16,690 16, No Ling VI 14,164 2, No Boarfish VI 82,000 5, No Sole VI No Pollack VI No Cod VIIa No Cod VIIb-k(excl d) 5, Yes Whiting VIIa No Whiting VIIb-k 24,500 2, Yes Haddock VIIa 1, No Haddock VIIb-k 14,148 1, Yes Anglerfish VII 29,144 5, No Megrim VII 17,385 2, No Nephrops VII 23,065 7, No Pollack VII 13,495 2, No Saithe VII 3, No Plaice VIIa 1, No Plaice VIIde 6,400 1, No Plaice VIIfg No Plaice VIIh-k No Sole VIIa No Sole VIId 5,900 1, Yes Sole VIIe Yes Sole VIIfg 1, Yes Sole VIIh-k Yes 6 Note: Quota top-up multiplier and eligibility for interspecies flexibility are informed by ICES advice from 2012, relating to However these are assumptions developed for the model and it remains unclear what the eventual position will be. 98
104 APPENDIX B: DISCARD RATES Appendix C Stock England England England N. Ireland Scotland Scotland Gillnetters/ Beam Trawl Whitefish Nephrops Nephrops Whitefish Nephrops Longliners Haddock IV 0.0% 8.9% 15.8% 15.8% 8.8% 15.9% 0.0% Cod IV 48.2% 23.0% 70.7% 70.7% 24.0% 73.1% 7.5% Whiting IV 99.2% 20.3% 30.2% 30.2% 19.6% 30.1% 78.9% Saithe IV 0.0% 39.8% 16.8% 16.8% 39.0% 16.8% 0.0% Plaice IV 91.7% 34.5% 72.4% 72.4% 38.6% 76.0% 33.6% Hake IV 0.0% 36.2% 93.6% 93.6% 36.1% 94.1% 0.0% Anglerfish IV 0.0% 1.2% 1.6% 1.6% 0.8% 1.6% 0.0% Megrim IV 0.0% 7.5% 3.8% 3.8% 7.5% 3.7% 0.0% Nephrops IV 0.0% 0.5% 0.1% 0.1% 5.7% 5.7% 0.0% Lemon sole IV 0.0% 10.0% 55.7% 55.7% 10.0% 55.7% 0.0% Dabs IV 0.0% 95.0% 95.0% 95.0% 95.0% 95.0% 0.0% Turbot IV 0.0% 0.0% 60.2% 60.2% 0.0% 60.2% 0.0% Skate IV 0.0% 60.6% 95.0% 95.0% 60.6% 95.0% 0.0% Sole IV 13.9% 7.0% 14.1% 14.1% 0.0% 21.7% 9.3% Ling IV 0.0% 31.5% 54.5% 54.5% 31.5% 55.4% 0.0% Tusk IV 0.0% 38.8% 95.0% 95.0% 38.8% 95.0% 0.0% Haddock VIa 0.0% 7.3% 28.1% 28.1% 7.3% 28.1% 0.0% Haddock VIb 0.0% 7.3% 28.1% 28.1% 7.3% 28.1% 0.0% Cod Via 0.0% 66.7% 95.0% 95.0% 66.7% 95.0% 0.0% Cod VIb 0.0% 66.7% 95.0% 95.0% 66.7% 95.0% 0.0% Whiting VI 0.0% 46.2% 96.9% 96.9% 46.2% 96.9% 0.0% Saithe VI 0.0% 26.4% 95.0% 95.0% 26.4% 95.0% 0.0% Plaice VI 0.0% 30.7% 95.0% 95.0% 30.7% 95.0% 0.0% Hake VI 0.0% 55.7% 93.5% 93.5% 55.7% 93.5% 0.0% Anglerfish VI 0.0% 1.5% 6.5% 6.5% 1.5% 6.5% 0.0% Megrim VI 0.0% 60.2% 65.7% 65.7% 60.2% 65.7% 0.0% Nephrops VI 0.0% 0.0% 0.0% 0.0% 0.0% 0.0% 0.0% Ling VI 0.0% 25.3% 95.0% 95.0% 25.3% 95.0% 0.0% Boarfish VI 0.0% 0.0% 0.0% 0.0% 0.0% 0.0% 0.0% Sole VI 0.0% 0.0% 95.0% 95.0% 0.0% 95.0% 0.0% Pollack VI 0.0% 0.0% 95.0% 95.0% 0.0% 95.0% 0.0% Cod VIIa 4.1% 2.7% 0.0% 66.0% 2.7% 0.0% 8.5% Cod VIIb-k(excl d) 4.1% 2.7% 0.0% 0.0% 2.7% 0.0% 8.5% Whiting VIIa 31.7% 16.7% 95.0% 98.0% 16.7% 95.0% 50.8% Whiting VIIb-k 31.7% 16.7% 95.0% 55.1% 16.7% 95.0% 50.8% Haddock VIIa 14.1% 19.7% 0.0% 58.0% 19.7% 0.0% 68.2% Haddock VIIb-k 14.1% 19.7% 0.0% 0.0% 19.7% 0.0% 68.2% Anglerfish VII 0.0% 0.0% 0.0% 4.0% 0.0% 0.0% 0.0% Megrim VII 9.2% 3.6% 0.0% 0.0% 3.6% 0.0% 36.4% Nephrops VII 74.0% 0.0% 2.8% 14.0% 0.0% 2.8% 0.0% Pollack VII 0.0% 2.3% 0.0% 0.0% 2.3% 0.0% 1.4% Saithe VII 0.0% 0.0% 0.0% 0.0% 0.0% 0.0% 0.2% Plaice VIIa 18.3% 45.6% 85.0% 90.0% 45.6% 85.0% 22.8% Plaice VIIde 18.3% 45.6% 85.0% 85.0% 45.6% 85.0% 22.8% Plaice VIIfg 18.3% 45.6% 85.0% 85.0% 45.6% 85.0% 22.8% Plaice VIIh-k 18.3% 45.6% 85.0% 85.0% 45.6% 85.0% 22.8% Sole VIIa 0.3% 1.5% 0.0% 12.0% 1.5% 0.0% 4.3% Sole VIId 0.3% 1.5% 0.0% 0.0% 1.5% 0.0% 4.3% Sole VIIe 0.3% 1.5% 0.0% 0.0% 1.5% 0.0% 4.3% Sole VIIfg 0.3% 1.5% 0.0% 0.0% 1.5% 0.0% 4.3% Sole VIIh-k 0.3% 1.5% 0.0% 0.0% 1.5% 0.0% 4.3% Note: Discard rates are from 2013 and were supplied by CEFAS, Marine Scotland and AFBI. For stocks where discard rates are not available the proxy assumptions developed for the choke analysis were used. Where recorded discard rates are 100% this has been replaced with 95% for modelling purposes. 99
105 Appendix C APPENDIX C: LANDINGS BY PORT REGION IN UNDER SCENARIOS B3 AND 4C The findings from the scenario analysis can be interrogated and analysed in a number of different ways. The analysis in Appendix C shows how baseline scenario B3 and combined policy lever scenario 4C might affect landings in the different regions around the UK in the years The analysis is informed by landings data for 2013 from 172 UK (all ports with recorded landings of more than 10 tonnes) and each port has been allocated to one of nine UK regions. The analysis assumes that under both scenarios the vessels in each PO fleet segment continue to land the same proportion of their catch at the ports they landed to in Actual landings of demersal quota stocks in each region in 2013 is also shown in each graph. The findings for all nine port regions are relatively consistent: landings under combined policy lever scenario 4C during the transition period ( ) go up or remain relatively similar compared to Landings are maintained because, despite some fleet segments encountering choke stocks in this period, catch that was previously discarded is now being landed, the transition period reduces the potential impact in and the policy levers included in the scenario are having a positive effect. Once all demersal quota stocks become subject to the landing obligation in 2019, the choke points encountered by fleet segments under combined policy lever scenario 4C have a notable impact on potential landings in all regions, except Wales. The regions that are most dependent on nephrops landings are expected to experience the largest negative impact in 2019 under all scenarios tested. The ports analysis, as with the findings presented in the main body of the report, assume no policy solutions in addition to those included in the scenarios and no change to the way the UK fleet catches its quota under the landing obligation. Should the mitigation assumed to be possible through the policy levers tested in the scenario analysis reflect reality in 2019, efforts by vessels and fleet segments to avoid choke stocks can be expected to improve the outlook for landings in

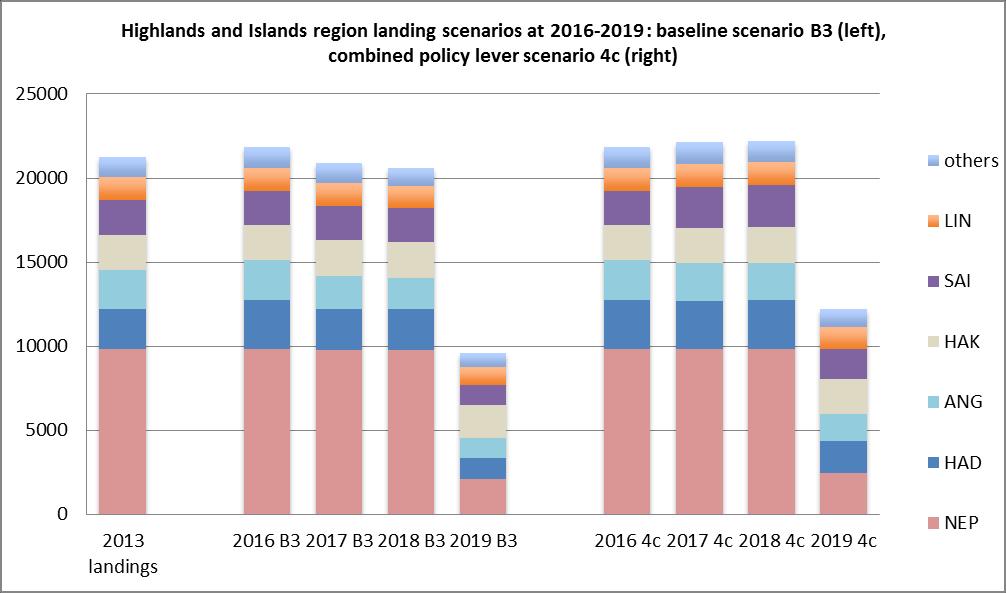
106 Appendix C 101

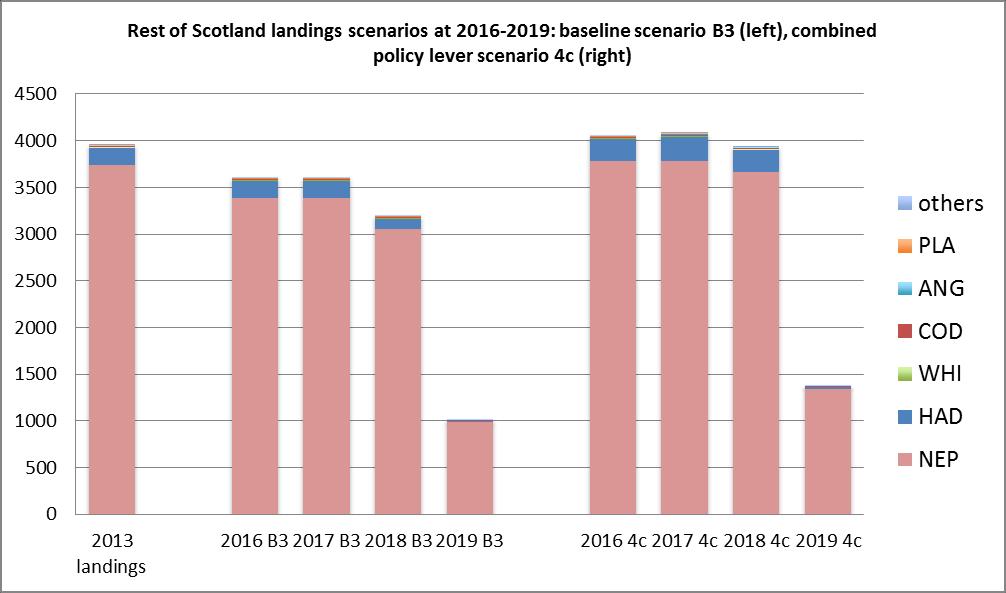
107 Appendix C 102

108 Appendix C 103

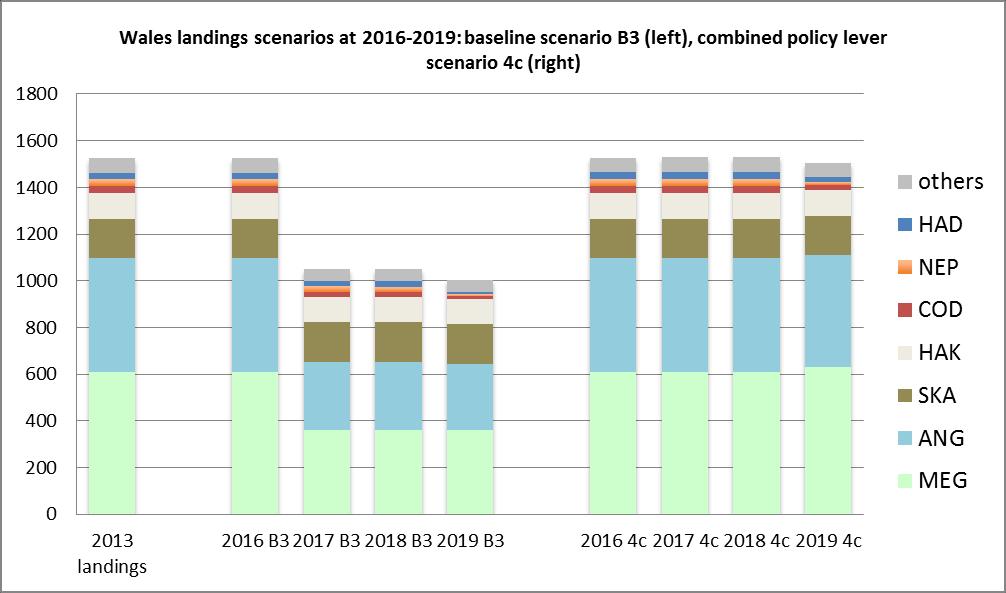
109 Appendix C 104

110 Appendix C 105
Potential Economic Repercussions of a Discards Ban in EU Fisheries
 Potential Economic Repercussions of a Discards Ban in EU Fisheries Presented to: Wakefield Symposium Anchorage Alaska Presented by: John Anderson Rod Cappell Graeme Macfadyen Gordon Gislason May 2014 1
The EU Landing Obligation: Impacts and Solutions Monday 1 February 13:45-15:00. Portomaso Suite 2 & 3 Seafood Summit, Malta
 The EU Landing Obligation: Impacts and Solutions Monday 1 February 13:45-15:00 Portomaso Suite 2 & 3 Seafood Summit, Malta Obligation to land all Catches of Regulated species Council Regulation No 1380/2013
A case study review of the potential economic implications of the proposed CFP landings obligation
 A case study review of the potential economic implications of the proposed CFP landings obligation Final Report Prepared by December 2013 940 UK EXECUTIVE SUMMARY Introduction The reform of the Common
UK Landing Obligation Analysis
 If isunderlandingsobligation And Not isundersurvivability Then fleetmetiers(fm).metierharvest(s).targeteffort(y) = TargetEffort If TACmin(fm) > TargetEffort Then TACmin(fm) = TargetEffort TACminSpecies(fm)
At Sea Simulation of the Landing Obligation on Irish Vessels
 At Sea Simulation of the Landing Obligation on Irish Vessels Report to the Discard Implementation Group February 2015 Ronan Cosgrove 1, Norman Graham 2, Sara-Jane Moore 2, Eoghan Kelly 2, Richard Curtin
Norway lobster (Nephrops norvegicus) in Division 4.a, Functional Unit 10 (northern North Sea, Noup)
 in Division 4.a, Functional Unit 10 (northern North Sea, Noup)") ICES Advice on fishing opportunities,, and effort Celtic Seas Ecoregion and Greater North Sea Ecoregions Published 30 June 2016 Version 2: 11 November 2016 6.3.25 Norway lobster (Nephrops norvegicus) in
ICES Advice on fishing opportunities,, and effort Celtic Seas Ecoregion and Greater North Sea Ecoregions Published 30 June 2016 Version 2: 11 November 2016 6.3.25 Norway lobster (Nephrops norvegicus) in
FLEET ECONOMIC PERFORMANCE DATASET
 FLEET ECONOMIC PERFORMANCE DATASET 28-16 Steve Lawrence Arina Motova Jennifer Russell Date: September 217 Seafish Report No: SR79 ISBN No: 978-1-91173-15-4 Copyright Seafish 217 Seafish Economics Seafish
Fully Documented Fisheries
 Industry Guidance Note October 2012 Fully Documented Fisheries Catch Quota Trials or fully documented fisheries (FDF) using onboard video cameras (CCTV), coupled with the use of highly selective gears,
Norway lobster (Nephrops norvegicus) in Division 4.b, Functional Unit 6 (central North Sea, Farn Deeps)
 in Division 4.b, Functional Unit 6 (central North Sea, Farn Deeps)") ICES Advice on fishing opportunities, catch, and effort Greater North Sea Ecoregion Published 14 November 2017 DOI: 10.17895/ices.pub.3524 Norway lobster (Nephrops norvegicus) in Division 4.b, Functional
ICES Advice on fishing opportunities, catch, and effort Greater North Sea Ecoregion Published 14 November 2017 DOI: 10.17895/ices.pub.3524 Norway lobster (Nephrops norvegicus) in Division 4.b, Functional
ICES WGCSE REPORT
 ICES WGCSE REPORT 2009 291 6 Irish Sea 6.1 Area overview Description of fisheries Fishing effort and vessel numbers within the Irish Sea have declined in recent years by around 28% and 15% respectively
SEAFISH ECONOMIC ANALYSIS
 SEAFISH ECONOMIC ANALYSIS UK 15m & over Scallop Fleet Area VII Economic analysis of the UK 15m and over scallop fishing fleet in ICES Area VII March 2016 AUTHORS: Arina Motova (Seafish) Hazel Curtis (Seafish)
Can a discard ban be good for fishers?
 Can a discard ban be good for fishers? Discardless Work package 2: Fishery Scale Assessment Ayoe Hoff and Peder Andersen, University of Copenhagen Katia Frangoudes, University de Bretagne Occidentale This
Whiting (Merlangius merlangus) in Division 6.a (West of Scotland)
 in Division 6.a (West of Scotland)") ICES Advice on fishing opportunities, catch, and effort Celtic Seas Ecoregion Published 30 June 2016 5.3.65 Whiting (Merlangius merlangus) in Division 6.a (West of Scotland) ICES stock advice ICES advises
ICES Advice on fishing opportunities, catch, and effort Celtic Seas Ecoregion Published 30 June 2016 5.3.65 Whiting (Merlangius merlangus) in Division 6.a (West of Scotland) ICES stock advice ICES advises
Norway lobster (Nephrops norvegicus) in Division 4.a, Functional Unit 7 (northern North Sea, Fladen Ground)
 in Division 4.a, Functional Unit 7 (northern North Sea, Fladen Ground)") ICES Advice on fishing opportunities, catch, and effort Greater North Sea Ecoregion Published 11 November 2016 6.3.27 (update) Norway lobster (Nephrops norvegicus) in Division 4.a, Functional Unit 7 (northern
ICES Advice on fishing opportunities, catch, and effort Greater North Sea Ecoregion Published 11 November 2016 6.3.27 (update) Norway lobster (Nephrops norvegicus) in Division 4.a, Functional Unit 7 (northern
BSAC recommendations for the fishery in the Baltic Sea in 2018
 Copenhagen 7 th July 2017 BSAC recommendations for the fishery in the Baltic Sea in 2018 The BSAC recommends setting the catch levels for the Baltic stocks in 2018 at the values indicated in the table
Advice June 2014
 5.3.23 Advice June 2014 ECOREGION STOCK Celtic Sea and West of Scotland Plaice in Division VIIa (Irish Sea) Advice for 2015 Based on ICES approach to data-limited stocks, ICES advises that catches should
Best Practice Guidance for Assessing the Financial Performance of Fishing Gear: Industry-led gear trials
 Best Practice Guidance for Assessing the Financial Performance of Fishing Gear: Industry-led gear trials Prepared for The UK Fisheries Economic Network (UKFEN) by Seafish Introduction and Background Reducing
EU request to ICES on in-year advice on haddock (Melanogrammus aeglefinus) in Division 7.a (Irish Sea)
 in Division 7.a (Irish Sea)") ICES Special Request Advice Celtic Seas Ecoregion Published 1 March 2017 EU request to ICES on in-year advice on haddock (Melanogrammus aeglefinus) in Division 7.a (Irish Sea) Advice summary Please note:
ICES Special Request Advice Celtic Seas Ecoregion Published 1 March 2017 EU request to ICES on in-year advice on haddock (Melanogrammus aeglefinus) in Division 7.a (Irish Sea) Advice summary Please note:
COMMISSION DELEGATED REGULATION (EU) /... of
 /... of") EUROPEAN COMMISSION Brussels, 20.10.2017 C(2017) 6990 final COMMISSION DELEGATED REGULATION (EU) /... of 20.10.2017 establishing a discard plan for certain demersal and deep sea fisheries in North-Western
EUROPEAN COMMISSION Brussels, 20.10.2017 C(2017) 6990 final COMMISSION DELEGATED REGULATION (EU) /... of 20.10.2017 establishing a discard plan for certain demersal and deep sea fisheries in North-Western
Sustainable Fisheries for Future Generations The Fisheries White Paper
 Sustainable Fisheries for Future Generations The Fisheries White Paper Key messages The Fisheries White Paper Sustainable Fisheries for Future Generations charts the course for a sustainable and profitable
This document is meant purely as a documentation tool and the institutions do not assume any liability for its contents
 2001R2056 EN 11.11.2015 001.001 1 This document is meant purely as a documentation tool and the institutions do not assume any liability for its contents B COMMISSION REGULATION (EC) No 2056/2001 of 19
Norway lobster (Nephrops norvegicus) in Division 4.b, Functional Unit 6 (central North Sea, Farn Deeps)
 in Division 4.b, Functional Unit 6 (central North Sea, Farn Deeps)") ICES Advice on fishing opportunities, catch, and effort Greater North Sea Ecoregion Published 14 November 2018 https://doi.org/10.17895/ices.pub.4619 Norway lobster (Nephrops norvegicus) in Division 4.b,
ICES Advice on fishing opportunities, catch, and effort Greater North Sea Ecoregion Published 14 November 2018 https://doi.org/10.17895/ices.pub.4619 Norway lobster (Nephrops norvegicus) in Division 4.b,
FIS012A - Quota management and choke species under the landing obligation
 FIS012A - Quota management and choke species under the landing obligation A REPORT COMMISSIONED BY FIS AND PREPARED BY CEFAS Published by: Fisheries Innovation Scotland (FIS) This report is available at:
Towards a mixed demersal fisheries management plan in the Irish Sea. (ICES subdivisions VIIa): framework and objectives
: framework and objectives") Towards a mixed demersal fisheries management plan in the Irish Sea (ICES subdivisions VIIa): framework and objectives Draft for Discussion July 2013 Deleted: Approved: March 2011 / Last Update: November
Towards a mixed demersal fisheries management plan in the Irish Sea (ICES subdivisions VIIa): framework and objectives Draft for Discussion July 2013 Deleted: Approved: March 2011 / Last Update: November
Comparison of EU and US Fishery management Systems Ernesto Penas Principal Adviser DG Mare
 Comparison of EU and US Fishery management Systems Ernesto Penas Principal Adviser DG Mare Stock and Fisheries Status Seminar Brussels, 26 September 2017 Why comparing the EU and the US? Need to put the
Plaice (Pleuronectes platessa) in Division 7.e (western English Channel)
 in Division 7.e (western English Channel)") Celtic Seas and Greater North Sea ecoregions Published 30 June 2016 Version 2: 15 May 2017 5.3.51 Plaice (Pleuronectes platessa) in Division 7.e (western English Channel) ICES stock advice ICES advises
Celtic Seas and Greater North Sea ecoregions Published 30 June 2016 Version 2: 15 May 2017 5.3.51 Plaice (Pleuronectes platessa) in Division 7.e (western English Channel) ICES stock advice ICES advises
Joint Recommendation of the North Western Waters High- Level Group Discard Plan for demersal fisheries in the North Western Waters for 2019
 Joint Recommendation of the North Western Waters High- Level Group Discard Plan for demersal fisheries in the North Western Waters for 2019 1. Implementing authority a. Acting in accordance with Article
Norway lobster (Nephrops norvegicus) in Division 4.a, Functional Unit 32 (northern North Sea, Norway Deep)
 in Division 4.a, Functional Unit 32 (northern North Sea, Norway Deep)") ICES Advice on fishing opportunities, catch, and effort Greater North Sea Ecoregion Published 29 June 2018 Version 2: 14 November 2018 https://doi.org/10.17895/ices.pub.4439 Norway lobster (Nephrops norvegicus)
ICES Advice on fishing opportunities, catch, and effort Greater North Sea Ecoregion Published 29 June 2018 Version 2: 14 November 2018 https://doi.org/10.17895/ices.pub.4439 Norway lobster (Nephrops norvegicus)
Trends in Scottish Fish Stocks 2017
 Port Arthur, Scalloway, Shetland, ZE1 0UN, Scotland, UK Tel: +44 (0)1595 772000 Fax: +44 (0)1595 772001 Email: info@nafc.uhi.ac.uk Web: www.nafc.ac.uk Trends in Scottish Fish Stocks 2017 Ian R. Napier
Please note: The present advice replaces the advice given in June 2017 for catches in 2018.
 ICES Advice on fishing opportunities, catch, and effort Greater North Sea Ecoregion Published 14 November 2017 Version 2: 6 December 2017 DOI: 10.17895/ices.pub.3528 Sole (Solea solea) in Subarea 4 (North
STECF work on the Landing Obligation. Advising on: The biggest challenge? The biggest puzzle? The biggest risk?
 STECF work on the Landing Obligation Advising on: The biggest challenge? The biggest puzzle? The biggest risk? Content Context within the CFP reform STECF process Issues tackled Some conclusions CFP Reform
Whiting (Merlangius merlangus) in Subarea 4 and Division 7.d (North Sea and eastern English Channel)
 in Subarea 4 and Division 7.d (North Sea and eastern English Channel)") ICES Advice on fishing opportunities, catch, and effort Greater North Sea and Celtic Seas Ecoregions Published 30 June 2016 Version 2: 11 November 2016 6.3.56 Whiting (Merlangius merlangus) in Subarea
ICES Advice on fishing opportunities, catch, and effort Greater North Sea and Celtic Seas Ecoregions Published 30 June 2016 Version 2: 11 November 2016 6.3.56 Whiting (Merlangius merlangus) in Subarea
Why has the cod stock recovered in the North Sea?
 Why has the cod stock recovered in the North Sea? Summary The expansion of European fisheries during the 1970s and 1980s resulted in high fishing pressure on stocks of cod, haddock, whiting and saithe
Advice June 2013 Version 2,
 5..37 Advice June 3 Version, 5--3 ECOREGION STOCK Celtic Sea and West of Scotland Sole in Divisions VIIf,g (Celtic Sea) Advice for ICES advises on the basis of the MSY approach that catches in should be
Fish Stock Status. 10 th November 2016 Seafish Common Language Group Friend s House, Euston Road, London NW1 2BJ
 Fish Stock Status 10 th November 2016 Seafish Common Language Group Friend s House, 173-177 Euston Road, London NW1 2BJ Dr Carl O Brien Defra Chief Fisheries Science Adviser UK Delegate to ICES Three main
ICES advice on fishing opportunities
 ICES Advice on fishing opportunities, catch, and effort Greater North Sea Ecoregion Published 29 June 2018 Version 2: 3 July 2018 Version 3: 14 November 2018 https://doi.org/10.17895/ices.pub.4458 Sole
COMMUNICATION FROM THE COMMISSION. Consultation on Fishing Opportunities for 2011
 EN EN EN EUROPEAN COMMISSION Brussels, 17.5.2010 COM(2010)241 final COMMUNICATION FROM THE COMMISSION Consultation on Fishing Opportunities for 2011 EN EN COMMUNICATION FROM THE COMMISSION Consultation
Trends in Scottish Fish Stocks 2018
 Port Arthur, Scalloway, Shetland, ZE1 UN, Scotland, UK Tel: +44 ()1595 772 Fax: +44 ()1595 7721 Email: info@nafc.uhi.ac.uk Web: www.nafc.ac.uk Trends in Scottish Fish Stocks 218 Ian R. Napier 14 th September
Fisheries Resource Access Mapping Project (FishRAMP):
:") Fisheries Resource Access Mapping Project (FishRAMP): The Co. Down Wind Resource Zone Contributors: Matthew Service and Laurence Rooney (AFBI); Rod Cappell (Poseidon); Lynn Gilmore (Seafish) and the NI
Fisheries Resource Access Mapping Project (FishRAMP): The Co. Down Wind Resource Zone Contributors: Matthew Service and Laurence Rooney (AFBI); Rod Cappell (Poseidon); Lynn Gilmore (Seafish) and the NI
Overview. 11 th November 2015 Seafish Common Language Group Friends House, Euston Road, London NW1 2BJ
 The state of North-east Atlantic stocks the alignment of CFP, MSFD and MSY; the December Council and the setting of TACs and quotas for 2016 in light of the implementation of the landing obligation (LO)
Haddock (Melanogrammus aeglefinus) in divisions 7.b k (southern Celtic Seas and English Channel)
 in divisions 7.b k (southern Celtic Seas and English Channel)") ICES Advice on fishing opportunities, catch, and effort Celtic Seas, Greater North Sea, and Oceanic Northeast Atlantic ecoregions Published 29 June 2018 https://doi.org/10.17895/ices.pub.4453 Haddock (Melanogrammus
ICES Advice on fishing opportunities, catch, and effort Celtic Seas, Greater North Sea, and Oceanic Northeast Atlantic ecoregions Published 29 June 2018 https://doi.org/10.17895/ices.pub.4453 Haddock (Melanogrammus
Plaice (Pleuronectes platessa) in Subarea IV (North Sea) and Division IIIa (Skagerrak)
 in Subarea IV (North Sea) and Division IIIa (Skagerrak)") ICES Advice on fishing opportunities, catch, and effort Greater North Sea and Celtic Seas Ecoregions Published 30 June 2015 6.3.31 Plaice (Pleuronectes platessa) in Subarea IV (North Sea) and Division
ICES Advice on fishing opportunities, catch, and effort Greater North Sea and Celtic Seas Ecoregions Published 30 June 2015 6.3.31 Plaice (Pleuronectes platessa) in Subarea IV (North Sea) and Division
FISHERY BY-PRODUCT REPORT
 FISHERY BY-PRODUCT REPORT IFFO GLOBAL STANDARD FOR RESPONSIBLE SUPPLY OF FISHMEAL AND FISH OIL FISHERY By-Product: LOCATION: King Scallop (Pecten maximus) UK & Ireland-Ices Area IVa-c, VI a, VIIa,b,d-h,j2
Fish Stock Status - Overview. 16 th November 2017 Seafish Common Language Group Friend s House, Euston Road, London NW1 2BJ
 Fish Stock Status - Overview 16 th November 2017 Seafish Common Language Group Friend s House, 173-177 Euston Road, London NW1 2BJ Dr Carl O Brien CBE Defra Chief Fisheries Science Adviser UK Delegate
Saithe (Pollachius virens) in subareas 4 and 6, and in Division 3.a (North Sea, Rockall and West of Scotland, Skagerrak and Kattegat)
 in subareas 4 and 6, and in Division 3.a (North Sea, Rockall and West of Scotland, Skagerrak and Kattegat)") ICES Advice on fishing opportunities, catch, and effort Celtic Seas, Faroes, and Greater North Sea Ecoregions Published 30 June 2017 DOI: 10.17895/ices.pub.3206 Saithe (Pollachius virens) in subareas 4
ICES Advice on fishing opportunities, catch, and effort Celtic Seas, Faroes, and Greater North Sea Ecoregions Published 30 June 2017 DOI: 10.17895/ices.pub.3206 Saithe (Pollachius virens) in subareas 4
Plaice (Pleuronectes platessa) in Subarea 4 (North Sea) and Subdivision 20 (Skagerrak)
 in Subarea 4 (North Sea) and Subdivision 20 (Skagerrak)") ICES Advice on fishing opportunities, catch, and effort Greater North Sea Ecoregion Published 14 November 2018 https://doi.org/10.17895/ices.pub.4613 Plaice (Pleuronectes platessa) in Subarea 4 (North
ICES Advice on fishing opportunities, catch, and effort Greater North Sea Ecoregion Published 14 November 2018 https://doi.org/10.17895/ices.pub.4613 Plaice (Pleuronectes platessa) in Subarea 4 (North
Consultation Document
 Consultation Document Development of a regulation establishing a multiannual plan for the management of Northern Adriatic Sea small pelagic fisheries The sole purpose of this consultation is to collect
ICES advises that when the MSY approach is applied, catches in 2019 should be no more than tonnes.
 Advice on fishing opportunities, catch, and effort Celtic Seas, Greater North Sea, and Oceanic Northeast Atlantic ecoregions Published 29 June 2018 Version 2: 4 September 2018 https://doi.org/10.17895/ices.pub.4487
Spurdog (Squalus acanthias) in the Northeast Atlantic
 in the Northeast Atlantic") ICES Advice on fishing opportunities, catch, and effort Northeast Atlantic Published 11 October 2016 9.3.17 Spurdog (Squalus acanthias) in the Northeast Atlantic ICES stock advice ICES advises that when
ICES Advice on fishing opportunities, catch, and effort Northeast Atlantic Published 11 October 2016 9.3.17 Spurdog (Squalus acanthias) in the Northeast Atlantic ICES stock advice ICES advises that when
17-06 BFT RECOMMENDATION BY ICCAT FOR AN INTERIM CONSERVATION AND MANAGEMENT PLAN FOR WESTERN ATLANTIC BLUEFIN TUNA
 17-06 BFT RECOMMENDATION BY ICCAT FOR AN INTERIM CONSERVATION AND MANAGEMENT PLAN FOR WESTERN ATLANTIC BLUEFIN TUNA RECALLING the Recommendation by ICCAT to Establish a Rebuilding Program for Western Atlantic
Plaice (Pleuronectes platessa) in Subarea 4 (North Sea) and Subdivision 20 (Skagerrak)
 in Subarea 4 (North Sea) and Subdivision 20 (Skagerrak)") ICES Advice on fishing opportunities, catch, and effort Greater North Sea Ecoregion Published 14 November 2017 DOI: 10.17895/ices.pub.3529 Plaice (Pleuronectes platessa) in Subarea 4 (North Sea) and Subdivision
ICES Advice on fishing opportunities, catch, and effort Greater North Sea Ecoregion Published 14 November 2017 DOI: 10.17895/ices.pub.3529 Plaice (Pleuronectes platessa) in Subarea 4 (North Sea) and Subdivision
The Potential Economic Impact on Selected Fishing Fleet Segments of TACs Proposed by ACFM for 2004 (EIAA-model calculations)
") COMMISSION OF THE EUROPEAN COMMUNITIES Brussels, 21.2004 SEC(2004) 61 COMMISSION STAFF WORKING PAPER REPORT OF THE SCIENTIFIC, TECHNICAL AND ECONOMIC COMMITTEE FOR FISHERIES Subgroup on Economic Assessment
COMMISSION OF THE EUROPEAN COMMUNITIES Brussels, 21.2004 SEC(2004) 61 COMMISSION STAFF WORKING PAPER REPORT OF THE SCIENTIFIC, TECHNICAL AND ECONOMIC COMMITTEE FOR FISHERIES Subgroup on Economic Assessment
Statistical News Release
 PRE-RELEASE ACCESS - RESTRICTED UNTIL 9.30 AM on MAY 25, 2017 Statistical News Release A National Statistics Publication for Scotland May 25, 2017 PROVISIONAL SCOTTISH SEA FISHERIES STATISTICS 2016 Provisional
Proposal for a COUNCIL REGULATION
 EUROPEAN COMMISSION Brussels, 31.8.2018 COM(2018) 608 final 2018/0320 (NLE) Proposal for a COUNCIL REGULATION fixing for 2019 the fishing opportunities for certain fish stocks and groups of fish stocks
STECF EXPERT WORKING GROUP EWG 18-09
 STECF EXPERT WORKING GROUP EWG 18-09 on a fishing effort regime for demersal fisheries in the western Mediterranean Sea 18-22 June 2018, Arona, Italy DG MARE focal point: Amanda Perez Perera Chair: Clara
Response to the Commission s proposal for a multi-annual plan for the Western Waters (COM (2018) 149 Final) June 15 th 2018
 149 Final) June 15 th 2018") Response to the Commission s proposal for a multi-annual plan for the Western Waters (COM (2018) 149 Final) June 15 th 2018 SUMMARY If properly designed, the multi-annual plan (MAP) for the Western Waters
Response to the Commission s proposal for a multi-annual plan for the Western Waters (COM (2018) 149 Final) June 15 th 2018 SUMMARY If properly designed, the multi-annual plan (MAP) for the Western Waters
Sourced from:
 Catch Comparison trials using a 400mm Square Mesh Panel Louise Jones SFF Data Analyst Sourced from: http://www.worldfishingtoday.com/newbuildings/default.asp?nyid=621277 Summary: The 400mm SMP alone is
Whiting (Merlangius merlangus) in divisions 7.b c and 7.e k (southern Celtic Seas and western English Channel)
 in divisions 7.b c and 7.e k (southern Celtic Seas and western English Channel)") ICES Advice on fishing opportunities, catch, and effort Celtic Seas, Greater North Sea, and Oceanic Northeast Atlantic ecoregions Published 30 June 2017 Version 2: 07 July 2017 DOI: 10.17895/ices.pub.3269
ICES Advice on fishing opportunities, catch, and effort Celtic Seas, Greater North Sea, and Oceanic Northeast Atlantic ecoregions Published 30 June 2017 Version 2: 07 July 2017 DOI: 10.17895/ices.pub.3269
The Socio-Economic Marine Research Unit (SEMRU) Research Note. Assessment of the effects of Brexit on Irish and EU fisheries in the NE Atlantic
 Research Note. Assessment of the effects of Brexit on Irish and EU fisheries in the NE Atlantic") The Socio-Economic Marine Research Unit (SEMRU) National University of Ireland, Galway Research Note Assessment of the effects of Brexit on and EU fisheries in the NE Atlantic Daniel Norton and Stephen
The Socio-Economic Marine Research Unit (SEMRU) National University of Ireland, Galway Research Note Assessment of the effects of Brexit on and EU fisheries in the NE Atlantic Daniel Norton and Stephen
Fishing opportunities for 2018 under the Common Fisheries Policy
 12 th August 2017 Ref. Ares(2017)4065965-17/08/2017 Response to DGMare Consultation on Fishing opportunities for 2018 under the Common Fisheries Policy https://ec.europa.eu/fisheries/fishing-opportunities-2018-under-common-fisheries-policy_en
Advice June Sole in Division IIIa and Subdivisions (Skagerrak, Kattegat, and the Belts)
") 6.3.26 Advice June 2014 ECOREGION STOCK North Sea Sole in Division IIIa and Subdivisions 22 24 (Skagerrak, Kattegat, and the Belts) Advice for 2015 ICES advises on the basis of the MSY approach that catches
6.3.26 Advice June 2014 ECOREGION STOCK North Sea Sole in Division IIIa and Subdivisions 22 24 (Skagerrak, Kattegat, and the Belts) Advice for 2015 ICES advises on the basis of the MSY approach that catches
Fish Landings in Shetland and by the Shetland Fleet in 2013
 Port Arthur, Scalloway, Shetland ZE1 0UN, Scotland. Tel: 01595 772000 Email: nainfo@uhi.ac.uk WWW: www.nafc.ac.uk Fish Landings in Shetland and by the Shetland Fleet in 2013 Ian R. Napier ( ian.napier@uhi.ac.uk
3.4.3 Advice June Barents Sea and Norwegian Sea Cod in Subareas I and II (Norwegian coastal waters cod)
") 3.4.3 Advice June 2013 ECOREGION STOCK Barents Sea and Norwegian Sea Cod in Subareas I and II (Norwegian coastal waters cod) Advice for 2014 ICES advises on the basis of the Norwegian rebuilding plan,
3.4.3 Advice June 2013 ECOREGION STOCK Barents Sea and Norwegian Sea Cod in Subareas I and II (Norwegian coastal waters cod) Advice for 2014 ICES advises on the basis of the Norwegian rebuilding plan,
Fish Landings in Shetland and by the Shetland Fleet in 2012
 Port Arthur, Scalloway, Shetland ZE1 UN, Scotland. Tel: 1595 772 Email: info@nafc.ac.uk WWW: www.nafc.ac.uk Fish Landings in Shetland and by the Shetland Fleet in 212 Ian R. Napier ( ian.napier@nafc.uhi.ac.uk
TECHNICAL MEASURES AND
 The New CFP TECHNICAL MEASURES AND LANDING OBLIGATION EP Committee on Fisheries Public Hearing 7th April 2014 J. Manuel Liria Franch Technical Measures and LO EU fishing is complex with many mixed fisheries
Herring (Clupea harengus) in subdivisions and 32 (central Baltic Sea, excluding Gulf of Riga)
 in subdivisions and 32 (central Baltic Sea, excluding Gulf of Riga)") ICES Advice on fishing opportunities, catch, and effort Baltic Sea Ecoregion Published 31 May 2016 8.3.14 Herring (Clupea harengus) in subdivisions 25 29 and 32 (central Baltic Sea, excluding Gulf of Riga)
ICES Advice on fishing opportunities, catch, and effort Baltic Sea Ecoregion Published 31 May 2016 8.3.14 Herring (Clupea harengus) in subdivisions 25 29 and 32 (central Baltic Sea, excluding Gulf of Riga)
How illegal discarding. failing EU fisheries. and citizens. How illegal discarding in. fisheries and citizens. Executive summary
 THROWN Thrown Away AWAY How illegal discarding in in the the Baltic Baltic Sea is Sea failing is EU fisheries and citizens How illegal discarding failing EU fisheries Executive summary and citizens Rebecca
COMMISSION OF THE EUROPEAN COMMUNITIES COMMUNICATION FROM THE COMMISSION. Fishing Opportunities for 2009 Policy Statement from the European Commission
 EN EN EN COMMISSION OF THE EUROPEAN COMMUNITIES Brussels, 30.5.2008 COM(2008) 331 final COMMUNICATION FROM THE COMMISSION Fishing Opportunities for 2009 Policy Statement from the European Commission EN
7 th Dec: TRENDS & FORWARD PROSPECTS FOR SCOTTISH COD, HADDOCK, WHITING, SAITHE Fishing & Uptake
 7 th Dec: TRENDS & FORWARD PROSPECTS FOR SCOTTISH COD, HADDOCK, WHITING, SAITHE Fishing & Uptake Uptake Summary: As at: 29 th November 2017 UK Landings (tonnes) 2016 2017 % Uptake UK Quota UK Landings
Undulate ray (Raja undulata) in divisions 7.d e (English Channel)
 in divisions 7.d e (English Channel)") ICES Advice on fishing opportunities, catch, and effort Celtic Sea Ecoregion Published 13 July 2018 https://doi.org/10.17895/ices.pub.4501. Undulate ray (Raja undulata) in divisions 7.d e (English Channel)
ICES Advice on fishing opportunities, catch, and effort Celtic Sea Ecoregion Published 13 July 2018 https://doi.org/10.17895/ices.pub.4501. Undulate ray (Raja undulata) in divisions 7.d e (English Channel)
Boarfish (Capros aper) in subareas 6 8 (Celtic Seas, English Channel, and Bay of Biscay)
 in subareas 6 8 (Celtic Seas, English Channel, and Bay of Biscay)") ICES Advice on fishing opportunities, catch, and effort Bay of Biscay and the Iberian Coast, Celtic Seas, Published 29 September 2017 Greater North Sea, and Oceanic Northeast Atlantic Ecoregions DOI: 10.17895/ices.pub.3025
ICES Advice on fishing opportunities, catch, and effort Bay of Biscay and the Iberian Coast, Celtic Seas, Published 29 September 2017 Greater North Sea, and Oceanic Northeast Atlantic Ecoregions DOI: 10.17895/ices.pub.3025
RESEARCH FOR PECH COMMITTEE - OPTIONS OF HANDLING CHOKE SPECIES IN THE VIEW OF THE EU LANDING OBLIGATION THE BALTIC PLAICE EXAMPLE
 DIRECTORATE-GENERAL FOR INTERNAL POLICIES POLICY DEPARTMENT B: STRUCTURAL AND COHESION POLICIES FISHERIES RESEARCH FOR PECH COMMITTEE - OPTIONS OF HANDLING CHOKE SPECIES IN THE VIEW OF THE EU LANDING OBLIGATION
6.4 Stock summaries Advice June 2012
 6.4 Stock summaries 6.4.1 Advice June 2012 ECOREGION STOCK North Sea Cod in Division IIIa East (Kattegat) Advice for 2013 ICES advises on the basis of precautionary considerations that there should be
Andrew A. Rosenberg University of New Hampshire, USA
 by Andrew A. Rosenberg University of New Hampshire, USA Principles Recovery of overexploited stocks even after decades of overfishing is possible if fishing pressure and habitat impacts can be reduced
Black-bellied anglerfish (Lophius budegassa) in divisions 7.b k, 8.a b, and 8.d (west and southwest of Ireland, Bay of Biscay)
 in divisions 7.b k, 8.a b, and 8.d (west and southwest of Ireland, Bay of Biscay)") ICES Advice on fishing opportunities, catch, and effort Greater Northern Sea, Celtic Seas, and Bay of Biscay and Iberian Coast Ecoregions Published 29 June 2018 https://doi.org/10.17895/ices.pub.4474 Black-bellied
ICES Advice on fishing opportunities, catch, and effort Greater Northern Sea, Celtic Seas, and Bay of Biscay and Iberian Coast Ecoregions Published 29 June 2018 https://doi.org/10.17895/ices.pub.4474 Black-bellied
The landings obligation in view of different management regimes
 The landings obligation in view of different management regimes Hans Frost and Ayoe Hoff Department of Food and Resource Economics 21/07/2016 2 What? Using a simple two-fleet two-species bio-economic model
FISHERIES CO-OPERATION ICELAND AND NORWAY WITH. Presented by Philip Rodgers ERINSHORE ECONOMICS
 FISHERIES CO-OPERATION WITH ICELAND AND NORWAY Presented by Philip Rodgers 17/12/2013 Fisheries Cooperation with Norway and Iceland 1 Objective To consider the current situation in the fishery for highly
9.4.5 Advice September Widely distributed and migratory stocks Herring in the Northeast Atlantic (Norwegian spring-spawning herring)
") 9.4.5 Advice September 212 ECOREGION STOCK Widely distributed and migratory stocks Herring in the Northeast Atlantic (Norwegian spring-spawning herring) Advice for 213 ICES advises on the basis of the
9.4.5 Advice September 212 ECOREGION STOCK Widely distributed and migratory stocks Herring in the Northeast Atlantic (Norwegian spring-spawning herring) Advice for 213 ICES advises on the basis of the
ICES Advice on fishing opportunities, catch, and effort Celtic Seas Ecoregion Published 30 June 2016
 Celtic Seas Ecoregion Published 30 June 2016 5.2.7.2 Mixed-fisheries advice for divisions 7.b c and 7.e k (Celtic Sea) Summary ICES cannot recommend specific mixed-fisheries catch opportunities as no mixed-fisheries
North Sea Advisory Council
 Page 1 of 27 North Sea Advisory Council NSAC Advice Ref.11-1718 TAC- and quota-based options for addressing the challenges of the Landing Obligation This paper was approved by the NSAC Executive Committee
Predicted catch for 2016, per stock and scenario overshoot (hatched) and undershoot (below zero)
 and undershoot (below zero)") ICES Advice on fishing opportunities, catch, and effort Celtic Seas Ecoregion Published 30 June 2015 5.2.2.1 Mixed-fisheries advice for Divisions VIIb,c,e k (Celtic Sea) Scenarios for 2016 Mixed-fisheries
ICES Advice on fishing opportunities, catch, and effort Celtic Seas Ecoregion Published 30 June 2015 5.2.2.1 Mixed-fisheries advice for Divisions VIIb,c,e k (Celtic Sea) Scenarios for 2016 Mixed-fisheries
Nephrops Forum Trawl Selectivity
 Nephrops Forum Nephrops Forum Trawl Selectivity Mike Montgomerie Gear Technologist Seafish Trawl Selectivity All small mesh fisheries are prone to selectivity problems. Prawn trawls designed to maintain
5. purse seines 3 000
 Sea Bass Q and A Latest News What have the 28 Member States decided on 2 July? The EU has today taken another step to protect sea bass. The 28 EU member states agreed to the Commission's proposal to increase
BY CATCH IN NORWAY. HOW IT WORKS?
 BY CATCH MANAGEMENT Discard ban in Norway : BY CATCH IN NORWAY. HOW IT WORKS? All catches that are dead or dying viable fish can be released back to the sea.(except snow crabs) List of species under the
Turning the tide for low impact fisheries. Ways to improve the CFP reform proposal
 Turning the tide for low impact fisheries Ways to improve the CFP reform proposal urning the tide Promoting low impact fisheries All fisheries have an impact on the marine environment, both directly on
Proposal for a COUNCIL REGULATION
 EUROPEAN COMMISSION Brussels, 29.8.2017 COM(2017) 461 final 2017/0212 (NLE) Proposal for a COUNCIL REGULATION fixing for 2018 the fishing opportunities for certain fish stocks and groups of fish stocks
13196/16 AS/JGC/sr DGB 2A
 Council of the European Union Brussels, 26 October 2016 (OR. en) Interinstitutional File: 2016/0260 (NLE) 13196/16 PECHE 369 LEGISLATIVE ACTS AND OTHER INSTRUMTS Subject: COUNCIL REGULATION fixing for
Norway lobster (Nephrops norvegicus) in Division 3.a, functional units 3 and 4 (Skagerrak and Kattegat)
 in Division 3.a, functional units 3 and 4 (Skagerrak and Kattegat)") ICES Advice on fishing opportunities, catch, and effort Greater North Sea Ecoregion Published 29 June 2018 https://doi.org/10.17895/ices.pub.4433 Norway lobster (Nephrops norvegicus) in Division 3.a, functional
ICES Advice on fishing opportunities, catch, and effort Greater North Sea Ecoregion Published 29 June 2018 https://doi.org/10.17895/ices.pub.4433 Norway lobster (Nephrops norvegicus) in Division 3.a, functional
Assessment Summary Report Gulf of Mexico Red Snapper SEDAR 7
 Assessment Summary Report Gulf of Mexico Red Snapper SEDAR 7 Stock Distribution: Red snapper are found throughout the Gulf of Mexico, the Caribbean Sea, and from the U.S. Atlantic Coast to northern South
Evaluation of fisheries dependent information in European waters 5-9 September 2016, Gavirate
 STECF EXPERT WORKING GROUP EWG Evaluation of fisheries dependent information in European waters 5-9 September 2016, Gavirate DG Mare focal person: Eckehard Reussner Chair: Steven Holmes Background The
COMMISSION DELEGATED REGULATION (EU)
") L 336/42 COMMISSION DELEGATED REGULATION (EU) 2015/2440 of 22 October 2015 establishing a discard plan for certain demersal fisheries in the North Sea and in Union waters of ICES Division IIa THE EUROPEAN
L 336/42 COMMISSION DELEGATED REGULATION (EU) 2015/2440 of 22 October 2015 establishing a discard plan for certain demersal fisheries in the North Sea and in Union waters of ICES Division IIa THE EUROPEAN
Advice June 2012
 5.4.29 Advice June 2012 ECOREGION STOCK Celtic Sea and West of Scotland + North Sea Anglerfish (Lophius piscatorius and L. budegassa) in Division IIIa, and Subareas IV and VI Advice for 2013 Based on the
Joint NGO recommendations on Baltic Sea fishing opportunities for 2019
 Joint NGO recommendations on Baltic Sea fishing opportunities for 2019 In October 2018, EU fisheries ministers are scheduled to agree on fishing opportunities in the Baltic Sea for 2019. The following
Plaice (Pleuronectes platessa) in subdivisions (Baltic Sea, excluding the Sound and Belt Seas)
 in subdivisions (Baltic Sea, excluding the Sound and Belt Seas)") ICES Advice on fishing opportunities, catch, and effort Baltic Sea Ecoregion Published 31 May 2016 Version 2, 22 August 2016 8.3.16 Plaice (Pleuronectes platessa) in subdivisions 24 32 (Baltic Sea, excluding
ICES Advice on fishing opportunities, catch, and effort Baltic Sea Ecoregion Published 31 May 2016 Version 2, 22 August 2016 8.3.16 Plaice (Pleuronectes platessa) in subdivisions 24 32 (Baltic Sea, excluding
By far the majority of New Zealand s fisheries are performing well
 The Status of New Zealand s Fisheries 212 November 212 Introduction This document summarises the status of New Zealand s fish stocks relative to the requirements of the Harvest Strategy Standard for New
Management of the North Sea flatfish fishery: exploring alternative ITQ systems IIFET 2014, Brisbane, July 9 th 2014 K. G. Hamon, H. Bartelings, F.
 Management of the North Sea flatfish fishery: exploring alternative ITQ systems IIFET 2014, Brisbane, July 9 th 2014 K. G. Hamon, H. Bartelings, F. Buisman, J. A. E van Oostenbrugge, B. de Vos The fishery
ICES approach for Data Limited Stocks (progress after June 2012) Mixed fisheries and Multispecies approaches
 Mixed fisheries and Multispecies approaches") ICES approach for Data Limited Stocks (progress after June 2012) Mixed fisheries and Multispecies approaches Carmen Fernández, ACOM vice-chair North Western Waters RAC (July 23, 2013, Dublin) Data limited
ICES approach for Data Limited Stocks (progress after June 2012) Mixed fisheries and Multispecies approaches Carmen Fernández, ACOM vice-chair North Western Waters RAC (July 23, 2013, Dublin) Data limited
ICES advises that when the MSY approach is applied, catches in 2019 should be no more than tonnes.
 ICES Advice on fishing opportunities, catch, and effort Greater Northern Sea, Celtic Seas, and Bay of Biscay and Iberian Coast Published 29 June 2018 ecoregions https://doi.org/10.17895/ices.pub.4463b
Sprat (Sprattus sprattus) in subdivisions (Baltic Sea)
 in subdivisions (Baltic Sea)") ICES Advice on fishing opportunities, catch, and effort Baltic Sea Ecoregion Published 31 May 2016 8.3.18 Sprat (Sprattus sprattus) in subdivisions 22 32 (Baltic Sea) ICES stock advice ICES advises that
ICES Advice on fishing opportunities, catch, and effort Baltic Sea Ecoregion Published 31 May 2016 8.3.18 Sprat (Sprattus sprattus) in subdivisions 22 32 (Baltic Sea) ICES stock advice ICES advises that
Trials of a Net Grid for the UK Nephrops trawl fisheries
 Trials of a Net Grid for the UK Nephrops trawl fisheries Tom Catchpole, Frank Armstrong, Stuart Masson, Dave Price, Mark O Brien & John Hingley June 2012 This work was funded by Defra Executive Summary