THE 2018 ROSENTHAL PRIZE for Innovation in Math Teaching. Geometry Project: DARTBOARD
|
|
|
- Felicia Hoover
- 5 years ago
- Views:
Transcription
1 THE 2018 ROSENTHAL PRIZE for Innovation in Math Teaching Geometry Project: DARTBOARD Geometric Probability Theoretical Probability and Experimental Probability Elizabeth Masslich Geometry grades 6-12
2 Table of Contents 1. Lesson Goals and Standards Preview to the Project: Active Learning in the Classroom Materials 5 4. Dartboard DIRECTIONS Dartboard CHARTS Dartboard RUBRIC for Geometry Accelerated/Geometry Honors Dartboard RUBRIC for Geometry Dartboard HELPS sheets for GeoGebra and for Google Sheets Dartboard SHAPES for the teacher to print out on card stock Dartboard SOLUTIONS for the Charts Suggestions Acknowledgements.34
3 Lesson Goals and Standards Lesson Goals: Measure lengths of line segments with precision to the nearest tenth. Calculate areas using formulas: triangle, circle, rectangle, rhombus, regular polygon, kite, trapezoid. Determine geometric probabilities with targets that a random point hits a particular shape. o Calculate the theoretical probability. o Calculate the experimental probability. Know that the probability of a dart hitting any of the shapes is the same as the ratio of each area to the total dartboard area. Create a Google Spreadsheet that calculates formulas and is organized. Show your understanding of theoretical probability and of experimental probability by typing responses on a sheet. Mathematics Standards for Mathematical Practice Construct viable arguments. Model with mathematics. Use appropriate tools strategically. Attend to precision. Mathematics Standards for Mathematical Content Use ratio reasoning to convert measurement units; manipulate and transform units appropriately when multiplying or dividing quantities. 6.RP.3.d Find the area of right triangles, other triangles, special quadrilaterals, and polygons by composing into rectangles or decomposing into triangles and other shapes; apply these techniques in the context of solving real-world and mathematical problems. 6.G.1 Know the formulas for the area of a circle and use it to solve problems. 7.G.4.a Investigate chance processes and develop, use, and evaluate probability models. 7.SP.5 and 7.SP.6 Understand and evaluate random processes underlying statistical experiments. S-IC.1 and S-IC.2 Mathematics ACT College and Career Readiness Standards Understand the role or randomization in surveys, experiments, and observational studies. S 703 Recognize that part of the power of statistical modeling comes from looking at regularity in the differences between actual values and model values. S 705 Recognized that when a statistical model is used, model values typically differ from actual values. S 506 Recognize that when data summaries are reported in the real world, results are often rounded and must be interpreted as having appropriate precision. S 505 Use the relationship between the probability of an event and the probability of its complement. S 305 Compute straightforward probabilities for common situations. S 503 Determine the probability of a simple event. S 403 Perform common conversions of length within a measurement system. G203 Compute the areas of rectangles, triangles, circles, and composite geometric figures. G303, G403, G702 Recognize that real-world measurements are typically imprecise and that an appropriate level of precision is related to the measuring device and procedure. G 504


4 Preview to the Project: Active Learning in the Classroom Materials: 10 inches by 12 inches of a sheet of paper 5 inches by 6 inches of a sheet of paper 10 markers, all different colors Directions: The teacher or the students can do the following: o Create the dartboard: Cut one rectangular piece of paper that is 10 inches by 12 inches (easiest to do this from using an 11 inch by 17 inch sheet of paper). o Create the target: Cut one rectangular piece of paper that is 5 inches by 6 inches. o Tape or glue the target to the dartboard. Frame the dartboard with paper around it so that random marker hits will mark up the frame and not the wall. Then, place the framed dartboard on a wall or on a vertical whiteboard. Split the class into 10 groups. Each group is assigned one of the marker colors. Each of the 10 groups will discuss their answers to the following questions: o Out of 100 random marker hits, how many should land in the target? Why? Justify your answer mathematically. o What is the area of the target? o What is the area of the dartboard? o What is the ratio of the area of the target to the area of the dartboard? o Would you get different results for any of these questions if you moved the target? While the groups are answering the questions, have each group walk up to the dartboard at different times. They must use their marker color and randomly place darts on the dartboard with their marker. o Students should face away from the dartboard, turn around, and randomly mark the dartboard with the marker. o Each group should do this 10 times, so each marker has 10 hits (10 darts per marker color). o Students should record their hits and their misses (you can call these in and out of the target). A chart can be written on the whiteboard or on a sheet of paper next to the dartboard. o Turning around can be fun, but also can create dizzy students, so the teacher will need to monitor this active learning activity so that students don t hurt themselves. Perhaps, limit one turn at a time so that students are not constantly turning around to make marks. Once all groups have placed their marker darts on the dartboard, total up the table values. o Discuss the answers to the four questions. o Discuss how accurate your class was. o Discuss how your class could be more accurate with their darts. o Discuss how your class could conduct this experimental trials to get very accurate results.
 Dartboard DIRECTIONS Dartboard CHARTS Dartboard RUBRIC o Helps Packet (print on white paper students keep this")
 Rulers (in centimeters) Scissors (unless the teacher wants to cut the shapes out of the cardstock paper before the students do the")
5 Materials The teacher will make copies of the project, one for each student. o Project Packet (print on colored purple paper students will turn in this packet) Dartboard DIRECTIONS Dartboard CHARTS Dartboard RUBRIC o Helps Packet (print on white paper students keep this packet as a reference packet) GeoGeobra HELPS sheet Google Sheets HELPS sheet 11 inches by 17 inches white paper (This will be the dartboard. Students will trace 6 of the big shapes on this dartboard. Students will work with pairs, so have enough paper for each group) Rulers (in centimeters) Scissors (unless the teacher wants to cut the shapes out of the cardstock paper before the students do the activity) Computer or Chromebook The teacher will make about 10 sets of the big shapes with White Cardstock Paper. OPTIONAL: It is helpful to have the cut-out shapes organized in plastic bags and place them around the room so that students have room to select their shapes.
6 Geometry Project: Dartboard DIRECTIONS Name: Hr: Partner s Name: This is a quick summary of the project; there are three parts: 1. Create a dartboard and complete the CHARTS handout. 2. Use GeoGebra to calculate experimental probabilities. 3. Create a Google Sheet to record your area calculations and to answer the four questions of this project. You will turn in your dartboard and the purple packet. You will share your Google Sheet link with your teacher. You have to share it as Anyone with the link and access is Can edit. You will share your GeoGebra link with your teacher. These are the steps for the Dartboard Project: 1. Create dartboard by choosing 6 of the 22 shapes that are on your SHAPES handout (circle, square, triangle, rhombus, rectangle, parallelogram, and regular polygon). You need to design the dartboard to include 6 different shapes. As a class, choose one of the same shapes that everyone will have in his/her dartboard. (For example, choose Shape 1 as one of your 6 shapes.) Do not include the dartboard as one of the 6 shapes. Do not overlap your shapes. Use the 11 in by 17 in sheet of white paper. Trace the shapes that your teacher has printed out on card stock paper. Do not use the small shapes on your SHAPES handout; that handout just lets you plan out which shapes you will be tracing from the card stock papers. Write the shape number in each shape that you draw on the paper. Record your shapes on the CHARTS handout. 2. Measure all dimensions of all shapes in centimeters, and round to the nearest tenth of a centimeter. Draw a picture of each shape, label dimensions on each shape, and record the dimensions on the CHARTS handout. Find areas of all shapes. Write a formula and show your work for each shape on the CHARTS handout. Round every answer to the nearest tenth of a centimeter. 3. Find theoretical probabilities (TP) of all shapes. To find the TP, find the area of each shape as a percentage of the total area of the dartboard. Round each to the nearest tenth of a percent. Show your work on the CHARTS handout. 4. Create a GeoGebra worksheet that has a picture of your dartboard in an 11 by 17 rectangle. Create a random point generator for 100 random points. Record your results on the Experimental Trials Chart in the CHARTS handout. You will record five trials. (Since any one trial can have unusual results, it is necessary to perform more than one trial.) 5. Create a Google Spreadsheet. Create two pages in your Google Spreadsheet file. On the first page, create a table that shows the dimensions, areas, and area sum of your 6 shapes. You must type in formulas in your sheet for the areas and area sum; this way, if you edit one cell in the table, the entire table s calculations automatically adjusts and calculates correct values for the areas and area sum. On the second page, create a question/answer page in an organized table. Type the questions from the bottom of this sheet of paper. Then, type in your answers to each question. Example of work on the CHART handout: (dimensions are not correct for #4 this is just an example) Shape #4 Triangle Formula: A = ½ bh Dimensions: b =1.2 cm; h = 3.8 cm Work: A = ½ ( 1.2 cm )( 3.8 cm) Area: A = 2.3 cm² (area of triangle) (area of dart board) (# darts land on shape) (# of total darts thrown) Example of a Dartboard: Questions
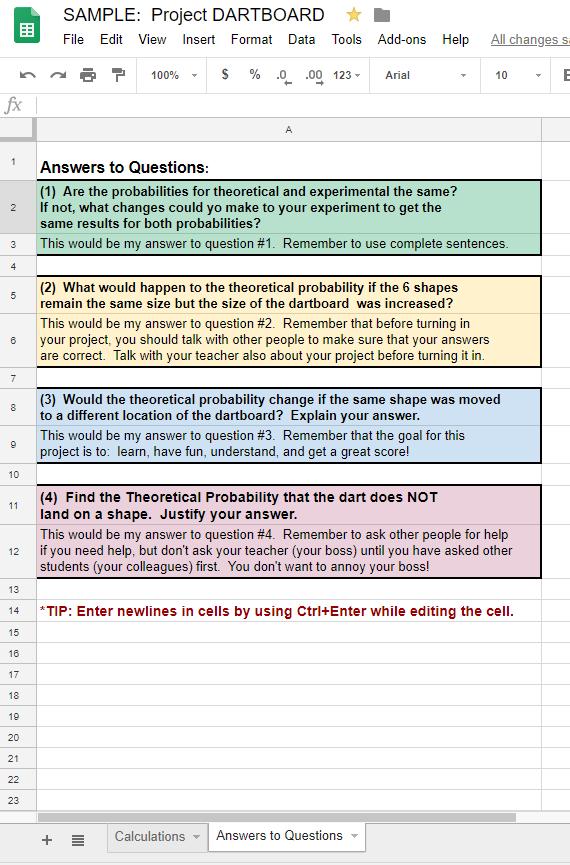
7 1. Are the probabilities for theoretical and experimental the same? If not, what changes could you make to your experiment to get the same results for both probabilities? 2. What would happen to the theoretical probability if the 6 shapes remain the same size but the size of the dartboard was increased? 3. Would the theoretical probability change if the same shape moved to a different location of the dartboard? Explain your answer. 4. Find the Theoretical Probability that the dart does NOT land on a shape. Justify your answer. Geometry Project: Dartboard CHARTS Name: Hour: Partner s Name: Work to find the area of the dartboard: Area of the Dartboard Shape A # Shape B # Experimental Trials Chart Shape C # Shape D # Shape E # Shape F # Misses TOTAL Trial 1 = 100 Trial 2 = 100 Trial 3 = 100 Trial 4 = 100 Trial 5 = 100
8 Average = 100 Measurements/Work Chart Shape A # Shape Name: Shape B # Shape Name:
9 Shape C # Shape Name: Shape D # Shape Name:
10 Shape E # Shape Name: Shape F # Shape Name: Geometry Project: Dartboard RUBRIC Name: /55 pts Partner s Name: Hour: Turn in: (1) dartboard, (2) purple packet, (3) GeoGebra link, and (4) Google Sheets link
11 Geometry Dartboard Design Dimensions of Shapes Area Calculations Theoretical Probability (TP) Calculated Experimental Probability (EP) Calculated GeoGebra link GeoGebra worksheet Answers to Questions Google Sheets (followed directions) Google Sheets (organization) Dartboard displays all 4 of the following: 1. 6 distinct shapes, not overlapping 2. Shapes with correct numbers 3. A pentagon or a hexagon is one of the 6 distinct shapes 4. Professional display Shapes are correctly identified, sides are accurately measured, and correct units are used (centimeters) on the paper. Name: /45 pts Partner s Name: Hour: 5 - Excellent 3 - Fair 1 - Poor Dartboard displays all 3 of the following: 1. 6 distinct shapes, not overlapping 2. Shapes with correct numbers 3. A pentagon or a hexagon is one of the 6 distinct shapes 4. Professional display Correct formulas are used for every shape, work is shown, and all calculations and units are correct on the paper. The theoretical probabilities calculated are correct for each shape. Work is shown for all calculation on the paper. The experimental probabilities calculated are correct for each shape. Work is shown for all calculations. Experimental Trials Chart is completed on the paper. The GeoGebra link is in Canvas and works. All of the following are met: 1. Dartboard picture is in GeoGebra 2. Dartboard is inscribed in the rectangle 3. Random Point generator works All of the following are met: 1. All four questions are answered correctly and completely. 2. Answers use complete sentences. All of the following are met: 1. One Google Sheet file, each labeled 2. 1 st sheet is for the calculations 3. 2 nd sheet is for the answers to the?s 4. The file is submitted into Canvas. All of the following are met: 1. A grid is shown in both sheets. 2. Data is centered in each cell. 3. All information can be read without scrolling to the right. 4. Colors are used in both sheets. Most shapes are correctly identified, sides are accurately measured, and correct units are used. There are minimal errors. Correct formulas are used for most shapes, work is shown, and all calculations and units are correct. There may be minimal errors. The theoretical probabilities calculated are correct for most shapes. All work is not shown. There may be minimal errors. The experimental probabilities calculated are correct for most shapes. All work and trials are not shown. There may be minimal errors. Most of the following are met: 1. Dartboard picture is in GeoGebra 2. Dartboard is inscribed in the rectangle 3. Random Point generator works Most of the following are met: 1. All four questions are answered correctly and completely. 2. Answers use complete sentences. Most of the following are met: 1. One Google Sheet file, each labeled 2. 1 st sheet is for the calculations 3. 2 nd sheet is for the answers to the?s 4. The file is submitted into Canvas. Most of the following are met: 1. A grid is shown in both sheets. 2. Data is centered in each cell. 3. All information can be read without scrolling to the right. 4. Colors are used in both sheets. Dartboard displays all 1-2 of the following: 1. 6 distinct shapes, not overlapping 2. Shapes with correct numbers 3. A pentagon or a hexagon is one of the 6 distinct shapes 4. Professional display Less than half of the shapes are correctly identified, sides are accurately measured, and correct units are used. There are many errors. Correct formulas are used for less than half of the shapes, work is shown, and all calculations and units are correct. There are many errors. The theoretical probabilities calculated are correct for less than half of the shapes. All work is not shown. There are many errors. The experimental probabilities calculated are correct for less than half of the shapes. All work and trials are not shown. There are many errors. One/some of the following are met: 1. Dartboard picture is in GeoGebra 2. Dartboard is inscribed in the rectangle 3. Random Point generator works One/some of the following are met: 1. All four questions are answered correctly and completely. 2. Answers use complete sentences. One/some of the following are met: 1. One Google Sheet file, each labeled 2. 1 st sheet is for the calculations 3. 2 nd sheet is for the answers to the?s 4. The file is submitted into Canvas. One/some of the following are met: 1. A grid is shown in both sheets. 2. Data is centered in each cell. 3. All information can be read without scrolling to the right. 4. Colors are used in both sheets. Google Sheets (accurate math) Project: Dartboard RUBRIC The formulas are correct for area and for total sum. Work is shown on packet (lower 3 rd side) The formulas are not all correct for area and for total sum and work is shown in packet. The formulas are not all correct for area and for total sum and work is shown in packet. Turn in: (1) dartboard, (2) purple packet, and (3) Google Sheets link
12 Dartboard Design Dimensions of Shapes Area Calculations Theoretical Probability (TP) Calculated Experimental Probability (EP) Calculated Answers to Questions Google Sheets (followed directions) Google Sheets (organization) 5 - Excellent 3 - Fair 1 - Poor Dartboard displays all 3 of the following: 1. 6 distinct shapes, not overlapping 2. Shapes with correct numbers 3. A pentagon or a hexagon is one of the 6 distinct shapes 4. Professional display 4. Professional display Dartboard displays all 4 of the following: 1. 6 distinct shapes, not overlapping 2. Shapes with correct numbers 3. A pentagon or a hexagon is one of the 6 distinct shapes 4. Professional display Shapes are correctly identified, sides are accurately measured, and correct units are used (centimeters) on the paper. Correct formulas are used for every shape, work is shown, and all calculations and units are correct on the paper. The theoretical probabilities calculated are correct for each shape. Work is shown for all calculation on the paper. The experimental probabilities calculated are correct for each shape. Work is shown for all calculations. Experimental Trials Chart is completed on the paper. All of the following are met: 1. All four questions are answered correctly and completely. 2. Answers use complete sentences. All of the following are met: 1. One Google Sheet file, each labeled 2. 1 st sheet is for the calculations 3. 2 nd sheet is for the answers to the?s 4. The file is submitted into Canvas. All of the following are met: 1. A grid is shown in both sheets. 2. Data is centered in each cell. 3. All information can be read without scrolling to the right. 4. Colors are used in both sheets. Most shapes are correctly identified, sides are accurately measured, and correct units are used. There are minimal errors. Correct formulas are used for most shapes, work is shown, and all calculations and units are correct. There may be minimal errors. The theoretical probabilities calculated are correct for most shapes. All work is not shown. There may be minimal errors. The experimental probabilities calculated are correct for most shapes. All work and trials are not shown. There may be minimal errors. Most of the following are met: 1. All four questions are answered correctly and completely. 2. Answers use complete sentences. Most of the following are met: 1. One Google Sheet file, each labeled 2. 1 st sheet is for the calculations 3. 2 nd sheet is for the answers to the?s 4. The file is submitted into Canvas. Most of the following are met: 1. A grid is shown in both sheets. 2. Data is centered in each cell. 3. All information can be read without scrolling to the right. 4. Colors are used in both sheets. Dartboard displays all 1-2 of the following: 1. 6 distinct shapes, not overlapping 2. Shapes with correct numbers 3. A pentagon or a hexagon is one of the 6 distinct shapes Less than half of the shapes are correctly identified, sides are accurately measured, and correct units are used. There are many errors. Correct formulas are used for less than half of the shapes, work is shown, and all calculations and units are correct. There are many errors. The theoretical probabilities calculated are correct for less than half of the shapes. All work is not shown. There are many errors. The experimental probabilities calculated are correct for less than half of the shapes. All work and trials are not shown. There are many errors. One/some of the following are met: 1. All four questions are answered correctly and completely. 2. Answers use complete sentences. One/some of the following are met: 1. One Google Sheet file, each labeled 2. 1 st sheet is for the calculations 3. 2 nd sheet is for the answers to the?s 4. The file is submitted into Canvas. One/some f the following are met: 1. A grid is shown in both sheets. 2. Data is centered in each cell. 3. All information can be read without scrolling to the right. 4. Colors are used in both sheets. Google Sheets (accurate math) The formulas are correct for area and for total sum. Work is shown on packet (lower 3 rd side) The formulas are not all correct for area and for total sum and work is shown in packet. The formulas are not all correct for area and for total sum and work is shown in packet.
13 Geometry Project: Dartboard GeoGebra HELPS Name: Hr: Ø Getting into GeoGebra Sign In with your Google account + Start GeoGebra Ø Creating an 11 by 17 Rectangle with 100 Random Points Make the 11 by 17 Rectangle Input: polygon((0,0),(0,11),(17,11),(17,0) Input: sequence(randompointin(q1),a,1,100) Create the button below the rectangle to mix up the points Click on the button 2 nd from the right. Click on the OK button. Click just below the x-axis, underneath the rectangle on the graph. Caption: Mix points GeoGebra Script: UpdateConstruction() Click, OK
14 Ø Placing Your Dartboard Picture in the GeoGebra 11 by 17 Rectangle Click on the button 2 nd from the right. Click on Image Choose your file that has the picture of your Dartboard. Ø Saving Your GeoGebra File Title: Dartboard Project First and Last Name Shared Ø Share your GeoGebra File Link with your teacher Share
 into the cell. o You must have two sheets. o Sheet 1 should have your measurements, formulas, and total area sum.")
15 Geometry Project: Dartboard Google Sheets HELPS Name: Hr: Google Sheets Guidelines You must have a formula for each of your 6 shapes. o Example: In cell K2, I typed =pi()*c2*c2 into the cell. You must have a formula for the total sum. o Example: In cell K9, I typed =sum(k2:k7) into the cell. o You must have two sheets. o Sheet 1 should have your measurements, formulas, and total area sum. o Sheet 2 should have the questions written out with your written answers. You will be also graded on how organized and professional your spreadsheets appear. On this front side of this sheet of paper, I ve attached a picture of what the first sheet of the Google Spreadsheet could look like. On the back side of this sheet of paper, I ve attached a picture of what the second sheet of the Google Spreadsheet could look like.
16
17 Shape 1 Shape 2
18 Shape 4 Shape 3
19 Shape 5 Shape 6
20 Shape 7 Shape 8
21 Shape 10 Shape 9
22 Shape 11 Shape 12
23 Shape 13 Shape 14
24 Shape 15 Shape 16
25 Shape 17 Shape 18
26 Shape 19 Shape 20
27 Shape 21 Shape 22
28 Geometry Quarter 4 Project: Dartboard SOLUTIONS to the Charts Work to find the area of the dartboard: Area of the Dartboard 11in 2.54cm 1 1in 27.9cm 17in 2.54cm 1 1in 43.2cm A = bh (27.9cm)(43.2cm) 1,205.3cm 8 *Measure to the insides of the sides of each shape. *Measure to the center of a point. Measurements/Work Chart Shape 1 Shape Name: Circle Shape 2 Shape Name: Circle r 7.1 cm r 5.0 cm A = πr 2 A = π(7.1 cm) 2 A cm 2 A = πr 2 A = π(5.0 cm) 2 A 78.5 cm 2
29 Shape 3 Shape Name: Right Triangle Shape 4 Shape Name: Right Triangle b 11.3 cm h 6.5 cm b 16.1 cm h 9.3 cm A = ½ bh A ½ (11.3 cm)(6.5 cm) A 36.7 cm 2 A = ½ bh A ½ (16.1 cm)(9.3 cm) A 74.9 cm 2
30 Shape 5 Shape Name: Square Shape 6 Shape Name: Square b 12.3 cm h 12.3 cm b 8.3 cm h 8.3 cm A = bh A (12.3 cm)(12.3 cm) A cm 2 A = bh A (8.3 cm)(8.3 cm) A 68.9 cm 2
31 Shape 7 Shape Name: Triangle (Isosceles, non-right) Shape 8 Shape Name: Triangle (Isosceles, non-right) b 13.5 cm h 11.3 cm b 10.2 cm h 8.5 cm A =½ bh A ½ (13.5 cm)(11.3 cm) A 76.3 cm 2 A =½ bh A ½ (10.2 cm)(8.5 cm) A 43.4 cm 2
32 Shape 9 Shape Name: Right Triangle Shape 10 Shape Name: Right Triangle b 13.4 cm h 13.6 cm b 10.2 cm h 10.2 cm A =½ bh A ½ (13.4 cm)(13.6 cm) A 91.1 cm 2 A =½ bh A ½ (10.2 cm)(10.2 cm) A 52.0 cm 2
33 Shape 11 Shape Name: Pentagon Shape 12 Shape Name: Pentagon b 8.7 cm h 6.5 cm b 6.2 cm h 4.7 cm A = n ½ bh = ½ nsa A 5 ½ (8.7 cm)(6.5 cm) A cm 2 A = n ½ bh A 5 ½ (6.2 cm)(4.7 cm) A 72.9 cm 2
34 Shape 13 Shape Name: Hexagon Shape 14 Shape Name: Hexagon b 5.7 cm h 5.0 cm b 7.2 cm h 6.2 cm A = n ½ bh A 6 ½ (5.7 cm)(5.0 cm) A 85.5 cm 2 A = n ½ bh A 6 ½ (7.2 cm)(6.2 cm) A cm 2
35 Shape 15 Shape Name: Parallelogram Shape 16 Shape Name: Parallelogram b 18.0 cm h 6.8 cm b 14.2 cm h 8.5 cm A = bh A (18.0 cm)(6.8 cm) A cm 2 A = bh A (14.2 cm)(8.5 cm) A cm 2
36 Shape 17 Shape Name: Trapezoid Shape 18 Shape Name: Trapezoid b cm b cm h 5.0 cm b cm b cm h 11.3 cm A = ½ h (b 1 + b 2) A ½ (5.0 cm)(17.0 cm cm) A 68.3 cm 2 A = ½ h (b 1 + b 2) A ½ (11.3 cm)(15.2 cm cm) A cm 2
37 Shape 19 Shape Name: Rectangle Shape 20 Shape Name: Rectangle b 15.2 cm h 5.2 cm b 16.6 cm h 10.0 cm A = bh A (15.2 cm)(5.2 cm) A 79.0 cm 2 A = bh A (16.6 cm)(10.0 cm) A cm 2
38 Shape 21 Shape Name: Kite Shape 22 Shape Name: Rhombus d cm d cm d cm d cm A =½ (d 1)(d 2) A ½ (14.7 cm)(9.8 cm) A 72.0 cm 2 A =½ (d 1)(d 2) A ½ (20.5 cm)(11.4 cm) A cm 2 Suggestions The point of this Geometric Probability lesson is for students to discover that the probability of a dart hitting any of the shapes is the same as the ratio of each area to the total dartboard area. First, have students select their shapes and trace them on the dartboard. It is helpful if in a class ALL students select one of their shapes to be the same, for instance #1. Second, have them take a picture of the dartboard and create their GeoGebra file. They should follow the directions on the GeoGebra HELPS sheet as they create a random point generator. Note that GeoGebra updates the look of their website, but the Geometry Classic often looks similar. So, even if the HELPS sheet is not exactly how the current GeoGebra site looks like, the steps should still be similar. Third, have students find EP. After all students have created a dartboard and a GeoGebra file, have them all calculate the experimental probability for their similar shape (i.e., Shape #1). For students who may not have yet finished their GeoGebra file, send them a link to a finished GeoGebra file so that they can all participate in this step together. Students may use this link to access a GeoGebra Dartboard with a random point generator: Each student should count the number of points in the similar shape (i.e., Shape #1). The teacher can create a Google Sheet with all the students numbers. Then, the teacher shows the students how to type in a formula to average the numbers. The average EP (experimental probability) should be very close to the TP (theoretical probability). Have a class discussion about how important it is to have many trials (experiments) rather than taking just one trial (experiment) to determine a probability that is close to the theoretical probability.
39 Here is a sample of the Google Sheets with some suggestions: dit?usp=sharing I do not share this file with students. I want each student to have the opportunity to create his/her own spreadsheet. The measurements in the solutions are rounded to the tenths place. This creates great discussions in the classroom on accuracy when rounding is done within a problem. Note that dimension measurements of the shapes may vary if the format of the SHAPES pages is changed. This project can be modified for all levels of students and classes. The teacher has a lot of options with this project; discretion can be made in determining what parts of the project would be best for student learning. o The teacher can guide students through the project when more help is needed for the students. o The modified 45 point rubric can be used for students who would not yet be ready to create a GeoGebra file. o The entire project can be assigned and students can work in class for a period and then do the rest on their own. o The entire project can be done in the classroom. o The teacher could use just part of the lesson plan and teach the students TP and EP in even 30 minutes! o Teachers who want to allow students to create and make it more of a STEAM project can have students create a theme to the dartboard. Students could trace the shapes on colored paper, cut out the colored shapes, and glue them onto a colored dartboard. Students could draw on the shapes and color a design. Lesson Extension: Use Geometric Probability as a tool to find the area of non-polygonal shapes. o Trace your hand on an 11 inch by 17 inch sheet of paper. o Follow the GeoGebra programming steps as you did for your shapes lesson. o Calculate the Experimental Probability (EP) of your hand. o Use a proportion to solve for the area of your hand. Set the EP fraction equal to the ratio of your unknown hand area to the known area of the dartboard. Acknowledgements Thanks to Nicki Donahue, Steve Phelps, my students, the Cedarburg School District, MoMath, GeoGebra, and my family for their support and contributions.
1 8 Practice Perimeter Circumference And Area Answers Form G
 1 8 Practice Perimeter Circumference And Area Answers Form G We have made it easy for you to find a PDF Ebooks without any digging. And by having access to our ebooks online or by storing it on your computer,
Week 8, Lesson 1 1. Warm up 2. ICA Scavanger Hunt 3. Notes Arithmetic Series
 CAN WE ADD AN ARITHMETIC SEQUENCE? Essential Question Essential Question Essential Question Essential Question Essential Question Essential Question Essential Question Week 8, Lesson 1 1. Warm up 2. ICA
1 8 Practice Perimeter Circumference And Area Form K Answers
 1 8 Practice Perimeter Circumference And Area Form K Answers We have made it easy for you to find a PDF Ebooks without any digging. And by having access to our ebooks online or by storing it on your computer,
2nd Grade Quarter Four Assessment Guide
 nd Grade Quarter Four Assessment Guide Measurement Data Geometry Essential Questions How can you select an appropriate measurement tool? How can you compare measurement lengths in different units? Can
25. [Perimeter] 4 2 = Measure each side length of the shape. Add together the side lengths.
![25. [Perimeter] 4 2 = Measure each side length of the shape. Add together the side lengths.](/thumbs/79/79674171.jpg "25. [Perimeter] 4 2 = Measure each side length of the shape. Add together the side lengths.") 25. [Perimeter] Skill 25.1 Finding the perimeter of polygons by measuring their side lengths. Measure each side length of the shape. Q. Use a ruler to find the perimeter of the scalene triangle in millimetres.
25. [Perimeter] Skill 25.1 Finding the perimeter of polygons by measuring their side lengths. Measure each side length of the shape. Q. Use a ruler to find the perimeter of the scalene triangle in millimetres.
Cumulative Test. Name. Score. Show all work on this paper. Please use the Student Reference Guide.
 Name Score Math Course 1 1A 1. Use the numbers 6, 12, and 18 to make two addition facts and two subtraction facts. 12 + 12 12 + 12 12 12 12 12 2. Use the numbers 5, 15, and 75 to make two multiplication
Perimeter. Name. 22 Topic 17. Reteaching Find the perimeter of the figure below.
 Perimeter Reteaching 1-1 Find the perimeter of the figure below. 15 m x 4 ft 4 ft 2 ft y 2 ft 5 ft 6 m 20 ft Reteaching 1-1 By using a formula: There are two equal lengths and equal widths, so you can
77.1 Apply the Pythagorean Theorem
 Right Triangles and Trigonometry 77.1 Apply the Pythagorean Theorem 7.2 Use the Converse of the Pythagorean Theorem 7.3 Use Similar Right Triangles 7.4 Special Right Triangles 7.5 Apply the Tangent Ratio
Areas of Parallelograms and Triangles 7-1
 Areas of Parallelograms and Triangles 7-1 Parallelogram A parallelogram is a quadrilateral where the opposite sides are congruent and parallel. A rectangle is a type of parallelogram, but we often see
About Finish Line PA Core Math 5
 Table of COntents About Finish Line PA Core Math 5 Unit 1: Big Ideas from Grade 4 7 Lesson 1 CC.2.1.4.B.2 Multiplying and Dividing Whole Numbers [connects to CC.2.1.5.B.2] 8 Lesson 2 CC.2.1.4.C.3 Understanding
LEARNING OBJECTIVES. Overview of Lesson. guided practice Teacher: anticipates, monitors, selects, sequences, and connects student work
 D Rate, Lesson 1, Conversions (r. 2018) RATE Conversions Common Core Standard N.Q.A.1 Use units as a way to understand problems and to guide the solution of multi-step problems; choose and interpret units
March Madness Basketball Tournament
 March Madness Basketball Tournament Math Project COMMON Core Aligned Decimals, Fractions, Percents, Probability, Rates, Algebra, Word Problems, and more! To Use: -Print out all the worksheets. -Introduce
Cumulative Test. Name. Score. Show all work on this paper. Please use the Student Reference Guide.
 Name Score Math Course 1 1B 1. Use the numbers 5, 11, and 16 to make two addition facts and two subtraction facts. 11 + 12 12 + 12 12 12 12 12 2. Use the numbers 4, 16, and 64 to make two multiplication
Essentials. Week by. Week. Investigations
 Week by Week MATHEMATICS Essentials Grade 5 WEEK Math Trivia Bees are smart mathematicians. They choose to build hexagonal cells in their honeycombs. Mathematicians have shown that only regular hexagons,
POST TEST KEY. Math in a Cultural Context*
 Fall 2007 POST TEST KEY Building a Fish Rack: Investigation into Proof, Properties, Perimeter and Area Math in a Cultural Context* UNIVERSITY OF ALASKA FAIRBANKS Student Name: POST TEST KEY Grade: Teacher:
Jefferson Township Public Schools Mathematics Department
 Jefferson Township Public Schools Mathematics Department Dear Student of Math Investigations, Your first assignment as a Math Investigations student will be the summer assignment. This packet is a review
Mathematics Spiral Review Quarter 2.1 Grade 5
 Mathematics Spiral Review Quarter 2.1 Basic Computation (5.NBT.7) Find the sum: 47.8 + 6.23 = Place Value (4.MBT.2) Compare the values using : a) 12 thousands 6 ten thousands b) 24 hundreds 3
March Madness Basketball Tournament
 March Madness Basketball Tournament Math Project COMMON Core Aligned Decimals, Fractions, Percents, Probability, Rates, Algebra, Word Problems, and more! To Use: -Print out all the worksheets. -Introduce
Mini-Golf Course Description. 1. You must draw your design on a piece of graph paper so that it will cover all four quadrants.
 Algebra 1 Mrs. Blake B256 Mini-Golf Course Description Guidelines for your creation: 1. You must draw your design on a piece of graph paper so that it will cover all four quadrants. 2. On the graph paper
NAME DATE PERIOD. Areas of Parallelograms and Triangles
 11-1 Skills Practice Areas of Parallelograms and Triangles Find the perimeter and area of each parallelogram or triangle. Round to the nearest tenth if necessary. 18 mm 10 mm 12 mm 4 ft 60 5.5 ft 4. 14
Cuisenaire Rods. A Guide to Teaching Strategies, Activities, and Ideas
 Cuisenaire Rods A Guide to Teaching Strategies, Activities, and Ideas INTRODUCTION This Learning About Cuisenaire Rods Activity Guide provides handson activities and ideas for leading students in an active
Standard 3.1 The student will plan and conduct investigations in which
 Teacher Name: Tammy Heddings Date: April 04, 2009 Grade Level: 3-6 Subject: Science Time: 30 minutes Concept: Scientific Investigation Topic: Variables SOLs: Standard 3.1 The student will plan and conduct
Using Darts to Simulate the Distribution of Electrons in a 1s Orbital
 NAME: Using Darts to Simulate the Distribution of Electrons in a 1s Orbital Introduction: The quantum theory is based on the mathematical probability of finding an electron in a given three dimensional
Chapter 0 Pretest = 4
 Determine whether you need an estimate or an exact answer. Then solve. 1. SHOPPING Addison paid $1.29 for gum and $0.89 for a package of notebook paper. She gave the cashier a $5 bill. If the tax was $0.14,
Common Core State Standards
 0 03 Pacing Guide for Sixth Grade Common Core State Standards Math Content Standards Ratios and Proportional Relationships RP Understand ratio concepts and use ratio reasoning to solve problems. The Number
Sum Fun Tournament Meeting (Multiple Topics)
") Sum Fun Sum Fun Tournament Meeting (Multiple Topics) Sum Fun Topic There are a wide range of topics and difficulty levels covered during this meeting. Materials Needed The first four items listed below
Sum Fun Sum Fun Tournament Meeting (Multiple Topics) Sum Fun Topic There are a wide range of topics and difficulty levels covered during this meeting. Materials Needed The first four items listed below
APPROVED FACILITY SCHOOLS CURRICULUM DOCUMENT SUBJECT: Mathematics GRADE: 6. TIMELINE: Quarter 1. Student Friendly Learning Objective
 TIMELINE: Quarter 1 i-ready lesson: Rational Numbers and Absolute Value i-ready lesson: Numerical Expressions and Order of Operations 6/16/15 1 i-ready lesson (2a, 2b and 2c): Algebraic Expressions 6/16/15
Algebra/Geometry Institute Summer 2010
 Algebra/Geometry Institute Summer 2010 Faculty Name: Norman Snerling School: Clarksdale High School Grade Level: Transition to Algebra 1 Teaching objective(s) Measurement 4 a. Solve real-world problems
Measuring Length. Goals. You will be able to
 Measuring Length Goals You will be able to choose, use, and rename metric length measurements measure perimeters of polygons solve problems using diagrams and graphs Running in a Triathlon Racing Snails
Grade: 8. Author(s): Hope Phillips
: Hope Phillips") Title: Tying Knots: An Introductory Activity for Writing Equations in Slope-Intercept Form Prior Knowledge Needed: Grade: 8 Author(s): Hope Phillips BIG Idea: Linear Equations how to analyze data from
Title: Tying Knots: An Introductory Activity for Writing Equations in Slope-Intercept Form Prior Knowledge Needed: Grade: 8 Author(s): Hope Phillips BIG Idea: Linear Equations how to analyze data from
Understanding Place Value : Maths : Year 3 : Autumn Term
 Understanding Place Value : Maths : Year 3 : Autumn Term To recognise the place value of each digit in a three-digit number. Recap how to partition a two-digit number into tens and ones, before exploring
Perimeter and area Test Find the area. A 182 cm 2 B 195 cm 2 C 210 cm 2 D 58 cm 2. 2 Find the area. A 28 yd 2 B 14 yd 2 C 27 yd 2 D 35 yd 2
 Name: ate: 1 Find the area. 182 cm 2 195 cm 2 210 cm 2 58 cm 2 2 Find the area. 28 yd 2 14 yd 2 27 yd 2 35 yd 2 opyright Pearson Education, Inc. or its affiliates. ll Rights Reserved. Page 1 of 18 3 Find
ACTIVITY: Finding a Formula Experimentally
 8.1 Volumes of Cylinders How can you find the volume of a cylinder? 1 ACTIVITY: Finding a Formula Experimentally Work with a partner. a. Find the area of the face of a coin. b. Find the volume of a stack
Choose the correct answer. For Games Day, 112 students were organized into teams of 8. How many teams were formed? 12
 Choose the correct answer. Page For Games Day, students were organized into teams of. How many teams were formed? 4 9 Ace Sporting Goods displays boxes of basketballs. They have 7 boxes. They want to make
Friday 6 November 2015 Morning
 Oxford Cambridge and RSA F Friday 6 November 2015 Morning GCSE MATHEMATICS B J567/02 Paper 2 (Foundation Tier) * 4 8 2 9 4 7 6 7 3 9 * Candidates answer on the Question Paper. OCR supplied materials: None
Practice Task: Trash Can Basketball
 Fourth Grade Mathematics Unit 5 Practice Task: Trash Can Basketball STANDARDS FOR MATHEMATICAL CONTENT MCC4.NF.7 Compare two decimals to hundredths by reasoning about their size. Recognize that comparisons
COMPACTED MATHEMATICS CHAPTER 10 AREA AND PERIMETER TOPICS COVERED:
 COMPACTED MATHEMATICS CHAPTER 10 AREA AND PERIMETER TOPICS COVERED: Perimeter of polygons Area of rectangles and squares Area of parallelograms Area of triangles Area of trapezoids Activity 10-1 Perimeter
12-2 Area of Circles. Find the area of each circle. Round to the nearest tenth. 1. ANSWER: m 2. ANSWER: 12.6 yd 2 ANSWER: 132.
 Find the area of each circle. Round to the nearest tenth. 1. 6. A motion detector at the corner of a building can detect motion outside within a radius of 20 feet as shown. Within what area can it detect
The Math and Science of Bowling
 The Report (100 : The Math and Science of Bowling 1. For this project, you will need to collect some data at the bowling alley. You will be on a team with one other student. Each student will bowl a minimum
The Bruins I.C.E. School
 The Bruins I.C.E. School Lesson 1: Area and Volume of a Cylinder Lesson 2: Using and Applying the Pythagorean Theorem Lesson 3: Investigating patterns of association in bivariate data Lesson 4: Investigating
Lesson 23: The Volume of a Right Prism
 Lesson 23 Lesson 23: Student Outcomes Students use the known formula for the volume of a right rectangular prism (length width height). Students understand the volume of a right prism to be the area of
Ho olele lupe. 1 Introduction. 2 Grade Levels and Topics
 1 Introduction Ho olele lupe The Hawaiian demigod Maui is given credit for the ho olele lupe (Hawaiian kite) invention. Oral traditions as well as the creation chants of Kaelikuahulu suggest that ho olele
Arithmetic with Units of Measure
 Arithmetic with Units of Measure Reteaching 81 Math Course 1, Lesson 81 If units are not the same, convert first. Example: 2 ft + 12 in. 24 in. + 12 in. or 2 ft + 1 ft To add or subtract measures, keep
ROUND TOSS-UP: What is the square root of one million? (1000) (10 points) BONUS: How many zeros are at the end of ?
 (10 points) BONUS: How many zeros are at the end of ?") ROUND 1 1. TOSS-UP: What is 24% of 50? (12) (10 points) BONUS: A clothing store is having a 60% off sale on its dresses. Brandi has a coupon that lets her take 20% off of the sale price. If she pays $24
ROUND 1 1. TOSS-UP: What is 24% of 50? (12) (10 points) BONUS: A clothing store is having a 60% off sale on its dresses. Brandi has a coupon that lets her take 20% off of the sale price. If she pays $24
Applying Rational Number Operations
 ? LESSON 3.6 Applying Rational Number Operations ESSENTIAL QUESTION 7.EE.3 Solve problems with positive and negative rational numbers in any form using tools strategically. (For the full text of the standard,
Confidence Interval Notes Calculating Confidence Intervals
 Confidence Interval Notes Calculating Confidence Intervals Calculating One-Population Mean Confidence Intervals for Quantitative Data It is always best to use a computer program to make these calculations,
Math 6 EQT Study Guide Quarter 3. and a package of 12 golf balls. The package with 3 golf balls costs $4.59, and the package with 12 golf balls
 Math EQT Study Guide Quarter 3 1. How will the surface area of the figure represented by the net change if the length increases by 7 feet? The original figure has dimensions of l = 12 feet, w = feet, and
Applications of Mathematics
 Write your name here Surname Other names Pearson Edexcel GCSE Centre Number Candidate Number Applications of Mathematics Unit 1: Applications 1 For Approved Pilot Centres ONLY Foundation Tier Wednesday
Gears Ratios and Speed / Problem Solving
 Teacher Mechanics Note to the teacher On this page, students will learn about the relationship between gear ratio, gear rotational speed, wheel radius, diameter, circumference, revolutions and distance.
Revised from Mr. Underwood s Dragon Putt-Putt Project. Challenge 1
 Activity: Dragon Putt-Putt 1 Revised from Mr. Underwood s Dragon Putt-Putt Project Challenge 1 In Challenge 1, you will be constructing a scale drawing of two or three miniature golf holes. In order to
Spirit Lesson 3 Robot Wheelies Lesson Outline Content: Context: Activity Description:
 Spirit Lesson 3 Lesson Title: Robot Wheelies Draft Date: July 13, 2008 1 st Author: Deb Hipnar 2 nd Author: Rachel Neurath Algebra Topic: Formulas: Circumference, Distance Grade Level: Upper Elementary,
ETA Cuisenaire The Super Source Grades: 7, 8 States: Texas Essential Knowledge and Skills (TEKS) Subjects: Mathematics
 Subjects: Mathematics") ETA Cuisenaire The Super Source Grades: 7, 8 States: Texas Essential Knowledge and Skills () Subjects: Mathematics TX.111.23 (7.1) Texas Essential Knowledge and Skills () Mathematics Grade 7 Number, operation,
ETA Cuisenaire The Super Source Grades: 7, 8 States: Texas Essential Knowledge and Skills () Subjects: Mathematics TX.111.23 (7.1) Texas Essential Knowledge and Skills () Mathematics Grade 7 Number, operation,
Parking Lot HW? Joke of the Day: What do you call a leg that is perpendicular to a foot? Goals:
 Parking Lot Joke of the Day: HW? What do you call a leg that is perpendicular to a foot? a right ankle Goals: Agenda 1 19 hw? Course Recommendations Simplify Radicals skill practice L8 2 Special Right
CK-12 Geometry: Special Right Triangles
 CK-12 Geometry: Special Right Triangles Learning Objectives Identify and use the ratios involved with isosceles right triangles. Identify and use the ratios involved with 30-60-90 triangles. Review Queue
Year 10 Mathematics, 2009
 Student s Name: Teacher s Name: 10 Year 10 Mathematics, 2009 Algebra Use straightforward algebraic methods and sketch and interpret features of linear graphs Time: 20 minutes. Check that you have entered
Mathematics Spiral Review Quarter 1.1 Grade 5
 Mathematics Spiral Review Quarter 1.1 Basic Computation (4.NBT.4) 378 + 1,761 = Write 538 using number names and expanded form. Estimation (4.NBT.3) Round to the nearest hundred: 329 6,582 Skill of the
Math 081 Worksheet Section 8.4 v01 Spring 2011 Dressler. Name. 6) 12 dm. Find the area of the geometric figure. 1) 5 m. Rectangle. 25.
 12 dm. Find the area of the geometric figure. 1) 5 m. Rectangle. 25.") Math 081 Worksheet Section 8.4 v01 Spring 2011 Dressler Name 6) 12 dm Find the area of the geometric figure. 1) 5 dm Rectangle 5 m ) 6.8 m 12 units 25.5 units 2) 22.5 units Rectangle 3 m 8).9 m 20 yd 52
Math 081 Worksheet Section 8.4 v01 Spring 2011 Dressler Name 6) 12 dm Find the area of the geometric figure. 1) 5 dm Rectangle 5 m ) 6.8 m 12 units 25.5 units 2) 22.5 units Rectangle 3 m 8).9 m 20 yd 52
Lesson 22: Getting the Job Done Speed, Work, and Measurement Units
 Lesson 22: Getting the Job Done Speed, Work, and Measurement Units Student Outcomes Students decontextualize a given speed situation, representing symbolically the quantities involved with the formula.
Engineering Design Challenge. Mapping the Ocean Floor
 Engineering Design Challenge Project Title: Project Source: Project Submitter: Mapping the Ocean Floor NOAA, http://tinyurl.com/boydlek STEM Improvement Lesson Development Team Grade Level/Subject: Math,
The Bruins I.C.E. School
 The Bruins I.C.E. School Lesson 1: Addition & Subtraction Word Problems Lesson 2: Extend the Counting Sequence Lesson 3: Extend the Counting Sequence Lesson 4: Understand Place Value Lesson 5: Represent
Skills Practice Skills Practice for Lesson 3.1
 Skills Practice Skills Practice for Lesson.1 Name Date Get Radical or (Be) 2! Radicals and the Pythagorean Theorem Vocabulary Write the term that best completes each statement. 1. An expression that includes
Introduction to Scientific Notation & Significant Figures. Packet #6
 Introduction to Scientific Notation & Significant Figures Packet #6 Introduction A measurement is a quantity that has both a unit and number Measurements are fundamental to the experimental sciences. Measurements,
Mark Scheme (Results) Summer 2009
 Summer 2009") Mark Scheme (Results) Summer 2009 GCSE GCSE Mathematics (Linear) - 1380 Paper: 1380_2F 2 NOTES ON MARKING PRINCIPLES 1 Types of mark M marks: method marks A marks: accuracy marks B marks: unconditional
Mark Scheme (Results) Summer 2009 GCSE GCSE Mathematics (Linear) - 1380 Paper: 1380_2F 2 NOTES ON MARKING PRINCIPLES 1 Types of mark M marks: method marks A marks: accuracy marks B marks: unconditional
Grade 6 Lesson 1. Lesson Plan. Page 2. Guided Practice Handout. Page 4. Student Activity Handout Page 5
 Grade 6 Lesson 1 Item Lesson Plan Page Page 2 Guided Practice Handout Page 4 Activity Handout Page 5 Marlins Think Tank: Sixth Grade Math Lesson Plan #1 VISION-SETTING OBJECTIVE. What is your objective?
Paper 1. Year 9 mathematics test. Calculator not allowed. Remember: First name. Last name. Class. Date
 Ma KeY STAGe 3 Year 9 mathematics test Tier 3 5 Paper 1 Calculator not allowed First name Last name Class Date Please read this page, but do not open your booklet until your teacher tells you to start.
Contents ... TEACHER GUIDE NCTM Content Standards Assessment Rubric... 6 How Is Our Resource Organized? The NCTM Principles & Standards...
 Contents... TEACHER GUIDE NCTM Content Standards Assessment Rubric.. 6 How Is Our Resource Organized?. 11 The NCTM Principles & Standards 12 STUDENT HANDOUTS Number and Operations Drill Sheets Warm-Up
Lesson 2 Pre-Visit Batting Average Ups and Downs
 Lesson 2 Pre-Visit Batting Average Ups and Downs Objective: Students will be able to: Use multiple data sets to determine the overall success rate of a particular activity. Select and create appropriate
Pacific Charter Institute Pacing Guide Grade(s): _5 Subject Area: _Math in Focus grade 5 CP: yes _X no
: _5 Subject Area: _Math in Focus grade 5 CP: yes _X no") Week 1 Pre-requisite skills review Chapter 1 pre-test Assessment 5 chapter pre-test pp. 1-4 or MIF Student book 5A pp. 1-4 Reteach 4A (1.1, 1.2, 2.1, 3.2, 3.4) NWEA Kids start Wed. Week 2 1.1 Writing numbers
Week 1 Pre-requisite skills review Chapter 1 pre-test Assessment 5 chapter pre-test pp. 1-4 or MIF Student book 5A pp. 1-4 Reteach 4A (1.1, 1.2, 2.1, 3.2, 3.4) NWEA Kids start Wed. Week 2 1.1 Writing numbers
Lesson 27: Real-World Volume Problems
 Student Outcomes Students use the volume formula for a right prism ( ) to solve volume problems involving rate of flow. Lesson Notes Students apply their knowledge of volume to real-world contexts, specifically
SUMMER Math STEM 7th Grade Summer Math Packet
 Name Date SUMMER Math STEM 7th Grade Summer Math Packet Simplify the expression. 3 7 1. 4(x + 3) 2. x 3. Use a formula to find the area of the figure. 4. Tickets to a basketball game cost $4 for adults
Design/Plan. Materials
 Teacher Background Wind has been used as a energy source for centuries. Inventions from sailing ships to wind will harness the energy in moving air and turn it into power to do work. In this model activity,
Summer Work. 6 th Grade Enriched Math to 7 th Grade Pre-Algebra
 Summer Work 6 th Grade Enriched Math to 7 th Grade Pre-Algebra Attached is a packet for Summer 2017. Take your time. Do not wait until the weeks right before school to begin. The benefit of summer work
Name: Class: Date: Geometry Chapter 4 Test Review
 Name: Class: Date: ID: C Geometry Chapter 4 Test Review. 1. Determine the measure of angle UPM in the following figure. Explain your reasoning and show all your work. 3. Determine the side length of each
Candidate Number. General Certificate of Secondary Education Foundation Tier January 2013
 Centre Number Surname Candidate Number For Examiner s Use Other Names Candidate Signature Examiner s Initials General Certificate of Secondary Education Foundation Tier January 2013 Pages 3 4 5 Mark Mathematics
Let s go Fly a Kite Up, in the Atmosphere!!!
 Let s go Fly a Kite Up, in the Atmosphere!!! For this major grade project, you will be designing, constructing, and flying a kite. You may work in teams of no more than 2 students, from the same class
Paper 2. Mathematics test. Calculator allowed. First name. Last name. School KEY STAGE TIER
 265279_p2_35_skunk.qxp 20/6/05 10:04 am Page 1 Ma KEY STAGE 3 TIER 3 5 2005 Mathematics test Paper 2 Calculator allowed Please read this page, but do not open your booklet until your teacher tells you
Chapter 7 Test Form 2c Answers Algebra 1
 We have made it easy for you to find a PDF Ebooks without any digging. And by having access to our ebooks online or by storing it on your computer, you have convenient answers with chapter 7 test form
3/27/18 CCM6+ Review Units 8 11 for Q3 RETEST tomorrow. HW: study units 8 11 for retest tomorrow!
 3/27/18 CCM6+ Review Units 8 11 for Q3 RETEST tomorrow. HW: study units 8 11 for retest tomorrow! 1 Tests back...questions? 2 Unit 8: Expressions and Inequalities 3 Solve for m: _m_ = 40 5 4 Solve for
Lesson 1: Decimal Place Value. Concept/Topic to Teach: Students use Bruins statistical data to order and compare decimals to the thousandths.
 Math Lesson 1: Decimal Place Value Concept/Topic to Teach: Students use Bruins statistical data to order and compare decimals to the thousandths. Standards Addressed: Standard 1: 5.NBT.3 Read, write, and
BIOL 101L: Principles of Biology Laboratory
 BIOL 101L: Principles of Biology Laboratory Sampling populations To understand how the world works, scientists collect, record, and analyze data. In this lab, you will learn concepts that pertain to these
The Rabbit Pen Problem Created by: Angeli Tempel George Mason University, COMPLETE Math Spring 2016
 The Rabbit Pen Problem Created by: Angeli Tempel George Mason University, COMPLETE Math Spring 2016 The Task Ms. Brown s class will raise rabbits for their spring science fair. They have 24 feet of fencing
Math 11 Essentials Final Assessment Part #1
 Math 11 Essentials Final Assessment Part #1 Name Show all work on this sheet. No attached pages! Total Points: 1. Lucy wanted to know how many people in her class owned a cat or a dog. Her results are
Bellwork MCT Practice Test (Form A) Problem numbers.
 Problem numbers.") Course 7 th Grade Math Student Objective (Obj. 5d) TSW determine probability through experimentation and calculations. DETAIL LESSON PLAN Tuesday, April 16 / Wednesday, April 17 Lesson 12-1, 12-2 Probability
Course 7 th Grade Math Student Objective (Obj. 5d) TSW determine probability through experimentation and calculations. DETAIL LESSON PLAN Tuesday, April 16 / Wednesday, April 17 Lesson 12-1, 12-2 Probability
GCSE Mathematics Calculator Foundation Tier Free Practice Set 5 1 hour 30 minutes ANSWERS. Marks shown in brackets for each question (2)
") MathsMadeEasy 3 GCSE Mathematics Calculator Foundation Tier Free Practice Set 5 1 hour 30 minutes ANSWERS Marks shown in brackets for each question Typical Grade Boundaries C D E F G 76 60 47 33 20 Legend
MathsMadeEasy 3 GCSE Mathematics Calculator Foundation Tier Free Practice Set 5 1 hour 30 minutes ANSWERS Marks shown in brackets for each question Typical Grade Boundaries C D E F G 76 60 47 33 20 Legend
Marking Guidelines 2009 examination June series. Physics Investigative Skills Assignment (ISA) Q. General Certificate of Education
 Q. General Certificate of Education") General Certificate of Education Physics Investigative Skills Assignment (ISA) Q PHY3T/Q09/mark Written Test Marking Guidelines 2009 examination June series APW/Jun09/PHY3T/Q09/mark Mark Guidelines Explanatory
General Certificate of Education Physics Investigative Skills Assignment (ISA) Q PHY3T/Q09/mark Written Test Marking Guidelines 2009 examination June series APW/Jun09/PHY3T/Q09/mark Mark Guidelines Explanatory
Smiley Face Math Grade 3, Worksheet I
 Smiley Face Math Grade 3, Worksheet I Name: 1. Shantell wants to plant a flower garden. The garden will have 8 rows with 6 flowers in each row. She has already planted 1 row of her garden. How many plants
Practice A. Congruent Figures. Are there any congruent figures in each picture? If there are, describe them
 Name Date Class Practice A Are there any congruent figures in each picture? If there are, describe them. Determine the unknown measure in each set of congruent polygons. 7. 8. 9. 10. Name Date Class Practice
Math Spring Operational Geometry PBA Item #18 Classmates in the Pool VH003506
 Math Spring Operational 2015 Geometry PBA Item #18 Classmates in the Pool VH003506 Prompt Rubric Task is worth a total of 6 points VH003506 Rubric Score Description 6 Student response includes the following
GCSE Mathematics. Foundation Tier
 For Edexcel Name GCSE Mathematics Paper 2F (Calculator) Foundation Tier Time: 1 hour and 30 minutes Materials required Ruler, protractor, compasses, pen, pencil, eraser. Tracing paper may be used. Instructions
LESSON 2: SUBMARINE BUOYANCY INVESTIGATION
 LESSON 2: SUBMARINE BUOYANCY INVESTIGATION Lesson overview This lesson encourages students to investigate hands-on the property of neutral buoyancy, and to discuss its importance in terms of submarines.
The Pythagorean Theorem Diamond in the Rough
 The Pythagorean Theorem SUGGESTED LEARNING STRATEGIES: Shared Reading, Activating Prior Knowledge, Visualization, Interactive Word Wall Cameron is a catcher trying out for the school baseball team. He
GEOMETRY CIRCLING THE BASES PRE-VISIT - BALLPARK FIGURES - PART 2
 PRE-VISIT - BALLPARK FIGURES - PART 2 OBJECTIVE: Students will be able to: Identify the formulas for finding circumference and area of a circle. Calculate the circumference and area of given circles. TIME
Walk - Run Activity --An S and P Wave Travel Time Simulation ( S minus P Earthquake Location Method)
") Walk - Run Activity --An S and P Wave Travel Time Simulation ( S minus P Earthquake Location Method) L. W. Braile and S. J. Braile (June, 2000) braile@purdue.edu http://web.ics.purdue.edu/~braile Walk
Walk - Run Activity --An S and P Wave Travel Time Simulation ( S minus P Earthquake Location Method) L. W. Braile and S. J. Braile (June, 2000) braile@purdue.edu http://web.ics.purdue.edu/~braile Walk
Performance Task # 1
 Performance Task # 1 Goal: Arrange integers in order. Role: You are a analyzing a Julie Brown Anderson s dive. Audience: Reader of article. Situation: You are interviewing for a job at a sports magazine.
Unit 1 Summary. License Math: Basic Math in Real Estate. Converting fractions to decimals
 Converting fractions to decimals Some real estate math problems will contain fractions. While it is possible to solve the problem using fractions, it s typically easier to convert the fraction to a decimal
Experiment 1 Introduction to Some Laboratory Measurements
 Experiment 1 Introduction to Some Laboratory Measurements Introduction In this experiment you will familiarize yourself with the English & metric systems of measurement, weigh with a centigram balance,
Lesson 12T ~ Introducing Percents
 Lesson 2T ~ Introducing Percents Name Period Date For each shaded grid, write the ratio of the shaded squares to 00 (a fraction) the percent of squares shaded as a number with the % sign.. 2. 3. 4. Shade
2011 Excellence in Mathematics Contest Team Project Level I (Precalculus and above)
") 011 Excellence in Mathematics Contest Team Project Level I (Precalculus and above) School Name: Solutions Group Members: Reference Sheet Formulas and Facts You may need to use some of the following formulas
011 Excellence in Mathematics Contest Team Project Level I (Precalculus and above) School Name: Solutions Group Members: Reference Sheet Formulas and Facts You may need to use some of the following formulas
5-8 Applying Special Right Triangles
 5-8 Applying Special Right Triangles Warm Up Lesson Presentation Lesson Quiz Geometry Warm Up For Exercises 1 and 2, find the value of x. Give your answer in simplest radical form. 1. 2. Simplify each
Unit 2 Day 4 Notes Law of Sines
 AFM Unit 2 Day 4 Notes Law of Sines Name Date Introduction: When you see the triangle below on the left and someone asks you to find the value of x, you immediately know how to proceed. You call upon your