THE MASSACHUSETTS GOLF ECONOMY
|
|
|
- Hannah Cross
- 6 years ago
- Views:
Transcription


1 THE MASSACHUSETTS GOLF ECONOMY FULL REPORT This report was commissioned by GOLF 20/20 for the Alliance of Massachusetts Golf Organizations and prepared by SRI International


2 The Massachusetts Golf Economy Published May 2014 through an agreement with
3 CONTENTS STUDY OVERVIEW... 1 ANALYTICAL FRAMEWORK... 2 A. Golf Industry Cluster Definition... 2 B. Data Sources... 3 THE SIZE OF MASSACHUSETTS GOLF ECONOMY... 6 A. Core Industries... 6 B. Enabled Industries GOLF S ECONOMIC IMPACT IN MASSACHUSETTS DETAILED METHODOLOGY & DATA SOURCES A. Golf Facility Operations B. Golf Facility Capital Investment C. Golf- Related Supplies D. Associations, Tournaments & Charitable Giving E. Real Estate F. Golf- Related Hospitality/Tourism G. Golf s Economic Impact WORKS CITED Acknowledgements This report was prepared by SRI in agreement with GOLF 20/20, the Massachusetts Golf Association, the Women s Golf Association of Massachusetts, the New England Section of The Professional Golfers Association of America, the Golf Course Superintendents Association of New England, the New England Chapter of the Club Managers Association of America, the New England Chapter of the Golf Course Owners Association, Francis Ouimet Scholarship Fund, Deutsche Bank Championship, and the New England Golf Association. In addition, support for this report comes from the following national allied organizations: CMAA, GCSAA, LPGA, NGCOA, PGA of America, PGA TOUR, and USGA. The Massachusetts Golf Economy study was conducted by Bincy Ninan- Moses, Daniel Querejazu, Christopher Schreck, Katherine Johnston, Jennifer Ozawa, and Peter Ryan at SRI International with contributions from individuals representing a number of Massachusetts golf organizations.
4 ACRONYMS AMGO CMAA GCBAA GRAA GCSAA GCSANE LPGA MGA MOTT NECMAA NEGCOA NEGA NEPGA NGF NGCOA PGA USGA WGF Alliance of Massachusetts Golf Organizations Club Managers Association of America Golf Course Builders Association of America Golf Range Association of America Golf Course Superintendents Association of America Golf Course Superintendents Association of New England Ladies Professional Golf Association Massachusetts Golf Association Massachusetts Office of Travel & Tourism New England Chapter of the Club Managers Association of America New England Chapter of the Golf Course Owners Association New England Golf Association New England Section of The Professional Golfers Association of America National Golf Foundation National Golf Course Owners Association The Professional Golfers Association of America United States Golf Association World Golf Foundation
5 STUDY OVERVIEW With 376 golf facilities and two professional golf championships, golf in Massachusetts is more than just an enjoyable pastime it is a key industry contributing to the vitality of local communities and the state economy. In 2012, the size of Massachusetts direct golf economy was approximately $1.7 billion. Golf brings visitors to the state, drives new construction and residential development, generates retail sales, and creates demand for a myriad of goods and services. When the total economic impact of these golf- related activities is considered, Massachusetts golf industry supported approximately $2.7 billion of total economic activity, over 25,000 jobs, and $796.8 million of wage income in This report represents the second study estimating the impact of the golf industry on Massachusetts economy. SRI conducted a previous economic impact study for the base year During the period between the two golf economy studies (2006 and 2012), the Massachusetts golf industry endured a significant U.S. economic recession ( ). The effect of this recession can be seen acutely in the decline in golf real estate construction and golf- related supply revenues between 2006 and Despite some contraction in those sectors, however, Massachusetts golf industry grew as a whole between 2006 and SRI estimates that the Massachusetts golf industry generated $1.7 billion of economic activity in This represents an overall increase of 7.9 percent from 2006 (when the estimated size of the golf economy was $1.6 billion), primarily reflecting growth in golf facility operations and in the hospitality/tourism sectors. 1
6 ANALYTICAL FRAMEWORK Current economic studies of the golf industry in different states emphasize various factors and outcomes. For example, one may focus largely on the turf industry, while another might examine the impact of sports and recreation- related tourism more broadly. Ideally, one would want to include all the key activities and industries that are enabled by and benefit from the game of golf. To meet this goal, SRI has developed a standardized, economic impact framework that can be employed to measure a comprehensive set of golf- driven industry components. This state- level framework draws on the conceptual model of the golf economy developed in SRI s 2000 national- level The Golf Economy Report and the 2006 state- level The Massachusetts Golf Economy Report. A. GOLF INDUSTRY CLUSTER DEFINITION To arrive at economic impact, one must first estimate the size of the golf economy in the state. This entails mapping out where the golf industry begins and ends, and then estimating the size of each of these industry segments. We divide the golf industry cluster into two main categories: (1) core industries and (2) enabled industries (see figure below). The golf industry cluster begins with the golf facilities themselves and with those other core industries that produce goods and services used to operate facilities and to play the game: golf equipment and golf apparel manufacturers, golf course architects and course builders, turf maintenance equipment and service providers, and club management services. The game of golf further enables a number of other industries, such as golf- related tourism and real estate development. We detail these industry segments and estimate their size in the following section. Having defined the core and enabled golf industries, it is possible to estimate the size of each industry segment and to total them for an overall estimate of the size of the golf economy. Multipliers can then be applied to calculate the ripple effects of these economic activities in terms of: (1) impact on total state economic output and (2) impact on total state employment. However, this process is complicated by the fact that, while most of these industries produce golf- related goods and services, the firms themselves may not limit their activities exclusively to the golf industry. For example, Nike produces golf shoes, but also running, tennis, basketball, and other shoes. Therefore, in general, our approach is to include only those firms and sales that are directly attributable to the game of golf. In so doing, we use a number of different estimation techniques to ensure that our final estimates are reasonable and robust. 2

7 Moreover, additional data challenges and location factors make estimation more difficult at the state- level than the national- level. For example, many of the major golf equipment manufacturers have production facilities in just a few states. Similarly, several of the major golf association headquarters are located in Florida. The presence of such firms, associations, or a number of well- known courses will change the size of golf s economic impact in the state considerably. Therefore, one should consider the size of the golf economy and the game s economic impact in the state in relation to the size of the overall economy and other major industries in that state. B. DATA SOURCES SRI developed its framework for measuring state golf economies based on a broad set of existing sources and data. Although there have been several state- level impact studies conducted in the past by numerous golf constituencies, few have used a similar methodology, resulting in very different estimates depending on the golf economy elements included. A great deal of data is collected on the golf economy by many organizations on a regular basis. For example, government agencies, national golf associations, and national associations in the enabled industries collect data on different industry elements periodically annually, every few years, or every five years. In addition, these data are based 3
8 on a relatively consistent set of inputs by large numbers of constituents. Therefore, the principal challenges involve acquiring the data, inflating or deflating the estimates for the proper target year, and then combining them to represent the entire golf economy in the target year. The core and enabled industry indicators and data sources we have identified are as follows: State Golf Economy Indicators and Data Sources Indicator Primary source Cross- validation source Golf Facility Operations # of golf course facilities by type PGA Facility Database, multiple years ( data) Avg. revenues by type of facility PGA Facility Operations Survey, multiple years ( data) # of rounds by facility type 2013 PGA Operations Survey (2012 data) Golf Course Capital Investments Avg. capital investment by type of GCSAA Compensation Survey facility (2005, 2007, 2009, 2011 data) # of golf courses under construction National Golf Foundation in current year Avg. cost of construction per new course Golf- Related Supplies Golf- related manufacturing exports Golf equipment Golf apparel Golf media Major Tournaments # of major tournaments held in state Visitor attendance at tournaments, tournament revenues Associations & Charitable Giving # of major state- level golf associations ( data) Golf Course Builders Association of America Company annual reports; SEC filings; interviews National Sporting Goods Association ( data) National Sporting Goods Association ( data) Magazine Publishers of America for golf magazine sales; Bowker Annual of Library and Book Trade Information ( data) State task force Major golf associations NGF Facility Database, multiple years; state golf associations; 2007 Economic Census 2007 Economic Census; National Golf Foundation; state task force National Golf Foundation National Golf Foundation; state task force NGF Construction database; state task force State task force; interviews with golf course builders in state Company interviews; state task force 2006 PGA Compensation Survey (2005 data) 2006 PGA Compensation Survey (2005 data) Amazon and Barnes & Noble for top golf book sales PGA TOUR, LPGA State counterparts of national golf State task force associations Annual expenditures/budgets State golf associations IRS Form 990 Revenues raised through charitable golf events National Golf Foundation Real Estate # of residential golf courses under construction National Golf Foundation State tourism agency; national golf associations; state golf associations Sampling of golf professionals and club managers to identify # of tournaments and average amount raised Online research 4
9 # of lots per course Real estate development site plans; interviews with real estate developers Avg. construction costs per home and real estate premium Interviews with real estate developers Real estate agents Real estate agents Hospitality/Tourism # of golf travelers or # of golf- related trips to the state Avg. spending per traveler or per trip TNS Travel America or TIA/D.K. Shifflet & Associates TNS Travel America or TIA/D.K. Shifflet & Associates State department of tourism/recent surveys/studies State department of tourism/recent surveys/studies; National Golf Foundation 5
10 THE SIZE OF MASSACHUSETTS GOLF ECONOMY The table below presents SRI s estimates for the size of each of the six golf industry segments and the overall golf economy in 2006 and SRI estimates the total size of Massachusetts golf economy in 2012 was approximately $1.74 billion, up from $1.61 billion in The growth in the Massachusetts golf economy was driven primarily by growth in two industry segments: golf facility operations and hospitality/tourism. CORE INDUSTRIES Size of Massachusetts Golf Economy in 2012 and 2006 by Industry Segment ($ millions) Golf Facility Operations $793.2 $649.4 Golf Course Construction and Capital Investments $66.9 $60.5 Golf- Related Supplies (retail margin and manufacturing exports) $461.9 $528.3 Major Golf Tournaments and Associations $18.6 $19.0 Total Core Industries $1,340.6 $1,257.2 ENABLED INDUSTRIES Real Estate $30.2 $60.3 Hospitality/Tourism $366.7 $292.4 Total Enabled Industries $396.9 $352.7 TOTAL GOLF ECONOMY $1,737.5 $1,610.0 Note: Column sums may not sum due to rounding of individual estimates. Numbers also have not been adjusted for inflation but are expressed as nominal dollars. A. CORE INDUSTRIES Golf Facility Operations At the center of any golf economy lie the golf facilities the largest component in terms of revenues. The revenue that flows through a golf facility comes primarily from green fees, membership fees, golf cart rentals, lessons, and associated spending on food and beverages. This revenue, in turn, supports a host of supply sectors including golf equipment and apparel designers and manufacturers, food and beverage providers, and turfgrass equipment and maintenance service providers. Massachusetts s 376 golf courses, 53 stand- alone ranges, and 38 miniature golf facilities generated $793.2 million of revenue in This represents an increase over the 2006 total revenue of $649.4 million ($719.1 million in 2012 dollars when adjusted for inflation). 6
11 Massachusetts Golf Facility Revenues in 2012 ($ millions) Golf Facilities $761.3 Practice Ranges & Alternative Facilities $31.9 TOTAL 1 $793.2 Note: 1 Golf facility revenues exclude on- course merchandise sales, which are included in the Golf- Related Supplies industry segment. Golf is a sizeable industry, but even more significant when compared to other popular revenue- generating sports. For example, Massachusetts golf facilities generated revenues comparable to all other spectator sports in the state combined football, baseball, basketball, hockey, and soccer. These five other sports generated revenues of $840.0 million in 2007 (latest available year for this data), or $906.2 million in 2012 inflation- adjusted dollars. 1 Golf Facility Capital Investments Golf facilities generate economic impacts beyond operational expenditures through investments to upgrade and maintain facilities and infrastructure, and through the construction, expansion, and renovation of courses. These investments create employment in the construction and maintenance industries and often involve the purchase of significant amounts of equipment and supplies from companies within the state. SRI s estimate of Massachusetts s golf facility capital investments is divided into two segments: (1) capital investments at existing facilities and (2) new course construction. Together, Massachusetts s golf facilities made $66.9 million worth of capital investments in 2012: $63.2 million of investments at existing facilities and $3.7 million for the construction of new courses. By comparison, Massachusetts s golf facilities made $60.5 million in total capital investment in 2006, which includes $44.5 million of investments at existing facilities and $16.0 million for the construction of new courses. (When adjusted for inflation, these figures are $67.0 million for total capital investments: $49.3 million at existing facilities and $17.8 million for the construction of new courses in 2012 dollars.) The slight decrease in total capital investments in real terms from 2006 to 2012 reflects a substantial decline in new course construction, which outweighed the growth in investment at existing facilities over this period. 1 U.S. Census Bureau (2014). Massachusetts: 2007, 2007 Economic Census, Arts, Entertainment & Recreation Geographic Series. 7
12 Massachusetts Golf Facility Capital Investment and New Course Construction in 2012 ($ millions) Golf Facility Capital Investments 1 $63.2 New Course Construction $3.7 TOTAL $66.9 Note: 1 Only the New Course Construction category is included in the economic impact analysis, because it represents new economic output or activity. Golf facility capital investments are typically financed through golf facility revenues, so including both Golf Facility Capital Investments and Golf Facility Operations in economic impact analysis would result in double counting. Golf- Related Supplies Massachusetts golfers spend significant sums on golf balls, golf clubs, golf apparel, and golf media (books, magazines, DVDs). The economic value that accrues to a state comes from the production of these golf- related goods, as well as retail sales of such items. Massachusetts is home to some notable golf equipment manufacturers, such as Acushnet (parent company of the Titleist brand of golf equipment and apparel) and Callaway Golf (which formerly owned Top- Flite and still manufactures Callaway Golf balls in Chicopee). The state is also home to a handful of smaller golf- related companies: New Balance Golf, which is introducing a new line of golf shoes; Ahead, which designs and embroiders golf caps; Etonic, which designs and manufacturers golf shoes; Champ Spikes; and custom putter manufacturers; among others. The analysis focuses on companies out- of- state sales, since the value of products that are sold in Massachusetts is already captured in the retail portion of the Golf- Related Supplies segment. In 2012, SRI estimates that the value- added shipment of these products generated $425.7 million, down from $496.6 million in 2006 (or $549.9 million in inflation- adjusted dollars). This decline was largely due to competitive restructuring of operations by Massachusetts manufacturers following the recession. Massachusetts Manufacturers Value- Added Exports of Golf- Related Products in 2012 ($ millions) TOTAL $425.7 On the retail side, Massachusetts retailers earned approximately $36.2 million on the sale of $89.6 million of golf equipment, apparel, and media. By comparison, in 2006, Massachusetts retailers earned approximately $31.7 million (or $35.1 million in 2012 dollars when adjusted for inflation) on the sale of $78.8 million (or $87.3 million in 2012 dollars) of golf- related merchandise, representing a slight increase in real terms from 2006 to Overall, from 2006 to 2012, the Golf- Related Supplies segment (consisting of value- added exports plus retail margin) experienced a net decrease from $528.3 million (or $585.0 million in 2012 dollars when adjusted for inflation) to $461.9 million, due to a decline in golf- related manufacturing in Massachusetts during these two periods. 8
13 Massachusetts Retailers Net Revenues on Consumer Purchases of Golf- Related Supplies in 2012 ($ millions) Total purchases Retail sales margin Golf Equipment (retail margin) $67.0 $27.1 Golf Apparel (retail margin) $21.9 $8.8 Golf Media (retail margin) $0.7 $0.3 TOTAL $89.6 $36.2 Note: This includes on- course and off- course purchases of golf equipment, apparel, and media. Associations, Major Tournaments & Charitable Giving Associations and Major Tournaments Numerous associations represent the game of golf in Massachusetts. The largest golf associations represent members from across New England, including the New England Section of the Professional Golfers Association (New England PGA), the Golf Course Superintendents Association of New England, the New England Chapter of the Golf Course Owners Association, and the New England Chapter of the Club Managers Association of America. 2 Also very active are state and regional golf associations, such as the Massachusetts Golf Association, the New England Golf Association, the Women s Golf Association of Massachusetts, the Northeast Accessible Golf Association, several chapters of the Executive Women s Golf Association, as well as junior and senior golf associations. The First Tee, which introduces youth to the game and values of golf, has several program affiliates in Massachusetts. The New England Regional Turfgrass Foundation, formed through the cooperation of the seven Golf Course Superintendent Associations within the New England Region, promotes the region s turfgrass industry through conferences, seminars and support of state university research. 3 Massachusetts is also home to nonprofit organizations that leverage the game of golf to support cancer care and research and college scholarships, such as Golf Fights Cancer and the Francis Ouimet Scholarship Fund, among others. Massachusetts hosted one major golf championship in 2012: the Deutsche Bank Championship, a PGA TOUR event. The Deutsche Bank Championship is the second event of the FedEx Cup Playoffs featuring the top 100 PGA TOUR professionals. It is played annually over Labor Day weekend at the Tournament Players Club of Boston in Norton, MA. 2 Many of these regional golf associations are headquartered in Massachusetts, which is the largest member base on an 18- hole equivalent basis, although these associations support tournaments and activities across the region. SRI prorated association expenditures. 3 New England Regional Turfgrass Foundation, Accessed February 15,
14 In 2012, the Deutsche Bank Championship event (excluding the tournament purse and costs for TV broadcasting), combined with Massachusetts golf association expenditures, generated approximately $18.6 million. In 2006, SRI estimated combined tournament and golf association expenditures of $19.0 million (or $21.1 million in 2012 dollars when adjusted for inflation). The decrease in combined expenditures is due to the fact that Massachusetts hosted two championship events in 2006 the Deutsche Bank Championship and the Bank of America Championship, a Champions Tour event but only one in Massachusetts Major Tournaments & Association Revenues in 2012 ($ millions) TOTAL $18.6 Charitable Giving Massachusetts golf industry makes substantial contributions to a variety of charities. At the championship level, the Deutsche Bank Championship has raised more than $24 million for the Tiger Woods Foundation and local New England- area charities since its inception in Also significant are a number of nonprofit organizations that leverage charitable golf events to raise money for cancer care and research and for need- based scholarships. In 2012, the Francis Ouimet Scholarship Fund provided $1.5 million in scholarships to awardees who have been caddies, or held jobs in golf professional or course superintendent operations at any golf course in Massachusetts, and demonstrated financial need. 6 The Jimmy Fund Golf Program raised $6.4 million for adult and pediatric cancer care and research in 2012 on behalf of the Dana- Farber Cancer Institute through the various charitable golf events it organizes. 7 Golf Fights Cancer is another nonprofit organization that raises funds for cancer- related charities and research organizations and raised nearly $350,000 in When totaled across all facilities, charitable golf events organized at the local level also generate significant contributions for charitable causes across Massachusetts. A few examples include the Caron- Wood Charity Golf Classic, which raised over $100,000 to support junior golfers from Cape Cod and the Islands; the Hole in the Wall Gang Camp for children with serious illnesses, founded by Paul Newman; 4 Bank of America ended its sponsorship of this Champions Tour event in 2008 following the financial crisis of Tiger Woods Foundation, About the Championship, Accessed April 1, Francis Ouimet Scholarship Fund, 2013 Annual Report, Annual- Report- Online.pdf. Accessed April 2, While Jimmy Fund Golf Program holds charitable golf events throughout the New England region, an estimated 90 percent of monies raised are in Massachusetts. 10
15 and other charities. 8 The NAIOP Massachusetts (Commercial Real Estate Development Association) 24 th Annual Charitable Golf Tournament raised $151,500 to support Heading Home s programs to end homelessness. The tournament was hosted by Stow Acres Country Club and Butternut Farm Golf Club. 9 Par 4 Technology Group organized a charity golf tournament hosted by Andover Country Club that raised $40,000 for a scholarship fund to benefit young men and women at the Lawrence Boys and Girls Club. 10 Every year, Massachusetts golf clubs host a number of charitable events like these. Golf course owners, operators, and golf professionals are happy to serve as access points for annual fundraising by local service organizations. In total, SRI estimates that the amount of charitable giving attributed to the game of golf in Massachusetts was $74.3 million in Massachusetts Golf Industry s Charitable Giving in 2012 ($ millions) TOTAL $74.3 B. ENABLED INDUSTRIES Real Estate Real estate developers use amenities to attract new home buyers, and golf is a key amenity in many parts of the state. The development of new homes in golf communities in Massachusetts followed the rise in the national real estate market, which peaked in 2005 in terms of new home starts, and suffered from the financial crisis and recession of In 2012, Massachusetts s housing market was experiencing some recovery, albeit not to the level of new home construction in A handful of developments had a number of new homes constructed (ranging from 12 to 20 new homes), such as the Residences at Black Rock at the Black Rock Country Club in Hingham; the Turner Hill development in Ipswich; and the Southport development in Mashpee. Examples of other golf community developments with just a few homes constructed in 2012 include: Willowbend at the Willowbend Country Club in Hyannis; the Shining Rock Homes at the Shining Rock Golf Club in Northbridge; and the Ridge Club in Sandwich, among others. New golf- related real estate construction generated $25.5 million in By comparison, in 2006, at the peak of the real estate boom, SRI estimated new golf home construction generated $56.0 million (or 8 Caron- Wood Charity Golf Classic, The 6 th Annual Caron- Wood Charity Golf Classic, Letter from the Tournament Director, content/uploads/2013/03/caron- wood- single- pages.pdf. Accessed April 2, Heading Home Inc. NAIOP Massachusetts 24 th Annual Charitable Golf Tournament, massachusetts- 24th- annual- charitable- golf- tournament. Accessed 18 April Par 4 Technology. Third Annual Charity Golf Tournament, annual- charity- golf- tournament/. Accessed 20 April U.S. Census Bureau (2012). Building Permits Survey: Massachusetts,
16 $62.0 million in 2012 inflation- adjusted dollars). Furthermore, in 2012 there were an estimated 37 golf communities (including properties on golf resorts) in Massachusetts, and SRI estimates the golf premium associated with the sale of real estate in these developments to be $4.7 million, up from $4.3 million (or $4.8 in inflation- adjusted dollars). 12 The premium is the additional amount a buyer is willing to pay for a home or property located on a golf course or within a golf community. Interestingly, although new home construction remains half of what it was in 2006, the sale of existing homes has rebounded to 2006 levels fueled by low mortgage rates, flat home prices, and a strengthening economy. Massachusetts Golf Real Estate Revenues in 2012 ($ millions) Golf- Related Residential Construction $25.5 Realized Golf Premium $4.7 TOTAL $30.2 Note: The sale of existing homes is considered a transfer of assets rather than new economic output, so the golf premium that is realized in the sale of an existing home is not included in the economic impact analysis. Golf- Related Hospitality/Tourism Across the country, golf has enjoyed increasing popularity among travelers, whether it is the primary motivation for a trip or is connected to other recreational time spent with friends, family, or business colleagues. In Massachusetts, golf is a sizeable tourism segment, alongside key traveler activities such as shopping and dining, visiting beaches, and sightseeing. Massachusetts golf courses and resorts help the state attract conferences and business meetings, and both amateur and professional golf tournaments draw people to courses in different parts of the state. The Massachusetts tourism website features the state s golf courses among the many outdoor activities available in the state ( In 2012, SRI estimates golf- related tourism spending in Massachusetts was $366.7 million. This is based on the following estimates of golf trips and associated expenditures by Massachusetts residents and non- residents: (1) an estimated 264,200 day trips with average golf trip spending of $77 per person and (2) an estimated 469,800 overnight trips (which in Massachusetts average 2.1 nights 13 ) with average trip spending of $737 per person. 14 This represents an increase in real terms relative to golf- related tourism 12 In 2011, the National Association of Realtors revised their existing home sales data to correct for drift, i.e., the variation between the Multiple Listing Service (MLS) data and property deeds data. The result was a significant downward correction in the sale of existing homes and turnover rate. In response, SRI recalculated Massachusetts 2006 golf premium to account for the significant decline in the turnover rate. In the previous study, SRI reported a realized golf premium of $14.0 million, compared to the revised 2006 premium of $4.3 million. 13 Massachusetts Office of Travel & Tourism (March 2013), 2012 Annual Report, content/uploads/2013/11/2012- Annual- Report.pdf. 14 All trips refer to person- trips which simply means the count of the total number of people taking a trip. Therefore, 264,200 day trips should be interpreted as 264,200 people who took a day trip. Trips include people 12
17 spending in 2006, which was $292.4 million (or $323.8 million in 2012 dollars, when adjusted for inflation). The growth in golf- related tourism spending is consistent with the overall growth in domestic visitor spending in Massachusetts, as the economy recovered from the recession of Massachusetts Golf- Related Tourism Expenditures in 2012 # of golf day trips 264,200 Average travel $ per golf day trip $77.11 # of golf overnight trips 469,800 Average travel $ per golf overnight trip $ Total $366.7 million traveling to Massachusetts from out of state, as well as people traveling within the state more than 50 miles from home. 15 Total domestic visitor spending in Massachusetts grew from $12.59 billion in 2006 (or $13.94 billion in 2012 dollars) to $15.41 billion in Source: MOTT/U.S. Travel Association (2009), The Economic Impact of Travel on Massachusetts Counties 2008, content/uploads/2013/ 06/ec_imp_hist08.pdf; and MOTT/U.S. Travel Association (2013), The Economic Impact of Travel on Massachusetts Counties 2012, content/uploads/2013/09/econ- impact- 12.pdf. 13
18 GOLF S ECONOMIC IMPACT IN MASSACHUSETTS Golf s impact on Massachusetts economy includes both the direct effects of economic activity in the core and enabled golf industries, as well as the indirect and induced (or multiplier) effects on other industries in the state economy. In economics, the idea of the multiplier is that changes in the level of economic activity in one industry impacts other industries throughout the economy. For example, a fraction of each dollar spent at a golf course is, in turn, spent by the golf course to purchase goods and services for golf course operation these are indirect effects. In addition, golf course employees spend their disposable income on personal goods and services, and this stimulates economic activity in a myriad of other industries these are induced effects. Therefore, golf s total (direct plus multiplier) economic impact includes both the direct employment and wage income of those employed in golf- related industries, as well as the secondary employment and wages supported in other sectors of the economy through subsequent purchases of goods and services by golf industry businesses and employees. In 2012, the $1.7 billion Massachusetts golf industry supported: A total economic impact of $2.7 billion for the state of Massachusetts including the indirect and induced economic impacts stimulated by golf sector activity; A total employment impact of over 25,000 jobs; and Total wage income of $796.8 million. 14
19 INDUSTRY Golf Facility Operations Golf Course Capital Investments* Golf- Related Supplies Tournaments & Associations Golf s Impact on Massachusetts Economy in 2012 DIRECT ($ millions) INDIRECT INDUCED TOTAL OUTPUT ($ millions) TOTAL JOBS TOTAL WAGE INCOME ($ millions) $793.2 $1, ,164 $355.2 $66.9 $ $2.5 $461.9 $ ,863 $245.5 $18.6 $ $10.3 Real Estate ** $30.2 $ $17.1 Hospitality/Tourism $366.7 $ ,803 $166.3 TOTAL $1,737.5 $2, ,481 $769.8 Note: Columns may not sum due to rounding. To calculate golf s total economic impact, SRI subtracted from the direct golf economy impact of $1.7 billion the portion of capital investments that is investment in existing facilities ($63.2 million of $66.9 million) and the portion of real estate that is the realized golf premium associated with the sale of real estate in existing developments ($4.7 million of $30.2 million). This is because: *Golf Course Capital Investments Only new course construction has an indirect and induced economic impact. Other types of facility capital investments are typically financed through facility revenues and, therefore, are omitted to avoid double- counting. **Real Estate Only golf residential construction has an indirect and induced impact. The golf premium associated with golf real estate is considered a transfer of assets rather than new economic activity. 15
20 The following table compares changes in the golf industry s direct and total economic impact on the Massachusetts economy in 2006 and In 2006, the golf economy was $1.61 billion buoyed by strong golf facility operations and golf supply production. In 2012, the direct golf economy expanded to $1.74 billion due primarily to significant growth in golf facilities operations and the hospitality/tourism sectors. The golf supply production in the state contracted 12.6 percent over the period. The table shows this dichotomy, where direct economic impact has grown, but total golf output, employment, and wages, have declined. Golf s Impact on Massachusetts Economy in 2012 and 2006 ($ billions) Core and Enabled Industries Direct Economic Impact ($) $1.738 $1.610 Total Output Impact ($) $2.711 $3.260 Total Jobs Impact 25,481 31,685 Total Wage Income Impact ($) $0.797 $
21 DETAILED METHODOLOGY & DATA SOURCES A key challenge in this study was to identify reliable state- level data sources and to develop methodologies for measuring the size of industry components for which cross- state estimates do not exist in straightforward metrics, e.g., golf real estate and off- course purchases of golf apparel and equipment. This section describes each of the core and enabled industries included in the golf economy and SRI s approach to measuring each of these segments. A. GOLF FACILITY OPERATIONS For this industry segment, we analyzed the number of golf facilities and average facility revenue data to derive a total facility operations estimate. Revenues for this segment include: annual or monthly membership fees, green fees, range fees, and golf car rental fees; purchases of golf apparel and equipment in pro shops; golf lessons; tournament entry fees; consumption of food and beverages; etc. Number of golf course facilities. Many golf organizations track the number of golf facilities in a state: the National Golf Foundation (NGF), The PGA of America, and state/regional golf associations, among others. The U.S. Census Bureau also surveys golf facilities as business establishments in its Economic Census every five years. However, these organizations calculations of the total numbers of golf facilities in each state, by type of facility, are not always consistent with each other due to: (1) absence of data for courses which are not members (e.g., The PGA tracks those courses with a PGA member) or for particular subsets of courses (e.g., municipal facilities and golf resorts are not tracked by the Census), (2) facility closures and openings, and (3) inconsistency in the classification of courses, especially resorts. In some surveys, golf facilities are allowed to self- classify. In others, the surveying organization classifies the facility based on specific criteria. This can mean the difference between a small number of resorts (e.g., a figure that includes five- star accommodation located on or adjacent to an 18- hole course) or a much larger number of resorts (e.g., three- star hotel accommodation located near a daily fee golf course). Similarly, a resort with two 18- hole golf courses could be counted as two golf facilities or as one depending on the reporting organization. Fortunately, the variations in the number of facilities caused by these data collection methods are very small, and thus do not materially impact the overall analysis. The table below presents slightly differing estimates for the number of golf course facilities in Massachusetts in 2012 or the latest available year. 17
22 Estimates of Massachusetts Golf Facilities from Various Sources in 2007 and Economic Census (excludes resorts & municipal facilities) PGA (# of facilities) Massachusetts Golf Alliance 2012 NGF (# of facilities) NGF (# of 18- hole equivalent courses) 3 PRIVATE PUBLIC Daily fee/ semi- private * Municipal * Military University RESORT TOTAL Sources: 1 U.S. Census Bureau, 2007 Economic Census. 2 Professional Golfers Association of America (2013). Facility Database. 3 NGF (2013). Total Facility Supply Tables 6-14, Golf Facilities in the U.S., 2013 edition, pp Note: * Calculated by SRI based on PGA breakdown of daily fee/semi- privates versus municipal/military/university facilities. The PGA of America and NGF data fall within a fairly narrow range, PGA s 379 vs. NGF s 376, while the MA Golf Alliance facilities estimate was lower at 346. After analysis of the different golf facility numbers and in an effort to maintain consistency with the previous study, SRI used NGF s facility numbers as the basis for our assessment. The data indicate a slight increase in total facilities from 2006 (375 facilities) to 2012 (376 facilities, comprised of 123 private facilities, 249 public facilities, and 4 golf resorts). SRI used the PGA s breakdown by type of facility to estimate the proportion of NGF reported public facilities that are daily fee/semi- private versus municipal/military/university facilities. These calculated estimates are 192 daily fee/semi- private facilities and 57 municipal/military/university facilities. Average revenues per facility. The SRI team collected average revenue data from a variety of sources. Here again, the data challenge was that average facility revenues will vary significantly depending on: (1) the number of holes (e.g., a 9- hole course versus a 18- hole course) and (2) the type of facility whether a golf course facility is private, daily fee, resort, municipal, etc. The U.S. Census Bureau collects revenue data for golf course facilities as part of its Economic Census of all U.S. establishments every five years. Whereas facility surveys conducted by private sector 18
23 organizations are often based on lower response rates (less than 30 percent), all establishments are required by law to respond to the Census Bureau survey. However, the Census Bureau data has several limitations. Many types of facilities are not included in the survey: (1) resort facilities, (2) municipal and military facilities, (3) stand- alone driving ranges, and (4) golf facilities without payroll. The latest 2007 Economic Census contains revenue, payroll, and employment data on 12,193 golf facilities broken down by state. This provides a robust estimate with which to compare other available golf facility revenue data. The PGA collects revenue data for all 50 states on an annual basis through its Annual Operations Survey. The latest available data are from 2012, but the PGA has annual data going back to In addition, PGA revenue data are broken down by type of facility for categories for which Census data are not available namely, resorts, municipal courses, and military courses. Reported Massachusetts Golf Facility Average Revenue by Type of Facility, to 2012 Census PGA (2005- PGA PGA PGA NGF (2007) 1 06 avg) 2 (2010) 3 (2011) 4 (2012) 5 (2009) 6 Private facility $3,128,344 $2,365,563 $2,641,454 $2,955,015 $3,195,500 $3,277,000 Daily fee facility $1,402,830 $1,506,738 $1,647,888 $2,347,353 $1,838,480 $1,457,700 Resort facility X X X $2,000,000 X X Municipal/military/univ ersity facility X $1,467,909 $1,425,536 $1,102,553 $1,428,169 $1,269,100 Driving range X X X $400,000 X X Miniature golf $243,237 X X X X X Note: Bolded values are an average of Massachusetts and neighboring states, due to low response sample. Sources: 1 U.S. Census Bureau, 2007 Economic Census. 2 Professional Golfers Association of America (2006,2007) Operations Survey and 2006 Operations Survey. 3 Professional Golfers Association of America (2011) Operations Survey. 4 Professional Golfers Association of America (2012) Operations Survey. 5 Professional Golfers Association of America (2013) Operations Survey. 6 NGF (2010). Operating & Financial Performance Profiles of 18- hole Golf Facilities in the U.S., 2009 edition. Average revenue data from the Census (2007) and The PGA ( ) are presented above. After review of reported average revenue data and in consultation with the task force, SRI calculated total facility revenue for traditional facilities using the 2012 PGA survey data. Driving range revenues were calculated using 2011 PGA survey data, which estimated the national median revenue figure for golf ranges in 2011, and average miniature golf facility revenue was calculated using the 2007 Census data adjusted for inflation. Although a more recent Economic Census was conducted in 2012, this data has not been publicly released at the state level yet. 19
24 The PGA s 2012 Operations Survey reported average private facility revenue of $3.196 million, up significantly from SRI s calculated average in 2006 ($2.366 million, or $ million in inflation- adjusted 2012 dollars). 16 In 2012, the PGA reported average daily fee revenue of $1.838 million. This also represents an increase from SRI s calculated average in 2006 ($1.507 million, or $1.669 million in inflation- adjusted 2012 dollars). The PGA reported $1.428 million for average municipal/military/university facility revenue in 2012, a decline from SRI s calculated average in 2006 ($1.468 million, or $1.626 million in inflation- adjusted 2012 dollars). The only reported average revenue for Massachusetts resort facilities from 2009 to 2012 from the PGA was $2.0 million in 2011, and that estimate was based on a regional average because of low sample size. Consequently, SRI used the PGA s 2012 average private facility revenue as a proxy for resort revenues. The PGA reported a median value for standalone golf range revenue of $400,000 in SRI use the 2011 PGA average golf range revenue adjusted for inflation, or $406,988. SRI used the latest available average revenue data for miniature golf facilities (2007) and adjusted for inflation. To calculate golf facility operations revenues, SRI subtracted average on- course merchandise sales from the average golf facility revenue estimates because on- course merchandise sales are included in the Golf- Related Supplies industry segment. SRI then multiplied these adjusted average golf facility operations revenue estimates by the respective number of golf facilities. Overall, SRI estimates that Massachusetts s 376 golf courses, 53 stand- alone ranges, and 38 miniature golf facilities generated $793.2 billion of revenue in This reflects a real increase since 2006, when facility operations revenue totaled $649.4 million for the 375 facilities (or $719.1 million in 2012 dollars when adjusted for inflation). This increase in facility operations revenue from 2006 to 2012 is driven by higher reported average revenue for private and daily fee facilities in 2012 compared to B. GOLF FACILITY CAPITAL INVESTMENT To calculate golf facility capital investments, SRI collected data on two major types of investments: (1) capital investment at existing facilities and (2) new course construction. Massachusetts Golf Facility Capital Investment and New Course Construction in 2012 ($ millions) Golf Facility Capital Investment 1 $63.2 New Course Construction $3.7 TOTAL $66.9 Note: 1 Only the New Course Construction category is included in the economic impact analysis, because it represents new economic output or activity. Golf facility capital investments are typically financed through golf facility revenues, so including both Golf Facility Capital Investments and Golf Facility Operations in economic impact analysis would result in double counting. 16 In the previous 2006 study, SRI took an average of the PGA 2005 and 2006 reported average revenue figures, because of some large divergences in the reported average data. 20
25 Investment at existing facilities. Golf facility capital investments include improvements to greens and tees, repaving of cart paths, purchases of new turf maintenance equipment and irrigations systems, and renovations of the clubhouse, pro shop, and maintenance buildings. Ordinary maintenance expenses are not included. SRI examined golf facility capital investment data from two sources: NGF and the GCSAA. The GCSAA data comes from golf facility capital budget questions included in its 2011 Compensation Survey. The data is state- level and includes the mean, median, and standard deviation of capital expenditures (not maintenance expenses). The NGF s 2010 Operating and Financial Performance Profile presents national estimates of capital expenditures (and also breaks out maintenance expenses separately) at: (1) daily fee facilities (average revenue of $1,457,700, with 69.6% of daily fee facilities making average capital improvement investments of $131,700); (2) municipal facilities (average revenues of $1,269,100, with 70.2% of municipal facilities making average capital investments of $189,300); and (3) private facilities (average revenues of $3,277,000, with 82% of private facilities making capital investments of $410,400). After review of both the state- level and national data sets, SRI used the GCSAA s data for Massachusetts in our capital investment calculations. The data indicate that, on average, a Massachusetts golf facility invested approximately $132,196 for a total capital investment across all golf facilities of $49.7 million. In addition, SRI added the estimate of major renovation projects ($13.5 million) to its estimate for golf course capital investment in Massachusetts in 2012, resulting in a total of $63.2 million. Capital investments at existing facilities increased relative to 2006, when Massachusetts s total golf facility capital investment was $44.5 million (or $49.3 million in 2012 dollars when adjusted for inflation). New course construction. The NGF s Golf Facilities in the U.S. series is the only national source for estimates of the number of new golf courses under construction in each state. In 2012, NGF estimated that there was one new 18- hole equivalent golf course openings in Massachusetts and that 0.5 were under construction. An estimate for the average investment for each new golf course in Massachusetts is derived from the Golf Course Builders Association of America s (GCBAA) Golf Course Construction and Renovation Costing Guide, Version 6. This database of golf course construction costs is based on a survey of golf course builders around the country. Using the values provided for Massachusetts and the average ( normal ) costs for each of the various construction categories (see box below), GCBAA estimates the average investment required to build a new golf course in Massachusetts is $7.3 million (the average estimate across the various regions of Massachusetts). However, according to golf course architecture and design consultants, golf course construction alone accounts for only a portion of the total cost of constructing a new golf facility. An equal amount is spent on architectural/engineering services, construction of the clubhouse, pro shop, and maintenance buildings, and initial purchase of equipment and course amenities, etc. Therefore, we estimate the average cost of constructing a new 18- hole facility to be $14.7 million. 21
26 Mobilization Layout and Staking Erosion Control Clearing Selective Clearing Topsoil Excavation Rough Shaping Drainage Irrigation Required Investments to Build a Golf Course: Greens Construction Tees Bunkers Bridges Bulkheading Cart Paths Fine Grading Seeding and/or Grassing This investment, however, is not entirely expended over one year but is disbursed over several years. Assuming the average course takes approximately two years to complete, we estimate the average investment in construction per 18- hole equivalent course per year was $7.4 million. We applied this figure to the hole equivalent courses under construction in In total, SRI estimates that 2012 investment in new course construction in Massachusetts was $3.7 million. Reflecting the impact of the financial crisis and recession, this is a significantly lower level of investment relative to 2006, when the estimated total investment in new course construction was $16.0 million (or $17.8 million in 2012 dollars when adjusted for inflation). C. GOLF- RELATED SUPPLIES This section explains SRI s methodology for calculating Massachusetts manufacturers exports (out- of- state and overseas shipments) of golf apparel, turf maintenance equipment, and accessories. We also detail our methodology for calculating the retail margin for on- course and off- course purchases of golf equipment, golf apparel, and golf media. Manufacturing Exports. The economic value created by golf- related supplies consists of two components: (1) design, testing, and value- added production and (2) retail sales margin. On the manufacturing side, we are concerned with the value- added production of golf- related equipment, apparel, and accessories. This is the value of the company s wholesale revenues minus the cost of production inputs, and this value- added production is attributable to the state in which the golf club or golf mower is manufactured. We began by conducting research to identify manufacturers of golf- related products in the state. Massachusetts is home to a handful of golf- related companies: Acushnet, parent company of the Titleist brand of golf equipment and apparel; Callaway Golf (which formerly owned Top- Flite and still manufactures Callaway Golf balls in Chicopee); New Balance Golf, which is introducing a new line of golf shoes; Ahead, which designs and embroiders golf caps; Etonic, which designs and manufacturers golf shoes; Champ Spikes; and custom putter manufacturers; among others. We 22
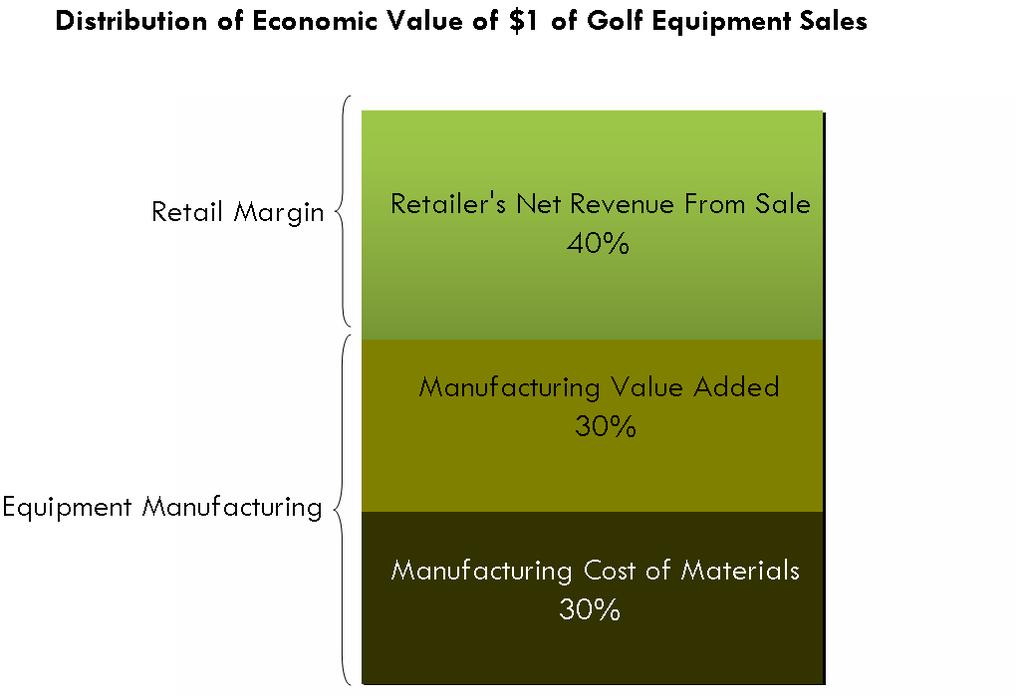
27 estimated the value- added shipment of these companies products out- of- state to be $425.7 million in Massachusetts Manufacturers Value- Added Exports of Golf- Related Products in 2012 ($ millions) TOTAL $425.7 Retail Margin. On the retail side, the economic value is derived from the margin the retailer makes from the sale of the golf club, i.e., the net revenues accruing to retailers after covering the cost of purchasing the golf equipment or apparel from the wholesaler/producer. To calculate this margin, we first estimate total sales of golf apparel and equipment at the state level and then apply the requisite retail margin percentage for economic impact analysis. In our national- level study for GOLF 20/20, SRI was able to collect national sales data from a number of sources: (1) the NGF, (2) the National Sporting Goods Association (NSGA), (3) Golf Datatech, and (4) the Census Bureau. Unfortunately, the relatively small sample size for the majority of these surveys do not allow for publication of reliable state- level estimates by these organizations. However, each year, the NSGA conducts a 100,000- household consumer panel survey for its annual The Sporting Goods Market publication. SRI uses these data in conjunction with the PGA s golf facilities data for each state to derive state- level estimates of golf equipment and apparel sales. For example, in 2012, NSGA reported total U.S. off- course and on- course purchases of individual golf clubs to be $637.8 million. The NSGA survey found the New England region accounted for 4.9% of these purchases, or $31.8 million. Within the New England region, one can estimate Massachusetts s share of purchases by creating a rounds- or courses- based weight. Using either approach yields similar weights, since the number of rounds played is highly correlated with the number of 18- hole equivalent courses in a state (r=0.93). SRI used the number of 18- hole equivalent courses in each state, as it was easier to verify than estimated number of rounds played. Massachusetts represents 40.8% of total 18- hole equivalent courses in the New England region, so this weight was applied to the region total ($31.8 million) to estimate $13.0 million of individual golf club sales in the state of Massachusetts in Further, retail margins on final sales suggest that 40.4%, or $5.2 million, of total sales was retained in the Massachusetts economy. (See graphic below.) 23
28 24
THE MASSACHUSETTS GOLF ECONOMY
 THE MASSACHUSETTS GOLF ECONOMY REPORT This report was commissioned by GOLF 20/20 for the Alliance of Massachusetts Golf Organizations, and prepared by SRI International. The Massachusetts Golf Economy
THE WASHINGTON GOLF ECONOMY
 THE WASHINGTON GOLF ECONOMY FULL REPORT This report was commissioned by GOLF 20/20 for the Golf Alliance of Washington and prepared by SRI International The Washington Golf Economy Published January 2017
The Minnesota Golf Economy Published October 2007 through an agreement with
 The Minnesota Golf Economy 2006 Published October 2007 through an agreement with THE MINNESOTA GOLF ECONOMY 2006 CONTENTS I. STUDY OVERVIEW... 1 II. ANALYTICAL FRAMEWORK... 2 A. Golf Industry Cluster Definition...
THE TEXAS GOLF ECONOMY REPORT
 THE TEXAS GOLF ECONOMY REPORT This report was commissioned by GOLF 20/20 for the Texas Golf Alliance, and prepared by SRI International. The Texas Golf Economy Published April 2008 through an agreement
THE CONNECTICUT GOLF ECONOMY
 THE CONNECTICUT GOLF ECONOMY FULL REPORT This report was commissioned by GOLF 20/20 for the Connecticut Golf Alliance and prepared by SRI International. The Connecticut Golf Economy Published May 2010
THE VIRGINIA GOLF ECONOMY
 THE VIRGINIA GOLF ECONOMY FULL REPORT PUB This report was commissioned by GOLF 20/20 for the Virginia Golf Council and prepared by SRI International The Virginia Golf Economy Published January 2014 through
THE CALIFORNIA GOLF ECONOMY REPORT
 THE CALIFORNIA GOLF ECONOMY REPORT This report was commissioned by GOLF 20/20 for the California Alliance for Golf, and prepared by SRI International. The California Golf Economy Published July 2008 through
The Iowa Golf Economy Published July 2007 through an agreement with
 The Iowa Golf Economy 2006 Published July 2007 through an agreement with THE IOWA GOLF ECONOMY 2006 CONTENTS I. STUDY OVERVIEW... 1 II. ANALYTICAL FRAMEWORK... 2 A. Golf Industry Cluster Definition...
THE FLORIDA GOLF ECONOMY
 THE FLORIDA GOLF ECONOMY FULL REPORT This report was commissioned by GOLF 20/20 for the Florida Golf Impact Task Force, and prepared by SRI International. The Florida Golf Economy Published August 2009
THE ECONOMIC IMPACT OF NORTH CAROLINA GOLF
 THE ECONOMIC IMPACT OF NORTH CAROLINA GOLF Acknowledgements This report was prepared by TEConomy Partners, LLC in agreement with GOLF 20/20, the Carolinas Golf Association, the Carolinas Section of The
THE ECONOMIC IMPACT OF MINNESOTA GOLF
 THE ECONOMIC IMPACT OF MINNESOTA GOLF Acknowledgements This report was prepared by TEConomy Partners, LLC in agreement with GOLF 20/20, the Minnesota Golf Association, the Minnesota Section of The PGA
THE 2016 U.S. GOLF ECONOMY REPORT
 THE 2016 U.S. GOLF ECONOMY REPORT Acknowledgements This report was prepared by TEConomy Partners, LLC, in agreement with GOLF 20/20. Support for this report comes from the following allied national golf
A study prepared for: Presented by:
 Economic Impact of the Coachella Valley Golf Industry A study prepared for: Presented by: Acknowledgements The Hi-Lo Desert Golf Course Superintendents Association would like to acknowledge the California
The Economic Impact of Golf In South Carolina
 The Economic Impact of Golf In South Carolina By Dudley Jackson Research Director South Carolina Department of Parks, Recreation and Tourism For South Carolina Golf Course Owners Association April 2016
COOPERATIVE EXTENSION Bringing the University to You
 COOPERATIVE EXTENSION Bringing the University to You Special Publication - 06-16 ECONOMIC IMPACT OF TOURISM ON COLORADO RIVER COMMUNITIES INCLUDING: LAUGHLIN BULLHEAD CITY FORT MOHAVE MOHAVE VALLEY GOLDEN
THE ECONOMIC CONTRIBUTION FROM HORSES
 THE ECONOMIC CONTRIBUTION FROM HORSES ECONOMIC CONTRIBUTION FROM HORSES HIGHLIGHTS The horse industry contributes more than $19 billion annually to the Canadian economy On-farm activities with horses generate
Designed by Danielle Hinkley-Abba, SRI International
 Designed by Danielle Hinkley-Abba, SRI International Contents A. Study Overview... 1 B. Analytical Framework... 1 C. Size of Virginia s Golf Economy... 2 Core Industries... 3 Enabled Industries... 6 D.
ST. JOHNS GOLF CLUB PHASE II FINDINGS, PHASE III RECOMMENDATION, AND POTENTIAL PARTNERSHIP OPPORTUNITY
 ST. JOHNS GOLF CLUB PHASE II FINDINGS, PHASE III RECOMMENDATION, AND POTENTIAL PARTNERSHIP OPPORTUNITY Board of County Commissioners January 16, 2018 Introduction St. Johns Golf Club: Opened in 1989.
The Value of Golf to Europe, Middle East and Africa
 GOLF ADVISORY PRACTICE IN EMA The Value of Golf to, Middle East and Africa A Study on the Golf Economy ADVISORY 2 The Value of Golf to, Middle East and Africa This study is supported and endorsed by the
The University of Georgia
 The University of Georgia Center for Agribusiness and Economic Development College of Agricultural and Environmental Sciences Economic Impacts of Alabama Quail Hunting Prepared by: Archie Flanders and
Big Blue Adventure Event Analysis UTC Tourism Center October 2016
 A report summarizing Big Blue Adventure events economic impact on the Lake Tahoe region as well as participants assessments of their event experience Big Blue Adventure Event Analysis UTC Tourism Center
Independent Economic Analysis Board. Review of the Estimated Economic Impacts of Salmon Fishing in Idaho. Task Number 99
 IEAB Independent Economic Analysis Board Roger Mann, Chair Noelwah R. Netusil, Vice-Chair Kenneth L. Casavant Daniel D. Huppert Joel R. Hamilton Lon L. Peters Susan S. Hanna Hans Radtke Review of the Estimated
Agenda Report PARK, RECREATION & OPEN SPACE COMMISSION ARTS, RECREATION & COMMUNITY SERVICES DEPARTMENT
 Agenda Item No. 4b DATE: FEBRUARY 8, 2010 Agenda Report TO: FROM: PARK, RECREATION & OPEN SPACE COMMISSION ARTS, RECREATION & COMMUNITY SERVICES DEPARTMENT SUBJECT: BOUNDARY OAK GOLF COURSE STATUS REPORT
Golfers in Colorado: The Role of Golf in Recreational and Tourism Lifestyles and Expenditures
 Golfers in Colorado: The Role of Golf in Recreational and Tourism Lifestyles and Expenditures by Josh Wilson, Phil Watson, Dawn Thilmany and Steve Davies Graduate Research Assistants, Associate Professor
OHRIA Ontario Horse Racing Industry Association
 OHRIA Ontario Horse Racing Industry Association P.O. Box 456, Stn. B, Toronto, ON M9W 5L4 Tel: 416-679-0741 Fax: 416-679-9114 Email: ohria@ohria.com Submission to the Standing Committee of Finance and
The Economic Impact of Colonial Downs in Virginia
 The Economic Impact of Colonial Downs in Virginia Prepared for Revolutionary Racing January 31, 2018 1309 E Cary Street, Richmond, VA 23219 1025 Huron Road East, Cleveland, OH 44115 chmuraecon.com Table
Economic Impact Analysis BOONE DOCKS RESORT AND MARINA, LLC
 Economic Impact Analysis BOONE DOCKS RESORT AND MARINA, LLC Analysis conducted using the on-line Boating Economic Impact Model developed by Drs. Ed Mahoney (mahoneye@msu.edu), Dan Stynes (stynes@msu.edu)
Bob Costello Chief Economist & Vice President American Trucking Associations. Economic & Motor Carrier Industry Trends. September 10, 2013
 Bob Costello Chief Economist & Vice President American Trucking Associations Economic & Motor Carrier Industry Trends September 10, 2013 The Freight Economy Washington continues to be a headwind on economic
Texas Housing Markets: Metropolitan vs. Border Communities. September 22, 2014
 Texas Housing Markets: Metropolitan vs. Border Communities Luis Bernardo Torres Ruiz, Ph.D. Research Economist El Paso Branch Dallas Federal Rio Grande Economic Association September 22, 2014 Contents
The 2010 Economic Contribution of Tourism to the Meadowlands Liberty Region
 The 2010 Economic Contribution of Tourism to the Meadowlands Liberty Region Key Metrics & Evaluation 93 MAIN STREET :: ANNAPOLIS, MD 21401 WWW.VANTAGESTRATEGY.COM :: 202-449- 9708 1 Vantage Strategy ::.
Tax Fairness for the Golf Industry
 Tax Fairness for the Golf Industry Our Request for Tax Fairness Canada s golf industry generates more than $14 billion in Gross Domestic Product each year and employs over 300,000 Canadians throughout
Annual Report. U.S. Cellular Community Park. Economic Impact Analysis Annual Statistics 2017 Highlights 2018 Event Schedule
 U.S. Cellular Community Park Annual Report 2017 Medford Parks & Recreation Department Economic Impact Analysis Annual Statistics 2017 Highlights 2018 Event Schedule USCCP This Year: Generated $10.7 million
Economic Contribution of the 2018 Recreational Red Snapper Season in the South Atlantic
 Economic Contribution of the 2018 Recreational Red Snapper Season in the South Atlantic Produced for the: American Sportfishing Association (ASA) PO Box 6435 Fernandina Beach, FL 32035 Office (904) 277-9765
Candidate Personal Profile GOLF COURSE SUPERINTENDENT
 PLEASE SEND COMPLETED FORM WITH RESUME AND COVER LETTER TO: newsubmissions@denehyctp.com Candidate Personal Profile GOLF COURSE SUPERINTENDENT Personal Information Name: First Middle Last Address: Street
The 2001 Economic Benefits of Hunting, Fishing and Wildlife Watching in MISSOURI. Prepared by:
 The 2001 Economic Benefits of Hunting, Fishing and Wildlife Watching in MISSOURI Prepared by: Southwick Associates, Inc. PO Box 6435 Fernandina Beach, FL 32035 Ph (904) 277-9765 Fax (904) 261-1145 Email:
U.S. Commercial Swimming Pool Market Year Ending 2015
 U.S. Commercial Swimming Pool Market Year Ending 2015 1 p a g e YE 2015 U.S. Commercial Swimming Pool Report 2016, P.K. Data, Inc. About Pkdata Pkdata is a market research firm that has tracked the swimming
Hunter and Angler Expenditures, Characteristics, and Economic Effects, North Dakota,
 Agribusiness and Applied Economics Report No. 507-S January 2003 Hunter and Angler Expenditures, Characteristics, and Economic Effects, North Dakota, 2001-2002 Dean A. Bangsund and F. Larry Leistritz*
The Economic Benefits of Hunting and Fishing Activities in Alberta in 2008
 The Economic Benefits of Hunting and Fishing Activities in Alberta in 2008 Submitted to Hunting For Tomorrow Foundation Submitted by May, 2009 Introduction Hunting and Fishing related expenditures by Alberta
5. Golf Industry Trends and Developments in the US 6. The US Macro Economy Factors and Impact over Golf Industry
 TABLE OF CONTENTS 1. Golf Industry Performance Worldwide 1.1. Overview 1.2. Global Golf Equipment Demand and Economy 2. The US Golf Industry Overview 2.1. Industry Segmentation 3. Industry Performance
Golf Industry Report 2018 EDITION HOLE 10, THE BEAR S CLUB, JUPITER, FLORIDA
 Golf Industry Report 2018 EDITION HOLE 10, THE BEAR S CLUB, JUPITER, FLORIDA Definitions PARTICIPATION GOLFERS (ON-COURSE GOLFERS): Individuals ages 6 and above who played at least one round of golf on
Agenda Report. Brookside Golf Club Operations and Master Plan Update
 Agenda Report I I I To: SUBJECT: RECOMMENDATION: 1 City Council Through Ed Tech Rose Bowl Operating Company May 7,2008 Brookside Golf Club Operations and Master Plan Update This is an information item
Final Report, October 19, Socioeconomic characteristics of reef users
 Socioeconomic Study of Reefs in Southeast Florida - Executive Summary By Hazen and Sawyer in association with Florida State University and National Oceanic and Atmospheric Administration, October 19, 2001
The 2006 Economic Benefits of Hunting, Fishing and Wildlife Watching in TEXAS. Prepared by:
 The 2006 Economic Benefits of Hunting, Fishing and Wildlife Watching in TEXAS Prepared by: Southwick Associates, Inc. P.O. Box 6435 Fernandina Beach, FL 32035 Ph (904) 277-9765 Fax (904) 261-1145 Email:
ECONOMIC SIGNIFICANCE OF MIDDLE FORK OF THE SALMON FLOATER SPENDING ON LOCAL ECONOMIES
 ECONOMIC SIGNIFICANCE OF MIDDLE FORK OF THE SALMON FLOATER SPENDING ON LOCAL ECONOMIES Chris Neher Resource Economist April 2016 INTRODUCTION The Middle Fork of the Salmon River is world renown for offering
T he golf boom took the industry by surprise. From a sport generally reserved for the elite, it became every man's game. And the industry suddenly
 T he golf boom took the industry by surprise. From a sport generally reserved for the elite, it became every man's game. And the industry suddenly found itself adding its expenditures and sales in the
Economy On The Rebound
 Economy On The Rebound Robert Johnson Associate Director of Economic Analysis November 17, 2009 robert.johnson@morningstar.com (312) 696-6103 2009, Morningstar, Inc. All rights reserved. Executive
Contents. Preface Contents Legal Declaration Document Sources Definitions and Interpretations Overview...
 Contents Preface... 2 Contents... 3 Legal Declaration... 11 Document Sources... 12 Definitions and Interpretations... 13 Overview... 17 Facilities... 19 Chapter I Status of Development and Operation of
The Economic Impact of Recreational Fishing in the Everglades Region
 The Economic Impact of Recreational Fishing in the Everglades Region Prepared for: The Everglades Foundation Prepared by: Tony Fedler, Ph.D. For the Bonefish and Tarpon Trust December 2009 Table of Contents
The Power of Outdoor Recreation Spending in Pennsylvania:
 The Power of Outdoor Recreation Spending in Pennsylvania: How hunting, fishing, and outdoor activities help support a healthy state economy November, 2018 Prepared for the Theodore Roosevelt Conservation
Economic Impact of the Michigan Equine Industry, 2006
 Economic Impact of the Michigan Equine Industry, 2006 Summary Animals and operations 155,000 equine animals housed in Michigan on June 1, 2007-86,000 at private residences - 21,000 at breeding farms -
Economic Profile of the Ontario Turfgrass Industry 1
 Economic Profile of the Ontario Turfgrass Industry 1 Submitted by Kate Tsiplova 2, Glenn Fox 2, Katerina Jordan 3, Eric Lyons 3 December 19, 2008 Funded by Ontario Turfgrass Research Foundation 1 We gratefully
Northern California Golf Association & Poppy Holding, Inc. Five Year Strategic Plan June 1, 2007 December 31, 2011
 Northern California Golf Association & Poppy Holding, Inc. Five Year Strategic Plan June 1, 2007 December 31, 2011 MISSION NCGA - To support and promote the game of golf in Northern California and to enhance
Greenway Golf Lease Amendment. City Council February 20, 2018
 Greenway Golf Lease Amendment City Council February 20, 2018 Background July 2012 Council approved a 25-year lease with Greenway Golf 2013-2014 - Driving Range and Par 3 Course renovations complete. 2014-present
Economic Analysis of the Saratoga Race Course
 Economic Analysis of the Saratoga Race Course Prepared By: HR&A Advisors, Inc. 99 Hudson Street, Third Floor New York NY 10013 Prepared for: Saratoga County Industrial Development Agency October 2011 Economic
The 2006 Economic Benefits of Hunting, Fishing and Wildlife Watching in NORTH CAROLINA. Prepared by:
 The 2006 Economic Benefits of Hunting, Fishing and Wildlife Watching in NORTH CAROLINA Prepared by: Southwick Associates, Inc. P.O. Box 6435 Fernandina Beach, FL 32035 Ph (904) 277-9765 Fax (904) 261-1145
Annual Report. U.S. Cellular Community Park. Economic Impact Analysis Annual Statistics 2016 Highlights 2017 Event Schedule
 U.S. Cellular Community Park Annual Report Medford Parks & Recreation Department 2016 Economic Impact Analysis Annual Statistics 2016 Highlights 2017 Event Schedule U.S. Cellular Community Park 2016 Highlights
What did the World Student Games do for Sheffield? The 1991 Games as the catalyst for the regeneration of Sheffield
 What did the World Student Games do for Sheffield? The 1991 Games as the catalyst for the regeneration of Sheffield Peter Taylor Emeritus Professor Sheffield Hallam University England Why host a major
Future Options for City Operated Golf Courses
 GM24.4 REPORT FOR ACTION Future Options for City Operated Golf Courses Date: December 22, 2017 To: Government Management Committee From: General Manager, Parks Forestry and Recreation and Chief Purchasing
DEMOS AND GOLF HABITS
 445 Hamilton Avenue, Suite 1102 White Plains, NY 10601 work/fax 914.358.3558/3557 www.sportsandleisureresearch.com DEMOS AND GOLF HABITS Both men and women mean of 43 years of age N=650 (75-25%). Men averaged
PNC R1, CBRP Soccer Concession Programming Partner
 PNC2116254R1, CBRP Soccer Concession Programming Partner OUR UNIQUE SOCCER PROJECT THE ONLY SOCCER SCHOOL IN FLORIDA WITH A REAL PLAYER'S DEVELOPEMENT PATH ICEF (IHTERHATIOHAL CENTER OF EUROPEAN FOOTBALL).
Flagler Golf Management, LLC ( FGM ), will negotiate and enter into a 40 year lease agreement for the 34 acre parcel inclusive of the entire property
, will negotiate and enter into a 40 year lease agreement for the 34 acre parcel inclusive of the entire property") Proposal Flagler Golf Management, LLC ( FGM ), will negotiate and enter into a 40 year lease agreement for the 34 acre parcel inclusive of the entire property including all buildings, equipment, fixtures
Proposal Flagler Golf Management, LLC ( FGM ), will negotiate and enter into a 40 year lease agreement for the 34 acre parcel inclusive of the entire property including all buildings, equipment, fixtures
The U.S. Economy How Serious A Downturn? Nigel Gault Group Managing Director North American Macroeconomic Services
 The U.S. Economy How Serious A Downturn? Nigel Gault Group Managing Director North American Macroeconomic Services Growth Is Cooling; But a Soft Landing Is Likely (Real GDP, annualized rate of growth)
2015 Golden Eagle Regional Park Annual Report
 2015 Golden Eagle Regional Park Annual Report City of Sparks Golden Eagle Regional Park The Sports Complex at Golden Eagle Regional Park is a state-of-the-art facility situated on 140 acres in northeast
THE ECONOMIC IMPACT OF RECREATIONAL SALTWATER FISHING ON THE LOUISIANA ECONOMY
 THE ECONOMIC IMPACT OF RECREATIONAL SALTWATER FISHING ON THE LOUISIANA ECONOMY By Loren C. Scott & Associates, Inc. 743 Woodview Court Baton Rouge, LA 70810 225-751-1707 lorencscott@aol.com for The Coastal
UNC Charlotte Belk College of Business Administration. The Sanford Holshouser Business Development Group LLC. Executive Summary
 UNC Charlotte Belk College of Business Administration The Sanford Holshouser Business Development Group LLC Executive Summary The Economic Impacts of the Motorsports Industry on the North Carolina Economy
Prince William County, Virginia Department of Parks & Recreation: Billy Casper Golf, LLC Performance Analysis Report Date: March 7, 2016
 Prince William County, Virginia Department of Parks & Recreation: Billy Casper Golf, LLC Performance Analysis Report Date: March 7, 2016 Table of Contents Transmittal Letter... 1 Introduction... 2-5 Background...
ECONOMIC DEVELOPMENT ELEMENT
 ECONOMIC DEVELOPMENT ELEMENT Background The Economic Development Element considers labor force and labor force characteristics, employment by place of work and residence, and analysis of the community
Current Hawaii Economic Conditions. Eugene Tian
 Current Hawaii Economic Conditions Eugene Tian Department of Business, Economic Development & Tourism At the PATA/TTRA 2016 Annual Outlook & Economic Forecast Forum February 3, 2016 Positive Signs in the
CASWELL PARK REG I O N AL SPORTS COMPLE X ECONOMIC IMPACT ANALYSIS
 CASWELL PARK REG I O N AL SPORTS COMPLE X ECONOMIC IMPACT ANALYSIS Submitted to the City of North Mankato July, 2015 Table of Contents Executive Summary... 1 Definitions and Assumptions... 2 Introduction...
Nevada County Population Projections 2015 to 2034
 Nevada County Population Projections 2015 to 2034 Prepared By: Jeff Hardcastle, AICP Nevada State Demographer Nevada Department of Taxation Reno Office: 4600 Kietzke Lane, Building L Suite 235 Reno, NV
Big Changes, Unknown Impacts
 Big Changes, Unknown Impacts Boulder Economic Forecast Place cover image here Richard Wobbekind Senior Economist and Associate Dean for Business and Government Relations January 17, 2018 Real GDP Growth
Bob Costello Chief Economist & Vice President American Trucking Associations. Economic & Motor Carrier Industry Update.
 Bob Costello Chief Economist & Vice President American Trucking Associations Economic & Motor Carrier Industry Update February 26, 2013 The Worst Recession Since the Great Depression 0% Loss from Peak
2018 Annual Economic Forecast Dragas Center for Economic Analysis and Policy
 2018 Annual Economic Forecast Dragas Center for Economic Analysis and Policy PRESENTING SPONSOR EVENT PARTNERS 2 The forecasts and commentary do not constitute an official viewpoint of Old Dominion University,
Fiscal Impact of SunTrust Park and The Battery Atlanta on Cobb County Executive Summary Sept. 18, 2018
 Fiscal Impact of SunTrust Park and The Battery Atlanta on Cobb County Executive Summary Sept. 18, 2018 Overview Historically, professional sports stadiums were privately owned by the sports teams that
CHAPTER THREE SOURCES OF GOLF COURSE INFORMATION, STATISTICS & PERFORMANCE DATA
 CHAPTER THREE SOURCES OF GOLF COURSE INFORMATION, STATISTICS & PERFORMANCE DATA The production of a solid and credible golf course appraisal requires extensive use of appropriate golf course and demographic
El Conquistador Golf & Tennis Assessment & Recommendations for the Town of Oro Valley Golf Program
 El Conquistador Golf & Tennis Assessment & Recommendations for the Town of Oro Valley Golf Program Prepared for The Town of Oro Valley, Arizona Prepare by PURPOSE Introduction and Executive Summary WLB
Michigan Golf Tourists - Economic Impacts 1
 2000 MI Golf Economic Impact Study Page 1 Michigan Golf Tourists - Economic Impacts 1 Daniel J. Stynes, Ya-Yen Sun and Daniel R. Talhelm Department of Park, Recreation and Tourism Resources Michigan State
Economic Update and Prospects for 2019 Professor Robert M. McNab Dragas Center for Economic Analysis and Policy Strome College of Business
 Economic Update and Prospects for 2019 Professor Robert M. McNab Dragas Center for Economic Analysis and Policy Strome College of Business January 3, 2019 The forecasts and commentary do not constitute
hyped pro shop sales by merchandising new club designs
 hyped pro shop sales by merchandising new club designs Pro shop sales recovered from the sluggishness caused by uncooperative weather conditions at the start of the 1973 season, rallying sufficiently to
Rochester Area Bike Sharing Program Study
 roc bike share Rochester Area Bike Sharing Program Study Executive Summary ~ January 2015 JANUARY 2015 8484 Georgia Avenue, Suite 800 Silver Spring, MD 20910 3495 Winton Pl., Bldg E, Suite 110 Rochester,
Initiation Fees $ 3,000 * Monthly Dues $ 500. Monthly Dues $ 400. Initiation Fees $ 2,000 * Monthly Dues $ 300. Monthly Dues $ 300
 Cedar Point Country Club Membership Classifications Generational Initiation Fees $ 3,000 * Monthly Dues $ 500 Golf (Age 40-74) Initiation Fees $ 3,000 * Monthly Dues $ 400 Intermediate Golf (Age 35-39)
Sport Fishing Expenditures and Economic Impacts on Public Lands in Washington
 Sport Fishing Expenditures and Economic Impacts on Public Lands in Washington For: Northwest Sportfishing Industry Association By: Southwick Associates Released June 2015 PO Box 6435 Fernandina Beach,
the golf industry is feeling pretty good about itself.
 At this writing in 2018, the golf industry is feeling pretty good about itself. After absorbing discouraging data for years course closings, decreasing numbers of players and rounds and revenue, major
15, 2015 EXECUTIVE SUMMARY
 Economic Contribution, Impacts, and Economic Benefits of Deer, Waterfowl and Upland Game Bird Hunting in North and South Dakota: Relationship to CRP Lands Dr. John Loomis and Dr. Michelle Haefele in cooperation
The US Economic Outlook
 IHS ECONOMICS US Outlook The US Economic Outlook November 2014 ihs.com Rafael Amiel, Director latin America Economics +1 215 789 7405, rafael.amiel.ihs.com 2014 IHS The US economy is gaining momentum Growth
The Economic Impacts of Recreational Fishing in the Matagorda Bay System
 The Economic Impacts of Recreational Fishing in the Matagorda Bay System Prepared by Andrew Ropicki 1 Daniel Hanselka 2 Rebekka Dudensing 3 Rhonda Cummins 4 Bill Balboa 5 December 12, 2016 1 Assistant
Europe June Craig Menear. Chairman, CEO & President. Diane Dayhoff. Vice President, Investor Relations
 Europe June 2016 Craig Menear Chairman, CEO & President Diane Dayhoff Vice President, Investor Relations Forward Looking Statements and Non-GAAP Financial Measurements Certain statements contained in today
GRE PROJECTS $78 MILLION IMPACT FROM 2013 PGA CHAMPIONSHIP TOURNAMENT TO BE HELD AT ROCHESTER S OAK HILL COUNTRY CLUB AUG. 5-11, 2013 Overview
 GRE PROJECTS $78 MILLION IMPACT FROM 2013 PGA CHAMPIONSHIP TOURNAMENT TO BE HELD AT ROCHESTER S OAK HILL COUNTRY CLUB AUG. 5-11, 2013 Overview In a recent report measuring golf s total economic impact
Distributional National Accounts: Methods and Estimates for the United States
 Distributional National Accounts: Methods and Estimates for the United States Thomas Piketty (PSE) Emmanuel Saez (UC Berkeley) Gabriel Zucman (UC Berkeley) November 2016 There is a large disconnect today
PLAY GOLF AMERICA 2009 ANNUAL REPORT
 PLAY GOLF AMERICA 2009 ANNUAL REPORT PLAY GOLF AMERICA Play Golf America, an innovative growth-of-the-game initiative that was launched in 2004, continues to play a vital role in helping the industry increase
WHERE ARE ARIZONA DEMOGRAPHICS TAKING US? HOW GROWING SLOWER, OLDER AND MORE DIVERSE AFFECTS REAL ESTATE
 WHERE ARE ARIZONA DEMOGRAPHICS TAKING US? HOW GROWING SLOWER, OLDER AND MORE DIVERSE AFFECTS REAL ESTATE March 2017 Tom Rex Office of the University Economist and Center for Competitiveness and Prosperity
PGA Career Services is pleased to notify you about the following employment opportunity. General Manager. Hamilton Farm Golf Club
 August 1 st, 2018 PGA Career Services is pleased to notify you about the following employment opportunity Gladstone, New Jersey 07934 About the Club: The vision for Hamilton Farm began in 1911, when James
2018 Annual Economic Forecast Dragas Center for Economic Analysis and Policy
 2018 Annual Economic Forecast Dragas Center for Economic Analysis and Policy PRESENTING SPONSOR EVENT PARTNERS 2 The forecasts and commentary do not constitute an official viewpoint of Old Dominion University,
Economic Impact of Hunting Expenditures on Southern U.S
 Economic Impact of Hunting Expenditures on Southern U.S Jagdish Poudel (Corresponding author) Graduate Research Assistant Forest and Wildlife Research Center College of Forest Resource Mississippi State
Farm Sector Income & Finances 2016 Outlook. By Ryan Kuhns and Kevin Patrick March 16, 2016
 Farm Sector Income & Finances 2016 Outlook By Ryan Kuhns and Kevin Patrick March 16, 2016 Background The Economic Research Service forecasts the farm sector s income statement and balance sheet Last released
MISSION STATEMENT $1 billion
 2017 Impact Report MISSION STATEMENT The USGA promotes and conserves the true spirit of the game of golf as embodied in its ancient and honorable traditions. It acts in the best interests of the game for
RESIDENTIAL AND GOLF COURSE MARKET ANALYSIS AND FINANCIAL FEASIBILITY STUDY
 RESIDENTIAL AND GOLF COURSE MARKET ANALYSIS AND FINANCIAL FEASIBILITY STUDY APPLETREE GOLF COURSE FOUNTAIN, COLORADO PREPARED FOR: CITY OF FOUNTAIN Economic & Market Research / Land & Development Planning
Smithers Golf and Country Club
 P a g e 1 Smithers Golf and Country Club DRAFT Strategic Plan 2018-2023 Draft Approved by The SGCC Board of Directors: March, 2018 1 P a g e 2 Introduction The Smithers Golf and Country Club (SGCC) is
LAPLAYA BEACH AND GOLF CLUB FREQUENTLY ASKED QUESTIONS
 LAPLAYA BEACH AND GOLF CLUB FREQUENTLY ASKED QUESTIONS The following questions and answers are designed to provide an understanding of membership opportunities at LaPlaya Beach and Golf Club (the "Club").
The U.S. Economic Outlook
 The U.S. Economic Outlook Presented to: Maquiladora Industry Outlook Conference September 29 2006 Presented by: Patrick Newport Principal, U.S. Macroeconomic Service 781-301-9125 patrick.newport@globalinsight.com