PSY201: Chapter 5: The Normal Curve and Standard Scores
|
|
|
- Eustace Beasley
- 5 years ago
- Views:
Transcription
1 PSY201: Chapter 5: The Normal Curve and Standard Scores Introduction: Normal curve + a very important distribution in behavior sciences + three principal reasons why many of the variables measured in behavioral science research have distributions that quite closely approximate the normal curve (ie: height, weight, intelligence and achievement are few examples) - 2. many of the inference tests used in analyzing experiments have sampling distributions that become normally distributed with increasing sample size. (ie: sign test & Mann-Whitney U test) - 3. many inference tests require sampling distributions that are normally distributed. The z test, Student's t test, and the F test are examples of inference tests that depend on this point much of importance of normal curve occurs in conjunction with inferential statistics. The Normal Curve: normal curve is a theoretical distribution of population scores. + a theoretical curve and is only approximated by real data + bell-shaped curve that is described by equation: curve has two inflection points, one on each side of the mean + inflection points are located where the curvature changes direction + ie: inflection points are located where curve changes from being convex downward to being convex upward - if the bell-shaped curve is a normal curve, inflection points are at 1 standard deviation from the mean ( and ) - as the curve approaches the horizontal axis, it is slowly changing its Y value. - the curve never quite reaches the axis - it approaches the horizontal axis and gets closer and closer to it, but it never quite touches it. - curve is asymptotic to the horizontal axis infection points under the curve, horizontal... in the diagram on page 97 Area Contained Under the Normal Curve: in distributions that are normally shaped, there is a special relationship between the mean and the standard deviation with regard to the area contained under the curve when a set of scores is normally distributed, 34.13% of the area under the curve is contained between the mean (u) and a score that is equal to u + 1o ; 13.59% of the area is contained between a score equal to + 1 and a score of u+ 2 o; 2.15%of the area is contained between scores of u+ 2o and u + 3o ; and 0.13% of the area exists beyond u+ 3o. This accounts for 50% of the area + since curve is symmetrical, same percentages hold for scores below the mean + since frequency is plotted on vertical axis, these percentages represent the percentage of scores contained within the area
, 13.59% between 116 and 132 ( u+ 2o = 100+32 = 132), 2.15% between 132 and 148, and 0.13% above 148 + similarly, 34.")

2 ie: + have a population of 10,000 IQ scores + distribution normally shaped with u = 100 and o = 16 + since scores are normally distributed, 34.13% of scores are contained between scores of 100 and 116 ( u+ 1o = = 116), 13.59% between 116 and 132 ( u+ 2o = = 132), 2.15% between 132 and 148, and 0.13% above similarly, 34.13% of scores fall between 84 and 100, 13.59% between 68 and 84, 2.15% between 52 and 68, and 0.13% below 52. to calculate the number of scores in each area, multiply the relevant percentage by the total number of scores there are 34.13% x 10,000 = 3413 scores between 100 and 116, 13.59% x = 1359 scores between 116 and 132, and 215 scores between 132 and 148; 13 scores are greater than for other half of distribution, there are 3413 scores between 84 and 100, 1359 scores between 68 and 84, and 215 scores between 52 and 68; there are 13 scores below these frequencies would be true only if distribution is exactly normally distributed + in actual practice, the frequencies would vary slightly depending on how close the distribution is to this theoretical model Standard Scores (z Scores): IQ of a score is meaningless unless you have a reference group to compare against + without one, can't tell whether the score is high, average, or low score is one of the 10,000 scores of distributions gives IQ of 132 some meaning + ie: can determine the percentage of scores in distribution that are lower than 132 determining the percentile rank of score of 132 (percentile rank of a score is defined as the percentage of scores that is below the score in question) 132 is 2 standard deviations above the mean + in normal curve, there are = 47.72% of the scores between the mean and a score that is 2 standard deviations above the mean + to fine percentile rank of 132, need to add this percentage the 50.00% that lie below the mean 97.72% ( ) of the scores fall below your IQ score of should be happy to be intelligent to solve problem, had to determine how many standard deviations the raw score of 132 was above or below the mean + transformed the raw score into a standard score, also called a z score a z score is a transformed score that designated how many standard deviation units the corresponding raw score is above or below the mean

3 process which by the raw score is altered score transformation + z transformation results in a distribution having a mean of 0 and a standard deviation of 1 + reason z scores are called standard deviation is they are expressed relative to a distribution mean of 0 and a standard deviation of 1 in conjunction with a normal curve, z scores allow to determine the number or percentages of scores that fall above or below any score in the distribution + z scores allow comparison between scores in different distributions, even when the units of the distributions are different ie: suppose that weights of all the rats in the housed in a university vivarium are normally distributed with u = 300 and o = 20 grams + what is the percentile rank of a rat weighing 340 grams? + first need to convert the raw score of 340 grams to its corresponding z score: since scores are normally distributed, = 47.72% of the scores are between the score and the mean + adding the remaining 50.00% that lie below the mean, we arrive at a percentile rank of = 97.72% for the weight of 340 grams. + thus the IQ score of 132 and the rat's weight of 340 grams have something in common... they both occupy the same relative position in their respective distributions the rat is heavy as you are smart z scores used to compare scores that are not otherwise directly comparable + ordinarily, not be able to compare intelligence and weight... they are measured on different scales and have different units + but by converting the scores to their z-transformed scores, we eliminate the original units and replace them with a universal unit, the standard deviation score of 132 IQ units becomes a score of 2 standard deviation units above the mean and the rat's weight of 340 grams also becomes a score of 2 standard deviation units above the mean it's possible to compare anything with anything as long as the measuring scales allow computation of the mean and standard deviation + ability to compare scores that are measured on different scales is of fundamental importance to the topic of correlation computing z scores using sample data

: IQ scores and their corresponding z scores - used in conjunction with the normal distribution, all z distributions are not normally shaped can be calculated for distributions of any shape -")
 + scores located at the mean of the raw scores will also be the mean of the zero scores + z-value for raw scores will also be at the mean of")
4 Characteristics of z Scores: three characteristics 1. z scores have the same shape as the set of raw scores + transforming raw scores into their corresponding z scores doesn't change the shape of the distribution nor do the scores change their relative positions all that's changed are the score values + (5.5): IQ scores and their corresponding z scores - used in conjunction with the normal distribution, all z distributions are not normally shaped can be calculated for distributions of any shape - resulting z scores will take on the shape of the raw scores 2. the mean of the z-scores always equals to zero (uz = 0) + scores located at the mean of the raw scores will also be the mean of the zero scores + z-value for raw scores will also be at the mean of the z-scores + z-value for raw scores at the mean equals zero + ie: z-transformation for a score at the mean of the IQ distribution is given by (5.5) ~~~ the mean of the z-distribution equals zero - 3. standard deviation of z scores always equals 1 + follows because a raw score that is 1 standard deviation above the mean has a z score of +1 Finding the Area Given the Raw Score: instead of an IQ of 132, desire to find the percentile rank of an IQ of assume same population parameters + first, draw a curve showing the population and locate the relevant area by entering the score 142 on horizontal axis


5 + then shade the area desired + then calculate z: - first column of table (column A) contains the z score - column B lists the proportion of the total area between a given z score and the mean - column C lists the proportion of the total area that exists beyond the z-score use Table A to find percentile rank of locate the z-score of 2.62 in column A + determine from column B the proportion of the total area between the z-score and the mean + for a z score of 2.62, this area equals must add to this value to take into account the scores lying below the mean the proportion of scores that lie below an IQ of 142 is = to convert this proportion to a percentage, must multiply by 100 percentile rank of 142 is table A used to find the area for any z-score provided the scores are normally distributed - when using it, it it's sufficient to round z-values to two decimal place accuracy

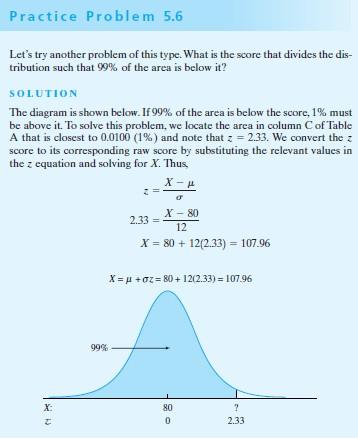
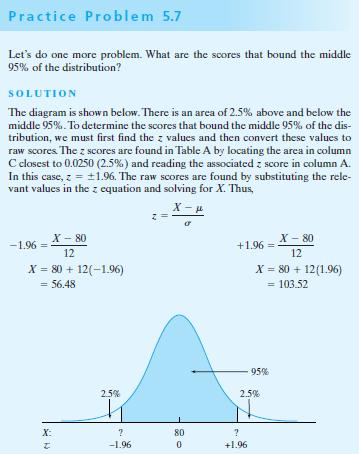
6 Finding the Raw Score given the Area know the area and want to determine the corresponding score + ie: find the raw score that divides the distribution of aptitude scores such that 70% of the scores are below it this problem is the reverse of the previous one + given the area and need to determine the score + don't know what the raw score value is, can determine its corresponding z score from Table A + once know the z-score, can solve for the raw score using the z-equation if 70% of scores lie below the raw score, then 30% must lie above it + can find z-score by searching in Table A, column C, until we locate the area closest to (30%) and then noting that the z-score corresponding to this area is to find the raw score, all we need to do is substitute the relevant values in the z-equation and solve for X:

7 PG 554 FOR TABLE A!!!
STANDARD SCORES AND THE NORMAL DISTRIBUTION
 STANDARD SCORES AND THE NORMAL DISTRIBUTION REVIEW 1.MEASURES OF CENTRAL TENDENCY A.MEAN B.MEDIAN C.MODE 2.MEASURES OF DISPERSIONS OR VARIABILITY A.RANGE B.DEVIATION FROM THE MEAN C.VARIANCE D.STANDARD
The pth percentile of a distribution is the value with p percent of the observations less than it.
 Describing Location in a Distribution (2.1) Measuring Position: Percentiles One way to describe the location of a value in a distribution is to tell what percent of observations are less than it. De#inition:
% per year Age (years)
") Stat 1001 Winter 1998 Geyer Homework 2 Problem 3.1 66 inches and 72 inches. Problem 3.2 % per year 0.0 0.5 1.0 1.5 0 20 40 60 80 Age (years) (a) Age 1. (b) More 31-year olds (c) More people age 35{44,
Stat 1001 Winter 1998 Geyer Homework 2 Problem 3.1 66 inches and 72 inches. Problem 3.2 % per year 0.0 0.5 1.0 1.5 0 20 40 60 80 Age (years) (a) Age 1. (b) More 31-year olds (c) More people age 35{44,
b) (2 pts.) Does the study show that drinking 4 or more cups of coffee a day caused the higher death rate?
 (2 pts.) Does the study show that drinking 4 or more cups of coffee a day caused the higher death rate?") Question 1 (10 pts) A study published in the August 15, 2017 issue of Mayo Clinic Proceedings tracked 44,000 people aged 20 to 87 for an average of about 16 years and found that those who drank 4 or more
Question 1 (10 pts) A study published in the August 15, 2017 issue of Mayo Clinic Proceedings tracked 44,000 people aged 20 to 87 for an average of about 16 years and found that those who drank 4 or more
Internet Technology Fundamentals. To use a passing score at the percentiles listed below:
 Internet Technology Fundamentals To use a passing score at the percentiles listed below: PASS candidates with this score or HIGHER: 2.90 High Scores Medium Scores Low Scores Percentile Rank Proficiency
CHAPTER 2 Modeling Distributions of Data
 CHAPTER 2 Modeling Distributions of Data 2.2 Density Curves and Normal Distributions The Practice of Statistics, 5th Edition Starnes, Tabor, Yates, Moore Bedford Freeman Worth Publishers Density Curves
DS5 The Normal Distribution. Write down all you can remember about the mean, median, mode, and standard deviation.
 DS5 The Normal Distribution Write down all you can remember about the mean, median, mode, and standard deviation. 1 DS5 The Normal Distribution Basic concepts: Describing and using Z scores calculated
STATISTICS ELEMENTARY MARIO F. TRIOLA. Descriptive Statistics EIGHTH EDITION
 ELEMENTARY STATISTICS Chapter 2 Descriptive Statistics MARIO F. TRIOLA EIGHTH EDITION 1 2-1 Overview Chapter 2 Descriptive Statistics 2-2 Summarizing Data with Frequency Tables 2-3 Pictures of Data 2-4
1. The data below gives the eye colors of 20 students in a Statistics class. Make a frequency table for the data.
 1. The data below gives the eye colors of 20 students in a Statistics class. Make a frequency table for the data. Green Blue Brown Blue Blue Brown Blue Blue Blue Green Blue Brown Blue Brown Brown Blue
Chapter 2: Modeling Distributions of Data
 Chapter 2: Modeling Distributions of Data Section 2.1 The Practice of Statistics, 4 th edition - For AP* STARNES, YATES, MOORE Chapter 2 Modeling Distributions of Data 2.1 2.2 Normal Distributions Section
Chapter 6 The Standard Deviation as a Ruler and the Normal Model
 Chapter 6 The Standard Deviation as a Ruler and the Normal Model Standardizing with z-scores Expressing data in terms of We standardize to Standardized values can be even if the original variables had
Mrs. Daniel- AP Stats Ch. 2 MC Practice
 Mrs. Daniel- AP Stats Ch. 2 MC Practice Name: 1. Jorge s score on Exam 1 in his statistics class was at the 64th percentile of the scores for all students. His score falls (a) between the minimum and the
Acknowledgement: Author is indebted to Dr. Jennifer Kaplan, Dr. Parthanil Roy and Dr Ashoke Sinha for allowing him to use/edit many of their slides.
 Acknowledgement: Author is indebted to Dr. Jennifer Kaplan, Dr. Parthanil Roy and Dr Ashoke Sinha for allowing him to use/edit many of their slides. Topic for this lecture 0Today s lecture s materials
Descriptive Statistics. Dr. Tom Pierce Department of Psychology Radford University
 Descriptive Statistics Dr. Tom Pierce Department of Psychology Radford University Descriptive statistics comprise a collection of techniques for better understanding what the people in a group look like
Calculation of Trail Usage from Counter Data
 1. Introduction 1 Calculation of Trail Usage from Counter Data 1/17/17 Stephen Martin, Ph.D. Automatic counters are used on trails to measure how many people are using the trail. A fundamental question
Today s plan: Section 4.2: Normal Distribution
 1 Today s plan: Section 4.2: Normal Distribution 2 Characteristics of a data set: mean median standard deviation five-number summary 2 Characteristics of a data set: mean median standard deviation five-number
THE NORMAL DISTRIBUTION COMMON CORE ALGEBRA II
 Name: Date: THE NORMAL DISTRIBUTION COMMON CORE ALGEBRA II Many populations have a distribution that can be well described with what is known as The Normal Distribution or the Bell Curve. This curve, as
Introduction to Scientific Notation & Significant Figures. Packet #6
 Introduction to Scientific Notation & Significant Figures Packet #6 Introduction A measurement is a quantity that has both a unit and number Measurements are fundamental to the experimental sciences. Measurements,
Practice Test Unit 06B 11A: Probability, Permutations and Combinations. Practice Test Unit 11B: Data Analysis
 Note to CCSD HS Pre-Algebra Teachers: 3 rd quarter benchmarks begin with the last 2 sections of Chapter 6 (probability, which we will refer to as 6B), and then address Chapter 11 benchmarks (which will
IHS AP Statistics Chapter 2 Modeling Distributions of Data MP1
 IHS AP Statistics Chapter 2 Modeling Distributions of Data MP1 Monday Tuesday Wednesday Thursday Friday August 22 A Day 23 B Day 24 A Day 25 B Day 26 A Day Ch1 Exploring Data Class Introduction Getting
Khosla's theory. After studying a lot of dam failure constructed based on Bligh s theory, Khosla came out with the following;
 Khosla's theory After studying a lot of dam failure constructed based on Bligh s theory, Khosla came out with the following; Following are some of the main points from Khosla's Theory From observation
Homework 7, Due March
 Homework 7, Due March 18 2010 Chapter 6, questions 6.6, 6.10, 6.26, 6.28 Remark: 6.28 is a follow-on to 6.27. You are not requested to hand in 6.27 as well, but probably you should work through 6.27 for
Homework Exercises Problem Set 1 (chapter 2)
") 1 Name: Homework Exercises Problem Set 1 (chapter 2) Exercise 2.5.1 The 10 third-grade students at Lake Wobegone elementary school took a spelling test with 10 words, each worth one point. Given that the
1 Name: Homework Exercises Problem Set 1 (chapter 2) Exercise 2.5.1 The 10 third-grade students at Lake Wobegone elementary school took a spelling test with 10 words, each worth one point. Given that the
Frequency Distributions
 Descriptive Statistics Dr. Tom Pierce Department of Psychology Radford University Descriptive statistics comprise a collection of techniques for better understanding what the people in a group look like
Mark Scheme (Results) Summer 2009
 Summer 2009") Mark Scheme (Results) Summer 2009 GCSE GCSE Mathematics (Linear) - 1380 Paper: 1380_2F 2 NOTES ON MARKING PRINCIPLES 1 Types of mark M marks: method marks A marks: accuracy marks B marks: unconditional
Mark Scheme (Results) Summer 2009 GCSE GCSE Mathematics (Linear) - 1380 Paper: 1380_2F 2 NOTES ON MARKING PRINCIPLES 1 Types of mark M marks: method marks A marks: accuracy marks B marks: unconditional
CC Investigation 1: Graphing Proportions
 CC Investigation 1: Graphing Proportions DOMAIN: Ratios and Proportional Relationships Problem 1.1 During the first basketball game of the season, Karl made 3 of his 5 free-throw attempts. Karl then made
Chapter 12 Practice Test
 Chapter 12 Practice Test 1. Which of the following is not one of the conditions that must be satisfied in order to perform inference about the slope of a least-squares regression line? (a) For each value
Practice Test Unit 6B/11A/11B: Probability and Logic
 Note to CCSD Pre-Algebra Teachers: 3 rd quarter benchmarks begin with the last 2 sections of Chapter 6, and then address Chapter 11 benchmarks; logic concepts are also included. We have combined probability
Hydrostatic Force on a Submerged Surface
 Experiment 3 Hydrostatic Force on a Submerged Surface Purpose The purpose of this experiment is to experimentally locate the center of pressure of a vertical, submerged, plane surface. The experimental
Quantitative Literacy: Thinking Between the Lines
 Quantitative Literacy: Thinking Between the Lines Crauder, Noell, Evans, Johnson Chapter 6: Statistics 2013 W. H. Freeman and Company 1 Chapter 6: Statistics Lesson Plan Data summary and presentation:
SAMPLE RH = P 1. where. P 1 = the partial pressure of the water vapor at the dew point temperature of the mixture of dry air and water vapor
 moisture starts to condense out of the air. The temperature at which this happens is called the dew point temperature, or the saturation temperature. What is commonly called saturation pressure or condensing
8th Grade. Data.
 1 8th Grade Data 2015 11 20 www.njctl.org 2 Table of Contents click on the topic to go to that section Two Variable Data Line of Best Fit Determining the Prediction Equation Two Way Table Glossary Teacher
STT 315 Section /19/2014
 Name: PID: A STT 315 Section 101 05/19/2014 Quiz 1A 50 minutes 1. A survey by an electric company contains questions on the following: Age of household head, Gender of household head and use of electric
1.28 Wave Frequency. Chapter 1. Energy
 www.ck12.org Chapter 1. Energy 1.28 Wave Frequency Define wave frequency. Identify the SI unit for wave frequency. Explain how wave frequency is related to the energy of a wave. Imagine making transverse
Math 1040 Exam 2 - Spring Instructor: Ruth Trygstad Time Limit: 90 minutes
 Math 1040 Exam 2 - Spring 2012 Name Instructor: Ruth Trygstad Time Limit: 90 minutes Any calculator is okay, but no computers, cell phones or other hand-held devices are allowed. Tables and formulas are
2.5. All games and sports have specific rules and regulations. There are rules about. Play Ball! Absolute Value Equations and Inequalities
 Play Ball! Absolute Value Equations and Inequalities.5 LEARNING GOALS In this lesson, you will: Understand and solve absolute values. Solve linear absolute value equations. Solve and graph linear absolute
STAT 155 Introductory Statistics. Lecture 2: Displaying Distributions with Graphs
 The UNIVERSITY of NORTH CAROLINA at CHAPEL HILL STAT 155 Introductory Statistics Lecture 2: Displaying Distributions with Graphs 8/29/06 Lecture 2-1 1 Recall Statistics is the science of data. Collecting
LOW PRESSURE EFFUSION OF GASES revised by Igor Bolotin 03/05/12
 LOW PRESSURE EFFUSION OF GASES revised by Igor Bolotin 03/05/ This experiment will introduce you to the kinetic properties of low-pressure gases. You will make observations on the rates with which selected
save percentages? (Name) (University)
 (University)") 1 IB Maths Essay: What is the correlation between the height of football players and their save percentages? (Name) (University) Table of Contents Raw Data for Analysis...3 Table 1: Raw Data...3 Rationale
1 IB Maths Essay: What is the correlation between the height of football players and their save percentages? (Name) (University) Table of Contents Raw Data for Analysis...3 Table 1: Raw Data...3 Rationale
Section 4.2 Objectives
 Section 4. Objectives Determine whether the slope of a graphed line is positive, negative, 0, or undefined. Determine the slope of a line given its graph. Calculate the slope of a line given the ordered
Handicap Differential = (Adjusted Gross Score - USGA Course Rating) x 113 / USGA Slope Rating
 x 113 / USGA Slope Rating") FORMULAS Section 10 USGA HANDICAP FORMULA A Handicap Index is the USGA's mark which is used to indicate a measurement of a player's potential scoring ability on a course of standard difficulty. Potential
FORMULAS Section 10 USGA HANDICAP FORMULA A Handicap Index is the USGA's mark which is used to indicate a measurement of a player's potential scoring ability on a course of standard difficulty. Potential
NOTES: STANDARD DEVIATION DAY 4 Textbook Chapter 11.1, 11.3
 NOTES: STANDARD DEVIATION DAY 4 Textbook Chapter 11.1, 11.3 OBJECTIVE: Today you will learn about standard deviation and the normal curve! There are three ways that we can measure how spread out the data
Psychology - Mr. Callaway/Mundy s Mill HS Unit Research Methods - Statistics
 Psychology - Mr. Callaway/Mundy s Mill HS Unit 2.3 - Research Methods - Statistics How do psychologists ask & answer questions? Last time we asked that we were discussing Research Methods. This time we
Name Date Period. E) Lowest score: 67, mean: 104, median: 112, range: 83, IQR: 102, Q1: 46, SD: 17
 Lowest score: 67, mean: 104, median: 112, range: 83, IQR: 102, Q1: 46, SD: 17") Chapter 6 Review Standards: 4, 7, 8, and 11 Name Date Period Write complete answers, using complete sentences where necessary. Show your work when possible. MULTIPLE CHOICE. Choose the one alternative
Chapter 6 Review Standards: 4, 7, 8, and 11 Name Date Period Write complete answers, using complete sentences where necessary. Show your work when possible. MULTIPLE CHOICE. Choose the one alternative
Full file at
 Chapter 2 1. Describe the distribution. survival times of persons diagnosed with terminal lymphoma A) approximately normal B) skewed left C) skewed right D) roughly uniform Ans: C Difficulty: low 2. Without
BERNOULLI EFFECTS ON PRESSURE.ACTIVATED W ATER LEVEL GAUGES
 International Hydrographic R eview, Monaco, LV (2), July 1978. BERNOULLI EFFECTS ON PRESSURE.ACTIVATED W ATER LEVEL GAUGES by Langley R. MUIR Ocean and Aquatic Sciences, Central Region, Burlington, Ontario,
Measuring Relative Achievements: Percentile rank and Percentile point
 Measuring Relative Achievements: Percentile rank and Percentile point Consider an example where you receive the same grade on a test in two different classes. In which class did you do better? Why do we
Math 4. Unit 1: Conic Sections Lesson 1.1: What Is a Conic Section?
 Unit 1: Conic Sections Lesson 1.1: What Is a Conic Section? 1.1.1: Study - What is a Conic Section? Duration: 50 min 1.1.2: Quiz - What is a Conic Section? Duration: 25 min / 18 Lesson 1.2: Geometry of
Confidence Interval Notes Calculating Confidence Intervals
 Confidence Interval Notes Calculating Confidence Intervals Calculating One-Population Mean Confidence Intervals for Quantitative Data It is always best to use a computer program to make these calculations,
Aim: Normal Distribution and Bell Curve
 Aim: Normal Distribution and Bell Curve HW: Complete (1-10) last 3 slides Do Now: If the variance of a set of data is 9, the standard deviation is: (1) 9 (2) 81 (3) 3 (4) 1 Normal Distribution and Bell
Walk - Run Activity --An S and P Wave Travel Time Simulation ( S minus P Earthquake Location Method)
") Walk - Run Activity --An S and P Wave Travel Time Simulation ( S minus P Earthquake Location Method) L. W. Braile and S. J. Braile (June, 2000) braile@purdue.edu http://web.ics.purdue.edu/~braile Walk
Walk - Run Activity --An S and P Wave Travel Time Simulation ( S minus P Earthquake Location Method) L. W. Braile and S. J. Braile (June, 2000) braile@purdue.edu http://web.ics.purdue.edu/~braile Walk
Algebra I: A Fresh Approach. By Christy Walters
 Algebra I: A Fresh Approach By Christy Walters 2016 A+ Education Services All rights reserved. No part of this publication may be reproduced, distributed, stored in a retrieval system, or transmitted,
TRAFFIC CHARACTERISTICS. Unit I
 TRAFFIC CHARACTERISTICS Unit I Traffic stream Characteristics Overview Overview of Traffic Stream Components To begin to understand the functional and operational aspects of traffic on streets and highways
LOW PRESSURE EFFUSION OF GASES adapted by Luke Hanley and Mike Trenary
 ADH 1/7/014 LOW PRESSURE EFFUSION OF GASES adapted by Luke Hanley and Mike Trenary This experiment will introduce you to the kinetic properties of low-pressure gases. You will make observations on the
Naval Postgraduate School, Operational Oceanography and Meteorology. Since inputs from UDAS are continuously used in projects at the Naval
 How Accurate are UDAS True Winds? Charles L Williams, LT USN September 5, 2006 Naval Postgraduate School, Operational Oceanography and Meteorology Abstract Since inputs from UDAS are continuously used
DESCRIBE the effect of adding, subtracting, multiplying by, or dividing by a constant on the shape, center, and spread of a distribution of data.
 Today's Objectives: FIND and INTERPRET the standardized score (z-score) of an individual value within a distribution of data. DESCRIBE the effect of adding, subtracting, multiplying by, or dividing by
Where are you right now? How fast are you moving? To answer these questions precisely, you
 4.1 Position, Speed, and Velocity Where are you right now? How fast are you moving? To answer these questions precisely, you need to use the concepts of position, speed, and velocity. These ideas apply
HOW FAST/FAR DOES FLY LINE FALL? N. Perkins of the University of Michigan, March 2003
 HOW FAST/FAR DOES FLY LINE FALL? N. Perkins of the University of Michigan, March 003 This report summarizes a simple model for the free fall dynamics of a length of fly line. The line is assumed to remain
APPROVED FACILITY SCHOOLS CURRICULUM DOCUMENT SUBJECT: Mathematics GRADE: 6. TIMELINE: Quarter 1. Student Friendly Learning Objective
 TIMELINE: Quarter 1 i-ready lesson: Rational Numbers and Absolute Value i-ready lesson: Numerical Expressions and Order of Operations 6/16/15 1 i-ready lesson (2a, 2b and 2c): Algebraic Expressions 6/16/15
Solutionbank S1 Edexcel AS and A Level Modular Mathematics
 Page 1 of 1 Exercise A, Question 1 A group of thirty college students was asked how many DVDs they had in their collection. The results are as follows. 12 25 34 17 12 18 29 34 45 6 15 9 25 23 29 22 20
5.1 Introduction. Learning Objectives
 Learning Objectives 5.1 Introduction Statistical Process Control (SPC): SPC is a powerful collection of problem-solving tools useful in achieving process stability and improving capability through the
Energy of a Rolling Ball
 Skills Practice Lab DATASHEET A Energy of a Rolling Ball Raised objects have gravitational potential energy (PE). Moving objects have kinetic energy (KE). In this lab, you will find out how these two kinds
Driv e accu racy. Green s in regul ation
 LEARNING ACTIVITIES FOR PART II COMPILED Statistical and Measurement Concepts We are providing a database from selected characteristics of golfers on the PGA Tour. Data are for 3 of the players, based
March Madness Basketball Tournament
 March Madness Basketball Tournament Math Project COMMON Core Aligned Decimals, Fractions, Percents, Probability, Rates, Algebra, Word Problems, and more! To Use: -Print out all the worksheets. -Introduce
Bioequivalence: Saving money with generic drugs
 The Right Stuff: Appropriate Mathematics for All Students Promoting the use of materials that engage students in meaningful activities that promote the effective use of technology to support mathematics,
Chapter 2 Displaying and Describing Categorical Data
 Chapter 2 Displaying and Describing Categorical Data Graphs for Categorical Variables Our concern will be two types of visual representations. Graphs for Categorical Variables Our concern will be two types
The Coach then sorts the 25 players into separate teams and positions
 Section 4 A: Contingency Tables Introduction A local school has a Varsity and Junior Varsity basketball team. No player plays on both teams and no player plays at more than one position. The coach writes
Ozobot Bit Classroom Application: Boyle s Law Simulation
 OZO AP P EAM TR T S BO RO VE D Ozobot Bit Classroom Application: Boyle s Law Simulation Created by Richard Born Associate Professor Emeritus Northern Illinois University richb@rborn.org Topics Chemistry,
Algebra I: A Fresh Approach. By Christy Walters
 Algebra I: A Fresh Approach By Christy Walters 2005 A+ Education Services All rights reserved. No part of this publication may be reproduced, distributed, stored in a retrieval system, or transmitted,
SHOT ON GOAL. Name: Football scoring a goal and trigonometry Ian Edwards Luther College Teachers Teaching with Technology
 SHOT ON GOAL Name: Football scoring a goal and trigonometry 2006 Ian Edwards Luther College Teachers Teaching with Technology Shot on Goal Trigonometry page 2 THE TASKS You are an assistant coach with
CONCEPTUAL PHYSICS LAB
 PURPOSE The purpose of this lab is to determine the density of an unknown solid by direct calculation and by graphing mass vs. volume for several samples of the solid. INTRODUCTION Which is heavier, a
CHM Introductory Laboratory Experiment (r17sd) 1/13
 1/13") CHM 110 - Introductory Laboratory Experiment (r17sd) 1/13 Purpose This introductory exercise will familiarize you with a few of the measurements we make in the chemistry laboratory and the level of uncertainty
CHM 110 - Introductory Laboratory Experiment (r17sd) 1/13 Purpose This introductory exercise will familiarize you with a few of the measurements we make in the chemistry laboratory and the level of uncertainty
Histogram. Collection
 Density Curves and Normal Distributions Suppose we looked at an exam given to a large population of students. The histogram of this data appears like the graph to the left below. However, rather than show
IGCSE - Cumulative Frequency Questions
 Dulwich College Shanghai IGCSE - Cumulative Frequency Questions 85 min 72 marks 1. Answer the whole of this question on one sheet of graph paper. The heights (h cm) of 270 students in a school are measured
Exploring Measures of Central Tendency (mean, median and mode) Exploring range as a measure of dispersion
 Exploring range as a measure of dispersion") Unit 5 Statistical Reasoning 1 5.1 Exploring Data Goals: Exploring Measures of Central Tendency (mean, median and mode) Exploring range as a measure of dispersion Data: A set of values. A set of data can
Unit 5 Statistical Reasoning 1 5.1 Exploring Data Goals: Exploring Measures of Central Tendency (mean, median and mode) Exploring range as a measure of dispersion Data: A set of values. A set of data can
Section I: Multiple Choice Select the best answer for each problem.
 Inference for Linear Regression Review Section I: Multiple Choice Select the best answer for each problem. 1. Which of the following is NOT one of the conditions that must be satisfied in order to perform
Smoothing the histogram: The Normal Curve (Chapter 8)
") Sept. 3 Statistic for the day: Compared to same month the previous year, average monthly drop in U.S. traffic fatalities from May 27 to Feb. 28:.2% Drop in March 28: 22.1% Drop in April 28: 17.9% Smoothing
Sept. 3 Statistic for the day: Compared to same month the previous year, average monthly drop in U.S. traffic fatalities from May 27 to Feb. 28:.2% Drop in March 28: 22.1% Drop in April 28: 17.9% Smoothing
Design Project 2 Sizing of a Bicycle Chain Ring Bolt Set ENGR 0135 Sangyeop Lee November 16, 2016 Jordan Gittleman Noah Sargent Seth Strayer Desmond
 1 Design Project 2 Sizing of a Bicycle Chain Ring Bolt Set ENGR 0135 Sangyeop Lee November 16, 2016 Jordan Gittleman Noah Sargent Seth Strayer Desmond Zheng 2 Abstract This report will analyze our calculations,
Introductory Physics PHYS101
 Introductory Physics PHYS101 Dr Richard H. Cyburt Office Hours Assistant Professor of Physics My office: 402c in the Science Building My phone: (304) 384-6006 My email: rcyburt@concord.edu TRF 9:30-11:00am
46 Chapter 8 Statistics: An Introduction
 46 Chapter 8 Statistics: An Introduction Activity 5 Continued Box 4 1. The median is 6. The mode is 5. The mean is about 7 (6.8). 2. The median and the mode were unchanged, but the mean increased significantly.
y ) s x x )(y i (x i r = 1 n 1 s y Statistics Lecture 7 Exploring Data , y 2 ,y n (x 1 ),,(x n ),(x 2 ,y 1 How two variables vary together
 s x x )(y i (x i r = 1 n 1 s y Statistics Lecture 7 Exploring Data , y 2 ,y n (x 1 ),,(x n ),(x 2 ,y 1 How two variables vary together") Statistics 111 - Lecture 7 Exploring Data Numerical Summaries for Relationships between Variables Administrative Notes Homework 1 due in recitation: Friday, Feb. 5 Homework 2 now posted on course website:
Statistics 111 - Lecture 7 Exploring Data Numerical Summaries for Relationships between Variables Administrative Notes Homework 1 due in recitation: Friday, Feb. 5 Homework 2 now posted on course website:
March Madness Basketball Tournament
 March Madness Basketball Tournament Math Project COMMON Core Aligned Decimals, Fractions, Percents, Probability, Rates, Algebra, Word Problems, and more! To Use: -Print out all the worksheets. -Introduce
TRIP GENERATION RATES FOR SOUTH AFRICAN GOLF CLUBS AND ESTATES
 TRIP GENERATION RATES FOR SOUTH AFRICAN GOLF CLUBS AND ESTATES M M Withers and C J Bester Department of Civil Engineering University of Stellenbosch, Private Bag X1, Matieland, 7602 ABSTRACT There has
Chapter 4: Single Vertical Arch
 Chapter 4: Single Vertical Arch 4.1 Introduction This chapter considers a single pressurized arch in a vertical plane. This arch is similar to the arches that will be studied in the following chapter.
In my left hand I hold 15 Argentine pesos. In my right, I hold 100 Chilean
 Chapter 6 Meeting Standards and Standings In This Chapter How to standardize scores Making comparisons Ranks in files Rolling in the percentiles In my left hand I hold 15 Argentine pesos. In my right,
LEE COUNTY WOMEN S TENNIS LEAGUE
 In order for the Lee County Women s Tennis League to successfully promote and equitably manage 2,500+ members and give all players an opportunity to play competitive tennis, it is essential to implement
Boyle s Law: Pressure-Volume Relationship in Gases
 Boyle s Law: Pressure-Volume Relationship in Gases Computer 6 The primary objective of this experiment is to determine the relationship between the pressure and volume of a confined gas. The gas we use
Chem 110 General Principles of Chemistry
 CHEM110 Worksheet - Gases Chem 110 General Principles of Chemistry Chapter 9 Gases (pages 337-373) In this chapter we - first contrast gases with liquids and solids and then discuss gas pressure. - review
NCSS Statistical Software
 Chapter 256 Introduction This procedure computes summary statistics and common non-parametric, single-sample runs tests for a series of n numeric, binary, or categorical data values. For numeric data,
Statistics. Wednesday, March 28, 2012
 Statistics Wednesday, March 28, 2012 Today's Agenda: 1. Collect HW #2: Activities 9 7 & 9 12 2. Go over HW #1: Activities 9 20 a f & 9 17 3. Practice calculating & s x 4. Activities 9 4, 9 5, 9 11, 9 13
NUMB3RS Activity: Is It for Real? Episode: Hardball
 Teacher Page 1 NUMB3RS Activity: Is It for Real? Topic: Data analysis Grade Level: 9-10 Objective: Use formulas to generate data points. Produce line graphs of which inferences are made. Time: 20 minutes
Boyle s Law: Pressure-Volume. Relationship in Gases
 Boyle s Law: Pressure-Volume Relationship in Gases The primary objective of this experiment is to determine the relationship between the pressure and volume of a confined gas. The gas we use will be air,
Bouncing Ball A C T I V I T Y 8. Objectives. You ll Need. Name Date
 . Name Date A C T I V I T Y 8 Objectives In this activity you will: Create a Height-Time plot for a bouncing ball. Explain how the ball s height changes mathematically from one bounce to the next. You
THE BEHAVIOR OF GASES
 14 THE BEHAVIOR OF GASES SECTION 14.1 PROPERTIES OF GASES (pages 413 417) This section uses kinetic theory to explain the properties of gases. This section also explains how gas pressure is affected by
LESSON 5: THE BOUNCING BALL
 352 - LINEAR B EHAVIOR LESSON 5: THE BOUNCING BALL y Notes to the Instructor Time: This lesson should take one class session. Materials: Two meter sticks or one tape measure per group, masking tape, balls
Equine Results Interpretation Guide For Cannon Angles May 2013
 Equine Results Interpretation Guide For Cannon Angles May 2013 Page 1 of 20 Table of Contents 1. Introduction... 3 2. Options for all plots... 7 3. Tables of data... 8 4. Gaits... 10 5. Walk... 10 6. Trot...
Gas volume and pressure are indirectly proportional.
 Section 2 The Gas Laws Key Terms Boyle s law Charles s law combined gas law absolute zero Gay-Lussac s law Scientists have been studying physical properties of gases for hundreds of years In 1662, Robert
ROSE-HULMAN INSTITUTE OF TECHNOLOGY Department of Mechanical Engineering. Mini-project 3 Tennis ball launcher
 Mini-project 3 Tennis ball launcher Mini-Project 3 requires you to use MATLAB to model the trajectory of a tennis ball being shot from a tennis ball launcher to a player. The tennis ball trajectory model
Exam Question 9: Hydrostatics. March 6, Applied Mathematics: Lecture 8. Brendan Williamson. Introduction. Density, Weight and Volume
 Exam Question 9: Hydrostatics March 6, 2017 This lecture is on hydrostatics, which is question 9 of the exam paper. Most of the situations we will study will relate to objects partly or fully submerged
Scaled vs. Original Socre Mean = 77 Median = 77.1
 Have out... - notebook - colors - calculator (phone calc will work fine) Tests back as you come in! vocab example Tests Scaled vs. Original Socre Mean = 77 Median = 77.1 + Δ vocab example 1 2.1 Describing