STANDARD SCORES AND THE NORMAL DISTRIBUTION
|
|
|
- Merilyn Dennis
- 5 years ago
- Views:
Transcription
1 STANDARD SCORES AND THE NORMAL DISTRIBUTION
2 REVIEW 1.MEASURES OF CENTRAL TENDENCY A.MEAN B.MEDIAN C.MODE 2.MEASURES OF DISPERSIONS OR VARIABILITY A.RANGE B.DEVIATION FROM THE MEAN C.VARIANCE D.STANDARD DEVIATION
3 Test Scores Suppose you (together with many other students) take tests in three subjects. On each test, the range of possible scores runs from 0 to 100 points. The table below shows your score in each of the three subjects In which subject did you do best? In which subject did you do best relative to other students? The answer to the second question obviously depends on the overall frequency distribution of score. Subject Score ENG 75 MATH 65 SCIE 72
4 Test Scores (cont.) Indeed, the picture looks different when we look at your scores relative to overall distribution of scores and, in particular, to its summary statistics. Let s compare each of your scores to the mean score in each subject. Now what seems to be your strongest subject? SUBJECT SCORE MEAN SCORE ENG MATH SCI 72 57
5 Your Deviations from the Mean SUBJECT SCORE MEAN SCORE DEVIATION ENG MATH SCI While you got the highest score in ENGL, this score was actually slightly below (by 1 point) the mean. In fact, it is likely (but not certain) that you scored in the bottom half of all students taking the test. On the other hand, you scored well above average in both of the other subjects (10 points in Math and 15 in SCI). Note that the magnitudes that we have just referred to here are your deviations from mean in each subject. Since your deviation from the mean is greatest with respect to SCI, this may appear to be your strongest subject. But this may not be the case.
6 Your Deviations from the Mean Compared with Other Deviations from the Mean While you have a deviation from the mean in each subject, so does every other student who took the test. Consider the distribution of SCI scores. Almost certainly quite a few students scored close the mean, but probably quite a few others scored well above the mean (like you) and others well below. On the one hand, but if most students scored very close to the mean (so the dispersion in test scores is small), your score of 72 would make you an outlier, scoring higher than almost all other students. On the other hand, if many students scored well above the mean (and since we know that the sum of all deviations from the mean must sum to zero many other students scored well below the mean, so the dispersion of test scores is large), your score of 72, while certainly good, would be less outstanding.
7 Your Deviations Compared with Other Deviations (cont.) Thus whether your score is outstanding or merely good depends not just on your score compared with the mean score but also on your deviation from the mean compared with other deviations from the mean, i.e., the dispersion of scores. Recall that the standard measure of dispersion the standard deviation itself is directly based on the deviations from the mean. Recall also that the SD of scores (though precisely defined as the square root of the average of all squared deviations) is approximately the same as (though usually somewhat greater than) the average of the absolute deviations from the mean.
8 Your Deviations from the Mean Compared with the Standard Deviation from the Mean SUBJECT SCORE MEAN SCORE DEVIATION SD ENG MATH SCI Thus, to get a sense of how outstanding your SCI and MATH scores are, we should look at how big your deviation from the mean is compared with the standard ( average ) deviation from the mean, by calculating the ratio of your deviation to the standard deviation. The result of this calculation is called your standard score.
9 Standard Scores SUBJEC T SCORE MEAN SCORE DEVIATION SD Z- SCORE ENG MATH SCI So in terms of your standard score, i.e., how your deviation from the mean compares with the standard deviation from the mean, it is evident that your best performance was actually in MATH (where you scored two standard deviations above the mean), compared with POLI (where you scored only one standard deviation above the mean). In ENGL you scored 1/8 of a standard deviation below the mean.
10 Computing a z-score X µ z= σ or z= X X SD
11 Examples of computing z-scores X X X z = X SD SD X X
12 Computing raw scores from z scores X = zσ + µ or X = zsd + X z = X X SD SD zsd X X
13 Other Variants of Standard Scores Approximately half of the people who take any test necessarily get negative standard scores. This unavoidable arithmetical fact apparently is regarded as demoralizing, so standard scores are commonly converted into so-called T-scores, which are all positive. By convention, T-scores are calculated by multiplying standard scores by 10 and then adding 50. IQ scores are also derived from standard scores, calculated by multiplying standard scores by 15 and then adding 100. The table below shows how you performed in the three subjects in terms of each of these scoring systems (where, as is conventional, all derived scores have been rounded to the nearest whole point). SUBJECT SCORE MEAN SCORE DEVIATION SD Z-SCORE T- SCORE IQ SCORE ENG MATH SCI
14 Review 1. Interpret a z score of 1 2. M = 10, SD = 2, X = 8. Z =? 3. M = 8, SD = 1, z = 3. X =? 4. What is the IQ score for a z score of 1? IQ scores are also derived from standard scores, calculated by multiplying standard scores by 15 and then adding 100.
15 REMEMBER To move from a raw score to a z score, what must we know about the raw score distribution? 1 mean and standard deviation 2 maximum and minimum 3 median and variance 4 mode and range
16 Application If Judy got a z score of 1.5 on an in-class exam, what can we say about her score relative to others who took the exam? 1 it is above average 2 it is average 3 it is below average 4 it is a B
17 Test your mastery of z If a raw score is 8, the mean is 10 and the standard deviation is 4, what is the z-score? 1: : : 0.5 4: 2.0
18 Test your mastery of z and the normal curve If a distribution is normally distributed, about what percent of the scores fall below +1 SD? 1: 15 2: 50 3: 85 4: 99
19 Your Percentile Rank in Each Subject? While it is extremely likely that your percentile rank among all students taking each test is highest in MATH and lowest in ENGL, we do not know this for sure in the absence of knowing the full frequency distribution of scores (as opposed to knowing only the two summary statistics: the mean and the SD). Much data particularly including tests scores, many other interval measures, and many types of sample statistics is (at least approximately) normally distributed. However, a lot of other data (especially ratio measures), such as weight, income (as we have seen), wealth, house prices, and many other ratio variables, is skewed with longer thin tails in the direction of (much) higher values while there is a zero-limit on the minimum value.
20 The Normal Distribution A normal distribution is a continuous frequency density that is a particular type of symmetric bell-shaped curve. Because the curve has a single peak and is symmetric about this peak, its mode, median, and mean values coincide at this peak. Most observed values lie relatively close (in way that is made more specific below) to the center of distribution, and their density falls off on either side of peak.

21 A Normal Curve
22 Normal Curve The shape of the distribution changes with only two parameters, σ and µ, so if we know these, we can determine everything else. Normal Curve Frequency Score (X) 2 4
23 Standard Normal Curve Standard normal curve has a mean of zero and an SD of 1. Probability (Relative Frequency) Standard Normal Curve % 13.59% 2.15% 50 Percent Scores in standard deviations from mu
24 Normal Curve and the z-score If X is normally distributed, there will be a correspondence between the standard normal curve and the z-score. Probability (Relative Frequency) Standard Normal Curve Scores in raw score units Scores in standard deviations from mu 9
25 Normal curve and z-scores We can use the information from the normal curve to estimate percentages from z-scores. Probability (Relative Frequency) Standard Normal Curve % 13.59% 2.15% 50 Percent Scores in standard deviations from mu
26 The Mean and SD of the Normal Distribution The mean of a normal distribution determines its location on the horizontal scale. The mean value of the distribution (here equal to the mode) is simply the value (point on the horizontal scale) of the variable that lies under the highest point on the curve. For example, if a constant amount is added to (or subtracted from) every value of the variable, the normal curve slides upwards (or downwards) by that constant amount. The standard deviation of a normal distribution determines how spread out the distribution is. Once the horizontal scale is fixed, if the SD is small, the curve has a high peak with sharp slopes on either side; if the SD is large, the curve it has a low peak with gentle slopes on either side.
27
 curve.")
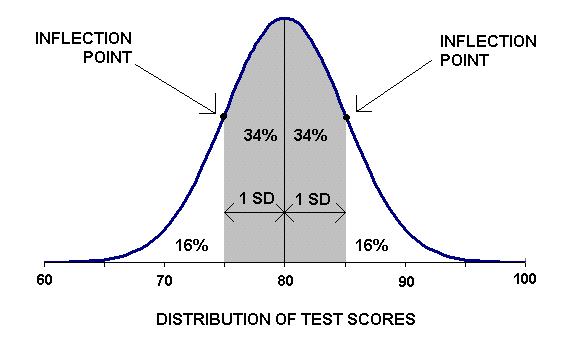
28 Finding the SD of a Normal Curve There is a precise connection between the shape of a normal curve and its SD. The two points of maximum steepness on either side of the peak are called the inflection points of the (normal) curve. It turns out (as a mathematical theorem) that horizontal distance from the mean to each inflection point is identical to the standard deviation of the normal curve.
29 Finding the SD of a Normal Curve (cont.) Here is another method for LOOKING AT the magnitude of the SD of a normal distribution. Put two vertical lines on either side of, and equidistant from, the peak and then draw them apart or bring them closer together (keeping them equidistant from the peak) until it appears that just about two-thirds of the areas under the curve lies in the interval between the two vertical lines. The horizontal distance from the mean to either line is equal to (a very good approximation of) the standard deviation of the distribution.
30
31 The 68%-95%-99.7% Rule More generally, we can state what is called the [approximate] 68%-95%-99.7% rule of the normal distribution. The rule is this: about 68% of all observed values lie within one SD of the mean, about 95% lie within two SDs of the mean, and about 99.7% (that is, virtually all) lie within three SDs of the mean. This is why no SAT scores below 200 [3 standard deviations below the mean] or above 800 [3 standard deviations above the mean] are reported. And here is another useful rule: in a normal distribution, half the cases have observed values that lie within about 2/3 of the SD of the mean, i.e., the first and third quartiles lie at just about 2/3 of a SD below and above the mean respectively, so In a normal distribution, the interquartile range is equal to about 1.33 SDs. All this is illustrated in the following chart, which shows a standardized normal curve, i.e., a normal curve in which the mean is set at 0 and the SD is set at 1. Put otherwise, the units on the horizontal scale shows standard scores.
32
33 Your Percentile Ranks (if Test Scores are Normally Distributed) Subject Stan. Score Percentile ENGL MATH SCI SCI
Today s plan: Section 4.2: Normal Distribution
 1 Today s plan: Section 4.2: Normal Distribution 2 Characteristics of a data set: mean median standard deviation five-number summary 2 Characteristics of a data set: mean median standard deviation five-number
PSY201: Chapter 5: The Normal Curve and Standard Scores
 PSY201: Chapter 5: The Normal Curve and Standard Scores Introduction: Normal curve + a very important distribution in behavior sciences + three principal reasons why... - 1. many of the variables measured
% per year Age (years)
") Stat 1001 Winter 1998 Geyer Homework 2 Problem 3.1 66 inches and 72 inches. Problem 3.2 % per year 0.0 0.5 1.0 1.5 0 20 40 60 80 Age (years) (a) Age 1. (b) More 31-year olds (c) More people age 35{44,
Stat 1001 Winter 1998 Geyer Homework 2 Problem 3.1 66 inches and 72 inches. Problem 3.2 % per year 0.0 0.5 1.0 1.5 0 20 40 60 80 Age (years) (a) Age 1. (b) More 31-year olds (c) More people age 35{44,
Frequency Distributions
 Descriptive Statistics Dr. Tom Pierce Department of Psychology Radford University Descriptive statistics comprise a collection of techniques for better understanding what the people in a group look like
Descriptive Statistics. Dr. Tom Pierce Department of Psychology Radford University
 Descriptive Statistics Dr. Tom Pierce Department of Psychology Radford University Descriptive statistics comprise a collection of techniques for better understanding what the people in a group look like
The pth percentile of a distribution is the value with p percent of the observations less than it.
 Describing Location in a Distribution (2.1) Measuring Position: Percentiles One way to describe the location of a value in a distribution is to tell what percent of observations are less than it. De#inition:
Chapter 2: Modeling Distributions of Data
 Chapter 2: Modeling Distributions of Data Section 2.1 The Practice of Statistics, 4 th edition - For AP* STARNES, YATES, MOORE Chapter 2 Modeling Distributions of Data 2.1 2.2 Normal Distributions Section
Warm-up. Make a bar graph to display these data. What additional information do you need to make a pie chart?
 Warm-up The number of deaths among persons aged 15 to 24 years in the United States in 1997 due to the seven leading causes of death for this age group were accidents, 12,958; homicide, 5,793; suicide,
Mrs. Daniel- AP Stats Ch. 2 MC Practice
 Mrs. Daniel- AP Stats Ch. 2 MC Practice Name: 1. Jorge s score on Exam 1 in his statistics class was at the 64th percentile of the scores for all students. His score falls (a) between the minimum and the
Internet Technology Fundamentals. To use a passing score at the percentiles listed below:
 Internet Technology Fundamentals To use a passing score at the percentiles listed below: PASS candidates with this score or HIGHER: 2.90 High Scores Medium Scores Low Scores Percentile Rank Proficiency
CHAPTER 2 Modeling Distributions of Data
 CHAPTER 2 Modeling Distributions of Data 2.2 Density Curves and Normal Distributions The Practice of Statistics, 5th Edition Starnes, Tabor, Yates, Moore Bedford Freeman Worth Publishers Density Curves
Name Date Period. E) Lowest score: 67, mean: 104, median: 112, range: 83, IQR: 102, Q1: 46, SD: 17
 Lowest score: 67, mean: 104, median: 112, range: 83, IQR: 102, Q1: 46, SD: 17") Chapter 6 Review Standards: 4, 7, 8, and 11 Name Date Period Write complete answers, using complete sentences where necessary. Show your work when possible. MULTIPLE CHOICE. Choose the one alternative
Chapter 6 Review Standards: 4, 7, 8, and 11 Name Date Period Write complete answers, using complete sentences where necessary. Show your work when possible. MULTIPLE CHOICE. Choose the one alternative
Unit 3 - Data. Grab a new packet from the chrome book cart. Unit 3 Day 1 PLUS Box and Whisker Plots.notebook September 28, /28 9/29 9/30?
 Unit 3 - Data Grab a new packet from the chrome book cart 9/28 9/29 9/30? 10/3 10/4 10/5 10/6 10/7-10/10 10/11 10/12 10/13 Practice ACT #1 Lesson 1: Box and Whisker Plots I can find the 5 number summary
Chapter 6 The Standard Deviation as a Ruler and the Normal Model
 Chapter 6 The Standard Deviation as a Ruler and the Normal Model Standardizing with z-scores Expressing data in terms of We standardize to Standardized values can be even if the original variables had
Full file at
 Chapter 2 1. Describe the distribution. survival times of persons diagnosed with terminal lymphoma A) approximately normal B) skewed left C) skewed right D) roughly uniform Ans: C Difficulty: low 2. Without
Aim: Normal Distribution and Bell Curve
 Aim: Normal Distribution and Bell Curve HW: Complete (1-10) last 3 slides Do Now: If the variance of a set of data is 9, the standard deviation is: (1) 9 (2) 81 (3) 3 (4) 1 Normal Distribution and Bell
Quantitative Literacy: Thinking Between the Lines
 Quantitative Literacy: Thinking Between the Lines Crauder, Noell, Evans, Johnson Chapter 6: Statistics 2013 W. H. Freeman and Company 1 Chapter 6: Statistics Lesson Plan Data summary and presentation:
How are the values related to each other? Are there values that are General Education Statistics
 How are the values related to each other? Are there values that are General Education Statistics far away from the others? Class Notes Measures of Position and Outliers: Z-scores, Percentiles, Quartiles,
3.3 - Measures of Position
 3.3 - Measures of Position Z-Scores Who is taller, a man 73 inches tall or a woman 68 inches tall? The obvious answer is that the man is taller. However, men are taller than women on the average. Let s
STAT 101 Assignment 1
 STAT 1 Assignment 1 1. From the text: # 1.30 on page 29. A: For the centre the median is 2, the mean is 2.62. I am happy with either for an answer and I am happy to have these read off roughly by eye.
Running head: DATA ANALYSIS AND INTERPRETATION 1
 Running head: DATA ANALYSIS AND INTERPRETATION 1 Data Analysis and Interpretation Final Project Vernon Tilly Jr. University of Central Oklahoma DATA ANALYSIS AND INTERPRETATION 2 Owners of the various
March Madness Basketball Tournament
 March Madness Basketball Tournament Math Project COMMON Core Aligned Decimals, Fractions, Percents, Probability, Rates, Algebra, Word Problems, and more! To Use: -Print out all the worksheets. -Introduce
Week 7 One-way ANOVA
 Week 7 One-way ANOVA Objectives By the end of this lecture, you should be able to: Understand the shortcomings of comparing multiple means as pairs of hypotheses. Understand the steps of the ANOVA method
March Madness Basketball Tournament
 March Madness Basketball Tournament Math Project COMMON Core Aligned Decimals, Fractions, Percents, Probability, Rates, Algebra, Word Problems, and more! To Use: -Print out all the worksheets. -Introduce
1. The data below gives the eye colors of 20 students in a Statistics class. Make a frequency table for the data.
 1. The data below gives the eye colors of 20 students in a Statistics class. Make a frequency table for the data. Green Blue Brown Blue Blue Brown Blue Blue Blue Green Blue Brown Blue Brown Brown Blue
Exploring Measures of Central Tendency (mean, median and mode) Exploring range as a measure of dispersion
 Exploring range as a measure of dispersion") Unit 5 Statistical Reasoning 1 5.1 Exploring Data Goals: Exploring Measures of Central Tendency (mean, median and mode) Exploring range as a measure of dispersion Data: A set of values. A set of data can
Unit 5 Statistical Reasoning 1 5.1 Exploring Data Goals: Exploring Measures of Central Tendency (mean, median and mode) Exploring range as a measure of dispersion Data: A set of values. A set of data can
Solutionbank S1 Edexcel AS and A Level Modular Mathematics
 Page 1 of 1 Exercise A, Question 1 A group of thirty college students was asked how many DVDs they had in their collection. The results are as follows. 12 25 34 17 12 18 29 34 45 6 15 9 25 23 29 22 20
Histogram. Collection
 Density Curves and Normal Distributions Suppose we looked at an exam given to a large population of students. The histogram of this data appears like the graph to the left below. However, rather than show
IHS AP Statistics Chapter 2 Modeling Distributions of Data MP1
 IHS AP Statistics Chapter 2 Modeling Distributions of Data MP1 Monday Tuesday Wednesday Thursday Friday August 22 A Day 23 B Day 24 A Day 25 B Day 26 A Day Ch1 Exploring Data Class Introduction Getting
(c) The hospital decided to collect the data from the first 50 patients admitted on July 4, 2010.
 The hospital decided to collect the data from the first 50 patients admitted on July 4, 2010.") Math 155, Test 1, 18 October 2011 Name: Instructions. This is a closed-book test. You may use a calculator (but not a cell phone). Make sure all cell-phones are put away and that the ringer is off. Show
Math 155, Test 1, 18 October 2011 Name: Instructions. This is a closed-book test. You may use a calculator (but not a cell phone). Make sure all cell-phones are put away and that the ringer is off. Show
DESCRIBE the effect of adding, subtracting, multiplying by, or dividing by a constant on the shape, center, and spread of a distribution of data.
 Today's Objectives: FIND and INTERPRET the standardized score (z-score) of an individual value within a distribution of data. DESCRIBE the effect of adding, subtracting, multiplying by, or dividing by
Unit 3 ~ Data about us
 Unit 3 ~ Data about us Investigation 3: Data Sets & Displays I can construct, interpret, and compare data sets and displays. I can find, interpret, and compare measures of center and variation for data
STT 315 Section /19/2014
 Name: PID: A STT 315 Section 101 05/19/2014 Quiz 1A 50 minutes 1. A survey by an electric company contains questions on the following: Age of household head, Gender of household head and use of electric
Organizing Quantitative Data
 Organizing Quantitative Data MATH 130, Elements of Statistics I J. Robert Buchanan Department of Mathematics Fall 2018 Objectives At the end of this lesson we will be able to: organize discrete data in
CHAPTER 2 Modeling Distributions of Data
 CHAPTER 2 Modeling Distributions of Data 2.1 Describing Location in a Distribution The Practice of Statistics, 5th Edition Starnes, Tabor, Yates, Moore Bedford Freeman Worth Publishers 2.1 Reading Quiz
Bivariate Data. Frequency Table Line Plot Box and Whisker Plot
 U04 D02 Univariate Data Frequency Table Line Plot Box and Whisker Plot Univariate Data Bivariate Data involving a single variable does not deal with causes or relationships the major purpose of univariate
Psychology - Mr. Callaway/Mundy s Mill HS Unit Research Methods - Statistics
 Psychology - Mr. Callaway/Mundy s Mill HS Unit 2.3 - Research Methods - Statistics How do psychologists ask & answer questions? Last time we asked that we were discussing Research Methods. This time we
CHAPTER 2 Modeling Distributions of Data
 CHAPTER 2 Modeling Distributions of Data 2.1 Describing Location in a Distribution The Practice of Statistics, 5th Edition Starnes, Tabor, Yates, Moore Bedford Freeman Worth Publishers Describing Location
Fundamentals of Machine Learning for Predictive Data Analytics
 Fundamentals of Machine Learning for Predictive Data Analytics Appendix A Descriptive Statistics and Data Visualization for Machine learning John Kelleher and Brian Mac Namee and Aoife D Arcy john.d.kelleher@dit.ie
DS5 The Normal Distribution. Write down all you can remember about the mean, median, mode, and standard deviation.
 DS5 The Normal Distribution Write down all you can remember about the mean, median, mode, and standard deviation. 1 DS5 The Normal Distribution Basic concepts: Describing and using Z scores calculated
4-3 Rate of Change and Slope. Warm Up. 1. Find the x- and y-intercepts of 2x 5y = 20. Describe the correlation shown by the scatter plot. 2.
 Warm Up 1. Find the x- and y-intercepts of 2x 5y = 20. Describe the correlation shown by the scatter plot. 2. Objectives Find rates of change and slopes. Relate a constant rate of change to the slope of
Reminders. Homework scores will be up by tomorrow morning. Please me and the TAs with any grading questions by tomorrow at 5pm
 Reminders Homework scores will be up by tomorrow morning Please email me and the TAs with any grading questions by tomorrow at 5pm 1 Chapter 12: Describing Distributions with Numbers Aaron Zimmerman STAT
Math 243 Section 4.1 The Normal Distribution
 Math 243 Section 4.1 The Normal Distribution Here are some roughly symmetric, unimodal histograms The Normal Model The famous bell curve Example 1. The mean annual rainfall in Portland is unimodal and
SAMPLE RH = P 1. where. P 1 = the partial pressure of the water vapor at the dew point temperature of the mixture of dry air and water vapor
 moisture starts to condense out of the air. The temperature at which this happens is called the dew point temperature, or the saturation temperature. What is commonly called saturation pressure or condensing
Measuring Relative Achievements: Percentile rank and Percentile point
 Measuring Relative Achievements: Percentile rank and Percentile point Consider an example where you receive the same grade on a test in two different classes. In which class did you do better? Why do we
Data Set 7: Bioerosion by Parrotfish Background volume of bites The question:
 Data Set 7: Bioerosion by Parrotfish Background Bioerosion of coral reefs results from animals taking bites out of the calcium-carbonate skeleton of the reef. Parrotfishes are major bioerosion agents,
Age of Fans
 Measures of Central Tendency SUGGESTED LEARNING STRATEGIES: Activating Prior Knowledge, Interactive Word Wall, Marking the Text, Summarize/Paraphrase/Retell, Think/Pair/Share Matthew is a student reporter
Descriptive Statistics
 Descriptive Statistics Descriptive Statistics vs Inferential Statistics Describing a sample Making inferences to a larger population Data = Information but too much information. How do we summarize data?
Averages. October 19, Discussion item: When we talk about an average, what exactly do we mean? When are they useful?
 Averages October 19, 2005 Discussion item: When we talk about an average, what exactly do we mean? When are they useful? 1 The Arithmetic Mean When we talk about an average, we can mean different things
Algebra 1 Unit 7 Day 2 DP Box and Whisker Plots.notebook April 10, Algebra I 04/10/18 Aim: How Do We Create Box and Whisker Plots?
 Algebra I 04/10/18 Aim: How Do We Create Box and Whisker Plots? DO NOW 1) Find the mean, median, and mode of the data below 2) Which measure of central tendency do you believe best represents the data?
AP STATISTICS Name Chapter 6 Applications Period: Use summary statistics to answer the question. Solve the problem.
 AP STATISTICS Chapter 6 Applications Name Period: Use summary statistics to answer the question. 1) The speed vehicles travelled on a local highway was recorded for one month. The speeds ranged from 48
Math 1040 Exam 2 - Spring Instructor: Ruth Trygstad Time Limit: 90 minutes
 Math 1040 Exam 2 - Spring 2012 Name Instructor: Ruth Trygstad Time Limit: 90 minutes Any calculator is okay, but no computers, cell phones or other hand-held devices are allowed. Tables and formulas are
Descriptive Stats. Review
 Descriptive Stats Review Categorical Data The Area Principal Distorts the data possibly making it harder to compare categories Everything should add up to 100% When we add up all of our categorical data,
How Fast Can You Throw?
 Name Date Period How Fast Can You Throw? Directions: Find a spot 40 feet from a wall and mark it with a piece of chalk. From that point, you will throw the ball 5 times with your right hand, and then five
THE NORMAL DISTRIBUTION COMMON CORE ALGEBRA II
 Name: Date: THE NORMAL DISTRIBUTION COMMON CORE ALGEBRA II Many populations have a distribution that can be well described with what is known as The Normal Distribution or the Bell Curve. This curve, as
Statistics. Wednesday, March 28, 2012
 Statistics Wednesday, March 28, 2012 Today's Agenda: 1. Collect HW #2: Activities 9 7 & 9 12 2. Go over HW #1: Activities 9 20 a f & 9 17 3. Practice calculating & s x 4. Activities 9 4, 9 5, 9 11, 9 13
b) (2 pts.) Does the study show that drinking 4 or more cups of coffee a day caused the higher death rate?
 (2 pts.) Does the study show that drinking 4 or more cups of coffee a day caused the higher death rate?") Question 1 (10 pts) A study published in the August 15, 2017 issue of Mayo Clinic Proceedings tracked 44,000 people aged 20 to 87 for an average of about 16 years and found that those who drank 4 or more
Question 1 (10 pts) A study published in the August 15, 2017 issue of Mayo Clinic Proceedings tracked 44,000 people aged 20 to 87 for an average of about 16 years and found that those who drank 4 or more
Stat 139 Homework 3 Solutions, Spring 2015
 Stat 39 Homework 3 Solutions, Spring 05 Problem. Let i Nµ, σ ) for i,..., n, and j Nµ, σ ) for j,..., n. Also, assume that all observations are independent from each other. In Unit 4, we learned that the
Effective Use of Box Charts
 Effective Use of Box Charts Purpose This tool provides guidelines and tips on how to effectively use box charts to communicate research findings. Format This tool provides guidance on box charts and their
Diameter in cm. Bubble Number. Bubble Number Diameter in cm
 Bubble lab Data Sheet Blow bubbles and measure the diameter to the nearest whole centimeter. Record in the tables below. Try to blow different sized bubbles. Name: Bubble Number Diameter in cm Bubble Number
In the actual exam, you will be given more space to work each problem, so work these problems on separate sheets.
 K300 Practice Exam 1 Note: This gives you an idea of the types of questions I ask. The length of the exam may differ. The questions are meant to be representative but not all-inclused (i.e. this is a sample
MATH 118 Chapter 5 Sample Exam By: Maan Omran
 MATH 118 Chapter 5 Sample Exam By: Maan Omran Problem 1-4 refer to the following table: X P Product a 0.2 d 0 0.1 e 1 b 0.4 2 c? 5 0.2? E(X) = 1.7 1. The value of a in the above table is [A] 0.1 [B] 0.2
WHAT IS THE ESSENTIAL QUESTION?
 WHAT IS THE ESSENTIAL QUESTION? Essential Question Essential Question Essential Question Essential Question Essential Question Essential Question Essential Question Week 3, Lesson 1 1. Warm up 2. Notes
STAT 155 Introductory Statistics. Lecture 2-2: Displaying Distributions with Graphs
 The UNIVERSITY of NORTH CAROLINA at CHAPEL HILL STAT 155 Introductory Statistics Lecture 2-2: Displaying Distributions with Graphs 8/31/06 Lecture 2-2 1 Recall Data: Individuals Variables Categorical variables
Unit 6 Day 2 Notes Central Tendency from a Histogram; Box Plots
 AFM Unit 6 Day 2 Notes Central Tendency from a Histogram; Box Plots Name Date To find the mean, median and mode from a histogram, you first need to know how many data points were used. Use the frequency
In my left hand I hold 15 Argentine pesos. In my right, I hold 100 Chilean
 Chapter 6 Meeting Standards and Standings In This Chapter How to standardize scores Making comparisons Ranks in files Rolling in the percentiles In my left hand I hold 15 Argentine pesos. In my right,
Practice Test Unit 6B/11A/11B: Probability and Logic
 Note to CCSD Pre-Algebra Teachers: 3 rd quarter benchmarks begin with the last 2 sections of Chapter 6, and then address Chapter 11 benchmarks; logic concepts are also included. We have combined probability
Section 3.2: Measures of Variability
 Section 3.2: Measures of Variability The mean and median are good statistics to employ when describing the center of a collection of data. However, there is more to a collection of data than just the center!
9.3 Histograms and Box Plots
 Name Class Date 9.3 Histograms and Box Plots Essential Question: How can you interpret and compare data sets using data displays? Explore Understanding Histograms Resource Locker A histogram is a bar graph
A Hare-Lynx Simulation Model
 1 A Hare- Simulation Model What happens to the numbers of hares and lynx when the core of the system is like this? Hares O Balance? S H_Births Hares H_Fertility Area KillsPerHead Fertility Births Figure
Practice Test Unit 06B 11A: Probability, Permutations and Combinations. Practice Test Unit 11B: Data Analysis
 Note to CCSD HS Pre-Algebra Teachers: 3 rd quarter benchmarks begin with the last 2 sections of Chapter 6 (probability, which we will refer to as 6B), and then address Chapter 11 benchmarks (which will
WorkSHEET 13.3 Univariate data II Name:
 WorkSHEET 13.3 Univariate data II Name: 1 The back-to-back stem-and-leaf plot shows the number of people (to the nearest thousand) that attend cricket matches in both Sydney and Melbourne during a season.
Math 227 Test 1 (Ch2 and 3) Name
 Name") Math 227 Test 1 (Ch2 and 3) Name 1) In a survey, 20 people were asked how many magazines they had purchased during the previous year. The results are shown below. Construct a histogram to represent the
Math 227 Test 1 (Ch2 and 3) Name 1) In a survey, 20 people were asked how many magazines they had purchased during the previous year. The results are shown below. Construct a histogram to represent the
Handicap Differential = (Adjusted Gross Score - USGA Course Rating) x 113 / USGA Slope Rating
 x 113 / USGA Slope Rating") FORMULAS Section 10 USGA HANDICAP FORMULA A Handicap Index is the USGA's mark which is used to indicate a measurement of a player's potential scoring ability on a course of standard difficulty. Potential
FORMULAS Section 10 USGA HANDICAP FORMULA A Handicap Index is the USGA's mark which is used to indicate a measurement of a player's potential scoring ability on a course of standard difficulty. Potential
CHAPTER 1 ORGANIZATION OF DATA SETS
 CHAPTER 1 ORGANIZATION OF DATA SETS When you collect data, it comes to you in more or less a random fashion and unorganized. For example, what if you gave a 35 item test to a class of 50 students and collect
Homework Exercises Problem Set 1 (chapter 2)
") 1 Name: Homework Exercises Problem Set 1 (chapter 2) Exercise 2.5.1 The 10 third-grade students at Lake Wobegone elementary school took a spelling test with 10 words, each worth one point. Given that the
1 Name: Homework Exercises Problem Set 1 (chapter 2) Exercise 2.5.1 The 10 third-grade students at Lake Wobegone elementary school took a spelling test with 10 words, each worth one point. Given that the
THE USGA HANDICAP SYSTEM. Reference Guide
 THE USGA HANDICAP SYSTEM Reference Guide THE USGA HANDICAP SYSTEM Reference Guide Copyright 2017 United States Golf Association All Rights Reserved Printed in the United States of America The USGA Handicap
Calculation of Trail Usage from Counter Data
 1. Introduction 1 Calculation of Trail Usage from Counter Data 1/17/17 Stephen Martin, Ph.D. Automatic counters are used on trails to measure how many people are using the trail. A fundamental question
5.1. Data Displays Batter Up. My Notes ACTIVITY
 SUGGESTED LEARNING STRATEGIES: Activating Prior Knowledge, Marking the Text, Group Presentation, Interactive Word Wall Henry Hank Aaron and Harmon Killebrew are among the alltime leaders in home runs in
4-3 Rate of Change and Slope. Warm Up Lesson Presentation. Lesson Quiz
 4-3 Rate of Change and Slope Warm Up Lesson Presentation Lesson Quiz Holt Algebra McDougal 1 Algebra 1 Warm Up 1. Find the x- and y-intercepts of 2x 5y = 20. x-int.: 10; y-int.: 4 Describe the correlation
Chapter 3.4. Measures of position and outliers. Julian Chan. September 11, Department of Mathematics Weber State University
 Chapter 3.4 Measures of position and outliers Julian Chan Department of Mathematics Weber State University September 11, 2011 Intro 1 We will talk about how to measure the position of an observation which
save percentages? (Name) (University)
 (University)") 1 IB Maths Essay: What is the correlation between the height of football players and their save percentages? (Name) (University) Table of Contents Raw Data for Analysis...3 Table 1: Raw Data...3 Rationale
1 IB Maths Essay: What is the correlation between the height of football players and their save percentages? (Name) (University) Table of Contents Raw Data for Analysis...3 Table 1: Raw Data...3 Rationale
Box-and-Whisker Plots
 Lesson 75 Objectives Calculate quartile values for a data set Create a box-and-whisker plot Quartiles and Box-and-Whisker Plots Richard recorded the number of people that attended his team s minor league
MEANS, MEDIANS and OUTLIERS
 ESSENTIAL MATHEMATICS 2 WEEK 3 NOTES AND EXERCISES MEANS, MEDIANS and OUTLIERS An outlier is a score much larger (or smaller) than others scores in the data set. Outliers can have a dramatic effect on
MEANS, MEDIANS and OUTLIERS
 ESSENTIAL MATHEMATICS 2 WEEK 3 NOTES AND EXERCISES MEANS, MEDIANS and OUTLIERS An outlier is a score much larger (or smaller) than others scores in the data set. Outliers can have a dramatic effect on
Scaled vs. Original Socre Mean = 77 Median = 77.1
 Have out... - notebook - colors - calculator (phone calc will work fine) Tests back as you come in! vocab example Tests Scaled vs. Original Socre Mean = 77 Median = 77.1 + Δ vocab example 1 2.1 Describing
Year 10 Term 2 Homework
 Yimin Math Centre Year 10 Term 2 Homework Student Name: Grade: Date: Score: Table of contents 6 Year 10 Term 2 Week 6 Homework 1 6.1 Data analysis and evaluation............................... 1 6.1.1
MATH 114 QUANTITATIVE REASONING PRACTICE TEST 2
 MATH 114 QUANTITATIVE REASONING PRACTICE TEST 2 1. Based on general features which the following data sets would most likely have (skew, outliers or lack of outliers, etc.), circle all of the following
North Point - Advance Placement Statistics Summer Assignment
 North Point - Advance Placement Statistics This assignment is due during the first week of class. It is considered an exam grade, which that category is worth approximately 60% of your total grade. All
Understanding Winter Road Conditions in Yellowstone National Park Using Cumulative Sum Control Charts
 1 Understanding Winter Road Conditions in Yellowstone National Park Using Cumulative Sum Control Charts Amber Nuxoll April 1st, 2014 Contents 1 Introduction 2 2 Data Collection and Background 2 3 Exploratory
Average Runs per inning,
 Home Team Scoring Advantage in the First Inning Largely Due to Time By David W. Smith Presented June 26, 2015 SABR45, Chicago, Illinois Throughout baseball history, the home team has scored significantly
UNIVERSITY OF CAMBRIDGE INTERNATIONAL EXAMINATIONS General Certificate of Education Ordinary Level
 UNIVERSITY OF CAMBRIDGE INTERNATIONAL EXAMINATIONS General Certificate of Education Ordinary Level *3373524824* STATISTICS 4040/23 Paper 2 October/November 2013 Candidates answer on the question paper.
Calculating Probabilities with the Normal distribution. David Gerard
 Calculating Probabilities with the Normal distribution David Gerard 2017-09-18 1 Learning Objectives Standardizing Variables Normal probability calculations. Section 3.1 of DBC 2 Standardizing Variables
Lab 5: Descriptive Statistics
 Page 1 Technical Math II Lab 5: Descriptive Stats Lab 5: Descriptive Statistics Purpose: To gain experience in the descriptive statistical analysis of a large (173 scores) data set. You should do most
Study Guide and Intervention
 Study Guide and Intervention Normal and Skewed Distributions A continuous probability distribution is represented by a curve. Types of Continuous Distributions Normal Positively Skewed Negatively Skewed
Lab 1. Adiabatic and reversible compression of a gas
 Lab 1. Adiabatic and reversible compression of a gas Introduction The initial and final states of an adiabatic and reversible volume change of an ideal gas can be determined by the First Law of Thermodynamics
SCIENTIFIC COMMITTEE SEVENTH REGULAR SESSION August 2011 Pohnpei, Federated States of Micronesia
 SCIENTIFIC COMMITTEE SEVENTH REGULAR SESSION 9-17 August 2011 Pohnpei, Federated States of Micronesia CPUE of skipjack for the Japanese offshore pole and line using GPS and catch data WCPFC-SC7-2011/SA-WP-09
46 Chapter 8 Statistics: An Introduction
 46 Chapter 8 Statistics: An Introduction Activity 5 Continued Box 4 1. The median is 6. The mode is 5. The mean is about 7 (6.8). 2. The median and the mode were unchanged, but the mean increased significantly.
CONCEPTUAL PHYSICS LAB
 PURPOSE The purpose of this lab is to determine the density of an unknown solid by direct calculation and by graphing mass vs. volume for several samples of the solid. INTRODUCTION Which is heavier, a
INSTITUTE AND FACULTY OF ACTUARIES. Curriculum 2019 AUDIT TRAIL
 INSTITUTE AND FACULTY OF ACTUARIES Curriculum 2019 AUDIT TRAIL Subject CP2 Actuarial Modelling Paper One Institute and Faculty of Actuaries Triathlon model Objective Each year on the Island of IFoA a Minister