One-factor ANOVA by example
|
|
|
- Myles Berry
- 5 years ago
- Views:
Transcription

1 ANOVA
2 One-factor ANOVA by example 2
3 One-factor ANOVA by visual inspection 3
4 4 One-factor ANOVA H 0 H 0 : µ 1 = µ 2 = µ 3 = H A : not all means are equal
5 5 One-factor ANOVA but why not t-tests t-tests? tests -> multiple comparisons The variance is not correctly estimated We need a method that uses the full dataset
6 6 One-factor ANOVA the cook book I Find the Within groups SS Fx: SS1 = x i x 2 i = = 14.4 Sum the sum of squares from each group: SS1+SS2+SS3+SS4 = =57.8 df = 20 Within group variance (residual variance) within group SS = = 57.8 = 2.9 df 20 Assumptions: Data is normal distributed and the variance is equal in the groups
7 7 One-factor ANOVA the cook book II Find the total SS SStot = x i x 2 df = 23 i = Find the between group SS (group mean) SSbetween = n x x 2 df = 3 s 2 = m = 6( ) = 82.1 between group SS df = = 27.4
8 8 The ANOVA table Outcome Sum of Squares ANOVA df Mean Square F Sig. Between Groups 82, ,375 9,467,0004 Within Groups 57, ,892 Total 139, Variance aka mean square aka s 2 is simply SS/df F is the Between SS divided by the Within SS
9 9 Assumptions The data needs to be normal distributed in the groups The variance needs to be equal in all groups: homoscedasticity The groups needs to be independent
10 10 Multiple comparisons procedures aka post hoc analysis Rejecting H 0 only states that one or more pairs of means are different, but not which. Tukeys multiple comparisons test as an example.
11 11 Tukeys multiple comparisons Rank the sample means: Rank Group µ SE = s2 n = 2,892 = 0,67 6 pair difference q H 0 3vs ,7 reject 3vs2 4,4 6,6 reject 3vs1 2 3,0 Do not reject 1vs4 2,5 3,7 Do not reject 1vs2 Don not test Do not reject 2vs4 Don not test Do not reject q = X 4 X 3 SE > 3,958? Outcome Sum of Squares ANOVA df Mean Square F Sig. Between Groups 82, ,375 9,467,000 Within Groups 57, ,892 Total 139,958 23

12 Tukeys multiple comparisons 12

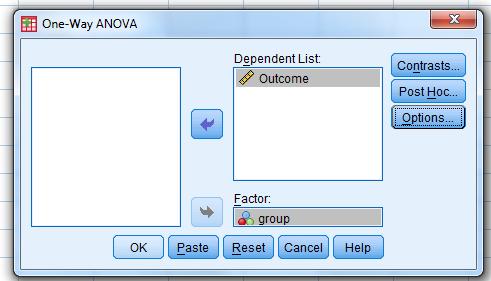
13 1-way ANOVA in SPSS 13
14 14 Exercise Is there i difference in the group mean? Group 1 Group 2 Group 3 28,00 34,00 33,00 20,00 30,00 38,00 27,00 41,00 27,00 29,00 17,00 36,00 36,00 28,00 25,00
15 15 Comparison between several medians Kruskal-Wallis test H 0 : The distribution of the groups are equal 1-Way ANOVA for non-normal data
16 16 Kruskal-Wallis test A few definitions: k is the number of groups n i: : the numner of observations in the i th group. N : total numner of observations R i : the sum of ranks in the i th group How to: Rank all observations Calculate the rank sum for each group Calculate H H is chi-square distributed with k-1 degrees of redom Look up the p-value in a table H 12 2 Ti ni 3 N N 1 N 1
17 Kruskal-Wallis test An example 17
18 18 Kruskal-Wallis test An example The data is ranked
19 19 Kruskal-Wallis test An example The data is ranked H is calculated 12 H ,2 63 6,
20 20 Kruskal-Wallis test An example The data is ranked H = 6,2 # d.f. = k-1 = 3

21 Kruskal-Wallis test in SPSS table7-1 21

22 Kruskal-Wallis test i SPSS 22
23 23 Kruskal-Wallis test i SPSS Ranks group N Mean Rank count 1,00 5 8,40 2, ,60 3,00 5 7,20 4, ,80 Total 20 Test Statistics a,b count Chi-Square 6,205 df 3 Asymp. Sig.,102 a. Kruskal Wallis Test b. Grouping Variable: group
24 24 Two-factor ANOVA with equal replications Experimental design: 2 2 (or 2 2 ) factorial with n = 5 replicate Total number of observations: N = = 20 Equal replications also termed orthogonality
25 25 The hypothesis H 0 : There is on effect of hormone treatment on the mean plasma concentration H 0 : There is on difference in mean plasma concentration between sexes H 0 : There is on interaction of sex and hormone treatment on the mean plasma concentration Why not just use one-way ANOVA with for levels?
26 26 How to do a 2-way ANOVA with equal replications Calculating means Calculate cell means: n Calculate the total mean (grand mean) Calculating treatment means 5 5 X 16,3 20,4 12,4 15,8 9,5 n l1 abl l1 11l X ab eg X X i n X a b i1 j1 l1 b N n j1 l1 bn X n ijl X ijl egx 21, ,5 14,88
27 27 How to do a 2-way ANOVA with equal replications Calculating general Sum of Squares Calculate total SS: totalss totaldf N a b i1 j1 l n X ijl X ,7175 Calculate the cell SS cells SS a n i 1 j 1 cells DF ab 1 3 b X ij X ,3255 Calculating within-cells error SS within - cells (error)ss n within - cells (error) DF ab a b i1 j1 l1 n 1 16 n X ijl X ij 2 301,3920
28 28 How to do a 2-way ANOVA with equal replications Calculating factor Sum of Squares Calculating factor A SS: factor A SS factor A DF a 1 1 a bn X i i 1 X ,1125 Calculating factor B SS factor BSS factor B DF b 1 1 b 1 an X j j X 2 70,3125 Calculating A B interaction SS A B interaction SS = cell SS factor A SS factor B SS = 4,9005 A B DF = cell DF factor A DF factor B DF = 1
29 How to do a 2-way ANOVA with equal replications Summary of calculations 29
30 30 How to do a 2-way ANOVA with equal replications Hypothesis test H 0 : There is on effect of hormone treatment on the mean plasma concentration F = hormone MS/within-cell MS = 1386,1125/18,8370 = 73,6 F 0,05(1),1,16 = 4,49 H 0 : There is on difference in mean plasma concentration between sexes F = sex MS/within-cell MS = 3,73 F 0,05(1),1,16 = 4,49 H 0 : There is on interaction of sex and hormone treatment on the mean plasma concentration F = A B MS/within-cell MS = 0,260 F 0,05(1),1,16 = 4,49
31 31 Visualizing 2-way ANOVA Table 12.2 and Figure 12.1

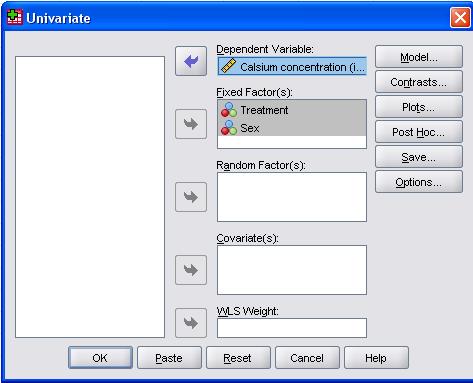
32 2-way ANOVA in SPSS 32

33 33 2-way ANOVA in SPSS Click Add
34 Visualizing 2-way ANOVA without interaction 34
35 Visualizing 2-way ANOVA with interaction 35
36 36 2-way ANOVA Random or fixed factor Random factor: Levels are selected at random Fixed factor: The value of each levels are of interest and selected on purpose.
37 37 2-way ANOVA Assumptions Independent levels of the each factor Normal distributed numbers in each cell Equal variance in each cell Bartletts homogenicity test (Section 10.7) s 2 ~ within cell MS; ~ within cell DF The ANOVA test is robust to small violations of the assumptions Data transformation is always an option (see chpter 13) There are no non-parametric alternative to the 2-way ANOVA
38 38 2-way ANOVA Multiple Comparisons Multiple comparisons tests ~ post hoc tests can be used as in one-way ANOVA Should only be performed if there is a main effect of the factor and no interaction
39 39 2-way ANOVA Confidence limits for means 95 % confidence limits for calcium concentrations on in birds without hormone treatment 2 s 95 % CI X1 t0,05(2), bn within cell DF;s 2 within cell MS
40 40 2-way ANOVA With proportional but unequal replications Proportional replications: n ij #row i# col j N
41 41 2-way ANOVA With disproportional replications Statistical packges as SPSS has porcedures for estimating missing values and correcting unballanced designs, eg using harmonic means Values should not be estimated by simple cell means Single values can be estimated, but remember to decrease the DF a b nij aai bb j ˆ i1 j1l 1 ijl X N 1 a b X ijl
42 42 2-way ANOVA With one replication Get more data!
43 2-way ANOVA Randomized block design 43
44 44 2-way ANOVA Repeated measures Repeating measurements in the same subject, like a paired t-test An additional assumption is that the correlation between pairs of groups is equal: compound symmetry if this is not the case, try multivariate ANOVA or linear mixed model
Introduction to Analysis of Variance (ANOVA) The Structural Model, The Summary Table, and the One- Way ANOVA
 The Structural Model, The Summary Table, and the One- Way ANOVA") Introduction to Analysis of Variance (ANOVA) The Structural Model, The Summary Table, and the One- Way ANOVA Limitations of the t-test Although the t-test is commonly used, it has limitations Can only
Introduction to Analysis of Variance (ANOVA) The Structural Model, The Summary Table, and the One- Way ANOVA Limitations of the t-test Although the t-test is commonly used, it has limitations Can only
A few things to remember about ANOVA
 A few things to remember about ANOVA 1) The F-test that is performed is always 1-tailed. This is because your alternative hypothesis is always that the between group variation is greater than the within
Analysis of Variance. Copyright 2014 Pearson Education, Inc.
 Analysis of Variance 12-1 Learning Outcomes Outcome 1. Understand the basic logic of analysis of variance. Outcome 2. Perform a hypothesis test for a single-factor design using analysis of variance manually
Factorial Analysis of Variance
 Factorial Analysis of Variance Overview of the Factorial ANOVA Factorial ANOVA (Two-Way) In the context of ANOVA, an independent variable (or a quasiindependent variable) is called a factor, and research
Class 23: Chapter 14 & Nested ANOVA NOTES: NOTES: NOTES:
 Slide 1 Chapter 13: ANOVA for 2-way classifications (2 of 2) Fixed and Random factors, Model I, Model II, and Model III (mixed model) ANOVA Chapter 14: Unreplicated Factorial & Nested Designs Slide 2 HW
Stats 2002: Probabilities for Wins and Losses of Online Gambling
 Abstract: Jennifer Mateja Andrea Scisinger Lindsay Lacher Stats 2002: Probabilities for Wins and Losses of Online Gambling The objective of this experiment is to determine whether online gambling is a
MGB 203B Homework # LSD = 1 1
 MGB 0B Homework # 4.4 a α =.05: t = =.05 LSD = α /,n k t.05, 7 t α /,n k MSE + =.05 700 + = 4.8 n i n j 0 0 i =, j = 8.7 0.4 7. i =, j = 8.7.7 5.0 i =, j = 0.4.7. Conclusion: µ differs from µ and µ. b
Unit 4: Inference for numerical variables Lecture 3: ANOVA
 Unit 4: Inference for numerical variables Lecture 3: ANOVA Statistics 101 Thomas Leininger June 10, 2013 Announcements Announcements Proposals due tomorrow. Will be returned to you by Wednesday. You MUST
ANOVA - Implementation.
 ANOVA - Implementation http://www.pelagicos.net/classes_biometry_fa17.htm Doing an ANOVA With RCmdr Categorical Variable One-Way ANOVA Testing a single Factor dose with 3 treatments (low, mid, high) Doing
One-way ANOVA: round, narrow, wide
 5/4/2009 9:19:18 AM Retrieving project from file: 'C:\DOCUMENTS AND SETTINGS\BOB S\DESKTOP\RJS\COURSES\MTAB\FIRSTBASE.MPJ' ========================================================================== This
PLANNED ORTHOGONAL CONTRASTS
 PLANNED ORTHOGONAL CONTRASTS Please note: This handout is useful background for the workshop, not what s covered in it. Basic principles for contrasts are the same in repeated measures. Planned orthogonal
Experimental Design and Data Analysis Part 2
 Experimental Design and Data Analysis Part 2 Assump@ons for Parametric Tests t- test and ANOVA Independence Variance Normality t-test Yes Yes Yes ANOVA Yes Yes Yes Lecture 7 AEC 460 Assume homogeneity
Legendre et al Appendices and Supplements, p. 1
 Legendre et al. 2010 Appendices and Supplements, p. 1 Appendices and Supplement to: Legendre, P., M. De Cáceres, and D. Borcard. 2010. Community surveys through space and time: testing the space-time interaction
Chapter 13. Factorial ANOVA. Patrick Mair 2015 Psych Factorial ANOVA 0 / 19
 Chapter 13 Factorial ANOVA Patrick Mair 2015 Psych 1950 13 Factorial ANOVA 0 / 19 Today s Menu Now we extend our one-way ANOVA approach to two (or more) factors. Factorial ANOVA: two-way ANOVA, SS decomposition,
Statistical Analysis of PGA Tour Skill Rankings USGA Research and Test Center June 1, 2007
 Statistical Analysis of PGA Tour Skill Rankings 198-26 USGA Research and Test Center June 1, 27 1. Introduction The PGA Tour has recorded and published Tour Player performance statistics since 198. All
Name May 3, 2007 Math Probability and Statistics
 Name May 3, 2007 Math 341 - Probability and Statistics Long Exam IV Instructions: Please include all relevant work to get full credit. Encircle your final answers. 1. An article in Professional Geographer
Week 7 One-way ANOVA
 Week 7 One-way ANOVA Objectives By the end of this lecture, you should be able to: Understand the shortcomings of comparing multiple means as pairs of hypotheses. Understand the steps of the ANOVA method
Factorial ANOVA Problems
 Factorial ANOVA Problems Q.1. In a 2-Factor ANOVA, measuring the effects of 2 factors (A and B) on a response (y), there are 3 levels each for factors A and B, and 4 replications per treatment combination.
Example 1: One Way ANOVA in MINITAB
 Example : One Way ANOVA in MINITAB A consumer group wants to compare a new brand of wax (Brand-X) to two leading brands (Sureglow and Microsheen) in terms of Effectiveness of wax. Following data is collected
Biostatistics & SAS programming
 Biostatistics & SAS programming Kevin Zhang March 6, 2017 ANOVA 1 Two groups only Independent groups T test Comparison One subject belongs to only one groups and observed only once Thus the observations
DOCUMENT RESUME. A Comparison of Type I Error Rates of Alpha-Max with Established Multiple Comparison Procedures. PUB DATE NOTE
 DOCUMENT RESUME ED 415 284 TM 028 030 AUTHOR Barnette, J. Jackson; McLean, James E. TITLE A Comparison of Type I Error Rates of Alpha-Max with Established Multiple Comparison Procedures. PUB DATE 1997-11-13
Announcements. Lecture 19: Inference for SLR & Transformations. Online quiz 7 - commonly missed questions
 Announcements Announcements Lecture 19: Inference for SLR & Statistics 101 Mine Çetinkaya-Rundel April 3, 2012 HW 7 due Thursday. Correlation guessing game - ends on April 12 at noon. Winner will be announced
Case Processing Summary. Cases Valid Missing Total N Percent N Percent N Percent % 0 0.0% % % 0 0.0%
 GET FILE='C:\Users\acantrell\Desktop\demo5.sav'. DATASET NAME DataSet1 WINDOW=FRONT. EXAMINE VARIABLES=PASSYDSPG RUSHYDSPG /PLOT BOXPLOT HISTOGRAM /COMPARE GROUPS /STATISTICS DESCRIPTIVES /CINTERVAL 95
Stat 139 Homework 3 Solutions, Spring 2015
 Stat 39 Homework 3 Solutions, Spring 05 Problem. Let i Nµ, σ ) for i,..., n, and j Nµ, σ ) for j,..., n. Also, assume that all observations are independent from each other. In Unit 4, we learned that the
Chapter 2: ANOVA and regression. Caroline Verhoeven
 Chapter 2: ANOVA and regression Caroline Verhoeven Table of contents 1 ANOVA One-way ANOVA Repeated measures ANOVA Two-way ANOVA 2 Regression Simple linear regression Multiple regression 3 Conclusion Caroline
Navigate to the golf data folder and make it your working directory. Load the data by typing
 Golf Analysis 1.1 Introduction In a round, golfers have a number of choices to make. For a particular shot, is it better to use the longest club available to try to reach the green, or would it be better
Multilevel Models for Other Non-Normal Outcomes in Mplus v. 7.11
 Multilevel Models for Other Non-Normal Outcomes in Mplus v. 7.11 Study Overview: These data come from a daily diary study that followed 41 male and female college students over a six-week period to examine
Data Set 7: Bioerosion by Parrotfish Background volume of bites The question:
 Data Set 7: Bioerosion by Parrotfish Background Bioerosion of coral reefs results from animals taking bites out of the calcium-carbonate skeleton of the reef. Parrotfishes are major bioerosion agents,
Setting up group models Part 1 NITP, 2011
 Setting up group models Part 1 NITP, 2011 What is coming up Crash course in setting up models 1-sample and 2-sample t-tests Paired t-tests ANOVA! Mean centering covariates Identifying rank deficient matrices
N Length (μm) % with eyespots Pilot ± ± ± ± ± ± ± ± 16 70
 % with eyespots Pilot ± ± ± ± ± ± ± ± 16 70") Supplementar material for Meer KS, Wheeler JD, Houlihan E, Mullineaux LS (2018) Desperate planktotrophs: decreased settlement selectivit with age in competent eastern oster (Crassostrea virginica) larvae.
Supplementar material for Meer KS, Wheeler JD, Houlihan E, Mullineaux LS (2018) Desperate planktotrophs: decreased settlement selectivit with age in competent eastern oster (Crassostrea virginica) larvae.
Safety at Intersections in Oregon A Preliminary Update of Statewide Intersection Crash Rates
 Portland State University PDXScholar Civil and Environmental Engineering Master's Project Reports Civil and Environmental Engineering 2015 Safety at Intersections in Oregon A Preliminary Update of Statewide
Unit4: Inferencefornumericaldata 4. ANOVA. Sta Spring Duke University, Department of Statistical Science
 Unit4: Inferencefornumericaldata 4. ANOVA Sta 101 - Spring 2016 Duke University, Department of Statistical Science Dr. Çetinkaya-Rundel Slides posted at http://bit.ly/sta101_s16 Outline 1. Housekeeping
Select Boxplot -> Multiple Y's (simple) and select all variable names.
 and select all variable names.") One Factor ANOVA in Minitab As an example, we will use the data below. A study looked at the days spent in the hospital for different regions of the United States. Can the company reject the claim the
One Factor ANOVA in Minitab As an example, we will use the data below. A study looked at the days spent in the hospital for different regions of the United States. Can the company reject the claim the
One Way ANOVA (Analysis of Variance)
") One Wa ANOVA (Analsis of Variance) The one-wa analsis of variance (ANOVA) is used to determine whether there are an significant differences between the means of two or more independent (unrelated) groups
One Wa ANOVA (Analsis of Variance) The one-wa analsis of variance (ANOVA) is used to determine whether there are an significant differences between the means of two or more independent (unrelated) groups
Running head: DATA ANALYSIS AND INTERPRETATION 1
 Running head: DATA ANALYSIS AND INTERPRETATION 1 Data Analysis and Interpretation Final Project Vernon Tilly Jr. University of Central Oklahoma DATA ANALYSIS AND INTERPRETATION 2 Owners of the various
CHAPTER ANALYSIS AND INTERPRETATION Average total number of collisions for a try to be scored
 CHAPTER 8 8.1 ANALYSIS AND INTERPRETATION As mentioned in the previous chapter, four key components have been identified as indicators of the level of significance of dominant collisions when evaluating
Comparison of recruitment tile materials for monitoring coralline algae responses to a changing climate
 The following supplement accompanies the article Comparison of recruitment tile materials for monitoring coralline algae responses to a changing climate Emma V. Kennedy*, Alexandra Ordoñez, Bonnie E. Lewis,
Chapter 12 Practice Test
 Chapter 12 Practice Test 1. Which of the following is not one of the conditions that must be satisfied in order to perform inference about the slope of a least-squares regression line? (a) For each value
Driv e accu racy. Green s in regul ation
 LEARNING ACTIVITIES FOR PART II COMPILED Statistical and Measurement Concepts We are providing a database from selected characteristics of golfers on the PGA Tour. Data are for 3 of the players, based
CPUE standardization of black marlin (Makaira indica) caught by Taiwanese large scale longline fishery in the Indian Ocean
 caught by Taiwanese large scale longline fishery in the Indian Ocean") CPUE standardization of black marlin (Makaira indica) caught by Taiwanese large scale longline fishery in the Indian Ocean Sheng-Ping Wang Department of Environmental Biology and Fisheries Science, National
CPUE standardization of black marlin (Makaira indica) caught by Taiwanese large scale longline fishery in the Indian Ocean Sheng-Ping Wang Department of Environmental Biology and Fisheries Science, National
Session 2: Introduction to Multilevel Modeling Using SPSS
 Session 2: Introduction to Multilevel Modeling Using SPSS Exercise 1 Description of Data: exerc1 This is a dataset from Kasia Kordas s research. It is data collected on 457 children clustered in schools.
Addendum to SEDAR16-DW-22
 Addendum to SEDAR16-DW-22 Introduction Six king mackerel indices of abundance, two for each region Gulf of Mexico, South Atlantic, and Mixing Zone, were constructed for the SEDAR16 data workshop using
Lab 11: Introduction to Linear Regression
 Lab 11: Introduction to Linear Regression Batter up The movie Moneyball focuses on the quest for the secret of success in baseball. It follows a low-budget team, the Oakland Athletics, who believed that
y ) s x x )(y i (x i r = 1 n 1 s y Statistics Lecture 7 Exploring Data , y 2 ,y n (x 1 ),,(x n ),(x 2 ,y 1 How two variables vary together
 s x x )(y i (x i r = 1 n 1 s y Statistics Lecture 7 Exploring Data , y 2 ,y n (x 1 ),,(x n ),(x 2 ,y 1 How two variables vary together") Statistics 111 - Lecture 7 Exploring Data Numerical Summaries for Relationships between Variables Administrative Notes Homework 1 due in recitation: Friday, Feb. 5 Homework 2 now posted on course website:
Statistics 111 - Lecture 7 Exploring Data Numerical Summaries for Relationships between Variables Administrative Notes Homework 1 due in recitation: Friday, Feb. 5 Homework 2 now posted on course website:
INFORMATIONAL LEAFLET NO. 2. Length-Width Relationships of Carapace. Measurements of the King Crab
 INFORMATIONAL LEAFLET NO. 2 Length-Width Relationships of Carapace Measurements of the King Crab (Parali thodes camtschatica) Roy Ri ckey-westward Regional Di rector Alaska Department of Fish and Game
Confidence Interval Notes Calculating Confidence Intervals
 Confidence Interval Notes Calculating Confidence Intervals Calculating One-Population Mean Confidence Intervals for Quantitative Data It is always best to use a computer program to make these calculations,
Guide to Computing Minitab commands used in labs (mtbcode.out)
") Guide to Computing Minitab commands used in labs (mtbcode.out) A full listing of Minitab commands can be found by invoking the HELP command while running Minitab. A reference card, with listing of available
Guide to Computing Minitab commands used in labs (mtbcode.out) A full listing of Minitab commands can be found by invoking the HELP command while running Minitab. A reference card, with listing of available
Empirical Example II of Chapter 7
 Empirical Example II of Chapter 7 1. We use NBA data. The description of variables is --- --- --- storage display value variable name type format label variable label marr byte %9.2f =1 if married wage
ASTERISK OR EXCLAMATION POINT?: Power Hitting in Major League Baseball from 1950 Through the Steroid Era. Gary Evans Stat 201B Winter, 2010
 ASTERISK OR EXCLAMATION POINT?: Power Hitting in Major League Baseball from 1950 Through the Steroid Era by Gary Evans Stat 201B Winter, 2010 Introduction: After a playerʼs strike in 1994 which resulted
Economic Value of Celebrity Endorsements:
 Economic Value of Celebrity Endorsements: Tiger Woods Impact on Sales of Nike Golf Balls September 27, 2012 On Line Appendix The Golf Equipments Golf Bags Golf bags are designed to transport the golf clubs
Prokopios Chatzakis, National and Kapodistrian University of Athens, Faculty of Physical Education and Sport Science 1
 Differences between geographic areas (continents) in the distribution of medals at the Beijing Olympic Games 2008 and at the London Olympic Games. Prokopios Chatzakis, National and Kapodistrian University
Pressured Applied by the Emergency/Israeli Bandage
 Pressured Applied by the Emergency/Israeli Bandage By Charles S. Lessard, Ph.D. Nolan Shipman, M.D. Amanda Bickham Jasper Butler 9 December 2007 1 Introduction At the request of Performance Systems, this
Guidelines for Applying Multilevel Modeling to the NSCAW Data
 Guidelines for Applying Multilevel Modeling to the NSCAW Data by Sharon Christ, Paul Biemer and Christopher Wiesen Odum Institute for Research in Social Science May 2007 Summary. This document is intended
Supplementary Online Content
 Supplementary Online Content McEvoy JP, Byerly M, Hamer RM, et al. Effectiveness of Paliperidone Palmitate vs Haloperidol Decanoate for Maintenance Treatment of Schizophrenia: a Randomized Clinical Trial.
Section I: Multiple Choice Select the best answer for each problem.
 Inference for Linear Regression Review Section I: Multiple Choice Select the best answer for each problem. 1. Which of the following is NOT one of the conditions that must be satisfied in order to perform
BBS Fall Conference, 16 September Use of modeling & simulation to support the design and analysis of a new dose and regimen finding study
 BBS Fall Conference, 16 September 211 Use of modeling & simulation to support the design and analysis of a new dose and regimen finding study Didier Renard Background (1) Small molecule delivered by lung
THE DEVELOPMENTOF A PREDICTION MODEL OF THE PASSENGER CAR EQUIVALENT VALUES AT DIFFERENT LOCATIONS
 THE DEVELOPMENTOF A PREDICTION MODEL OF THE PASSENGER CAR EQUIVALENT VALUES AT DIFFERENT LOCATIONS Nurul Hidayati 1, Ronghui Liu 2 and Frank Montgomery 2 1 Civil Engineering, Postgraduate Program Department,
Puyallup Tribe of Indians Shellfish Department
 Puyallup Tribe of Indians Shellfish Department Dungeness crab trap catch efficiency related to escape ring location and size George Stearns* 1, Robert Conrad 2, David Winfrey 1, Nancy Shippentower-Games
United States Commercial Vertical Line Vessel Standardized Catch Rates of Red Grouper in the US South Atlantic,
 SEDAR19-DW-14 United States Commercial Vertical Line Vessel Standardized Catch Rates of Red Grouper in the US South Atlantic, 1993-2008 Kevin McCarthy and Neil Baertlein National Marine Fisheries Service,
Reported walking time and measured distances to water sources: Implications for measuring Basic Service
 Reported walking time and measured distances to water sources: Implications for measuring Basic Service Anna Murray1, Maeve Kennard1, Daniele Lantagne2 1, 2Tufts University UNC Water and Health 2018 Background
1. In a hypothesis test involving two-samples, the hypothesized difference in means must be 0. True. False
 STAT 350 (Spring 2016) Homework 9 Online 1 1. In a hypothesis test involving two-samples, the hypothesized difference in means must be 0. 2. The two-sample Z test can be used only if both population variances
Major League Baseball Offensive Production in the Designated Hitter Era (1973 Present)
") Major League Baseball Offensive Production in the Designated Hitter Era (1973 Present) Jonathan Tung University of California, Riverside tung.jonathanee@gmail.com Abstract In Major League Baseball, there
Major League Baseball Offensive Production in the Designated Hitter Era (1973 Present) Jonathan Tung University of California, Riverside tung.jonathanee@gmail.com Abstract In Major League Baseball, there
DISMAS Evaluation: Dr. Elizabeth C. McMullan. Grambling State University
 DISMAS Evaluation 1 Running head: Project Dismas Evaluation DISMAS Evaluation: 2007 2008 Dr. Elizabeth C. McMullan Grambling State University DISMAS Evaluation 2 Abstract An offender notification project
WATER OIL RELATIVE PERMEABILITY COMPARATIVE STUDY: STEADY VERSUS UNSTEADY STATE
 SCA2005-77 1/7 WATER OIL RELATIVE PERMEABILITY COMPARATIVE STUDY: STEADY VERSUS UNSTEADY STATE 1 Marcelo M. Kikuchi, 1 Celso C.M. Branco, 2 Euclides J. Bonet, 2 Rosângela M.Zanoni, 1 Carlos M. Paiva 1
Daftar Perusahaan Otomotif yang Terdatar di Bursa Efek Indonesia(Periode )
") 114 Lampiran 1: Populasi Penelitian Daftar Perusahaan Otomotif yang Terdatar di Bursa Efek Indonesia(Periode 2006 2012) 89 1 PT. Astra Internasional Tbk. ASII 2 PT. Astra Otoparts Tbk. AUTO 3 PT. Indo
114 Lampiran 1: Populasi Penelitian Daftar Perusahaan Otomotif yang Terdatar di Bursa Efek Indonesia(Periode 2006 2012) 89 1 PT. Astra Internasional Tbk. ASII 2 PT. Astra Otoparts Tbk. AUTO 3 PT. Indo
MJA Rev 10/17/2011 1:53:00 PM
 Problem 8-2 (as stated in RSM Simplified) Leonard Lye, Professor of Engineering and Applied Science at Memorial University of Newfoundland contributed the following case study. It is based on the DOE Golfer,
APPENDIX A COMPUTATIONALLY GENERATED RANDOM DIGITS 748 APPENDIX C CHI-SQUARE RIGHT-HAND TAIL PROBABILITIES 754
 IV Appendices APPENDIX A COMPUTATIONALLY GENERATED RANDOM DIGITS 748 APPENDIX B RANDOM NUMBER TABLES 750 APPENDIX C CHI-SQUARE RIGHT-HAND TAIL PROBABILITIES 754 APPENDIX D LINEAR INTERPOLATION 755 APPENDIX
Math SL Internal Assessment What is the relationship between free throw shooting percentage and 3 point shooting percentages?
 Math SL Internal Assessment What is the relationship between free throw shooting percentage and 3 point shooting percentages? fts6 Introduction : Basketball is a sport where the players have to be adept
Water Quality Monitoring of Maryland s Tidal Waterways
 Water Quality Monitoring of Maryland s Tidal Waterways Rosemary K. Le a,christopher V. Rackauckas b, Annie S. Ross c, Nehemias Ulloa d, Graduate Assistant: Sai K. Popuri e Faculty Mentor: Dr. Nagaraj Neerchal
Announcements. % College graduate vs. % Hispanic in LA. % College educated vs. % Hispanic in LA. Problem Set 10 Due Wednesday.
 Announcements Announcements UNIT 7: MULTIPLE LINEAR REGRESSION LECTURE 1: INTRODUCTION TO MLR STATISTICS 101 Problem Set 10 Due Wednesday Nicole Dalzell June 15, 2015 Statistics 101 (Nicole Dalzell) U7
Design of Experiments Example: A Two-Way Split-Plot Experiment
 Design of Experiments Example: A Two-Way Split-Plot Experiment A two-way split-plot (also known as strip-plot or split-block) design consists of two split-plot components. In industry, these designs arise
ANALYZE OF RESULTS OF THE KOSOVO SWIMMERS ALONG EIGHT YEAR PERIOD, BREASTSTROKE TECHNIQUE AT DISCIPLINES 50 AND 200 METERS
 Gllareva Ilir, Halilaj Besim, University of Montenegro, Koca Afrim, University of Prishtina UDK: 797.212.2(497.115) ANALYZE OF RESULTS OF THE KOSOVO SWIMMERS ALONG EIGHT YEAR PERIOD, BREASTSTROKE TECHNIQUE
STANDARDIZED CATCH RATES OF BLUEFIN TUNA, THUNNUS THYNNUS, FROM THE ROD AND REEL/HANDLINE FISHERY OFF THE NORTHEAST UNITED STATES DURING
 SCRS/2008/088 STANDARDIZED CATCH RATES OF BLUEFIN TUNA, THUNNUS THYNNUS, FROM THE ROD AND REEL/HANDLINE FISHERY OFF THE NORTHEAST UNITED STATES DURING 1980-2007 by Craig A. Brown 1 Sustainable Fisheries
Navel orangeworm biology, monitoring, and management
 Navel orangeworm biology, monitoring, and management Chuck Burks 1, Elizabeth Fichtner 2, and Brad Higbee 3 1 USDA-ARS, Parlier, CA 2 UCCE, Tulare, CA 3 Paramount Farming, Bakersfield, CA Topics, NOW Monitoring
Midterm Exam 1, section 2. Thursday, September hour, 15 minutes
 San Francisco State University Michael Bar ECON 312 Fall 2018 Midterm Exam 1, section 2 Thursday, September 27 1 hour, 15 minutes Name: Instructions 1. This is closed book, closed notes exam. 2. You can
The Simple Linear Regression Model ECONOMETRICS (ECON 360) BEN VAN KAMMEN, PHD
 BEN VAN KAMMEN, PHD") The Simple Linear Regression Model ECONOMETRICS (ECON 360) BEN VAN KAMMEN, PHD Outline Definition. Deriving the Estimates. Properties of the Estimates. Units of Measurement and Functional Form. Expected
The Simple Linear Regression Model ECONOMETRICS (ECON 360) BEN VAN KAMMEN, PHD Outline Definition. Deriving the Estimates. Properties of the Estimates. Units of Measurement and Functional Form. Expected
Taking Your Class for a Walk, Randomly
 Taking Your Class for a Walk, Randomly Daniel Kaplan Macalester College Oct. 27, 2009 Overview of the Activity You are going to turn your students into an ensemble of random walkers. They will start at
PERFORMANCE OF LIGHT WEIGHT STOCKER CALVES GRAZING SUMMER NATIVE RANGE WITH 25 OR 40% PROTEIN SUPPLEMENTS
 PERFORMANCE OF LIGHT WEIGHT STOCKER CALVES GRAZING SUMMER NATIVE RANGE WITH 25 OR 40% PROTEIN SUPPLEMENTS H. T. Purvis II 1, C. R. Floyd 1 and K. S. Lusby 2 Story in Brief Trials were conducted to evaluate
An Empirical Comparison of Regression Analysis Strategies with Discrete Ordinal Variables
 Kromrey & Rendina-Gobioff An Empirical Comparison of Regression Analysis Strategies with Discrete Ordinal Variables Jeffrey D. Kromrey Gianna Rendina-Gobioff University of South Florida The Type I error
Research Method Validation
 Evaluation of FECPAK and McMaster methodology for counting nematode eggs in sheep faeces Author: Good, B., Hanrahan, J.P. & Crowley, B.A. - Teagasc Research Centre, Athenry Co. Galway, Irelan Introduction
Nonlife Actuarial Models. Chapter 7 Bühlmann Credibility
 Nonlife Actuarial Models Chapter 7 Bühlmann Credibility Learning Objectives 1. Basic framework of Bühlmann credibility 2. Variance decomposition 3. Expected value of the process variance 4. Variance of
Confidence Intervals with proportions
 Confidence Intervals with proportions a.k.a., 1-proportion z-intervals AP Statistics Chapter 19 1-proportion z-interval Statistic + Critical value Standard deviation of the statistic POINT ESTIMATE STANDARD
GLMM standardisation of the commercial abalone CPUE for Zones A-D over the period
 GLMM standardisation of the commercial abalone for Zones A-D over the period 1980 2015 Anabela Brandão and Doug S. Butterworth Marine Resource Assessment & Management Group (MARAM) Department of Mathematics
Policy Management: How data and information impacts the ability to make policy decisions:
 Policy Management: How data and information impacts the ability to make policy decisions: Louis Cripps Regional Transportation District, Asset Management Denver, Colorado Quick exercise... What do these
Real-Time Electricity Pricing
 Real-Time Electricity Pricing Xi Chen, Jonathan Hosking and Soumyadip Ghosh IBM Watson Research Center / Northwestern University Yorktown Heights, NY, USA X. Chen, J. Hosking & S. Ghosh (IBM) Real-Time
PradiptaArdiPrastowo Sport Science. SebelasMaret University. Indonesia
 The Influence of the Volley Ball Serve Training Methods to the Overhand Serve Skills from Gender Consideration (An Experiment Research using the Near Target to Far Target and the Far Target to Nearer Target
NCSS Statistical Software
 Chapter 256 Introduction This procedure computes summary statistics and common non-parametric, single-sample runs tests for a series of n numeric, binary, or categorical data values. For numeric data,
A Combined Recruitment Index for Demersal Juvenile Cod in NAFO Divisions 3K and 3L
 NAFO Sci. Coun. Studies, 29: 23 29 A Combined Recruitment Index for Demersal Juvenile Cod in NAFO Divisions 3K and 3L David C. Schneider Ocean Sciences Centre, Memorial University St. John's, Newfoundland,
ITS Animated LED Signals. Alert Drivers to Pedestrian Threats
 ITS Animated LED Signals Alert Drivers to Pedestrian Threats by Ron Van Houten and J.E. Louis Malenfant A good deal of evidence suggests that driver inattention is a major cause of motor vehicle crashes.
Remote Towers: Videopanorama Framerate Requirements Derived from Visual Discrimination of Deceleration During Simulated Aircraft Landing
 www.dlr.de Chart 1 > SESARInno > Fürstenau RTOFramerate> 2012-11-30 Remote Towers: Videopanorama Framerate Requirements Derived from Visual Discrimination of Deceleration During Simulated Aircraft Landing
Preliminary statistical analysis of. the international eventing. results 2013
 Lausanne 28/1/14 Preliminary statistical analysis of the international eventing results 2013 Overview of the talk Statistical analysis The data The statistical technique Analysis of the falls data (related
Table 4.1: Descriptive Statistics for FAAM 26-Item ADL Subscale
 Table 4.1: Descriptive Statistics for FAAM 26-Item ADL Subscale Item Content Number missing Mean Median SD Skewness (Std. Error) Kurtosis (Std. Error) 1) Standing 52(5.3%) 2.74 3 1.09-0.55(.078) -0.41(.16)
Sport statistics: how to assemble your team elivian.nl high quality, poorly written update history current(v2.1):7-oct-16, original(v1):13-sep-14
:7-oct-16, original(v1):13-sep-14") Sport statistics: how to assemble your team elivian.nl high quality, poorly written update history current(v2.1):7-oct-16, original(v1):13-sep-14 If you ve ever tried to make a selection team for any sport,
Sport statistics: how to assemble your team elivian.nl high quality, poorly written update history current(v2.1):7-oct-16, original(v1):13-sep-14 If you ve ever tried to make a selection team for any sport,
Lesson 14: Modeling Relationships with a Line
 Exploratory Activity: Line of Best Fit Revisited 1. Use the link http://illuminations.nctm.org/activity.aspx?id=4186 to explore how the line of best fit changes depending on your data set. A. Enter any
USING DELTA-GAMMA GENERALIZED LINEAR MODELS TO STANDARDIZE CATCH RATES OF YELLOWFIN TUNA CAUGHT BY BRAZILIAN BAIT-BOATS
 SCRS/2008/166 USING DELTA-GAMMA GENERALIZED LINEAR MODELS TO STANDARDIZE CATCH RATES OF YELLOWFIN TUNA CAUGHT BY BRAZILIAN BAIT-BOATS Humber A. Andrade 1 SUMMARY In order to standardize catch per unit
Lampiran 1. Surat Uji Coba Penelitian dari Fakultas. Lampiran 2. Expert Judgement
 57 Lampiran 1. Surat Uji Coba Penelitian dari Fakultas Lampiran 2. Expert Judgement 58 59 Lanjutan Lampiran 2. 60 Lanjutan Lampiran 2. 61 Lanjutan lampiran 2. 62 Lanjutan lampiran 2. 63 Lanjutan lampiran
Robert Jones Bandage Report
 Robert Jones Bandage Report Zach Browning Daniel Elsbury Nick Frazey December 13, 011 Table of Contents Abstract:... 3 Introduction:... 3 Background:... 3 Motivation:... 3 Objective:... 4 Methodology:...
Competition Jumping Horses: Effects of Age, Sex and Breed on the Fei/Wbfsh World Ranking
 Competition Jumping Horses: Effects of Age, Sex and Breed on the Fei/Wbfsh World Ranking Anca ROMAN-POPOVICI *, Dan SUMOVSCHI, Ioan GÎLCĂ Faculty of Animal Science, University of Agricultural Science and
Universitas Sumatera Utara
 Crosstabs Kelompok Usia (thn) * Hiperplasia Crosstabulation Hiperplasia Simpleks Kompleks Total Kelompok Usia (thn) 40 Count 12 17 29 54,5% 77,3% 65,9% Total Count
LAMPIRAN A UJI VALIDITAS DAN RELIABILITAS
 LAMPIRAN A UJI VALIDITAS DAN RELIABILITAS Validitas Komitmen Karyawan Scale Mean if Item Deleted Scale Variance if Item Deleted Corrected Item- Total Correlation Cronbach's Alpha if Item Deleted Item01