Week 7 One-way ANOVA
|
|
|
- Shanon Burns
- 5 years ago
- Views:
Transcription
1 Week 7 One-way ANOVA
2 Objectives By the end of this lecture, you should be able to: Understand the shortcomings of comparing multiple means as pairs of hypotheses. Understand the steps of the ANOVA method and the method s advantages. Compare the means of three or more populations using the ANOVA method.
3 The Logic and the Process of Analysis of Variance Suppose a salesperson wants to compare the level of satisfaction of customers for four different insurance companies. Our question is: "Is there a difference in satisfaction scores across the four insurance companies?
4 The Logic and the Process of Analysis of Variance The purpose of ANOVA is much the same as the t tests presented before: the goal is to determine whether the mean differences that are obtained for sample data are sufficiently large to justify a conclusion that there are mean differences between the populations from which the samples were obtained.
5 The Logic and the Process of Analysis of Variance (cont.) The difference between ANOVA and the t tests is that ANOVA can be used in situations where there are two or more means being compared, whereas the t tests are limited to situations where only two means are involved. Analysis of variance is necessary to protect researchers from excessive risk of a Type I error in situations where a study is comparing more than two population means.??
6 Shortcomings of Comparing Multiple Means Using Multiple t-tests We could just run six different independent samples t-tests (company 1 vs. company 2; company 1 vs. company 3; company 1 vs. company 4; company 2 vs. company 3; company 2 vs. company 4; and company 3 vs. company 4). This would be tedious, but we could use a computer to compute these quickly and easily.
7 Shortcomings of Comparing Multiple Means Using Multiple t-tests It turns out this is a very bad idea, and has a major flaw: When more than one t-test is run, each at its own level of significance, the probability of making one or more Type I errors multiplies exponentially. Recall that a Type I error occurs when we reject the null hypothesis when we should not. The level of significance,, is the probability of a Type I error in a single test. So, for a single t-test in our example, with an of 0.05, we have a Type I error probability of 5%. When testing more than one pair of samples, the probability of making at least one Type I error is: Where c is the number of t-tests
8 The Logic and the Process of Analysis of Variance (cont.) ANOVA allows researcher to evaluate all of the mean differences in a single hypothesis test using a single α-level and, thereby, keeps the risk of a Type I error under control no matter how many different means are being compared. Although ANOVA can be used in a variety of different research situations, we will cover only independent-measures designs involving only one independent variable (one-way ANOVA).
9 To apply one-way ANOVA: 1. All observations are independent of one another and randomly selected from the population which they represent. 2. The population at each value of the categorical variable (factor level ) is approximately normal. 3. The variances for each factor level are approximately equal to one another.
10 Steps of ANOVA To apply the ANOVA method to the insurance companies, we are actually analyzing the total variation of the scores, including the variation of the scores within the groups and the variation between the group means. Since we are interested in two different types of variation, we first calculate each type of variation independently and then calculate the ratio between the two called an F-value. Just like our z-score, t-test, and chi-square tests, ANOVA has its own distribution that we need to use, called an F-distribution to set our critical values and test our hypothesis. Just like the t-distribution and the chi-square distribution which use degrees of freedom, the F-distribution also relies on degrees of freedom. Since the F-value is actually a ratio of two different sources of variance, we ll need two different degrees of freedom.
11 Steps of ANOVA When using the ANOVA method, we are testing the null hypothesis that the means of our samples are equal. When we conduct a hypothesis test, we are testing the probability of obtaining an extreme F-statistic by chance. If we reject the null hypothesis that the means and variances of the samples are equal, and then we are saying that the difference that we see could not have happened just by chance. To test a hypothesis using the ANOVA method, there are several steps that we need to take.
12 Steps of ANOVA We will create what is called the ANOVA table: Source: This column lists where the variation in the test is coming from: Between the groups, within the groups, or all the variance for all the observations (Total). SS: is the Sums of Squares Df: Degrees of freedom MS: Mean Square F: value of test statistic
13 Steps of ANOVA 1. Calculate the total sum of squares (SST ), where y is the grand mean 2. Calculate the sum of squares between (SSB) 3. Find the sum of squares within groups (SSW)
14 Steps of ANOVA 4. solve for degrees of freedom for the test 5. calculate the Mean Squares Between (MSB) and Mean Squares Within (MSW) 6. calculate the F statistic: 7. Find F critical using tables with the 2 degrees of freedom (between, within).

15 Steps of ANOVA
16 Steps of ANOVA 8. Make decision: If F test statistic is greater than F critical (or p-value of F statistic is less than alpha) Reject the null hypothesis at least two groups have different means. 9. If you found significant difference, you need to apply another test for finding which two groups have different means. One of these tests is Tukey Honest Significant Difference (HSD) Test.
17 R Example Does the price of a car depend on its body style? boxplot(automobile$price ~ Automobile$BodyStyle, main = "Cars Prices",ylab = "Price", xlab = "Body Style") How to interpret values in boxplot?
18 Boxplots The orientation can be vertical or horizontal. In this figure, it is drawn horizontally. Q1 is the first quartile (median of first quarter) Q2 is the 2 nd quartile (median of all data) Q3 is the 3 rd quartile (median of 3 rd quarter) IQ=Q3-Q1 is the interquartile range. Outliers are either >Q3+1.5*IQ or <Q1-1.5*IQ Here, we have only large outliers, as indicated by the dots at the right of the box. No values are smaller than Q1-1.5*IQ, hence no outliers at the left are shown. Outliers

19 R Example aggregate(price ~ BodyStyle, Automobile, mean)
20 R Example aggregate(price ~ BodyStyle, Automobile, sd)
21 R Example Pricesmodel =aov(automobile$price ~ Automobile$BodyStyle) summary(pricesmodel)
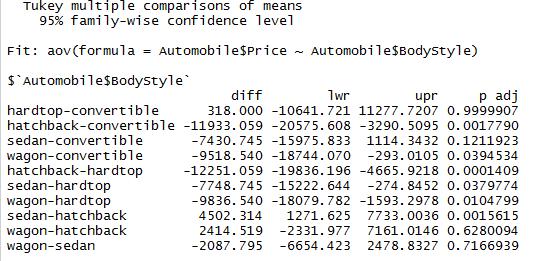
22 R Example TukeyHSD(Pricesmodel)
A few things to remember about ANOVA
 A few things to remember about ANOVA 1) The F-test that is performed is always 1-tailed. This is because your alternative hypothesis is always that the between group variation is greater than the within
Analysis of Variance. Copyright 2014 Pearson Education, Inc.
 Analysis of Variance 12-1 Learning Outcomes Outcome 1. Understand the basic logic of analysis of variance. Outcome 2. Perform a hypothesis test for a single-factor design using analysis of variance manually
Unit 4: Inference for numerical variables Lecture 3: ANOVA
 Unit 4: Inference for numerical variables Lecture 3: ANOVA Statistics 101 Thomas Leininger June 10, 2013 Announcements Announcements Proposals due tomorrow. Will be returned to you by Wednesday. You MUST
Unit4: Inferencefornumericaldata 4. ANOVA. Sta Spring Duke University, Department of Statistical Science
 Unit4: Inferencefornumericaldata 4. ANOVA Sta 101 - Spring 2016 Duke University, Department of Statistical Science Dr. Çetinkaya-Rundel Slides posted at http://bit.ly/sta101_s16 Outline 1. Housekeeping
MGB 203B Homework # LSD = 1 1
 MGB 0B Homework # 4.4 a α =.05: t = =.05 LSD = α /,n k t.05, 7 t α /,n k MSE + =.05 700 + = 4.8 n i n j 0 0 i =, j = 8.7 0.4 7. i =, j = 8.7.7 5.0 i =, j = 0.4.7. Conclusion: µ differs from µ and µ. b
Factorial Analysis of Variance
 Factorial Analysis of Variance Overview of the Factorial ANOVA Factorial ANOVA (Two-Way) In the context of ANOVA, an independent variable (or a quasiindependent variable) is called a factor, and research
AP 11.1 Notes WEB.notebook March 25, 2014
 11.1 Chi Square Tests (Day 1) vocab *new seats* examples Objectives Comparing Observed & Expected Counts measurements of a categorical variable (ex/ color of M&Ms) Use Chi Square Goodness of Fit Test Must
Practice Test Unit 6B/11A/11B: Probability and Logic
 Note to CCSD Pre-Algebra Teachers: 3 rd quarter benchmarks begin with the last 2 sections of Chapter 6, and then address Chapter 11 benchmarks; logic concepts are also included. We have combined probability
PLANNED ORTHOGONAL CONTRASTS
 PLANNED ORTHOGONAL CONTRASTS Please note: This handout is useful background for the workshop, not what s covered in it. Basic principles for contrasts are the same in repeated measures. Planned orthogonal
STANDARD SCORES AND THE NORMAL DISTRIBUTION
 STANDARD SCORES AND THE NORMAL DISTRIBUTION REVIEW 1.MEASURES OF CENTRAL TENDENCY A.MEAN B.MEDIAN C.MODE 2.MEASURES OF DISPERSIONS OR VARIABILITY A.RANGE B.DEVIATION FROM THE MEAN C.VARIANCE D.STANDARD
Introduction to Analysis of Variance (ANOVA) The Structural Model, The Summary Table, and the One- Way ANOVA
 The Structural Model, The Summary Table, and the One- Way ANOVA") Introduction to Analysis of Variance (ANOVA) The Structural Model, The Summary Table, and the One- Way ANOVA Limitations of the t-test Although the t-test is commonly used, it has limitations Can only
Introduction to Analysis of Variance (ANOVA) The Structural Model, The Summary Table, and the One- Way ANOVA Limitations of the t-test Although the t-test is commonly used, it has limitations Can only
Select Boxplot -> Multiple Y's (simple) and select all variable names.
 and select all variable names.") One Factor ANOVA in Minitab As an example, we will use the data below. A study looked at the days spent in the hospital for different regions of the United States. Can the company reject the claim the
One Factor ANOVA in Minitab As an example, we will use the data below. A study looked at the days spent in the hospital for different regions of the United States. Can the company reject the claim the
Psychology - Mr. Callaway/Mundy s Mill HS Unit Research Methods - Statistics
 Psychology - Mr. Callaway/Mundy s Mill HS Unit 2.3 - Research Methods - Statistics How do psychologists ask & answer questions? Last time we asked that we were discussing Research Methods. This time we
Stat 139 Homework 3 Solutions, Spring 2015
 Stat 39 Homework 3 Solutions, Spring 05 Problem. Let i Nµ, σ ) for i,..., n, and j Nµ, σ ) for j,..., n. Also, assume that all observations are independent from each other. In Unit 4, we learned that the
Stats 2002: Probabilities for Wins and Losses of Online Gambling
 Abstract: Jennifer Mateja Andrea Scisinger Lindsay Lacher Stats 2002: Probabilities for Wins and Losses of Online Gambling The objective of this experiment is to determine whether online gambling is a
Chapter 1: Why is my evil lecturer forcing me to learn statistics?
 Chapter : Why is my evil lecturer forcing me to learn statistics? Labcoat Leni s Real Research Is Friday the 3th Unlucky? Problem Scanlon, T. J., et al. (3). British Medical Journal, 3, 8 8. Many of us
Chapter 1: Why is my evil lecturer forcing me to learn statistics?
 Chapter 1: Why is my evil lecturer forcing me to learn statistics? Labcoat Leni s Real Research Is Friday the 13th Unlucky? Problem Scanlon, T. J., et al. (1993). British Medical Journal, 307, 1584 158.
One-way ANOVA: round, narrow, wide
 5/4/2009 9:19:18 AM Retrieving project from file: 'C:\DOCUMENTS AND SETTINGS\BOB S\DESKTOP\RJS\COURSES\MTAB\FIRSTBASE.MPJ' ========================================================================== This
Legendre et al Appendices and Supplements, p. 1
 Legendre et al. 2010 Appendices and Supplements, p. 1 Appendices and Supplement to: Legendre, P., M. De Cáceres, and D. Borcard. 2010. Community surveys through space and time: testing the space-time interaction
Experimental Design and Data Analysis Part 2
 Experimental Design and Data Analysis Part 2 Assump@ons for Parametric Tests t- test and ANOVA Independence Variance Normality t-test Yes Yes Yes ANOVA Yes Yes Yes Lecture 7 AEC 460 Assume homogeneity
Practice Test Unit 06B 11A: Probability, Permutations and Combinations. Practice Test Unit 11B: Data Analysis
 Note to CCSD HS Pre-Algebra Teachers: 3 rd quarter benchmarks begin with the last 2 sections of Chapter 6 (probability, which we will refer to as 6B), and then address Chapter 11 benchmarks (which will
3.3 - Measures of Position
 3.3 - Measures of Position Z-Scores Who is taller, a man 73 inches tall or a woman 68 inches tall? The obvious answer is that the man is taller. However, men are taller than women on the average. Let s
Biostatistics & SAS programming
 Biostatistics & SAS programming Kevin Zhang March 6, 2017 ANOVA 1 Two groups only Independent groups T test Comparison One subject belongs to only one groups and observed only once Thus the observations
Name May 3, 2007 Math Probability and Statistics
 Name May 3, 2007 Math 341 - Probability and Statistics Long Exam IV Instructions: Please include all relevant work to get full credit. Encircle your final answers. 1. An article in Professional Geographer
How Fast Can You Throw?
 Name Date Period How Fast Can You Throw? Directions: Find a spot 40 feet from a wall and mark it with a piece of chalk. From that point, you will throw the ball 5 times with your right hand, and then five
One-factor ANOVA by example
 ANOVA One-factor ANOVA by example 2 One-factor ANOVA by visual inspection 3 4 One-factor ANOVA H 0 H 0 : µ 1 = µ 2 = µ 3 = H A : not all means are equal 5 One-factor ANOVA but why not t-tests t-tests?
Running head: DATA ANALYSIS AND INTERPRETATION 1
 Running head: DATA ANALYSIS AND INTERPRETATION 1 Data Analysis and Interpretation Final Project Vernon Tilly Jr. University of Central Oklahoma DATA ANALYSIS AND INTERPRETATION 2 Owners of the various
Announcements. Lecture 19: Inference for SLR & Transformations. Online quiz 7 - commonly missed questions
 Announcements Announcements Lecture 19: Inference for SLR & Statistics 101 Mine Çetinkaya-Rundel April 3, 2012 HW 7 due Thursday. Correlation guessing game - ends on April 12 at noon. Winner will be announced
Warm-up. Make a bar graph to display these data. What additional information do you need to make a pie chart?
 Warm-up The number of deaths among persons aged 15 to 24 years in the United States in 1997 due to the seven leading causes of death for this age group were accidents, 12,958; homicide, 5,793; suicide,
Sample Final Exam MAT 128/SOC 251, Spring 2018
 Sample Final Exam MAT 128/SOC 251, Spring 2018 Name: Each question is worth 10 points. You are allowed one 8 1/2 x 11 sheet of paper with hand-written notes on both sides. 1. The CSV file citieshistpop.csv
National Curriculum Statement: Determine quartiles and interquartile range (ACMSP248).
.") Teacher Notes 7 8 9 10 11 12 Aim TI-Nspire CAS Investigation Student 90min To compare the height, weight, age and field positions of all football players from the 32 teams which participated in the 2010
Teacher Notes 7 8 9 10 11 12 Aim TI-Nspire CAS Investigation Student 90min To compare the height, weight, age and field positions of all football players from the 32 teams which participated in the 2010
Data Set 7: Bioerosion by Parrotfish Background volume of bites The question:
 Data Set 7: Bioerosion by Parrotfish Background Bioerosion of coral reefs results from animals taking bites out of the calcium-carbonate skeleton of the reef. Parrotfishes are major bioerosion agents,
Reminders. Homework scores will be up by tomorrow morning. Please me and the TAs with any grading questions by tomorrow at 5pm
 Reminders Homework scores will be up by tomorrow morning Please email me and the TAs with any grading questions by tomorrow at 5pm 1 Chapter 12: Describing Distributions with Numbers Aaron Zimmerman STAT
Full file at
 Chapter 2 1. Describe the distribution. survival times of persons diagnosed with terminal lymphoma A) approximately normal B) skewed left C) skewed right D) roughly uniform Ans: C Difficulty: low 2. Without
ANOVA - Implementation.
 ANOVA - Implementation http://www.pelagicos.net/classes_biometry_fa17.htm Doing an ANOVA With RCmdr Categorical Variable One-Way ANOVA Testing a single Factor dose with 3 treatments (low, mid, high) Doing
9.3 Histograms and Box Plots
 Name Class Date 9.3 Histograms and Box Plots Essential Question: How can you interpret and compare data sets using data displays? Explore Understanding Histograms Resource Locker A histogram is a bar graph
One Way ANOVA (Analysis of Variance)
") One Wa ANOVA (Analsis of Variance) The one-wa analsis of variance (ANOVA) is used to determine whether there are an significant differences between the means of two or more independent (unrelated) groups
One Wa ANOVA (Analsis of Variance) The one-wa analsis of variance (ANOVA) is used to determine whether there are an significant differences between the means of two or more independent (unrelated) groups
Effective Use of Box Charts
 Effective Use of Box Charts Purpose This tool provides guidelines and tips on how to effectively use box charts to communicate research findings. Format This tool provides guidance on box charts and their
Setting up group models Part 1 NITP, 2011
 Setting up group models Part 1 NITP, 2011 What is coming up Crash course in setting up models 1-sample and 2-sample t-tests Paired t-tests ANOVA! Mean centering covariates Identifying rank deficient matrices
Statistical Analysis of PGA Tour Skill Rankings USGA Research and Test Center June 1, 2007
 Statistical Analysis of PGA Tour Skill Rankings 198-26 USGA Research and Test Center June 1, 27 1. Introduction The PGA Tour has recorded and published Tour Player performance statistics since 198. All
Fundamentals of Machine Learning for Predictive Data Analytics
 Fundamentals of Machine Learning for Predictive Data Analytics Appendix A Descriptive Statistics and Data Visualization for Machine learning John Kelleher and Brian Mac Namee and Aoife D Arcy john.d.kelleher@dit.ie
Year 10 Term 2 Homework
 Yimin Math Centre Year 10 Term 2 Homework Student Name: Grade: Date: Score: Table of contents 6 Year 10 Term 2 Week 6 Homework 1 6.1 Data analysis and evaluation............................... 1 6.1.1
Lower Columbia River Dam Fish Ladder Passage Times, Eric Johnson and Christopher Peery University of Idaho
 Lower Columbia River Dam Fish Ladder Passage Times, 3 Eric Johnson and Christopher Peery University of Idaho As per your request, we have assembled passage times at Lower Columbia River fish ladders. Ladder
Driv e accu racy. Green s in regul ation
 LEARNING ACTIVITIES FOR PART II COMPILED Statistical and Measurement Concepts We are providing a database from selected characteristics of golfers on the PGA Tour. Data are for 3 of the players, based
Solutionbank S1 Edexcel AS and A Level Modular Mathematics
 Page 1 of 1 Exercise A, Question 1 A group of thirty college students was asked how many DVDs they had in their collection. The results are as follows. 12 25 34 17 12 18 29 34 45 6 15 9 25 23 29 22 20
Chapter 12 Practice Test
 Chapter 12 Practice Test 1. Which of the following is not one of the conditions that must be satisfied in order to perform inference about the slope of a least-squares regression line? (a) For each value
Example 1: One Way ANOVA in MINITAB
 Example : One Way ANOVA in MINITAB A consumer group wants to compare a new brand of wax (Brand-X) to two leading brands (Sureglow and Microsheen) in terms of Effectiveness of wax. Following data is collected
Unit 6 Day 2 Notes Central Tendency from a Histogram; Box Plots
 AFM Unit 6 Day 2 Notes Central Tendency from a Histogram; Box Plots Name Date To find the mean, median and mode from a histogram, you first need to know how many data points were used. Use the frequency
Algebra 1 Unit 7 Day 2 DP Box and Whisker Plots.notebook April 10, Algebra I 04/10/18 Aim: How Do We Create Box and Whisker Plots?
 Algebra I 04/10/18 Aim: How Do We Create Box and Whisker Plots? DO NOW 1) Find the mean, median, and mode of the data below 2) Which measure of central tendency do you believe best represents the data?
5.1 Introduction. Learning Objectives
 Learning Objectives 5.1 Introduction Statistical Process Control (SPC): SPC is a powerful collection of problem-solving tools useful in achieving process stability and improving capability through the
Safety at Intersections in Oregon A Preliminary Update of Statewide Intersection Crash Rates
 Portland State University PDXScholar Civil and Environmental Engineering Master's Project Reports Civil and Environmental Engineering 2015 Safety at Intersections in Oregon A Preliminary Update of Statewide
Midterm Exam 1, section 2. Thursday, September hour, 15 minutes
 San Francisco State University Michael Bar ECON 312 Fall 2018 Midterm Exam 1, section 2 Thursday, September 27 1 hour, 15 minutes Name: Instructions 1. This is closed book, closed notes exam. 2. You can
Statistical Studies: Analyzing Data III.B Student Activity Sheet 6: Analyzing Graphical Displays
 The Phoenix Mercury of the Women s National Basketball League had 14 players on the roster for the 2008 season. The players and their average points per game (PPG) are shown below. Player Diana Taurasi
Statistical Studies: Analyzing Data III.B Student Activity Sheet 6: Analyzing Graphical Displays
 The Phoenix Mercury of the Women s National Basketball League had 14 players on the roster for the 2008 season. The players and their average points per game (PPG) are shown below. Player Diana Taurasi
Chapter 7. Comparing Two Population Means. Comparing two population means. T-tests: Independent samples and paired variables.
 Chapter 7 Comparing Two Population Means Comparing two population means T-tests: Independent samples and paired variables. Usually subjects are assigned to treatment or control groups and one or more variables
In the actual exam, you will be given more space to work each problem, so work these problems on separate sheets.
 K300 Practice Exam 1 Note: This gives you an idea of the types of questions I ask. The length of the exam may differ. The questions are meant to be representative but not all-inclused (i.e. this is a sample
BIOL 101L: Principles of Biology Laboratory
 BIOL 101L: Principles of Biology Laboratory Sampling populations To understand how the world works, scientists collect, record, and analyze data. In this lab, you will learn concepts that pertain to these
Lesson 3 Pre-Visit Teams & Players by the Numbers
 Lesson 3 Pre-Visit Teams & Players by the Numbers Objective: Students will be able to: Review how to find the mean, median and mode of a data set. Calculate the standard deviation of a data set. Evaluate
Section I: Multiple Choice Select the best answer for each problem.
 Inference for Linear Regression Review Section I: Multiple Choice Select the best answer for each problem. 1. Which of the following is NOT one of the conditions that must be satisfied in order to perform
Age of Fans
 Measures of Central Tendency SUGGESTED LEARNING STRATEGIES: Activating Prior Knowledge, Interactive Word Wall, Marking the Text, Summarize/Paraphrase/Retell, Think/Pair/Share Matthew is a student reporter
CHAPTER ANALYSIS AND INTERPRETATION Average total number of collisions for a try to be scored
 CHAPTER 8 8.1 ANALYSIS AND INTERPRETATION As mentioned in the previous chapter, four key components have been identified as indicators of the level of significance of dominant collisions when evaluating
Bivariate Data. Frequency Table Line Plot Box and Whisker Plot
 U04 D02 Univariate Data Frequency Table Line Plot Box and Whisker Plot Univariate Data Bivariate Data involving a single variable does not deal with causes or relationships the major purpose of univariate
CHAPTER 1 ORGANIZATION OF DATA SETS
 CHAPTER 1 ORGANIZATION OF DATA SETS When you collect data, it comes to you in more or less a random fashion and unorganized. For example, what if you gave a 35 item test to a class of 50 students and collect
March Madness Basketball Tournament
 March Madness Basketball Tournament Math Project COMMON Core Aligned Decimals, Fractions, Percents, Probability, Rates, Algebra, Word Problems, and more! To Use: -Print out all the worksheets. -Introduce
FUNCTIONAL SKILLS MATHEMATICS (level 1)
") FUNCTIONAL SKILLS MATHEMATICS (level 1) Detailed Marking Instructions Version: May 2011 Question Marking Scheme Illustrations of evidence No Give for each for awarding a mark 1 (a) Ans: 675 represent:
FUNCTIONAL SKILLS MATHEMATICS (level 1) Detailed Marking Instructions Version: May 2011 Question Marking Scheme Illustrations of evidence No Give for each for awarding a mark 1 (a) Ans: 675 represent:
box and whisker plot 3880C798CA037B A83B07E6C4 Box And Whisker Plot 1 / 6
 Box And Whisker Plot 1 / 6 2 / 6 3 / 6 Box And Whisker Plot In descriptive statistics, a box plot or boxplot is a method for graphically depicting groups of numerical data through their quartiles.box plots
Announcements. % College graduate vs. % Hispanic in LA. % College educated vs. % Hispanic in LA. Problem Set 10 Due Wednesday.
 Announcements Announcements UNIT 7: MULTIPLE LINEAR REGRESSION LECTURE 1: INTRODUCTION TO MLR STATISTICS 101 Problem Set 10 Due Wednesday Nicole Dalzell June 15, 2015 Statistics 101 (Nicole Dalzell) U7
Class 23: Chapter 14 & Nested ANOVA NOTES: NOTES: NOTES:
 Slide 1 Chapter 13: ANOVA for 2-way classifications (2 of 2) Fixed and Random factors, Model I, Model II, and Model III (mixed model) ANOVA Chapter 14: Unreplicated Factorial & Nested Designs Slide 2 HW
Quantitative Literacy: Thinking Between the Lines
 Quantitative Literacy: Thinking Between the Lines Crauder, Noell, Evans, Johnson Chapter 6: Statistics 2013 W. H. Freeman and Company 1 Chapter 6: Statistics Lesson Plan Data summary and presentation:
1 Hypothesis Testing for Comparing Population Parameters
 Hypothesis Testing for Comparing Population Parameters Hypothesis testing can address many di erent types of questions. We are not restricted to looking at the estimated value of a single population parameter.
Descriptive Statistics Project Is there a home field advantage in major league baseball?
 Descriptive Statistics Project Is there a home field advantage in major league baseball? DUE at the start of class on date posted on website (in the first 5 minutes of class) There may be other due dates
March Madness Basketball Tournament
 March Madness Basketball Tournament Math Project COMMON Core Aligned Decimals, Fractions, Percents, Probability, Rates, Algebra, Word Problems, and more! To Use: -Print out all the worksheets. -Introduce
PSY201: Chapter 5: The Normal Curve and Standard Scores
 PSY201: Chapter 5: The Normal Curve and Standard Scores Introduction: Normal curve + a very important distribution in behavior sciences + three principal reasons why... - 1. many of the variables measured
Box-and-Whisker Plots
 Lesson 75 Objectives Calculate quartile values for a data set Create a box-and-whisker plot Quartiles and Box-and-Whisker Plots Richard recorded the number of people that attended his team s minor league
Is lung capacity affected by smoking, sport, height or gender. Table of contents
 Sample project This Maths Studies project has been graded by a moderator. As you read through it, you will see comments from the moderator in boxes like this: At the end of the sample project is a summary
1. The data below gives the eye colors of 20 students in a Statistics class. Make a frequency table for the data.
 1. The data below gives the eye colors of 20 students in a Statistics class. Make a frequency table for the data. Green Blue Brown Blue Blue Brown Blue Blue Blue Green Blue Brown Blue Brown Brown Blue
(c) The hospital decided to collect the data from the first 50 patients admitted on July 4, 2010.
 The hospital decided to collect the data from the first 50 patients admitted on July 4, 2010.") Math 155, Test 1, 18 October 2011 Name: Instructions. This is a closed-book test. You may use a calculator (but not a cell phone). Make sure all cell-phones are put away and that the ringer is off. Show
Math 155, Test 1, 18 October 2011 Name: Instructions. This is a closed-book test. You may use a calculator (but not a cell phone). Make sure all cell-phones are put away and that the ringer is off. Show
WATER OIL RELATIVE PERMEABILITY COMPARATIVE STUDY: STEADY VERSUS UNSTEADY STATE
 SCA2005-77 1/7 WATER OIL RELATIVE PERMEABILITY COMPARATIVE STUDY: STEADY VERSUS UNSTEADY STATE 1 Marcelo M. Kikuchi, 1 Celso C.M. Branco, 2 Euclides J. Bonet, 2 Rosângela M.Zanoni, 1 Carlos M. Paiva 1
Lesson 14: Modeling Relationships with a Line
 Exploratory Activity: Line of Best Fit Revisited 1. Use the link http://illuminations.nctm.org/activity.aspx?id=4186 to explore how the line of best fit changes depending on your data set. A. Enter any
1. Answer this student s question: Is a random sample of 5% of the students at my school large enough, or should I use 10%?
 Econ 57 Gary Smith Fall 2011 Final Examination (150 minutes) No calculators allowed. Just set up your answers, for example, P = 49/52. BE SURE TO EXPLAIN YOUR REASONING. If you want extra time, you can
Section 3.2: Measures of Variability
 Section 3.2: Measures of Variability The mean and median are good statistics to employ when describing the center of a collection of data. However, there is more to a collection of data than just the center!
Fruit Fly Exercise 1- Level 1
 Name StarGenetics Fruit Fly Exercise 1- Level 1 Description of StarGenetics In this exercise you will use StarGenetics, a software tool that simulates mating experiments, to analyze the nature and mode
Assignment. To New Heights! Variance in Subjective and Random Samples. Use the table to answer Questions 2 through 7.
 Assignment Assignment for Lesson.1 Name Date To New Heights! Variance in Subjective and Random Samples 1. Suppose that you have collected data for the weights of all of the crates in a warehouse. a. Give
Navigate to the golf data folder and make it your working directory. Load the data by typing
 Golf Analysis 1.1 Introduction In a round, golfers have a number of choices to make. For a particular shot, is it better to use the longest club available to try to reach the green, or would it be better
How Effective is Change of Pace Bowling in Cricket?
 How Effective is Change of Pace Bowling in Cricket? SAS and all other SAS Institute Inc. product or service names are registered trademarks or trademarks of SAS Institute Inc. in the USA and other countries.
Measuring Relative Achievements: Percentile rank and Percentile point
 Measuring Relative Achievements: Percentile rank and Percentile point Consider an example where you receive the same grade on a test in two different classes. In which class did you do better? Why do we
Chapter 3.4. Measures of position and outliers. Julian Chan. September 11, Department of Mathematics Weber State University
 Chapter 3.4 Measures of position and outliers Julian Chan Department of Mathematics Weber State University September 11, 2011 Intro 1 We will talk about how to measure the position of an observation which
Empirical Example II of Chapter 7
 Empirical Example II of Chapter 7 1. We use NBA data. The description of variables is --- --- --- storage display value variable name type format label variable label marr byte %9.2f =1 if married wage
DOCUMENT RESUME. A Comparison of Type I Error Rates of Alpha-Max with Established Multiple Comparison Procedures. PUB DATE NOTE
 DOCUMENT RESUME ED 415 284 TM 028 030 AUTHOR Barnette, J. Jackson; McLean, James E. TITLE A Comparison of Type I Error Rates of Alpha-Max with Established Multiple Comparison Procedures. PUB DATE 1997-11-13
SCTB16 Working Paper SWG 6
 SCTB16 Working Paper SWG 6 ANALYSIS OF THE PROPORTION OF BIGEYE IN YELLOWFIN PLUS BIGEYE CAUGHT BY PURSE SEINERS IN THE WESTERN AND CENTRAL PACIFIC OCEAN, BASED ON OBSERVER DATA Tim Lawson Oceanic Fisheries
ASTERISK OR EXCLAMATION POINT?: Power Hitting in Major League Baseball from 1950 Through the Steroid Era. Gary Evans Stat 201B Winter, 2010
 ASTERISK OR EXCLAMATION POINT?: Power Hitting in Major League Baseball from 1950 Through the Steroid Era by Gary Evans Stat 201B Winter, 2010 Introduction: After a playerʼs strike in 1994 which resulted
% per year Age (years)
") Stat 1001 Winter 1998 Geyer Homework 2 Problem 3.1 66 inches and 72 inches. Problem 3.2 % per year 0.0 0.5 1.0 1.5 0 20 40 60 80 Age (years) (a) Age 1. (b) More 31-year olds (c) More people age 35{44,
Stat 1001 Winter 1998 Geyer Homework 2 Problem 3.1 66 inches and 72 inches. Problem 3.2 % per year 0.0 0.5 1.0 1.5 0 20 40 60 80 Age (years) (a) Age 1. (b) More 31-year olds (c) More people age 35{44,
The pth percentile of a distribution is the value with p percent of the observations less than it.
 Describing Location in a Distribution (2.1) Measuring Position: Percentiles One way to describe the location of a value in a distribution is to tell what percent of observations are less than it. De#inition:
Mrs. Daniel- AP Stats Ch. 2 MC Practice
 Mrs. Daniel- AP Stats Ch. 2 MC Practice Name: 1. Jorge s score on Exam 1 in his statistics class was at the 64th percentile of the scores for all students. His score falls (a) between the minimum and the
USING DELTA-GAMMA GENERALIZED LINEAR MODELS TO STANDARDIZE CATCH RATES OF YELLOWFIN TUNA CAUGHT BY BRAZILIAN BAIT-BOATS
 SCRS/2008/166 USING DELTA-GAMMA GENERALIZED LINEAR MODELS TO STANDARDIZE CATCH RATES OF YELLOWFIN TUNA CAUGHT BY BRAZILIAN BAIT-BOATS Humber A. Andrade 1 SUMMARY In order to standardize catch per unit
Pressured Applied by the Emergency/Israeli Bandage
 Pressured Applied by the Emergency/Israeli Bandage By Charles S. Lessard, Ph.D. Nolan Shipman, M.D. Amanda Bickham Jasper Butler 9 December 2007 1 Introduction At the request of Performance Systems, this
Factorial ANOVA Problems
 Factorial ANOVA Problems Q.1. In a 2-Factor ANOVA, measuring the effects of 2 factors (A and B) on a response (y), there are 3 levels each for factors A and B, and 4 replications per treatment combination.
Chapter 13. Factorial ANOVA. Patrick Mair 2015 Psych Factorial ANOVA 0 / 19
 Chapter 13 Factorial ANOVA Patrick Mair 2015 Psych 1950 13 Factorial ANOVA 0 / 19 Today s Menu Now we extend our one-way ANOVA approach to two (or more) factors. Factorial ANOVA: two-way ANOVA, SS decomposition,
DISMAS Evaluation: Dr. Elizabeth C. McMullan. Grambling State University
 DISMAS Evaluation 1 Running head: Project Dismas Evaluation DISMAS Evaluation: 2007 2008 Dr. Elizabeth C. McMullan Grambling State University DISMAS Evaluation 2 Abstract An offender notification project
Taking Your Class for a Walk, Randomly
 Taking Your Class for a Walk, Randomly Daniel Kaplan Macalester College Oct. 27, 2009 Overview of the Activity You are going to turn your students into an ensemble of random walkers. They will start at