Explaining the Favorite Long Shot Bias: Is it Risk-Love or Misperceptions?
|
|
|
- Denis Townsend
- 6 years ago
- Views:
Transcription
1 Explaining the Favorite Long Shot Bias: Is it Risk-Love or Misperceptions? Erik Snowberg California Institute of Technology Justin Wolfers University of Pennsylvania, Centre for Economic Policy Research, Institute for the Study of Labor, and National Bureau of Economic Research The favorite long shot bias describes the long-standing empirical regularity that betting odds provide biased estimates of the probability of a horse winning: long shots are overbet whereas favorites are underbet. Neoclassical explanations of this phenomenon focus on rational gamblers who overbet long shots because of risk-love. The competing behavioral explanations emphasize the role of misperceptions of probabilities. We provide novel empirical tests that can discriminate between these competing theories by assessing whether the models that explain gamblers choices in one part of their choice set (betting to win) can also rationalize decisions over a wider choice set, including compound bets in the exacta, quinella, or trifecta pools. Using a new, large-scale data set ideally suited to implement these tests, we find evidence in favor of the view that misperceptions of probability drive the favorite long shot bias, as suggested by prospect theory. We thank David Siegel of Equibase for supplying the data, and Scott Hereld and Ravi Pillai for their valuable assistance in managing the data. Jon Bendor, Bruno Jullien, Steven Levitt, Kevin Murphy, Marco Ottaviani, Bernard Salanié, Peter Norman Sørenson, Betsey Stevenson, Matthew White, William Ziemba, and an anonymous referee provided useful feedback, as did seminar audiences at Carnegie Mellon, Chicago Booth School of Business, Haas School of Business, Harvard Business School, University of Lausanne, Kellogg (Managerial Economics and Decision Sciences Department), University of Maryland, University of Michigan, and Wharton. Snowberg gratefully acknowledges the SIEPR Dissertation Fellowship through a grant to the Stanford Institute for Economic Policy Research. Wolfers gratefully acknowledges a Hirtle, Callaghan & Co. Arthur D. Miltenberger Research Fellowship, and the support of the Zull/Lurie Real Estate Center, the Mack Center for Technological Innovation, and Microsoft Research. [Journal of Political Economy, 2010, vol. 118, no. 4] 2010 by The University of Chicago. All rights reserved /2010/ $
2 724 journal of political economy I. Introduction The racetrack provides a natural laboratory for economists interested in understanding decision making under uncertainty. The most discussed empirical regularity in racetrack gambling markets is the favorite long shot bias: equilibrium market prices (betting odds) provide biased estimates of the probability of a horse winning. Specifically, bettors value long shots more than expected given how rarely they win, and they value favorites too little given how often they win. Figure 1 illustrates, showing that the rate of return to betting on horses with odds of 100/1 or greater is about 61 percent, whereas betting the favorite in every race yields losses of only 5.5 percent. Betting randomly yields average returns of 23 percent, which, while better than long shots, are negative, as the racetrack takes a percentage of each bet to fund operations. 1 Since the favorite long shot bias was first noted by Griffith in 1949, it has been found in racetrack betting data around the world, with very few exceptions. The literature documenting this bias is voluminous and covers both bookmaker and pari-mutuel markets. 2 Two broad sets of theories have been proposed to explain the favorite long shot bias. First, neoclassical theory suggests that the prices bettors are willing to pay for various gambles can be used to recover their utility function. While betting at any odds is actuarially unfair, this is particularly acute for long shots which are also the riskiest investments. Thus, the neoclassical approach can reconcile both gambling and the long shot bias only by positing (at least locally) risk-loving utility functions, as in Friedman and Savage (1948). Alternatively, behavioral theories suggest that cognitive errors and misperceptions of probabilities play a role in market mispricing. These theories incorporate laboratory studies by cognitive psychologists that show people are systematically poor at discerning between small and tiny probabilities and hence price both similarly. Further, people exhibit a strong preference for certainty over extremely likely outcomes, leading highly probable gambles to be underpriced. These results form an important foundation of prospect theory (Kahneman and Tversky 1979). Our aim in this paper is to test whether the risk-love class of models or the misperceptions class of models simultaneously fits data from multiple betting pools. While there exist many specific models of the favorite long shot bias, we show in Section III that each yields implications for the pricing of gambles equivalent to stark models of either a risk-loving 1 For more on the analytical treatment of the track take, see n Thaler and Ziemba (1988), Sauer (1998), and Snowberg and Wolfers (2007) survey the literature. The exceptions are Busche and Hall (1988), which finds that the favorite long shot bias is not evident in data on 2,653 Hong Kong races, and Busche (1994), which confirms this finding in an additional 2,690 races in Hong Kong and 1,738 races in Japan.
3 explaining the favorite long shot bias 725 Fig. 1. The favorite long shot bias: the rate of return on win bets declines as risk increases. The sample includes 5,610,580 horse race starts in the United States from 1992 to Lines reflect Lowess smoothing (bandwidth p 0.4). representative agent or a representative agent who bases her decisions on biased perceptions of true probabilities. That is, the favorite long shot bias can be fully rationalized by a standard rational expectations expected-utility model or by appealing to an expected wealth-maximizing agent who overweights small probabilities and underweights large probabilities. 3 Thus, without parametric assumptions, which we are unwilling to make, the two theories are observationally equivalent when examining average rates of return to win bets at different odds. We combine new data with a novel econometric identification strategy to discriminate between these two classes of theories. Our data include all 6.4 million horse race starts in the United States from 1992 to These data are an order of magnitude larger than any data set previously examined and allow us to be extremely precise in establishing the relevant stylized facts. Our econometric innovation is to distinguish between these theories by deriving testable predictions about the pricing of compound lotteries (also called exotic bets at the racetrack). For example, an exacta is a bet on both which horse will come first and which will come second. Es- 3 Or adopting a behavioral vs. neoclassical distinction, we follow Gabriel and Marsden (1990) in asking, Are we observing an inefficient market or simply one in which the tastes and preferences of the market participations lead to the observed results? (885).
4 726 journal of political economy sentially, we ask whether the preferences and perceptions that rationalize the favorite long shot bias (in win bet data) can also explain the pricing of exactas, quinellas (a bet on two horses to come first and second in either order), and trifectas (a bet on which horse will come in first, which second, and which third). By expanding the choice set under consideration (to correspond with the bettor s actual choice set!), we use each theory to derive unique testable predictions. We find that the misperceptions class more accurately predicts the prices of exotic bets and also their relative prices. To demonstrate the application of this idea to our data, note that betting on horses with odds between 4/1 and 9/1 has an approximately constant rate of return (at 18 percent; see fig. 1). Thus, the misperceptions class infers that bettors are equally well calibrated over this range, and hence betting on combinations of outcomes among such horses will yield similar rates of return. That is, betting on an exacta with a 4/1 horse to win and a 9/1 horse to come in second will yield expected returns similar to those from betting on the exacta with the reverse ordering (although the odds of the two exactas will differ). In contrast, under the risk-love model, bettors are willing to pay a larger risk penalty for the riskier bet such as the exacta in which the 9/1 horse wins and the 4/1 horse runs second decreasing its rate of return relative to the reverse ordering. Our research question is most similar to the questions asked by Jullien and Salanié (2000) and Gandhi (2007), who attempt to differentiate between preference- and perception-based explanations of the favorite long shot bias using data only on the price of win bets. 4 The results of the former study favor perception-based explanations and the results of the latter favor preference-based explanations. Rosett (1965) conducts a related analysis in that he considers both win bets and combinations of win bets as present in the bettors choice set. Ali (1979), Asch and Quandt (1987), and Dolbear (1993) test the efficiency of compound lottery markets. We believe that we are the first to use compound lottery prices to distinguish between competing theories of possible market (in)efficiency. Of course the idea is much older: Friedman and Savage (1948) note that a hallmark of expected utility theory is that the reaction of persons to complicated gambles can be inferred from their reaction to simple gambles (293). 4 These papers show that it is theoretically possible to separate these explanations in win-bet data by comparing the menus of bets offered in different races; however, computational constraints force them to rely on functional form assumptions in their empirical strategy.
5 explaining the favorite long shot bias 727 II. Stylized Facts Our data contain all 6,403,712 horse starts run in the United States between 1992 and These are official Jockey Club data, the most precise available. Data of this nature are extremely expensive, which presumably explains why previous studies have used substantially smaller samples. The Appendix provides more detail about the data. We summarize our data in figure 1. We calculate the rate of return to betting on every horse at each odds and use Lowess smoothing to take advantage of information from horses with similar odds. Data are graphed on a log-odds scale so as to better show their relevant range. The vastly better returns to betting on favorites rather than on long shots is the favorite long shot bias. Figure 1 also shows the same pattern for the 206,808 races (with 1,485,112 horse starts) for which the Jockey Club recorded payoffs to exacta, quinella, or trifecta bets. Given that much of our analysis will focus on this smaller sample, it is reassuring to see a similar pattern of returns. Figure 2 shows the same rate of return calculations for several other data sets. We present new data from 2,725,000 starts in Australia from the South Coast Database and 380,000 starts in Great Britain from flatstats.co.uk. The favorite long shot bias appears equally evident in these countries, despite the fact that odds are determined by pari-mutuel markets in the United States, bookmakers in the United Kingdom, and Fig. 2. The favorite long shot bias has persisted for over 50 years
6 728 journal of political economy bookmakers competing with a state-run pari-mutuel market in Australia. Figure 2 also includes historical estimates of the favorite long shot bias, showing that it has been stable since first noted in Griffith (1949). The literature suggests two other empirical regularities to explore. First, Thaler and Ziemba (1988) suggest that there are positive rates of return to betting extreme favorites, perhaps suggesting limits to arbitrage. This is not true in any of our data sets, providing a finding similar to that in Levitt (2004): despite significant anomalies in the pricing of bets, there are no profit opportunities from simple betting strategies. Second, McGlothlin (1956), Ali (1977), and Asch, Malkiel, and Quandt (1982) argue that the rate of return to betting moderate long shots falls in the last race of the day. These studies have come to be widely cited despite being based on small samples. Kahneman and Tversky (1979) and Thaler and Ziemba (1988) interpret these results as consistent with loss aversion: most bettors are losing at the end of the day, and the last race provides them with a chance to recoup their losses. Thus, bettors underbet the favorite even more than usual and overbet horses at odds that would eliminate their losses. The dashed line in figure 1 separates out data from the last race; while the point estimates differ slightly, these differences are not statistically significant. If there was evidence of loss aversion in earlier data, it is no longer evident in recent data, even as the favorite long shot bias has persisted. In the next section we argue that these facts cannot separate risk-love from misperception-based theories. We propose new tests based on the requirement that a theory developed to explain equilibrium odds of horses winning should also be able to explain the equilibrium odds in the exacta, quinella, and trifecta markets separately, as well as the equilibrium odds in exacta and quinella markets jointly. III. Two Models of the Favorite Long Shot Bias We start with two extremely stark models, each of which has the merit of simplicity. Both are models in which all agents have the same preferences and perceptions but, as we suggest below, can be expanded to incorporate heterogeneity. Equilibrium price data cannot separately identify more complex models from these representative agent models. A. The Risk-Love Class Following Weitzman (1965), we postulate expected utility maximizers with unbiased beliefs and utility U(7): r. In equilibrium, bettors must be indifferent between betting on the favorite horse A with probability
7 explaining the favorite long shot bias 729 Fig. 3. The win data are is completely rationalized by both classes of winning pa and odds of O A/1, and betting on a long shot B with probability of winning p and odds of O /1: B B pu(o ) p pu(o ) (1) A A B B (normalizing utility to zero if the bet is lost). 5 The odds (O A, O B) and the probabilities (p A, p B) of horses winning, which we observe, identify the representative bettor s utility function up to a scaling factor. 6 To fix the scale we normalize utility to zero if the bet loses and to one if the bettor chooses not to bet. Thus, if the bettor is indifferent between accepting and rejecting a gamble offering odds of O/1 that wins with probability p, then U(O) p 1/p. Figure 3A performs precisely this analysis, backing out the utility function required to explain all of the variation in figure 1. As can be seen from figure 3A, a risk-loving utility function is required to rationalize the bettor accepting lower average returns on long shots, even as they are riskier bets. The figure also shows that a constant absolute risk aversion utility function fits the data reasonably well. Several other theories of the favorite long shot bias yield implications that are observationally equivalent to this risk-loving representative 5 We also assume that, consistent with the literature, each bettor chooses to bet on only one horse in a race. 6 See Weitzman (1965), Ali (1977), Quandt (1986), and Jullien and Salanié (2000) for prior examples.
8 730 journal of political economy agent model. Some of these theories are clearly equivalent such as that of Golec and Tamarkin (1998), which argues that bettors prefer skew rather than risk as they are theories about the shape of the utility function. It can easily be shown that richer theories such as that of Thaler and Ziemba (1988), in which bragging rights accrue from winning a bet at long odds, or that of Conlisk (1993), in which the mere purchase of a bet on a long shot may confer some utility are also equivalent. 7 B. The Misperceptions Class Alternatively, the misperceptions class postulates risk-neutral subjective expected utility maximizers, whose subjective beliefs are given by the probability weighting function p(p): [0, 1] r [0, 1]. In equilibrium, there are no opportunities for subjectively expected gain, so bettors must believe that the subjective rates of return to betting on any pair of horses A and B are equal: p(p A)(O A 1) p p(p B)(O B 1) p 1. (2) Consequently, data on the odds (O A, O B) and the probabilities (p A, p B) of horses winning reveal the misperceptions of the representative bettor. 8 Note that the misperceptions class allows more flexibility in the way probabilities enter the representative bettor s value of a bet, but it is more restrictive than the risk-love class in terms of how payoffs enter that function. More to the point, without restrictive parametric assumptions, each class of models is just-identified, so each yields identical predictions for the pricing of win bets. Figure 3B shows the probability weighting function p(p) implied by the data in figure 1. The low rates of return to betting long shots are rationalized by bettors who bet as though horses with tiny probabilities of winning actually have moderate probabilities of winning. The specific 7 Formally, these theories suggest that agents maximize expected utility, where utility is the sum of the felicity of wealth, y(7): r, and the felicity of bragging rights or the thrill of winning, b(7): r. Hence the expected utility to a bettor with initial wealth w 0 of a gamble at odds O that wins with probability p can be expressed as E(U(O)) p p[y(w0 O) b(o)] (1 p)y(w0 1). As before, bettors will accept lower returns on riskier wagers (betting on long shots) if U 1 0. This is possible if either the felicity of wealth is sufficiently convex or bragging rights are increasing in the payoff at a sufficiently increasing rate. More to the point, revealed preference data do not allow us to separately identify effects operating through y(7) rather than b(7). 8 While we term the divergence between p(p) and p misperceptions, in non expected utility theories, p(p) can be interpreted as a preference over types of gambles. Under either interpretation our approach is valid, in that we test whether gambles are motivated by nonlinear functions of wealth or probability. In (2) we implicitly assume that p(1) p 1, although we allow lim p(p) 1. pr1
9 explaining the favorite long shot bias 731 shape of the declining rates of return identifies the probability weighting function at each point. 9 This function shares some of the features of the decision weights in prospect theory (Kahneman and Tversky 1979), and the figure shows that the one-parameter probability weighting function in Prelec (1998) fits the data quite closely. While we have presented a very sparse model, a number of richer theories have been proposed that yield similar implications. 10 For instance, Ottaviani and Sørenson (2010) show that initial information asymmetries between bettors may lead to misperceptions of the true probabilities of horses winning. Moreover, Henery (1985) and Williams and Paton (1997) argue that bettors discount a constant proportion of the gambles in which they bet on a loser, possibly because of a selfserving bias in which losers argue that conditions were atypical. Because long shot bets lose more often, this discounting yields perceptions in which betting on a long shot seems more attractive. C. Implications for Pricing Compound Lotteries We now show how our two classes of models while each is just-identified on the basis of data from win bets yield different implications for the prices of exotic bets. As such, our approach responds to Sauer (1998, 2026), who calls for research that provides equilibrium pricing functions from well-posed models of the wagering market. We examine three types of exotic bets: exactas: a bet on both which horse will come in first and which will come in second, quinellas: a bet on two horses to come in first and second in either order, and trifectas: a bet on which horse will come in first, which second, and which third (in order). We discuss the pricing of exactas (picking the first two horses in order) 9 There remains one minor issue: as fig. 1 shows, horses never win as often as suggested by their win odds because of the track take. Thus we follow the convention in the literature and adjust the odds-implied probabilities by a factor of one minus the track take for that specific race, so that they are on average unbiased; our results are qualitatively similar whether or not we make this adjustment. 10 While the assumption of risk neutrality may be too stark, as long as bettors gamble small proportions of their wealth, the relevant risk premia are second-order. For instance, assuming log utility, if the bettor is indifferent over betting x percent of his wealth on horse A or B, then p(p A) log (w wxo A) [1 p(p A)] log (w wx) p p(p B) log (w wxo B) [1 p(p B)] log (w wx), which under the standard approximation simplifies to p(p A)(OA 1) p(p B)(OB 1), as in (2).
10 732 journal of political economy Risk-Love Class (Risk-Lover, Unbiased Expectations) TABLE 1 Equilibrium Pricing of Exacta Bets Misperceptions Class (Biased Expectations, Risk-Neutral) pp A BFAU(E AB) p 1 p(p A)p(p BFA)(EAB 1) p 1 Noting p p 1/U(O) from (1) Noting p(p) p 1/(O 1) from (2) 1 EAB p U (U(O A)U(O BFA)) (3) EAB p (OA 1)(OBFA 1) 1 (4) in detail. Prices for these bets are constructed from the bettors utility function; indifference conditions, as in (1) or (2); data on the perceived likelihood of the pick for first, A, actually winning ( paor p(p A), de- pending on the class); and conditional on A winning, the likelihood of the pick for second, B, coming in second ( pbfaor p(p BFA) ). Table 1 begins with the fact that a bettor will be indifferent between betting on an exacta on horses A then B in that order, paying odds of E AB/1, and not betting (which yields no change in wealth, and hence a utility of one), and derives equilibrium prices of exactas under both classes. Thus, under the misperceptions class, the odds of the exacta E AB are a simple function of the odds of horse A winning, O A, and conditional on this, on the odds of B coming in second, O BFA. The risk-love class is more demanding, requiring that we estimate the utility function. The utility function is estimated from the pricing of win bets (in fig. 3) and can be inverted to compute unbiased win probabilities from the betting odds. 11 Our empirical tests simply determine which of (3) or (4) better fits the actual prices of exacta bets. We apply an analogous approach to the pricing of quinella and trifecta bets: the intuition is the same; the mathematical details are described in the appendix of Snowberg and Wolfers (2010). Note that both (3) and (4) require O BFA, which is not directly observable. In Section IV we infer the conditional probability p BFA (and hence p(p BFA) and OBFA) from win odds by assuming that bettors believe in conditional independence. That is, we apply the Harville (1973) formula, p(p BFA) p p(p B)/[1 p(p A)], replacing p(p) with p in the risk- love class. This assumption is akin to thinking about the race for second as a race within the race (Sauer 1998). While relying on the Harville 11 Our econometric method imposes continuity on the utility and probability weighting functions; the data mandate that both be strictly increasing. Together this is sufficient to ensure that p(7) and U(7) are invertible. As in fig. 1, we do not have sufficient data to estimate the utility of winning bets at odds greater than 200/1. This prohibits us from pricing bets whose odds are greater than 200/1, which is most limiting for our analysis of trifecta bets.
11 explaining the favorite long shot bias 733 formula is standard in the literature (see, e.g., Asch and Quandt 1987), we show that our results are robust to dropping this assumption and estimating this conditional probability,, directly from the data. p BFA D. Failure to Reduce Compound Lotteries As in prospect theory, the frame the bettor adopts in trying to assess each gamble is a key issue, particularly for misperceptions-based models. Specifically, (4) assumes that bettors first attempt to assess the likelihood of horse A winning, p(p A ), and then assess the likelihood of B coming in second given that A is the winner, p(p BFA). An alternative frame might suggest that bettors directly assess the likelihood of first and second combinations: p(p p ). 12 A BFA There is a direct analogy to the literature on the assessment of compound lotteries: does the bettor separately assess the likelihood of winning an initial gamble (picking the winning horse), which yields a subsequent gamble as its prize (picking the second-place horse), or does she consider the equivalent simple lottery (as in Samuelson [1952])? Consistent with (4), the accumulated experimental evidence (Camerer and Ho 1994) is more in line with subjects failing to reduce compound lotteries into simple lotteries. 13 Alternatively, we could choose not to defend either assumption, leaving it as a matter for empirical testing. Interestingly, if gamblers adopt a frame consistent with the reduction of compound lotteries into their equivalent simple lottery form, this yields a pricing rule for the misperceptions class equivalent to that of the risk-love class. 14 Thus, evidence consistent with what we are calling the risk-love class accommodates either risk-love by unbiased bettors or risk-neutral but biased bettors, whose bias affects their perception of an appropriately reduced compound lottery. By contrast, the competing misperceptions class implies the failure to reduce compound lotteries and posits the specific form of this failure, shown in (4). This discussion implies that results consistent with our risk-love class are also consistent with a richer set of models emphasizing choices over simple gambles. These include models based on the utility of gambling, information asymmetry, or limits to arbitrage, such as Ali (1977), Shin 12 Unless the probability weighting function is a power function ( p(p) p p a ), these different frames yield different implications (Aczél 1966). 13 Additionally, note that (4) satisfies the compound independence axiom of Segal (1990). 14 To see this, note that identical data (from fig. 1) are used to construct the utility and decision weight functions, respectively, so each is constructed to rationalize the same set of choices over simple lotteries. This implies that each class also yields the same set of choices over compound lotteries if preferences in both classes obey the reduction of compound lotteries into equivalent simple lotteries.
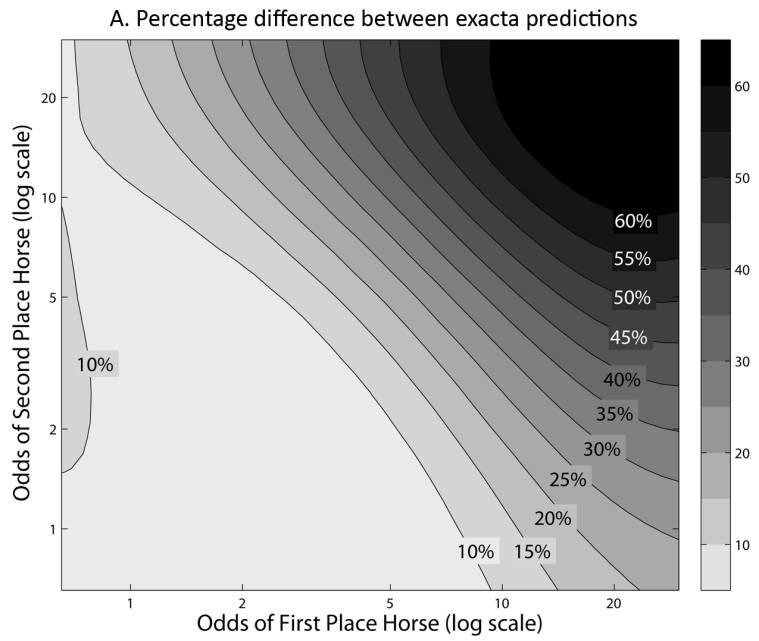
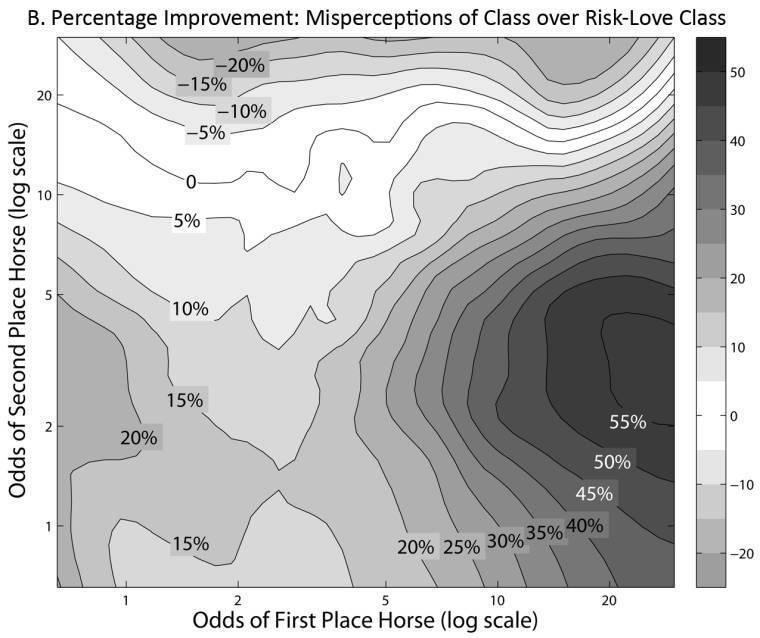
12 734 journal of political economy (1992), Hurley and McDonough (1995), and Manski (2006). Any theory that prescribes a specific bias in a market for a simple gamble (win betting) will yield similar implications in a related market for compound gambles if gamblers assess their equivalent simple gamble form. By implication, rejecting the risk-love class substantially narrows the set of plausible theories of the favorite long shot bias. IV. Results from Exotic Bets Figure 4A shows the difference between the predictions for exactas of the risk-love and misperceptions classes, expressed as a percentage of the predictions. This demonstrates that the two classes of models yield qualitatively different predictions. Exotic bets have relatively low probabilities of winning, so under the risk-love class a risk penalty results, yielding lower odds. By contrast, the misperceptions model is based on the underlying simple lotteries, many of which suffer smaller perception biases. The risk penalty becomes particularly important as odds get longer; thus the difference in predictions grows along a line from the bottom right to the top left of figure 4A. To focus on shorter-odds bets, in table 2 we convert the predictions into the price of a contingent contract that pays $1 if the chosen exacta wins: Price p 1/(Odds 1). We test the ability of each class to predict the observed price by examining the mean absolute error of the predictions of both classes (col. 1). We further investigate which class produces predictions that are closer, observation by observation, to the actual prices (col. 3). The explanatory power of the misperceptions class is substantially greater. The misperceptions class is six percentage points closer to the actual prices of exactas (col. 2), an improvement of 6.3/ 34.3 p 18.4 percent over the risk-love class. Figure 4B plots the improvement of the misperceptions class according to the odds of the first- and second-place horses. When both horses have odds of less than 10/1, which accounts for 70 percent of our data, the average improvement of the misperceptions class over the risk-love class is 16.8 percent. At long odds (the top and right of the figure) there are clear patterns in the data that are not well explained by either class, leaving room for more nuanced theories of the favorite long shot bias. The second and third parts of panel A of table 2 repeat this analysis to see which class can better explain the pricing of quinella and trifecta bets. The intuition is similar in all three cases. Each test, across all three
13 Fig. 4. Differences between theories
14 TABLE 2 No Risk-Preference Model Accounts as Well for Win and Exotic Odds Simultaneously as a Misperceptions Model Test Absolute Error: FPrediction ActualF (1) Absolute % Error: FPrediction ActualF/ Actual (2) Which Prediction Is Closer to Actual? (%) (3) A. Assuming Conditional Independence (Harville 1973) Exacta Bets (n p 197,551) Risk-love class Misperceptions class Risk-love error misperceptions error (.00002) 6.3 (.1) Quinella Bets (n p 70,169) Risk-love class Misperceptions class Risk-love error misperceptions error (.00003) 2.7 (.2) Trifecta Bets (n p 137,756) Risk-love class Misperceptions class Risk-love error misperceptions error (.00001) 42.9 (.2) 736
15 B. Relaxing Conditional Independence Exacta Bets (n p 197,551) Risk-love class Misperceptions class Risk-love error misperceptions error (.00001) 9.3 (.1) Quinella Bets (n p 70,169) Risk-love class Misperceptions class Risk-love error misperceptions error (.00002) 3.9 (.2) Trifecta Bets (n p 137,756) Risk-love class Misperceptions class Risk-love error misperceptions error (.00001) 49.0 (.1) Note. Standard errors are in parentheses. Predictions and actual outcomes are measured in the price of a contract that pays $1 if the event occurs, zero otherwise. 737
16 738 journal of political economy parts, shows that the misperceptions class fits the data better than the risk-love class. 15 Relaxing the assumption of conditional independence. Recall that we observe all the inputs to both pricing functions except O BFA, the odds of horse B finishing second, conditional on horse A winning. Above we used the Harville formula, which rests on the convenient assumption of conditional independence, to assess the likely odds of this bet. Generally, this provides a reasonable approximation of p BFA and, thus, using (1) and (2), O BFA. However, nonparametric techniques provide a better fit. As a robustness check of the results in panel A of table 2, we now use nonparametrically estimated probabilities p BFA. That is, rather than inferring pbfa (and hence p(p BFA) and OBFA) from the Harville formula, we simply apply empirical probabilities estimated directly from the data. That is, our estimate of p BFA reflects how frequently horses with odds of winning O B actually run second in races in which the winner had odds O A. This probability is estimated using the nonparametric, multidimensional Lowess procedure of Cleveland, Devlin, and Grosse (1988). We implement this exercise in panel B of table 2, calculating the price of exotic bets under the risk-love and misperception classes, but adapting our earlier approach so that p is derived from the data. 16 BFA The results in panel B of table 2 are almost identical to those in panel A. For exacta, quinella, and trifecta bets, the misperceptions class has consistently greater explanatory power than the risk-love class. V. Simultaneous Pricing of Exactas and Quinellas Our final test of the two classes of theories relies on the relative pricing of exacta and quinella bets and is more stringent as it considers these bets simultaneously. As before, we derive predictions from each class, and the predictions of the misperceptions class more closely match the data. However, the predictions of the risk-love class exhibit a perverse negative correlation with the data, requiring a more detailed explanation. Deriving predictions. The exacta AB (which represents A winning and 15 We have also rerun these tests a number of other ways to test for robustness. Our conclusions are unaltered by whether or not we weight observations by the size of the betting pool; whether we drop observations in which the classes imply very long odds; whether or not we adjust the classes in the manner described in n. 8; and different functional forms for the price of a bet, including the natural log price of a $1 claim, the odds, or log odds. 16 Because the precision of our estimates of p BFA varies greatly, weighted least squares, weighted by the product of the squared standard error of pbfa and pa, might be appropriate. Additionally, we tried estimating p BFA without using Lowess smoothing. These approaches produced qualitatively identical results.
17 explaining the favorite long shot bias 739 B coming in second) occurs with probability p A# pbfa; the BA exacta occurs with probability p B# pafb. By definition, the corresponding qui- nella pays off when the winning exacta is either AB or BA and hence occurs with probability p A# pbfa p B# pafb. Each model yields unique implications for the relative prices of the winning exacta and quinella bets and thus unique predictions for pp pp A BFA pp A BFA B AFB. (5) This is also the probability that horse A wins given that A and B are the top two finishers. Table 3 begins by considering the AB exacta at odds of E AB/1 and the corresponding quinella at Q /1. Equations (10) and (11) show that for any pair of horses at win odds O A/1 and O B/1 with quinella odds Q /1, each class has different implications for how frequently we expect to observe the AB exacta winning, relative to the BA exacta. That is, each class gives distinct predictions about how often a horse with win odds O A/1 will come in first, given that horses with win odds O A/1 and O B/1 are the top two finishers. What do the data say? As a first test, we regress an indicator for whether the favorite out of horses A and B actually won given that horses A and B finished first and second on the predictions of each model. 17 In this simple specification, the misperceptions class yields a robust and significant positive correlation with actual outcomes (coefficient p 0.63; standard error p 0.014, n p 60,288), and the risk-love class is negatively correlated with outcomes (coefficient p 0.59; standard error p 0.013, n p 60,288). Note that (10) and (11) also yield distinct predictions of the winning exacta even within any set of apparently similar races (those whose first two finishers are at O A/1 and O B/1 with the quinella paying Q /1). Thus, we can include a full set of fixed effects for OA, OB, and Q and their interactions in our statistical tests of the predictions of each class. 18 The residual after differencing out these fixed effects is the predicted likelihood that A beats B, relative to the average for all races in which horses at odds of O A/1 and O B/1 fill the quinella at odds Q /1. That is, for all races we compute the predictions of the likelihood that the exacta with the relative favorite winning (AB) occurs and subtract the baseline O A# O B# Q cell mean to yield the predictions for each class of model, relative to the fixed effects. The results, summarized in figure 5, are 17 In the rare event in which horses A and B had the same odds we coded the indicator as Because the odds O, O, and Q are actually continuous variables, we include fixed A B effects for each percentile of the distribution of each variable (and a full set of interactions of these fixed effects).
18 TABLE 3 Simultaneous Pricing of Exactas and Quinellas Risk-Love Class (Risk-Lover, Unbiased Expectations) Misperceptions Class (Biased Expectations, Risk-Neutral) Exacta pp A BFAU(E AB) p 1 p(p A)p(p BFA)(E AB 1) p 1 U(O ) A p BFA p (6) U(E AB ) ) O A 1 O A 1 1 p(p BFA) p p BFA p p ( (7) E AB 1 E AB 1 Quinella [p Ap BFA pp B AFB ]U(Q) p 1 [p(p A)p(p BFA) p(p B)p(p AFB )](Q 1) p p AFB p U(O B ) [ ] (8) U(Q) U(E AB ) ( ) ( ) 1 1 (O B 1)(E AB Q) 1 p(p AFB) p (O B 1) p AFB p p (9) Q 1 E AB 1 (E AB 1)(Q 1) Hence, from (1), (6), and (8): Hence, from (2), (7), and (9): pp A BFA U(Q) p (10) pp B AFB pp A BFA U(E AB) pp A BFA 1 p ( 1 1 O A 1 ) p O 1 ( E 1 A AB ) ( ) ( ) ( ) ( ) p (11) O (O 1)(E Q) pp A BFA pp B AFB A B AB p p p p O A 1 E AB 1 O B 1 (E AB 1)(Q 1)
19 explaining the favorite long shot bias 741 Fig. 5. Predicting the winning exacta within a quinella: the proportion in which the favored horse beats the long shot, relative to the baseline. The chart shows model predictions from (3) and (4) and actual outcomes relative to a fixed-effect region baseline. For the first-two finishing horses the baseline controls for (a) the odds of the favored horse, (b) the odds of the long shot, (c) the odds of the quinella, and (d) all interactions of a, b, and c. The plot shows model predictions after removing fixed effects, rounded to the nearest percentage point, on the x-axis and actual outcomes, relative to the fixed effects, on the y-axis. remarkably robust to the inclusion of these multiple fixed effects (and interactions): the coefficient on the misperceptions class declines slightly, and insignificantly, whereas the risk-love class maintains a significant but perversely negative correlation with outcomes. It should be clear that this test, by focusing only on the relative rankings of the first two horses, entirely eliminates parametric assumptions about the race for second place. Explaining the negative correlation. Two factors create the perverse negative correlation between the predictions of the risk-love class and the data. First, when the winning quinella is made up of two horses with not too dissimilar odds, the risk-love class predicts that the relative favorite will win with less than a one-half probability whenever it wins and predicts that the relative favorite will win with greater than a one-half probability whenever it loses. Second, as most winning quinellas (and exactas) feature horses with not too dissimilar odds, most of the data are from this range as well, leading to the observed negative correlation. We discuss the data as if they were generated by misperceptions and explain the resulting negative correlation by emphasizing how the predictions of the risk-love class deviate from misperceptions. To fix ideas,
20 742 journal of political economy consider the case in which the relative favorite, A, has win odds of 4/ 1 and the relative long shot, B, has win odds of 9/1. The data give average exacta odds EAB p 39/1 and EBA p 44/1 and average quinella odds Q p 20/1. These data agree extremely closely with the predictions of the misperceptions class, so when (11) is applied to data from such a race, it makes accurate predictions about pp /(pp pp ). 19 A BFA A BFA B AFB A risk-loving bettor is willing to pay a premium for riskier bets; that is, he is willing to accept lower odds than a risk-neutral bettor as probabilities of winning become small. Figure 1 shows that under the risklove class, an exacta bet at odds E p 39/1 has a large risk premium. 20 AB However, the same figure shows that the rate of return from bets on A and B (with odds of 4/1 and 9/1, respectively) is close to the average rate of return on all bets, implying no risk premium in bets on either horse individually. Thus, according to the misperceptions class (as expressed in [4]), there is no risk premium in the observed odds E AB. The difference between the risk-love class and the data, namely, that the risk-love class infers there is a risk-premium built into EAB p 39/1, leads the risk-love class to predict that AB will occur with a lower than actual probability. Specifically, according to the data underlying figure 1, a risk-loving bettor is willing to accept odds of 39/1 for a bet that wins only one out of 54 times. In contrast, if there was no risk premium, the bet would have odds of 53/1. Conversely, when the risk-lover is told an exacta has odds EAB p 39/1, he believes that it has only a one in 54 chance of winning. Or, to put this another way, when the risk-love class is given an exacta with odds EAB p 39/1, it predicts that the numerator of (5), pp A BFA, is when the probability in the data is much closer to The inferred risk premium is much lower for the quinella than for the exacta, which leads the risk-love class to predict a less than 50 percent chance that the relatively favored horse A will finish first out of A and B. Specifically, as shown in figure 1, the rate of return at Q p 20/1 is close to the average, implying almost no risk premium. Thus, the risklove model will predict the denominator of (5), pp A BFA pp B AFB, well at However, as shown in the previous paragraph, the prediction for the numerator of (5) is too small, leading to a prediction that A will win 40 percent of the time if A and B are the top two finishers. But A is the favorite of the two horses ( O A/1 p 4/1! 9/1 p O B/1) and finishes before B 60 percent of the time. If, instead, the relative long shot B wins, the exacta EBA p 44/1 is 19 We adjust figures in this example slightly so that the discussion can ignore the track take. See n. 8 for more on the analytical treatment of the track take. 20 The use of the term risk premium here differs slightly from standard usage, where risk premium refers to the higher payoff risk-averse agents will need to accept a risky bet. Here risk-loving agents are willing to pay a premium for a riskier bet.
21 explaining the favorite long shot bias 743 observed, which leads the risk-love class to predict that there is a lower than 50 percent chance that B wins given that A and B are the top two finishers. Applying the logic above, the risk-love class infers that this price incorporates an even larger risk premium and thus assigns a lower probability to this exacta than to EAB p 39/1. In turn, this means that it yields a low probability of horse B coming in first, given that A and B are the top two finishers. However, the risk-love class will make this prediction only when exacta E BA is observed, that is, when horse B actually wins the race. When the left-hand side of the regression that began this discussion takes a value of one, indicating that horse A has won out of A and B, the right-hand side takes a value of 0.4, indicating that the risk-love model predicts a 40 percent chance of A s victory. Conversely, when the left-hand side is zero, indicating that A has lost, the right-hand side takes a value of Taken together, these two cases imply that there is a negative correlation between the predictions of the risk-love class and the data when the odds of the top two finishers are 4/1 and 9/1. Moreover, the intuition extends to any case in which the odds of the first two horses are not too dissimilar, which describes almost all the races in our data set. When the odds of the first two horses are more dissimilar, for example, 1/1 and 100/1, then both models correctly predict that the 1/1 horse will almost always win. However, such finishes are so rare that they have almost no impact on the analysis, resulting in the observed negative correlation. Summary. The risk-love class fails here because it insists that the same risk premium be priced into all bets of a given risk, regardless of the pool from which the bets are drawn. Yet exotic bets with middling risk relative to the other bets available in a given pool do not tend to attract large risk penalties, even if those bets would be very risky relative to bets in the win pool (Asch and Quandt 1987). These tests show that a model from the risk-love class that accounts for the pricing of win bets yields inaccurate implications for the relative pricing of exacta and quinella bets. By contrast, the misperceptions class is consistent with the pricing of exacta, quinella, and trifecta bets and, as this section shows, also consistent with the relative pricing of exacta and quinella bets. These results are robust to a range of different approaches to testing the theories. VI. Conclusion Employing a new data set that is much larger than those in the existing literature, we document stylized facts about the rates of return to betting on horses. As with other authors, we note a substantial favorite long
22 744 journal of political economy shot bias. The term bias is somewhat misleading here. That the rate of return to betting on horses at long odds is much lower than the return to betting on favorites simply falsifies a model in which bettors maximize a function that is linear in probabilities and linear in payoffs. Thus, the pricing of win bets can be reconciled by a representative bettor with either a concave utility function or a subjective utility function employing nonlinear probability weights that violate the reduction of compound lotteries. For compactness, we referred to the former as explaining the data with risk-love, whereas we refer to the latter as explaining the data with misperceptions. Neither label is particularly accurate since each category includes a wider range of competing theories. We show that these classes of models can be separately identified using aggregate data by requiring that they explain both choices over betting on different horses to win and choices over compound bets: exactas, quinellas, and trifectas. Because the underlying risk or set of beliefs, depending on the theory, is traded in both the win and compound betting markets, we can derive unique testable implications from both sets of theories. Our results are more consistent with the favorite long shot bias being driven by misperceptions rather than by risk-love. Indeed, while each class is individually quite useful for pricing compound lotteries, the misperceptions class strongly dominates the risk-love class. This result is robust to a range of alternative approaches to distinguishing between the theories. This bias likely persists in equilibrium because misperceptions are not large enough to generate profit opportunities for unbiased bettors. That said, the cost of this bias is also very large, and debiasing an individual bettor could reduce his or her cost of gambling substantially. Appendix Data Our data set consists of all horse races run in North America from 1992 to The data were generously provided to us by Axcis Inc., a subsidiary of the Jockey Club. The data record the performance of every horse in each of its starts and contain the universe of officially recorded variables having to do with the horses themselves, the tracks, and race conditions. Our concern is with the pricing of bets. Thus, our primary sample consists of the 6,403,712 observations in 865,934 races for which win odds and finishing positions are recorded. We use these data, subject to the data-cleaning restrictions below, to generate all figures. We are also interested in pricing exacta, quinella, and trifecta bets and have data on the winning payoffs in 314,977, 116,307, and 282,576 races, respectively. The prices of nonwinning combinations are not recorded. Owing to the size of our data set, whenever observations were problematic,
23 explaining the favorite long shot bias 745 we simply dropped the entire race from our data set. Specifically, if a race has more than one horse owned by the same owner, rather than deal with coupled runners, we simply dropped the race. Additionally, if a race had a dead heat for first, second, or third place, the exacta, quinella, and trifecta payouts may not be accurately recorded, and so we dropped these races. When the odds of any horse were reported as zero, we dropped the race. Further, if the odds across all runners implied that the track take was less than 15 percent or more than 22 percent, we dropped the race. After these steps, we are left with 5,606,336 valid observations on win bets from 678,729 races, and 1,485,112 observations from 206,808 races include both valid win odds and payoffs for the winning exotic bets. References Aczél, J Lectures on Functional Equations and Their Applications. New York: Academic Press. Ali, Mukhtar M Probability and Utility Estimates for Racetrack Bettors. J.P.E. 85 (August): Some Evidence of the Efficiency of a Speculative Market. Econometrica 47 (March): Asch, Peter, Burton G. Malkiel, and Richard E. Quandt Racetrack Betting and Informed Behavior. J. Financial Econ. 10 ( July): Asch, Peter, and Richard E. Quandt Efficiency and Profitability in Exotic Bets. Economica 54 (August): Busche, Kelly Efficient Market Results in an Asian Setting. In Efficiency of Racetrack Betting Markets, edited by Donald Hausch, V. Lo, and William T. Ziemba, New York: Academic Press. Busche, Kelly, and Christopher D. Hall An Exception to the Risk Preference Anomaly. J. Bus. 61 ( July): Camerer, Colin F., and Teck Hua Ho Violations of the Betweenness Axiom and Nonlinearity in Probability. J. Risk and Uncertainty 8 (March): Cleveland, William S., Susan J. Devlin, and Eric Grosse Regression by Local Fitting: Methods, Properties, and Computational Algorithms. J. Econometrics 37 (September): Conlisk, John The Utility of Gambling. J. Risk and Uncertainty 6 ( June): Dolbear, F. Trenery Is Racetrack Betting on Exactas Efficient? Economica 60 (February): Friedman, Milton, and Leonard J. Savage The Utility Analysis of Choices Involving Risk. J.P.E. 56 (August): Gabriel, Paul E., and James R. Marsden An Examination of Market Efficiency in British Racetrack Betting. J.P.E. 98 (August): Gandhi, Amit Rational Expectations at the Racetrack: Testing Expected Utility Using Prediction Market Prices. Manuscript, Univ. Wisconsin Madison. Golec, Joseph, and Maurry Tamarkin Bettors Love Skewness, Not Risk, at the Horse Track. J.P.E. 106 (February): Griffith, R. M Odds Adjustments by American Horse-Race Bettors. American J. Psychology 62 (August): Harville, David A Assigning Probabilities to the Outcomes of Multi-entry Competitions. J. American Statis. Assoc. 68 ( June):
Explaining the Favorite-Longshot Bias: Is it Risk-Love, or Misperceptions?
 Explaining the Favorite-Longshot Bias: Is it Risk-Love, or Misperceptions? Erik Snowberg Stanford GSB snowberg_erik@gsb.stanford.edu Justin Wolfers The Wharton School, U.Penn CEPR, IZA, & NBER jwolfers@wharton.upenn.edu
Gamblers Favor Skewness, Not Risk: Further Evidence from United States Lottery Games
 Gamblers Favor Skewness, Not Risk: Further Evidence from United States Lottery Games Thomas A. Garrett Russell S. Sobel Department of Economics West Virginia University Morgantown, West Virginia 26506
EFFICIENCY OF RACETRACK BETTING MARKETS. editors. Donald B Hausch. University of Wisconsin-Madison, USA. Victor SY Lo
 EFFICIENCY OF RACETRACK BETTING MARKETS 2008 Edition editors Donald B Hausch University of Wisconsin-Madison, USA Victor SY Lo University of British Columbia, Canada William TZiemba University of British
BIASES IN ASSESSMENTS OF PROBABILITIES: NEW EVIDENCE FROM GREYHOUND RACES. Dek Terrell* August Abstract
 BIASES IN ASSESSMENTS OF PROBABILITIES: NEW EVIDENCE FROM GREYHOUND RACES Dek Terrell* August 1997 Abstract This paper investigates biases in the perceptions of probabilities using data from the 1989 and
Staking plans in sports betting under unknown true probabilities of the event
 Staking plans in sports betting under unknown true probabilities of the event Andrés Barge-Gil 1 1 Department of Economic Analysis, Universidad Complutense de Madrid, Spain June 15, 2018 Abstract Kelly
What Causes the Favorite-Longshot Bias? Further Evidence from Tennis
 MPRA Munich Personal RePEc Archive What Causes the Favorite-Longshot Bias? Further Evidence from Tennis Jiri Lahvicka 30. June 2013 Online at http://mpra.ub.uni-muenchen.de/47905/ MPRA Paper No. 47905,
An exploration of the origins of the favourite-longshot bias in horserace betting markets
 An exploration of the origins of the favourite-longshot bias in horserace betting markets Alistair Bruce, Johnnie Johnson & Jiejun Yu Centre for Risk Research University of Southampton 1 University of
Skewness is the name of the game
 Edith Cowan University Research Online ECU Publications Pre. 2011 2001 Skewness is the name of the game Y. H. Cheung Cheung, Y. (2001). Skewness is the name of the game. Joondalup, Australia: Edith Cowan
Using Actual Betting Percentages to Analyze Sportsbook Behavior: The Canadian and Arena Football Leagues
 Syracuse University SURFACE College Research Center David B. Falk College of Sport and Human Dynamics October 2010 Using Actual Betting s to Analyze Sportsbook Behavior: The Canadian and Arena Football
Mathematics of Pari-Mutuel Wagering
 Millersville University of Pennsylvania April 17, 2014 Project Objectives Model the horse racing process to predict the outcome of a race. Use the win and exacta betting pools to estimate probabilities
Contingent Valuation Methods
 ECNS 432 Ch 15 Contingent Valuation Methods General approach to all CV methods 1 st : Identify sample of respondents from the population w/ standing 2 nd : Respondents are asked questions about their valuations
Original Article. Correlation analysis of a horse-betting portfolio: the international official horse show (CSIO) of Gijón
 of Gijón") Journal of Physical Education and Sport (JPES), 18(Supplement issue 3), Art 191, pp.1285-1289, 2018 online ISSN: 2247-806X; p-issn: 2247 8051; ISSN - L = 2247-8051 JPES Original Article Correlation analysis
Journal of Physical Education and Sport (JPES), 18(Supplement issue 3), Art 191, pp.1285-1289, 2018 online ISSN: 2247-806X; p-issn: 2247 8051; ISSN - L = 2247-8051 JPES Original Article Correlation analysis
Deciding When to Quit: Reference-Dependence over Slot Machine Outcomes
 Deciding When to Quit: Reference-Dependence over Slot Machine Outcomes By JAIMIE W. LIEN * AND JIE ZHENG * Lien: Department of Economics, School of Economics and Management, Tsinghua University, Beijing,
Working Paper No
 Working Paper No. 2010-05 Prices, Point Spreads and Profits: Evidence from the National Football League Brad R. Humphreys University of Alberta February 2010 Copyright to papers in this working paper series
Game, set and match: The favorite-long shot bias in tennis betting exchanges.
 Game, set and match: The favorite-long shot bias in tennis betting exchanges. Isabel Abinzano, Luis Muga and Rafael Santamaria Public University of Navarre (SPAIN) June 2015 Abstract: We test for the existence
Racetrack Betting: Do Bettors Understand the Odds?
 University of Pennsylvania ScholarlyCommons Statistics Papers Wharton Faculty Research 1994 Racetrack Betting: Do Bettors Understand the Odds? Lawrence D. Brown University of Pennsylvania Rebecca D'Amato
Individual Behavior and Beliefs in Parimutuel Betting Markets
 Mini-Conference on INFORMATION AND PREDICTION MARKETS Individual Behavior and Beliefs in Parimutuel Betting Markets Frédéric KOESSLER University of Cergy-Pontoise (France) Charles NOUSSAIR Faculty of Arts
Peer Reviewed. Abstract
 Peer Reviewed Richard A. Paulson rapaulson@stcloudstate.edu is a Professor in the Business Computer Information Systems Department, St. Cloud State University. Abstract Gambling markets have historically
Empirical Evidence on the Preferences of Racetrack Bettors
 Empirical Evidence on the Preferences of Racetrack Bettors Bruno Jullien Bernard Salanié May 2005. Forthcoming chapter in Efficiency of Sports and Lottery Markets, Handbook in Finance series, D. Hausch
Power-law distribution in Japanese racetrack betting
 Power-law distribution in Japanese racetrack betting Takashi Ichinomiya Nonlinear Studies and Computation, Research Institute for Electronic Science, Hokkaido University, Sapporo 060-0812, Japan. Abstract
A Failure of the No-Arbitrage Principle
 London School of Economics and Political Science From the SelectedWorks of Kristof Madarasz 2007 A Failure of the No-Arbitrage Principle Kristof Madarasz, London School of Economics and Political Science
Racial Bias in the NBA: Implications in Betting Markets
 Brigham Young University BYU ScholarsArchive All Faculty Publications 2008-04-01 Racial Bias in the NBA: Implications in Betting Markets Tim Larsen tlarsen@byu.net Joe Prince See next page for additional
Are Longshots Only for Losers? A New Look at the Last Race Effect
 Journal of Behavioral Decision Making, J. Behav. Dec. Making, 29: 25 36 (2016) Published online 29 March 2015 in Wiley Online Library (wileyonlinelibrary.com).1873 Are Longshots Only for Losers? A New
Behavior under Social Pressure: Empty Italian Stadiums and Referee Bias
 Behavior under Social Pressure: Empty Italian Stadiums and Referee Bias Per Pettersson-Lidbom a and Mikael Priks bc* April 11, 2010 Abstract Due to tightened safety regulation, some Italian soccer teams
Fit to Be Tied: The Incentive Effects of Overtime Rules in Professional Hockey
 Fit to Be Tied: The Incentive Effects of Overtime Rules in Professional Hockey Jason Abrevaya Department of Economics, Purdue University 43 West State St., West Lafayette, IN 4797-256 This version: May
Game Theory (MBA 217) Final Paper. Chow Heavy Industries Ty Chow Kenny Miller Simiso Nzima Scott Winder
 Final Paper. Chow Heavy Industries Ty Chow Kenny Miller Simiso Nzima Scott Winder") Game Theory (MBA 217) Final Paper Chow Heavy Industries Ty Chow Kenny Miller Simiso Nzima Scott Winder Introduction The end of a basketball game is when legends are made or hearts are broken. It is what
Game Theory (MBA 217) Final Paper Chow Heavy Industries Ty Chow Kenny Miller Simiso Nzima Scott Winder Introduction The end of a basketball game is when legends are made or hearts are broken. It is what
Analyses of the Scoring of Writing Essays For the Pennsylvania System of Student Assessment
 Analyses of the Scoring of Writing Essays For the Pennsylvania System of Student Assessment Richard Hill The National Center for the Improvement of Educational Assessment, Inc. April 4, 2001 Revised--August
Hot Hand or Invisible Hand: Which Grips the Football Betting Market?
 Hot Hand or Invisible Hand: Which Grips the Football Betting Market? Ladd Kochman Ken Gilliam David Bray Coles College of Business Kennesaw State University Hot Hand or Invisible Hand: Which Grips the
Framing Effects in the Field: Evidence from Two Million Bets
 : Evidence from Two Million Bets Alasdair Brown University of East Anglia Fuyu Yang University of East Anglia November 6, 2017 We would like to thank Amrish Patel and Bob Sugden for very helpful comments.
At each type of conflict location, the risk is affected by certain parameters:
 TN001 April 2016 The separated cycleway options tool (SCOT) was developed to partially address some of the gaps identified in Stage 1 of the Cycling Network Guidance project relating to separated cycleways.
A REVIEW OF AGE ADJUSTMENT FOR MASTERS SWIMMERS
 A REVIEW OF ADJUSTMENT FOR MASTERS SWIMMERS Written by Alan Rowson Copyright 2013 Alan Rowson Last Saved on 28-Apr-13 page 1 of 10 INTRODUCTION In late 2011 and early 2012, in conjunction with Anthony
A SURVEY OF 1997 COLORADO ANGLERS AND THEIR WILLINGNESS TO PAY INCREASED LICENSE FEES
 Executive Summary of research titled A SURVEY OF 1997 COLORADO ANGLERS AND THEIR WILLINGNESS TO PAY INCREASED LICENSE FEES Conducted by USDA Forest Service Rocky Mountain Research Station Fort Collins,
High Bets for the Win?
 High Bets for the Win? The Role of Stake Size in Sports Betting Radek Janhuba & Jakub Mikulka (CERGE-EI) June 4, 2018 Latest version: http://www.radekjanhuba.com/files/rjjm_stakes.pdf Abstract We analyze
This article appeared in a journal published by Elsevier. The attached copy is furnished to the author for internal non-commercial research and
 This article appeared in a journal published by Elsevier. The attached copy is furnished to the author for internal non-commercial research and education use, including for instruction at the authors institution
Bhagwant N. Persaud* Richard A. Retting Craig Lyon* Anne T. McCartt. May *Consultant to the Insurance Institute for Highway Safety
 Review of The Impact of Red Light Cameras (Photo-Red Enforcement) on Crashes in Virginia by Nicholas J. Garber, John S. Miller, R. Elizabeth Abel, Saeed Eslambolchi, and Santhosh K. Korukonda Bhagwant
Revisiting the Hot Hand Theory with Free Throw Data in a Multivariate Framework
 Calhoun: The NPS Institutional Archive DSpace Repository Faculty and Researchers Faculty and Researchers Collection 2010 Revisiting the Hot Hand Theory with Free Throw Data in a Multivariate Framework
Chance and Uncertainty: Probability Theory
 Chance and Uncertainty: Probability Theory Formally, we begin with a set of elementary events, precisely one of which will eventually occur. Each elementary event has associated with it a probability,
Existence of Nash Equilibria
 Existence of Nash Equilibria Before we can prove the existence, we need to remind you of the fixed point theorem: Kakutani s Fixed Point Theorem: Consider X R n a compact convex set and a function f: X
Legendre et al Appendices and Supplements, p. 1
 Legendre et al. 2010 Appendices and Supplements, p. 1 Appendices and Supplement to: Legendre, P., M. De Cáceres, and D. Borcard. 2010. Community surveys through space and time: testing the space-time interaction
Elsevier fm-n50744.pdf 2008/5/17 6:52 pm Page: i Trim: 7.5in 9.25in Floats: Top/Bot TS: diacritech, India HANDBOOK OF SPORTS AND LOTTERY MARKETS
 Elsevier fm-n50744.pdf 2008/5/17 6:52 pm Page: i Trim: 7.5in 9.25in Floats: Top/Bot TS: diacritech, India HANDBOOK OF SPORTS AND LOTTERY MARKETS Elsevier fm-n50744.pdf 2008/5/17 6:52 pm Page: ii Trim:
The Simple Linear Regression Model ECONOMETRICS (ECON 360) BEN VAN KAMMEN, PHD
 BEN VAN KAMMEN, PHD") The Simple Linear Regression Model ECONOMETRICS (ECON 360) BEN VAN KAMMEN, PHD Outline Definition. Deriving the Estimates. Properties of the Estimates. Units of Measurement and Functional Form. Expected
The Simple Linear Regression Model ECONOMETRICS (ECON 360) BEN VAN KAMMEN, PHD Outline Definition. Deriving the Estimates. Properties of the Estimates. Units of Measurement and Functional Form. Expected
JACKPOT PITFALLS IN EGM PLAYING: DETERMINISTIC OR PROGRESSIVE?
 1 JACKPOT PITFALLS IN EGM PLAYING: DETERMINISTIC OR PROGRESSIVE? En Li, Matthew Rockloff, Phillip Donaldson, Matthew Browne, and Erika Langham Experimental Gambling Research Laboratory, Central Queensland
Tilburg University. Bets and Bids Potters, Jan; Wit, J. Publication date: Link to publication
 Tilburg University Bets and Bids Potters, Jan; Wit, J. Publication date: 1996 Link to publication Citation for published version (APA): Potters, J. J. M., & Wit, J. (1996). Bets and Bids: Favorite-Longshot
Information effects in major league baseball betting markets
 Applied Economics, 2012, 44, 707 716 Information effects in major league baseball betting markets Matt E. Ryan a, *, Marshall Gramm b and Nicholas McKinney b a Department of Economics and Quantitative
A Case Study of Leadership in Women s Intercollegiate Softball. By: DIANE L. GILL and JEAN L. PERRY
 A Case Study of Leadership in Women s Intercollegiate Softball By: DIANE L. GILL and JEAN L. PERRY Gill, D.L. & Perry, J.L. (1979). A case study of leadership in women's intercollegiate softball. International
What does it take to produce an Olympic champion? A nation naturally
 Survival of the Fittest? An Econometric Analysis in to the Effects of Military Spending on Olympic Success from 1996-01. Mark Frahill The Olympics are the world s greatest sporting celebrations, seen as
Proceedings of Meetings on Acoustics
 Proceedings of Meetings on Acoustics Volume 9, 2010 http://acousticalsociety.org/ 159th Meeting Acoustical Society of America/NOISE-CON 2010 Baltimore, Maryland 19-23 April 2010 Session 1pBB: Biomedical
ROUNDABOUT CAPACITY: THE UK EMPIRICAL METHODOLOGY
 ROUNDABOUT CAPACITY: THE UK EMPIRICAL METHODOLOGY 1 Introduction Roundabouts have been used as an effective means of traffic control for many years. This article is intended to outline the substantial
a) List and define all assumptions for multiple OLS regression. These are all listed in section 6.5
 List and define all assumptions for multiple OLS regression. These are all listed in section 6.5") Prof. C. M. Dalton ECN 209A Spring 2015 Practice Problems (After HW1, HW2, before HW3) CORRECTED VERSION Question 1. Draw and describe a relationship with heteroskedastic errors. Support your claim with
Prof. C. M. Dalton ECN 209A Spring 2015 Practice Problems (After HW1, HW2, before HW3) CORRECTED VERSION Question 1. Draw and describe a relationship with heteroskedastic errors. Support your claim with
Sportsbook pricing and the behavioral biases of bettors in the NHL
 Syracuse University SURFACE College Research Center David B. Falk College of Sport and Human Dynamics December 2009 Sportsbook pricing and the behavioral biases of bettors in the NHL Rodney Paul Syracuse
Introduction to Pattern Recognition
 Introduction to Pattern Recognition Jason Corso SUNY at Buffalo 12 January 2009 J. Corso (SUNY at Buffalo) Introduction to Pattern Recognition 12 January 2009 1 / 28 Pattern Recognition By Example Example:
Lesson 14: Games of Chance and Expected Value
 Student Outcomes Students use expected payoff to compare strategies for a simple game of chance. Lesson Notes This lesson uses examples from the previous lesson as well as some new examples that expand
Evaluating the Influence of R3 Treatments on Fishing License Sales in Pennsylvania
 Evaluating the Influence of R3 Treatments on Fishing License Sales in Pennsylvania Prepared for the: Pennsylvania Fish and Boat Commission Produced by: PO Box 6435 Fernandina Beach, FL 32035 Tel (904)
Swinburne Research Bank
 Swinburne Research Bank http://researchbank.swinburne.edu.au Combining player statistics to predict outcomes of tennis matches. Tristan Barnet & Stephen R. Clarke. IMA journal of management mathematics
Queue analysis for the toll station of the Öresund fixed link. Pontus Matstoms *
 Queue analysis for the toll station of the Öresund fixed link Pontus Matstoms * Abstract A new simulation model for queue and capacity analysis of a toll station is presented. The model and its software
Measuring Returns to Scale in Nineteenth-Century French Industry Technical Appendix
 Measuring Returns to Scale in Nineteenth-Century French Industry Technical Appendix Ulrich Doraszelski Hoover Institution, Stanford University March 2004 Formal Derivations Gross-output vs value-added
Calculation of Trail Usage from Counter Data
 1. Introduction 1 Calculation of Trail Usage from Counter Data 1/17/17 Stephen Martin, Ph.D. Automatic counters are used on trails to measure how many people are using the trail. A fundamental question
the 54th Annual Conference of the Association of Collegiate School of Planning (ACSP) in Philadelphia, Pennsylvania November 2 nd, 2014
 in Philadelphia, Pennsylvania November 2 nd, 2014") the 54th Annual Conference of the Association of Collegiate School of Planning (ACSP) in Philadelphia, Pennsylvania November 2 nd, 2014 Hiroyuki Iseki, Ph.D. Assistant Professor Urban Studies and Planning
the 54th Annual Conference of the Association of Collegiate School of Planning (ACSP) in Philadelphia, Pennsylvania November 2 nd, 2014 Hiroyuki Iseki, Ph.D. Assistant Professor Urban Studies and Planning
Diachronic Dutch Books and Sleeping Beauty. One version of the Sleeping Beauty problem (Elga 2000) is this: Beauty is the subject of an
 is this: Beauty is the subject of an") Diachronic Dutch Books and Sleeping Beauty One version of the Sleeping Beauty problem (Elga 2000) is this: Beauty is the subject of an experiment that begins when she is put to sleep on Sunday night. She
Diachronic Dutch Books and Sleeping Beauty One version of the Sleeping Beauty problem (Elga 2000) is this: Beauty is the subject of an experiment that begins when she is put to sleep on Sunday night. She
The final set in a tennis match: four years at Wimbledon 1
 Published as: Journal of Applied Statistics, Vol. 26, No. 4, 1999, 461-468. The final set in a tennis match: four years at Wimbledon 1 Jan R. Magnus, CentER, Tilburg University, the Netherlands and Franc
Extreme Shooters in the NBA
 Extreme Shooters in the NBA Manav Kant and Lisa R. Goldberg 1. Introduction December 24, 2018 It is widely perceived that star shooters in basketball have hot and cold streaks. This perception was first
Assessment Summary Report Gulf of Mexico Red Snapper SEDAR 7
 Assessment Summary Report Gulf of Mexico Red Snapper SEDAR 7 Stock Distribution: Red snapper are found throughout the Gulf of Mexico, the Caribbean Sea, and from the U.S. Atlantic Coast to northern South
Market Efficiency and Behavioral Biases in the WNBA Betting Market
 Int. J. Financial Stud. 2014, 2, 193 202; doi:10.3390/ijfs2020193 Article OPEN ACCESS International Journal of Financial Studies ISSN 2227-7072 www.mdpi.com/journal/ijfs Market Efficiency and Behavioral
Compression Study: City, State. City Convention & Visitors Bureau. Prepared for
 : City, State Prepared for City Convention & Visitors Bureau Table of Contents City Convention & Visitors Bureau... 1 Executive Summary... 3 Introduction... 4 Approach and Methodology... 4 General Characteristics
Percentage. Year. The Myth of the Closer. By David W. Smith Presented July 29, 2016 SABR46, Miami, Florida
 The Myth of the Closer By David W. Smith Presented July 29, 216 SABR46, Miami, Florida Every team spends much effort and money to select its closer, the pitcher who enters in the ninth inning to seal the
Value of time, safety and environment in passenger transport Time
 TØI report 1053B/2010 Author(s): Farideh Ramjerdi, Stefan Flügel, Hanne Samstad and Marit Killi Oslo 2010, 324 pages Norwegian language Summary: Value of time, safety and environment in passenger transport
Building a Solid Foundation
 Frandsen Publishing Presents Favorite ALL-Ways TM Newsletter Articles Building a Solid Foundation The Foundation Wagers The Foundation Handicapping Skills Background Frandsen Publishing has published quarterly
In Search of Sure Things An Analysis of Market Efficiency in the NFL Betting Market
 In Search of Sure Things An Analysis of Market Efficiency in the NFL Betting Market By: Rick Johnson Advisor: Professor Eric Schulz Submitted for Honors in Mathematical Methods in the Social Sciences Spring,
Department of Economics Working Paper
 Department of Economics Working Paper Number 15-13 December 2015 Are Findings of Salary Discrimination Against Foreign-Born Players in the NBA Robust?* James Richard Hill Central Michigan University Peter
SESSIONS OF IFHA CONFERENCE IN PARIS BETTING / STIMULATING WAGERING TURNOVER - HONG KONG
 ORGANIZACIÓN SUDAMERICANA DE FOMENTO DEL SANGRE PURA DE CARRERA OSAF NEWS November 21st, 2018 SESSIONS OF IFHA CONFERENCE IN PARIS BETTING / STIMULATING WAGERING TURNOVER - HONG KONG Continuing with Session
Volume 37, Issue 3. Elite marathon runners: do East Africans utilize different strategies than the rest of the world?
 Volume 37, Issue 3 Elite marathon runners: do s utilize different strategies than the rest of the world? Jamie Emerson Salisbury University Brian Hill Salisbury University Abstract This paper investigates
CHAPTER 10 TOTAL RECREATIONAL FISHING DAMAGES AND CONCLUSIONS
 CHAPTER 10 TOTAL RECREATIONAL FISHING DAMAGES AND CONCLUSIONS 10.1 INTRODUCTION This chapter provides the computation of the total value of recreational fishing service flow losses (damages) through time
The Favorite-Longshot Midas
 The Favorite-Longshot Midas Etan A. Green 1, Haksoo Lee 1, and David Rothschild 2 1 University of Pennsylvania 2 Microsoft Research June 1, 2018 Abstract The favorite-longshot bias in horse race betting
From Bombe stops to Enigma keys
 From Bombe stops to Enigma keys A remarkably succinct description of the Bombe written many years ago, reads as follows:- The apparatus for breaking Enigma keys, by testing a crib and its implications
1. OVERVIEW OF METHOD
 1. OVERVIEW OF METHOD The method used to compute tennis rankings for Iowa girls high school tennis http://ighs-tennis.com/ is based on the Elo rating system (section 1.1) as adopted by the World Chess
The Impact of TennCare: A Survey of Recipients 2009
 The Impact of TennCare: A Survey of Recipients 2009 Christopher Carty Research Associate, Center for Business and Economic Research William F. Fox Director, Center for Business and Economic Research and
Analysis of Shear Lag in Steel Angle Connectors
 University of New Hampshire University of New Hampshire Scholars' Repository Honors Theses and Capstones Student Scholarship Spring 2013 Analysis of Shear Lag in Steel Angle Connectors Benjamin Sawyer
Professionals Play Minimax: Appendix
 Professionals Play Minimax: Appendix Ignacio Palacios-Huerta Brown University July 2002 In this supplementary appendix we first report additional descriptive statistics in section 1. We begin by reporting
ECO 745: Theory of International Economics. Jack Rossbach Fall Lecture 6
 ECO 745: Theory of International Economics Jack Rossbach Fall 2015 - Lecture 6 Review We ve covered several models of trade, but the empirics have been mixed Difficulties identifying goods with a technological
Competitive Performance of Elite Olympic-Distance Triathletes: Reliability and Smallest Worthwhile Enhancement
 SPORTSCIENCE sportsci.org Original Research / Performance Competitive Performance of Elite Olympic-Distance Triathletes: Reliability and Smallest Worthwhile Enhancement Carl D Paton, Will G Hopkins Sportscience
Surprisals Revisited. Outcome Surprisal
 Surprisals Revisited Outcome Surprisal Last year we looked at surprisals for the first time, using them as a way of estimating how unlikely were each weekend's results. You might recall that we measure
Why are Gambling Markets Organized so Differently than Financial Markets? *
 Why are Gambling Markets Organized so Differently than Financial Markets? * Steven D. Levitt University of Chicago and American Bar Foundation slevitt@midway.uchicago.edu August 2003 * Department of Economics,
Efficiency Wages in Major League Baseball Starting. Pitchers Greg Madonia
 Efficiency Wages in Major League Baseball Starting Pitchers 1998-2001 Greg Madonia Statement of Problem Free agency has existed in Major League Baseball (MLB) since 1974. This is a mechanism that allows
Investigating the effects of interchanging components used to perform ripple assessments on calibrated vector network analysers
 Abstract Investigating the effects of interchanging components used to perform ripple assessments on calibrated vector network analysers Andrew G Morgan and Nick M Ridler Centre for Electromagnetic and
OR DUNGENESS CRAB FISHERY:
 E 55 OR DUNGENESS CRAB FISHERY: an economic analysis of productivity and profitability David S. Liao Joe B. Stevens OREGON STATE UNIVERSITY SEA GRANT COLLEGE PROGRAM Publication no. ORESU-T-75-005 AGRICULTURAL
October 2009, Number 55 ALL-WAYS TM NEWSLETTER
 October 2009, Number 55 ALL-WAYS TM NEWSLETTER Inside This Newsletter The 2009 Breeders Cup Hedging Your Bets Call for Guest Articles Announcements Breeders' Cup Help For ALL-Ways users, special ALL-Ways
Economic Welfare Evaluation of Gambling Behavior
 Economic Welfare Evaluation of Gambling Behavior Glenn W. Harrison, Morten I. Lau*, Don Ross and J. Todd Swarthout *Copenhagen Business School We are grateful to the Danish Social Science Research Council
Kobe University Repository : Kernel
 Kobe University Repository : Kernel タイトル Title 著者 Author(s) 掲載誌 巻号 ページ Citation 刊行日 Issue date 資源タイプ Resource Type 版区分 Resource Version 権利 Rights Lock! Risk-Free Arbitrage in the Japanese Racetrack Betting
University of Nevada, Reno. The Effects of Changes in Major League Baseball Playoff Format: End of Season Attendance
 University of Nevada, Reno The Effects of Changes in Major League Baseball Playoff Format: End of Season Attendance A thesis submitted in partial fulfillment of the requirements for the degree of Master
2010 TRAVEL TIME REPORT
 CASUALTY ACTUARIAL SOCIETY EDUCATION POLICY COMMITTEE 2010 TRAVEL TIME REPORT BIENNIAL REPORT TO THE BOARD OF DIRECTORS ON TRAVEL TIME STATISTICS FOR CANDIDATES OF THE CASUALTY ACTUARIAL SOCIETY June 2011
Equation 1: F spring = kx. Where F is the force of the spring, k is the spring constant and x is the displacement of the spring. Equation 2: F = mg
 1 Introduction Relationship between Spring Constant and Length of Bungee Cord In this experiment, we aimed to model the behavior of the bungee cord that will be used in the Bungee Challenge. Specifically,
EEC 686/785 Modeling & Performance Evaluation of Computer Systems. Lecture 6. Wenbing Zhao. Department of Electrical and Computer Engineering
 EEC 686/785 Modeling & Performance Evaluation of Computer Systems Lecture 6 Department of Electrical and Computer Engineering Cleveland State University wenbing@ieee.org Outline 2 Review of lecture 5 The
An Application of Signal Detection Theory for Understanding Driver Behavior at Highway-Rail Grade Crossings
 An Application of Signal Detection Theory for Understanding Driver Behavior at Highway-Rail Grade Crossings Michelle Yeh and Jordan Multer United States Department of Transportation Volpe National Transportation
Verification of Peening Intensity
 academic study by Dr. David Kirk Coventry University Verification of Peening Intensity INTRODUCTION Verification of peening intensity is described in SAE J443 using just the three paragraphs of section
Outline. Terminology. EEC 686/785 Modeling & Performance Evaluation of Computer Systems. Lecture 6. Steps in Capacity Planning and Management
 EEC 686/785 Modeling & Performance Evaluation of Computer Systems Lecture 6 Department of Electrical and Computer Engineering Cleveland State University wenbing@ieee.org Outline Review of lecture 5 The
PREDICTING the outcomes of sporting events
 CS 229 FINAL PROJECT, AUTUMN 2014 1 Predicting National Basketball Association Winners Jasper Lin, Logan Short, and Vishnu Sundaresan Abstract We used National Basketball Associations box scores from 1991-1998
Non-motorized Transportation Planning Resource Book Mayor s Task Force on Walking and Bicycling City of Lansing, Michigan Spring 2007 pg.
 Non-motorized Transportation Planning Resource Book pg. 105 of 158 Non-motorized Transportation Planning Resource Book pg. 106 of 158 Non-motorized Transportation Planning Resource Book pg. 107 of 158
TRIP GENERATION RATES FOR SOUTH AFRICAN GOLF CLUBS AND ESTATES
 TRIP GENERATION RATES FOR SOUTH AFRICAN GOLF CLUBS AND ESTATES M M Withers and C J Bester Department of Civil Engineering University of Stellenbosch, Private Bag X1, Matieland, 7602 ABSTRACT There has
Understanding the interest-rate growth differential: its importance in long-term debt projections and for policy
 Understanding the interest-rate growth differential: its importance in long-term debt projections and for policy David Turner, OECD UN DESA Expert Group Meeting on the World Economy, LINK Project October
ANALYZING THE SHIP DISPOSAL OPTIONS
 Chapter Six ANALYZING THE SHIP DISPOSAL OPTIONS Chapters Two through Five examined the option of long-term storage and the three ship-disposal options: domestic recycling, overseas recycling, and reefing.