Remote Gambling Research. Interim report on Phase II
|
|
|
- Sabina Caldwell
- 6 years ago
- Views:
Transcription

1 Remote Gambling Research Interim report on Phase II August 2017
2 Important notice This publication has been prepared for general guidance on matters of interest only, and does not constitute professional advice. You should not act upon the information contained in this publication without obtaining specific professional advice. To the extent permitted by law, PricewaterhouseCoopers LLP ( PwC ), its members, employees and agents do not accept or assume any liability, responsibility or duty of care (other than to its client, Responsible Gambling Trust) to any person for the preparation of this publication, nor will recipients of the publication be treated as clients of PwC by virtue of their receiving the publication. Accordingly to the extent permitted by applicable law, PwC accepts no liability of any kind and disclaims all responsibility for the consequences of any person acting or refraining to act in reliance on this publication or for any decisions made or not made which are based upon the publication. This publication includes information obtained or derived from a variety of publicly available sources. PwC has not sought to establish the reliability of these sources or verified such information. PwC does not give any representation or warranty of any kind (whether express or implied) as to the accuracy or completeness of this publication. The publication is for general guidance only and does not constitute investment or any other advice. Accordingly, it is not intended to form the basis of any investment decisions and does not absolve any third party from conducting its own due diligence in order to verify its contents. Before making any decision or taking any action, the recipient should consult a professional adviser.
3 Contents 1. Key messages from Phase Background and context Phase 2 introduction Phase 2 approach Method Descriptive analysis Results Marker testing Application discussion Recommendations for Phase Glossary Appendix... 72
4 1. Key messages from Phase 2 Gamble Aware has commissioned a programme of research aiming to explore the potential usefulness of industry-held data and behavioural analytics in the remote gambling sector, primarily to indicate markers of harmful or risky behaviour and then to recommend practical applications of harm minimisation. Importantly, there is an emphasis on how harmful and risky behaviour can be mitigated, not just if it can be identified and mitigated. Phase 2 is part of a three phase programme to achieve this objective. Phase 1 was published in April 2016 [link] and comprised a literature review and consultation with seven UK-facing online operators. Phase 2 focuses on whether practical behavioural markers of problem gambling in a remote context can be identified from data operators have access to. This is an exploratory phase that illustrates approaches that could be taken to reduce harm in the remote gambling sector. For the Phase 2 study we surveyed over 160,000 UK-based customers from four large remote gambling operators to identify problem gamblers using the PGSI screen, supplemented by demographic and behavioural questions such as use of multiple online accounts and use of other gambling products (e.g. retail gaming machines). The c. 10,000 respondents transactional and account data were collected from the operators, unified into one consistent data set and enriched with over 200 metrics to understand volume, volatility, value, duration and frequency of play on a daily basis and between days. Using behavioural analytics techniques we tested a set of hypotheses. The results have important implications for harm minimisation in the remote gambling industry: The remote gambling industry could accurately detect problem gamblers using data held by operators today, with a refined set of 22 predictive markers used to create a customer specific risk score Demographic markers could be used today to filter some higher risk customers at account creation Behavioural markers (e.g. bet value, day of the week) significantly improve the precision of predictions and identify more problem gamblers than demographics alone Segmenting gamblers by their product and play activity improves predictions further. This is more accurate than a one size fits all approach. A risk score can be calculated with 1 week of transactional data. The accuracy of this risk score builds over time with strong predictive capability within 3-6 months. Specific daily triggers can complement predictive markers by identifying harmful behaviour in-the-moment. We have identified 39 daily-triggers allowing operators to investigate and intervene almost immediately. A tailored intervention (e.g. monitor, message, limit, freeze) based on different risk thresholds could provide a practical approach to balancing hit-rate and precision. This enables detection and management of gamblers in a risk-appropriate way without creating a large group of false positives that will create significant costs for operators to investigate. Application of this approach in live operator environments would allow a more effective and automated mechanism for the identification of problem gamblers or behaviour indicative of 1
5 problem gambling. Phase 1 noted that the main method operators currently use to determine where there is actual or potential harm occurring, such that an operator will limit a customer s ability to bet, is through a number of manual review processes such as a conversation with a trained call centre expert. Developing a more automated mechanism would also allow more consistent problem gambler classification and mitigation across the industry, which would be lower cost and reduce the rate of false negatives i.e. those problem gamblers that go undetected because they rely on a reaction by the operator such as a call centre alert to be detected. Furthermore, this approach is not reliant on using self-exclusion as a proxy for problem gambling, which Phase 1 noted was problematic and our survey results have confirmed: 80% of self-defined problem gamblers have never used a self-exclusion tool; only 31% of those that have self-excluded in the past self-define as a problem gambler. An important caveat is that our survey identified a significant level of multi-site usage which could be driving some misclassification of risk scores, particularly in what appear to us as low betting segments c. 75% of problem gamblers told us they currently use more than one site to gamble remotely. This suggests that single operator detection systems based on behavioural analytics have an inherent limitation. To move forward as an industry, we believe a number of important questions need to be answered: What further steps could be taken to build the industry s confidence in a model that identifies problematic play in an automated way? How practical would it be for the industry to use these markers day-to-day in an operational environment? What industry interventions can actually change the patterns of play in at-risk players and therefore reduce harm? How can the industry coordinate to apply a common standard to harm minimisation and avoid the potential commercial disadvantage of being a first-mover? How can the industry address the problems of detection and intervention in a multi-site environment? What about multi-channel considerations? We therefore recommend in Phase 3 an approach whereby a group of operators, via a pilot, test these markers and the approaches developed within an operational environment to refine and adapt them for ongoing usage while understanding the impact of a range of interventions on the behaviour of at-risk players. In parallel the multi-operator usage question should be examined starting with the data privacy limitations of sharing customer data. The Phase 3 outcome would be an operational model containing markers that can be adopted by operators across the industry to detect at-risk customers in a consistent way. In addition, it will recommend interventions that have been evaluated for their impact on reducing harmful or risky gambling behaviour, and the practicality of these interventions. 2
6 2. Background and context 2.1 Programme context Consumers have significantly increased the amount of time and money they spend online. So too has there been a significant increase in the use of the internet to gamble. Remote gambling has become a major part of the estimated 15bn UK gambling industry 1,2 accounting for an estimated 41% share in The UK market includes lottery, betting on sports and other events, gaming machines, casino and bingo, all of which can be played via land-based and remote channels. While remote gambling 3 can theoretically use any form of remote communications device, the predominant method is internet gambling, whether using a computer, tablet or mobile phone. In particular, gambling using mobile devices has grown significantly in recent years (now accounting for an estimated 34% of remote gambling) and has made gambling remotely more easy and accessible than ever. The harmful effects 4 of problematic gambling is recognised as a key issue for the gambling industry as a whole. Gambling-related harm has been defined as both personal (e.g. health, wellbeing, relationships) and economic (e.g. financial) harm that occurs from exceeding one s disposable income or disposable leisure time. 5 According to the 2010 British Gambling Prevalence Survey, of the several millions of gamblers in the country, approximately 451,000 6 can be classed as problem gamblers. 7 Online slot machine games are associated with the second highest proportion of those identified as problem gamblers in Britain (9.1% of all), second only to pub/club poker (12.8%). 7 The British prevalence study also found that those engaging in both online and offline forms of gambling featured higher rates of gambling involvement and gambling problems than single-mode players. 8 To address this growing concern, an improved understanding of the risk factors 9 and the development of effective mitigants for problematic gambling is particularly important for 1 All H2 Gambling Capital estimates, April Measured by UK player gross gambling revenue 2016; all betting and gaming, land based and remote. 3 In the UK, the Gambling Act (2005) describes remote gambling as involving the use of remote communications, including: Internet, telephone, television, radio and any other form of electronic or technological communication. 4 By harms we mean the adverse financial, personal and social consequences to players, their families and wider social networks that can be caused by uncontrolled gambling. Harm from remote gambling is reflected in negative consequences resulting from problematic gambling behaviour. Much like its land-based counterparts, remote gambling harm can include financial distress, psychological problems, relationship troubles, criminal activity, poor physical health, and employment issues. These types of harm may be difficult to capture in real-time, but risk factors associated with gambling harm provide a basis for prompting preventative action before negative outcomes become fully manifest. 5 Blaszczynski AA, Parke A, Parke J, Rigbye J. Operator-Based Approaches to Harm Minimisation in Gambling: Summary, Review and Future Directions. London, England; ,000 was the mean estimate of problem gamblers according to valid DSM-IV screening scores of the population sample. 7 Wardle H, Moody A, Spence S, et al. British Gambling Prevalence Survey London, England; doi: / Wardle H, Moody A, Griffiths M, Orford J, Volberg R. Defining the online gambler and patterns of behaviour integration: evidence from the British Gambling Prevalence Survey Int Gambl Stud. 2011;11(3): doi: / Risk factors include all those individual attributes (e.g. pre-existing vulnerabilities) and behaviours that feature an association with remote gambling harm. Unique characteristics of the online gambling environment also modify the experience of risk. For example, access, anonymity and isolation are just 3
7 remote gambling given its rapid growth. Put simply, risks from gambling include all those individual attributes (e.g. pre-existing vulnerabilities) and behaviours that act as precursors to or share an association with remote gambling harm. 5,10 The importance of an effective method to accurately identify problematic gamblers remotely and determine ways to provide timely and appropriate support is clear. The ability to generate a detailed understanding of a customer online, both in terms of player profile and behaviour, and monitor this over time means the remote gambling industry is potentially well positioned to mitigate or prevent the harms from problem gambling. Historically, the UK has been at the forefront of implementing new regulation directed at the remote gambling market being among the first European countries to regulate its online gambling industry. Re-regulation 11 of the UK gambling market in 2014 means that all operators taking bets from a UK-based customer must now possess a UK licence. Until now, there had yet to be a study commissioned using customer behavioural data from multiple remote gambling operators serving UK customers to analyse and compare against an objective measure of problem gambling, and then develop predictive models of risk and harm, which can be used to test potential mitigating interventions. This is the aim of the research study. This work has been commissioned by Gamble Aware, formerly the Responsible Gambling Trust (RGT), and is being led by PwC who are working alongside the Responsible Gambling Council of Canada (RGC). In addition this work is made possible by the cooperation of some of the UK s leading remote gambling operators with access to a large group of UK-based customers and their anonymous play and account data. The purpose of this document is to introduce the project and provide an interim update at the end of Phase 2. We also give recommendations for a next phase of the programme, Phase Programme objectives and approach Gamble Aware has commissioned a programme of research aiming to explore the potential usefulness of industry-held data and behavioural analytics in the remote gambling sector, primarily to indicate markers and patterns of harmful or risky behaviour and then to recommend practical applications of harm minimisation. Importantly, there is an emphasis on how harmful and risky behaviour can be mitigated, not just if it can be identified and mitigated. Following initial discussions between PwC, Gamble Aware, and the RGC on how to meet this aim, an approach towards a set of specific project objectives was agreed upon. For greater industry insight, representatives of organisations that account for the majority of the UK remote gambling industry were also consulted. The programme is divided into three phases of work. The aim is that each phase contributes something meaningful to the understanding of harm minimisation online, and that they some of the inherent characteristics of remote gambling that set it apart from many non-remote forms of gambling (e.g. land-based casino games). 10 Braverman J, Shaffer HJ. How do gamblers start gambling: Identifying behavioural markers for high-risk internet gambling. Eur J Public Health. 2012;22(2): doi: /eurpub/ckp Up to October 2014, overseas operators did not require a Gambling Commission licence to supply gambling services to GB customers. From 1 November 2014, when the Gambling (Licensing and Advertising) Act came into force, all operators supplying gambling services to GB customers have had to be licensed by the Commission. UK Gambling Commission. 4

8 cumulatively build towards practical applications that can reduce harm in remote gambling in the UK. The overall programme objectives and design are outlined below, including the key outcomes of Phase 1, which was completed and published in 2016 [link]. Further detail on Phase 2 objectives, method and rationale for key methodological approaches are included in a later separate section. Phase 1 synthesised the latest thinking on harm from problematic behaviour in remote gambling through a literature review and consultation with leading remote gambling operators; and then recommended an approach for Phase 2. The intention was that Phase 1 established a baseline of the latest research and understanding of responsible gambling, and a clear view of the current approaches used by major operators and some themes of any best practice observed. Figure 1: Programme objectives and approach summary (Phase 1) Phase 1, which was published in April 2016 [link], undertook a literature review and consultation of seven UK-facing online operators. This provided: A review of behavioural markers that are predictive of risk of harm when gambling remotely, and a framework to assess them A comparison of operator definitions of remote gambling-related risk of harm, the markers used to identify potentially harmful play, and the processes used for monitoring problem gambling behaviour In summary, the literature review established that a significant number of behavioural markers can be used to predict risk of harm, many of which are likely to be tracked by remote gambling operators and potentially available for analysis. It found that a few attempts to develop predictive models, or algorithms, of remote gambling risk among online players have been made, many of which use behavioural markers such as self-exclusion or account closure 5
9 to approximate harm. However, it is rare that samples of remote gamblers have received validated problem gambling screening assessments, such as the Problem Gambling Severity Index (PGSI) to make a determination of harm and risk of harm. 12 It is rarer still to integrate behavioural data with survey data that asks gamblers the games they play, the number of sites they visit, and their online and land-based gambling habits - information not regularly captured by remote gambling operators. It found that a further limitation of current algorithms is their inability to capture gambling behaviour beyond a single site, despite many players holding several remote gambling accounts. The Phase 1 literature review summarised that these gaps represent a distinct opportunity to advance the field of predictive modelling by developing and testing a framework incorporating valid and reliable variables from past works, related survey data as well as risk markers that have yet to be applied to a large industry-held behavioural dataset of remote gamblers. In conjunction with findings from survey analysis of sampled account holders across participating operators, it concluded that such a study would go a long way to confirming or disconfirming the findings that have predominantly been derived from one operator s dataset (i.e. bwin) dating back almost a decade. In terms of minimising harm, the literature review found that certain restrictions imposed upon remote gamblers appear to be able to reduce the amount of losses incurred by risky play. However, with many of these interventions, it remains unclear to what extent these behaviour changes translate to a reduction of harm and to what extent the effects of these interventions will endure. The Phase 1 review of the approaches of seven leading operators summarised that remote gambling operators vary widely in the behavioural markers they monitor for problematic play, their approaches to determine the existence of harmful play, and the interventions used to minimise harm once it is thought to have been detected. This Phase 2 report should be read in conjunction with the Phase 1 report [link] for the full context. Phase 2, which commenced in March 2016 and is now complete, is the focus of this document. Phase 2 s purpose is to test the hypothesis that analytics models can be used to identify markers using operator data. Phase 2 aims to develop and validate markers which are predictive of online problem gambling behaviour using online customer activity and account information, and to illustrate approaches that could be taken to reduce harm in the remote gambling sector. An online survey of UK remote gambling customers is used together with an analysis of industry held data on the respondents account and play behaviour to determine markers of risk of harm. Therefore Phase 2 serves as an analytical exploration of markers of problem gambling in a remote environment. 12 Ferris J, Wynne H. The Canadian Problem Gambling Index: Final Report. Ottawa, Ontario;
 Phase 3 aims to build a predictive model that can be piloted in day-to-day customer operations, thereby allowing the testing of markers")

10 Figure 2: Programme objectives and approach summary (Phase 2) Phase 3 has the overarching objective of developing and testing a set of interventions to target at-risk individuals. Figure 3: Programme objectives and approach summary (Phase 3) Phase 3 aims to build a predictive model that can be piloted in day-to-day customer operations, thereby allowing the testing of markers as well as refining their predictive power in a real world environment, rather than in a research environment. At the end of this phase a proven set of markers will be presented underpinned by a predictive model which can be deployed in operators responsible gambling customer contact teams to help prioritise and define appropriate interventions. For more detail on the recommended approach to a Phase 3 see section 10, Recommendations for Phase 3 We now introduce the key parties involved in this programme of research before going into more detail on Phase Key parties Following a competitive tender process launched by Gamble Aware, in July 2015 PwC, working with the Responsible Gambling Council of Canada, was selected to lead and coordinate this project. PwC and the Responsible Gambling Council of Canada, alongside several gambling operators, were brought together in order to most effectively leverage each organisation s expertise. We see this collaborative approach as a fundamental strength of this research project and something which will most effectively accomplish its intended aims. Gamble Aware is the leading charity in Britain committed to minimising gambling-related harm. As an independent national charity funded by donations from the gambling industry, 7
11 RGT funds education, prevention and treatment services and commissions research to broaden public understanding of gambling-related harm. The aim is to stop people getting into problems with their gambling, and ensure those that do develop problems receive fast and effective treatment and support. Gamble Aware has commissioned this work. PwC is a leading global professional services firm with extensive experience within the gaming and betting sector. PwC has invested heavily in developing leading data analytics capabilities. This combination of expertise means that PwC is coordinating consultation with operators, designing and running all data analytics and is responsible for managing the project. The Responsible Gambling Council (RGC) is a Canadian-based research group dedicated to minimising the occurrence of problem gambling. The RGC acts to increase public knowledge of problem gambling issues, promote the adoption of improved play safeguards and foster dialogues between affected individuals, operators, policy makers, regulators and treatment professionals. The RGC is supporting PwC on issues specific to problem gambling and its harms and completed the literature review in Phase 1. Leading operators serving UK-based customers with remote gambling products are involved to leverage their existing experience and access to data and customers that are crucial for completing this project s aims. In Phase 1 there was significant involvement from Bet365, Betfair and Paddy Power (who have since merged), Gala Coral Group and Ladbrokes (who have also since merged), Sky Betting & Gaming, and Unibet (now called Kindred). Collectively this group accounts for the majority of the UK remote gambling market in terms of market share of GGR and coverage of key remote gambling products. Lottery is the only major market vertical which has been intentionally excluded; it is estimated that less than 23% of the UK market for lottery products is mediated by remote channels. In Phase 2 operator data and access to customers was provided by Bet365, Ladbrokes, Sky Betting & Gaming, and also William Hill who we did not interview in Phase 1. 8
12 3. Phase 2 introduction 3.1 Phase 2 objectives As described in the programme context above, Phase 2 is part of a larger programme working towards defining practical markers of problem gambling to trigger effective interventions across the remote gambling industry. Phase 2 is the identification phase of this programme with the objective of utilising available operator data to identify markers that could be predictive of problem gambling, and therefore where harm is occurring. To achieve this we built Phase 2 analysis around a set of key questions: Can remote problem gamblers be identified by their online transactional behaviour? How soon can operators identify remote problem gamblers in their customer lifecycle? Do markers of remote problem gambling vary for different groups of customers? Could operators identify a remote problem gambler in-the-moment? What markers are practical to implement online, especially given the level of false positives for those predicted as remote problem gamblers? This phase serves to identify markers that are indicative of where problem gambling is occurring in a remote context. The markers identified in Phase 2 will demonstrate where utilising operator held data and behavioural analytics could aid problem gambling detection and effective harm minimising intervention, with a Phase 3 testing the predictiveness and practicality of markers in operational environments. By operational environments, we mean the day-to-day operations of a remote bookmaker where betting patterns are analysed in-themoment, and there are multiple potential points of interaction with customers (e.g. , text, call centre, pop-ups). Given this multi-phase approach we expect markers to be adapted and refined during a Phase 3 to achieve the overarching objective of the programme. We now explain a number of design principles and an overview of the approach. After this, the report provides a more detailed description of the Phase 2 method, results and limitations, before recommending next steps for a Phase 3 which would complete the overall programme. 3.2 Phase 2 design principles In designing the Phase 2 approach we adopted some key design principles, which were developed through the literature review and operator consultation in Phase 1: 1. Problem gambler identification using PGSI Phase 1 noted the wide range of problematic gambling detection techniques used by operators and the challenges they face in doing this. For example, according to gambling operators, customers who self-exclude do so for a variety of reasons, not just due to actual or potential problem gambling. Therefore to create a clean data set that was not impacted by operators existing detection practices we designed an approach using a Problem Gambling Severity Index (PGSI) survey 13. In line with standard practice we used a self-reported score of 8 or more to define problem gambling. As our objective was to define markers of harm in player behaviour that can be detected in operators data, customers with a self-reported score of Ferris, J., & Wynne, H. (2001). The Canadian problem gambling index: Final report. Submitted for the Canadian Centre on Substance Abuse. 9
13 were the main focus of analysis. This is because problem gamblers are the most likely to be experiencing harm. A limitation of the PGSI is that it does not discriminate between channels of play, i.e. online, betting shop, and casino inter alia. The focus of this research is remote play, and there is a risk that when customers are answering the PGSI, they are considering all gambling forms. We asked customers to only consider their online play when answering the survey in order to mitigate this risk but accept the inherent limitation. 2. Multiple operator selection The second design principle was to work with large UK-facing operators, ideally covering the major online verticals of sports betting, gaming, bingo and poker. All operators introduced to us in Phase 1, as well as William Hill, were given the opportunity to participate in this phase of the research. The requirement on them was to provide access to customers to survey, and the transactional data of those that responded. Four operators volunteered to participate, which was more than we had expected. We planned the survey and project logistics to enable all of them to do so with the rationale that such a large sample and wide market coverage would help develop identification markers that the industry would be more likely to adopt, and therefore implement in order to reduce harm. These four operators were Bet365, Ladbrokes (now part of Ladbrokes Coral), Sky Betting & Gaming, and William Hill. As well as covering a large share of UK remote gambling GGR 14, the four operators also ensured a good coverage of the key product verticals: sports betting, casino and bingo. We also explored the potential to use a major poker brand in our sample but this was not possible, so this product vertical was not covered. The four operators represent both the pure-play online operators, Bet365 and Sky Betting & Gaming, as well as established land-based operators who have since added a strong online proposition to their business, Ladbrokes and William Hill. Having this mixed coverage was an additional benefit of expanding the project to include all four, and therefore be more representative of the UK remote gambling market. 3. Customer survey We constructed a survey, comprising the PGSI as well as demographic and other behavioural questions, and targeted ~160,000 UK-based online customers across the four operators to ensure a large training data set. We targeted active customers who made more than one deposit and five bets in the last 12 months. Other than this, the only other selection criteria were that the customer was based in the United Kingdom and that there was a means of contact. Within these parameters operators were asked to randomly select customers. The intentional bias in the profile was selected to ensure that we had a large enough sample of customers with a betting pattern consistent with being a problem gambler, and enough customers responding to the PGSI survey in the high-risk groups to make product (i.e. bingo, betting, gaming) and other segmented analysis viable. Given that population studies estimate the prevalence of problem gambling to be c. <1%, this approach was chosen to balance the expectation on operators of how many customers to with collecting a large enough 14 For games in which the operator accepts risk, gross gambling revenue (GGR) is defined as stakes less winnings; for games in which the operator accepts no risk, gross gambling revenue is the revenue that accrues to the operator (e.g. commission or equivalent charges) 10


14 sample. We believed that we were unlikely to eliminate potential problem gamblers main or active accounts from the survey with these selection criteria. A prize draw to win one of ten ipads was offered as an incentive to customers to complete the survey. Response rates are typically low on large online surveys and the rationale of including a prize draw was to ensure we had a sufficient sample to work with. In order to check for any response bias in the survey, we planned to collect data on some selected fields for each operators total UK customer base, to then compare against the survey respondents. 4. Privacy To respect privacy of customer data and PGSI self-reported scores there was no identification of customer names or addresses at any stage of the research. Customers survey responses were marked with a unique identifier which we then provided to the operators. This was used to extract account and transaction data that was then returned, and which could be linked to survey data by PwC. This link was not available to operators so they are unaware of any customers PGSI score. One limitation of this discussed later is the inability to link play between operators in our analysis. In addition to data protection considerations, one reason for this principle was one of practicality, customers were considered to be more likely to respond to a sensitive survey about gambling problems if they knew it was anonymous. We also ensured that no data were shared between operators and that insights were not reported by-operator, but rather as an industry collective. 5. Data collection aligned to Phase 1 markers Using Phase 1 [link], we identified a taxonomy of markers established in the literature as being helpful in detecting problem gambling. We also considered approaches used by operators. This guided the data we requested and the variables we sought to analyse. Figure 4: Marker taxonomy used for data collection Based on this taxonomy (see Figure 4) we requested transactional betting behaviour, account behaviour and customer services contact behaviour across all four operators on all customers who responded to the PGSI survey. 11
15 In some cases, data fields in this taxonomy we knew were not collected by operators, e.g. employment status. However we sought to collect these sorts of demographic data to see if broader demographic markers could be a useful way of minimising harm at the point of opening an account. We therefore added basic demographic markers to our survey, recognising the limitation that as data is collected today, these would not be directly implementable but could be collected in the future albeit with the challenge that customers may not want to give this information away and it can change over time, e.g. marital status. 6. Utilising operator data common to all As reported in Phase 1, methods of problem gambler identification vary between operators. Likewise, account and play data collected by operators vary too. However, there is significant commonality in the core account and play data collected by operators. Sometimes this is because it is a regulatory requirement and sometimes this is because the same or similar technology systems are used to collect and store data. The objective of identifying practical markers that could be used across the industry meant we used multiple operators not only to get a good sample size, but also to ensure we covered different types of data profiles where they exist. We designed the data transformation in such a way that we would build markers using data common across these major operators, and not use data unique to a sub-set. The rationale for this is to develop markers that are implementable across the industry. Given that the collective market share of the four operators is a significant proportion of the UK market, and that Phase 1 consultation revealed that a core set of data is fairly standard across the industry, we are comfortable that the dataset used in our analysis will identify markers that are practical to implement across the industry. If we had used one operator dataset, we may have had access to more data than other operators collect therefore making the markers impractical to implement. One consequence of this principle is that the data were aggregated to daily summaries rather than intra-session summaries (e.g. between each account log-in and log-out) because not all operators were able to provide intra-day data. However, because the time of play had been identified in Phase 1 as a useful marker of problematic play we did relax this principle to investigate this hypothesis for the data available. The same was true for the incomplete data made available for the use of protection tools. Therefore in this study we have primarily focused on data that all four operators could provide. This principle enhances the probability that we identify markers that can be used by the wider industry but we do accept this may lead to not all available data being used or all possible markers being identified. Further data considerations are detailed in the method section. 7. Considering the customer life-cycle Our surveyed PGSI score is for a single point in time not across the history of a customer s gambling life time so there is no indicator of when a customer became a problem gambler. In general there are challenges with a full life-cycle understanding of gambling behaviour, not least because of the range of channels a player can use (i.e. remote vs. Licensed Betting Office and other), the multiple operators licensed in the UK (not to mention the potential of unlicensed operators), and the long period over which play may have happened. A single reading of a customers PGSI at a point in time is a limitation of the scope and time available to do this study. Having said that, even with multiple PGSI readings, the limitations 12
16 above would have made a full and dynamic understanding of play behaviour and risk challenging. For example, in Phase 1 the operator interviews highlighted that many customers have multiple operator accounts but due to privacy we were unable to link accounts. We concluded that with the time limitation of this study, meaningfully tracking transition from non-problem gambler to problem gambler PGSI score was not going to be feasible. We therefore designed our approach in such a way to get a wider understanding of customer lifecycles where possible and identify markers during three states. These were chosen to reflect the customer lifecycle observed by a single operator and the data that they actually have available to them. These states are: On-entry when a customer opens an account Over time how a customer profile of behaviour builds over time In-the-moment when problematic behaviour occurs during a single day These states enable us to test markers across the taxonomy and the usefulness of static data (e.g. gender), and dynamic data (e.g. losses in previous day) to identify problem gamblers. Furthermore, if we can identify in-the-moment markers of problem gambling these can act as triggers for intervention that will reflect the moment a customer exhibits problem gambling behaviour so interventions can be taken as quickly as possible. 8. Segmentation of players As the scope of our approach covers multiple game types and multiple operators we start with the assumption that markers of play and account behaviour could vary significantly across customers. From our experience of this sector we also know that play behaviour can vary significantly between different types of customers, even within the same product and spend level, e.g. 100 staked a week on football bets. For example, one customer may be placing one bet on a match for a team to win. Another may be placing twenty bets on different matches in different countries, played throughout the week and at different times. A generalised approach across the total data set would also mask unique markers generated by e.g. sports betting versus casino gaming play. To avoid such a one size fits approach we incorporated customer segmentation, so representative analysis can be undertaken for each segment. 9. Testing of the PGSI as a proxy for problem gambling Any self-reporting survey must be interpreted in that context, however, we used the PGSI due to its previous validation as a reliable proxy for problem gambling and the potential to screen a high volume of customers. However, the PGSI is not generally used by operators to test where they suspect a customer is at risk. We learned in Phase 1 that the main method operators use to determine where there is an actual or potential harm occurring is through a number of manual review processes, such as a conversation with a trained call centre expert, complemented by a review of information from public sources, such as investigating a customer s lifestyle and employment status via Facebook and LinkedIn. This can then be used to take preventative action, for example to freeze an account. Automated analytical processes, where used at all, are often just the start of an operator s processes to investigate a customer. Due to the privacy principle and the resources available, we recognised that we were unable to investigate a self-reported problem gambler in the same way that operators typically would, 13
17 and therefore it would not be possible in this study to directly compare the self reported PGSI scores with customers identified as at risk by the operators. To complement previous research validating the PGSI as a useful tool, and to build operator confidence in our findings, we wanted to explore the validity of using the markers of harm identified using a self-reporting PGSI screen on those customers verified as problem gamblers by the operators (so called operator identified problem gamblers). In this context we mean a customer where an operator has completed sufficiently thorough investigations (which often means manual processes completed by an expert) that a player is frozen or the account is closed. The rationale for this is to help the adoption and implementation of these findings in the industry. 10. Practical interventions Behavioural analytics has to be accurate in order to be practical within an operational environment, where each prediction will lead to a range of interventions which generate significant potential costs for the operators. Therefore there is an inherent trade-off between highly precise model predictions and the need to effectively identify the largest population of problem gamblers as possible. Therefore we designed an approach which would create a model assigning a risk score for customers. This risk score rates any players likelihood to be a problem gambler and in an operational environment one can imagine the benefits of having problem gamblers identified in such a way. For example above certain thresholds one might be confident enough to freeze and close an account straight away. Lower risk scores might merit a recommendation to use a protection tool such as time or spend limits. To illustrate these trade-offs we examined different illustrative thresholds of risk, with different model accuracy and sensitivity profiles. To test how predictability can be improved and false positive rates reduced while identifying the largest proportion of problem gamblers, we also combined such an approach to predictive modelling and threshold setting with customer segmentation as noted above. These design principles define the approach we have taken, which is described in the next section. 14


18 4. Phase 2 approach Phase 2 comprised of five stages. In this section we provide an overview of the approach before describing in more detail the method of each of these stages in turn, including the rationale for key methodological choices not covered by one of the design principles described earlier. 1. Operator recruitment Gambling operators from Phase 1 were invited to participate in the Phase 2 study. Operators were required to provide access to customers to be surveyed and for those that responded, their associated historical betting and account behaviour. Four operators participated in this study (Bet365, Ladbrokes, Sky Betting & Gaming, and William Hill). 2. Customer survey Phase 1 identified that online customers who self-exclude do this for a variety of reasons, not just to minimise harm from problem gambling. We therefore chose to use a self-reported measure of remote problem gambling via the Problem Gambling Severity Index (PGSI) to identify groups of problem and non-problem gamblers to analyse. The customer survey was distributed to ~160,000 UK-based customers that were active with the four operators. By surveying the operators customer bases we were able to identify a large sample of self-reported problem gamblers to act as a training dataset. 3. Link to operator data Phase 1 identified a taxonomy of markers that are considered to be helpful to identify problem gamblers. This taxonomy identified four areas where behavioural analytics could be relevant, which was the focus of the data request. These areas are demographic data, transactional play data, account data and customer contact data. The results from the customer survey were then linked to a consistent set of operator data from multiple products (betting, casino and bingo) and from across the four operators. No linking of customers across operators could be undertaken to protect privacy. Furthermore, no identification of individual gamblers was provided to maintain anonymity. This resulted in a marker detection dataset used in Stage Marker detection Predictive models were built to identify markers of remote problem gambling using the acknowledged definition of a PGSI 8+ self-reported score. This stage explored the data profiles of problem gamblers and non-problem gamblers to identify a range of markers that 15
19 discriminate between the two. This provides a method of risk scoring customers according to the multivariate strength of association between observed markers and problem gambling. This approach is focused on detecting markers for the on-entry (i.e. before a bet is placed) and over time (i.e. as a transactional behaviour is observed) customer lifecycle states. As this data set includes three different game types and customers who gamble in different patterns we used a segmentation method to group customers into segments that behave in a similar way. This segmentation approach is used to focus the models on the segments that have high instances of problem gambling and tailor risk thresholds to their different profiles to determine if false positive rates could be improved. To enable intervention in-the-moment a micro-clustering approach is used to identify unique patterns of play for individual days that are only associated with problem gamblers. These markers can act as intervention triggers that can react to play in real time regardless of historical play data. 5. Marker testing A design principle of the present study is to maintain customer anonymity. We were therefore not able to contact self-reported problem gamblers and assess the validity of their selfassessment in the same way that operators typically would. To build confidence in the industry that the markers of harm identified in this study using PGSI are transferrable to those identified through internal operator verification, we planned to test the markers against a set of operator identified problem gamblers identified by the operators responsible gambling teams using manual methods e.g. speaking to trained experts in call centres. The final stage was therefore to test the predictiveness of the markers identified in stage 4 against a new set of operator identified problem gamblers provided as an additional dataset by the operators. This was undertaken by placing a representative group of operator identified problem gamblers within a sample of approximately 1000 customers to test the effectiveness of the markers at identifying them as high risk of problem gambling. This step was intended to test if the small number of problem gamblers identified by the lengthy and manual processes often used by operators could be identified by our markers in a more automated and consistent way. The methods deployed in this study underpin the design principles and rationale described in the Phase 2 approach. The method of Phase 2 stages 1 to 5 are now taken in turn. 16
20 5. Method 5.1 Operator recruitment All operators who participated in Phase 1 were asked to participate in Phase 2, in addition to William Hill. As discussed in the design principles we planned for multiple operators to be recruited and achieved this with four operators that represent a mix of operators with pure online and mixed retail / online customer bases, with customer activity across the three gaming types we had targeted. We excluded poker due to data accessibility issues. The requirement was to provide access to a proportion of their customer base to undertake an online survey, provide data for survey respondents, and provide additional customer data for the marker testing. The four operators that volunteered all required customer privacy controls and accepted the results of the survey would not be shared with them. To maintain privacy unique matching codes were used to identify customers and each operator contacted their customers via directly with a unique link to a survey which was completed on a PwC hosted survey capture system. 5.2 Customer survey Survey objectives and questions Between April and May 2016, a 12-question survey was distributed online to over 160,000 active UK-based customers across the four online gambling operators: Bet365, Ladbrokes, Sky Betting & Gaming, and William Hill. A prize draw of ten ipads was offered as an incentive to respond. Active customers were defined as having made >1 deposit and >5 transactions in the last 12 months, and required to have a valid and active address. The sample was explicitly skewed to avoid very infrequent bettors and increase the proportion of problem gamblers. This was important for the present study to strengthen the signal from markers of remote problem gambling. However, the findings on problem gambling prevalence are not generalisable to the larger population of online gamblers. The survey comprised a set of demographic questions e.g. marital status, number of children, employment status, and occupational group; and behavioural questions e.g. time spent gambling, number of sites used, use of safeguards, types of online and offline gambling activities and concerns about their gambling behaviour (see Appendix 1 for questions from the customer survey). The survey also included 9 questions from the Problem Gambling Severity Index (PGSI; see Appendix 1, Q10) 15. For example, Have you bet more than you could really afford to lose? Questions are scored on a 4-point scale: Never (0), Sometimes (1), Most of the time (2) and Almost always (3). Responses to the questions are summed to calculate an index score from 0 to 27, which is categorised as: non-problem gambler (0), low risk (1-2), moderate risk (3-7) and problem gambler (8+). Throughout this report the term problem gambler will be used to describe customers that scored 8 or more on the PGSI self-reported screen. The PGSI is a general screen used to identify problem gamblers, however for the present study the question 15 Ferris, J., & Wynne, H. (2001). The Canadian problem gambling index: final report. Submitted for the Canadian Centre on Substance Abuse. 17
21 was framed for customers to consider their online gambling only, and the effect that it has on the individual, their finances and their household over the last 12 months. Survey response A total of 10,635 responses were collected, for a 6.5% response rate. Of those respondents, 3947 (37.1%) were classified as non-problem gamblers, 3610 (33.9%) were low risk, 2403 (22.6%) were moderate risk and 675 (6.3%) self-reported as problem gamblers with a score of 8 or more. Whilst the response rate is reasonable compared to typical online surveys, unknown biases have to be accepted as a potential limitation. We examined the representativeness of the survey respondents against four summaries of the overall UK-based online customers provided by the operators: annual bet volumes, games played, gender and age. These were chosen to cover the two key player profile attributes consistently held by operators and two important behavioural dimensions, product usage, which varies widely across the player population, and bet volumes, which is a general proxy for betting activity and also varies widely. As we only surveyed active customers we observed a much greater proportion of customers in our sample that place >100 bets per year (76%), compared to the overall population across the four operators (64%) 16. As a result there is also an over-representation of gaming products, which are characterised by higher betting volumes but for lower value stakes, with 49% of the sample having played casino games at least once in the last year compared to 14% in the operator populations. One explanation is that our customer criteria will have filtered out the large number of customers who may create an account to bet on a high-profile sporting fixture such as the World Cup or Grand National, but never play again. This sort of infrequent customer is less prevalent in casino gaming. There is also a slightly increased proportion of male respondents (88%) than is observed in the operator populations (83%), and an under-representation of customers between 18 to 29 years of age (21% vs. 35% in the operator populations). We can accommodate the above in our approach by our segmentation which deals with product bias, and the fact that we intentionally selected more active gamblers to increase the sample of potential problem gamblers. Observations of survey data In the survey we asked additional questions about play activity to test the design principle that using single operator datasets cannot be used to provide a complete picture of gambling behaviour either over time or at one point in time. We asked two questions to identify if problem gamblers have a significant difference in multioperator online betting and retail betting behaviour: Q3) How many online gambling sites do you currently gamble with? 16 Not all operators provided complete data or raw frequencies of gamblers. These figures are approximations from the representative operator data provided. 18
22 There is a greater proportion of problem gamblers (PGSI 8+) that use multiple online betting accounts 76% compared to 52% for non-problem gamblers (PGSI 0). Q12a) Thinking outside of your online gambling, what forms of gambling activities have you taken part in on the high street, in betting shops, in casinos or other retail premises in the last 12 months? There is a greater proportion of problem gamblers that gamble in retail premises 80% compared to 64% for non-problem gamblers. It should be noted that with such a large proportion of problem gamblers using multiple operators online and using a mix of online and retail we will not have access to their full play activity. This has implications for single operator detection systems, which we will discuss in the results section. 5.3 Link to operator data For each of the 10,635 customers surveyed we linked their survey results to their associated customer data, collected from the same operator over a two year period between May 2014 and April This included customer details (unique ID, age, account start date, and gender), use of protection tools (the tool used), every bet placed (the date and time, game played, stake placed and amount returned), and every account activity (deposit or withdrawal made, the date and time, and the amount) during the period. The data provided by the four operators was combined into a unified dataset, which retained the anonymity of the individual customers. However, there was variation between operators in the way in which the data were recorded and stored, notably: One operator only provided summarised transaction data at a daily level. These included the total number of bets placed, the total amount staked and total returns. No minimum or maximum stakes or returns were available and no time-specific data was available. To create a unified dataset, individual bet data was summarised at the daily level for all operators. Time-banded information was included for illustrative purposes in the predictive modelling. Two operators did not provide information about the use of protection tools such as time or bet limits. The importance of these as markers could therefore not be adequately addressed in the present study. Use of protection tools where available was included for illustrative purposes in the predictive modelling. Operators linked customer services data e.g. frequency or type of contact, were not consistently available. During Phase 1 the operators consistently identified frequency and type of customer contact as a marker of problem gambling. Given the importance of this missing data we undertook a manual review of problem gamblers with one operator to examine problem gamblers customer contact details. The results can be found in Appendix 2 which does confirm that customer contact would be a relevant marker. However, operators in this study do not have access to this data in a format that can be used in behavioural analytics so we have to exclude it from this analysis. The unified data set was then transformed into over 200 features that covered the elements set out in the design principles taxonomy. Each element of the taxonomy had associated 19
23 markers and measures which are set out in Appendix 3. The markers examined play behaviour around frequency, volume, volatility, duration, session time of day and gaps between play. The markers also focused on deposit, win, loss and withdrawal values. This provides a comprehensive demographic, account and play behavioural marker detection data set on a daily basis. Our objective was to utilise data available to operators so given the limitations of the data the marker detection data set represents data available to all operators rather than the best data available from some operators. However, we did include four demographic markers (occupation, marital status, number of children and employment) collected during the survey but not presently held by operators to test if this type of data would add to the predictiveness of demographic data and so may be something they should collect on account creation to help early identification of potential atrisk customers. Likewise, time-banded information and use of protection tools are either not adequately recorded by all operators or were not provided for the present study. These were included in the analyses but their importance as markers could not be adequately addressed. We have presented the results including and excluding these sources of data to examine their importance while maintaining the principle that we develop markers with data available to all operators to improve the chances of wider industry adoption. In the respondent sample 26% of respondents joined an operator within the two year data sample duration and 16% in the last year. In our data collection criteria we didn t exclude new joiners as this is an important part of the customer lifecycle states we plan to analyse. However it does mean we have two years of data for 74% of customers. 5.4 Marker detection Overview An exploration of predictive markers and approaches that could be taken to reduce harm for remote problem gamblers were then assessed along the six steps outlined below. These focus on how potentially harmful gambling behaviour can be mitigated at different stages of the customer life-cycle: on-entry, over time, and in-the-moment. There were three main components to the analyses that underpinned these 6 marker detection steps: Customer segmentation used to group customers according to their patterns of play Predictive modelling used to identify markers that are available on-entry or observed over time that discriminate between problem gamblers and non-problem gamblers Micro-clustering used to identify daily triggers, or rules for intervening in-themoment as harmful behaviour observed 20
24 Customer segmentation As the scope of the present study covers multiple game types and multiple operators one of the design principles was to include a customer segmentation approach. This allows distinct patterns of similar betting behaviours to be detected across customers and a differentiated approach to marker detection adopted between segments that account for these distinct patterns. Data preparation Customer segmentation was conducted by statistical clustering on summarised betting behaviour. The focus was on identifying patterns of betting behaviour for existing customers across a comparable set of metrics and time period. For the purpose of this analysis, existing customers were defined as those having at least 12 months of betting data (n=8,672). This results in the removal of 1,963 new customers that have less than 12 months of betting data (16% compared to 26% of customers using 24 months of betting data). Betting data was summarised over the most recent 12 month period (May April 2016). The approach was refined to six key betting and account behaviours: Bet frequency proportion of betting days over the period Bet volatility variation of daily betting amount Bet volume average number of bets per day Bet value average value of bets placed over the period Deposit frequency deposit days as a proportion of betting days Withdrawal frequency withdrawal days as a proportion of betting days These were pre-processed prior to inclusion in the analyses. Removal of heteroscedasticity Bet frequency is defined as the proportion of betting days over the period (i.e. the number of betting days / total number of days). However, problematically this definition of bet frequency has a strong heteroscedastic relationship with equivalent measures of deposit and withdrawal frequency. In order to mitigate this effect, the deposit and withdrawal frequency variables were calculated as a function of betting days rather than the total number of days. As such, deposit frequency is defined as: the number of deposit days, divided by the number of betting days, and withdrawal frequency is defined as: the number of withdrawal days, divided by the number of betting days (see Appendix 4). Normalisation and standardisation Transformation procedures were then conducted to normalise the variables prior to z-score standardisation. Bet volatility was calculated from the coefficient of variation of daily betting amount i.e. the standard deviation of the total amount staked on betting days divided by the mean of the total amount staked on betting days. As this is a ratio it needs to be log transformed to normalise the distribution. Customers with standard deviations of 0 across the total amount staked on betting days were imputed with values of 1 prior to normalisation. Log transformations were also conducted to normalise the remaining variables, with the exception 21
25 of bet frequency that had a square-root transformation and deposit frequency for which no transformation was conducted. Many customers did not make withdrawals during the period and therefore had a withdrawal frequency of 0. Prior to log transformation a constant of 0.01 was added to avoid undefined log(0) calculations 17. Bet volume was defined as the average number of bets placed on betting days, which has a scale starting from 1. A log transformation was conducted but with a constant of 0.9 removed to account for the scale range. The variables were then standardised after transformations. Clustering method For statistical clustering a two-step procedure was adopted and applied to the 6 standardised betting and account variables. An initial step using the DBSCAN algorithm was conducted to group customers into a smaller set of nodes, which were themselves then clustered using hierarchical clustering. The hierarchical clustering was based on a Euclidean distance matrix and Ward agglomeration method. This approach was conducted on two split-halves of the data to ensure cluster solutions were stable and had high cross-matching between variable scores in both cluster sets Predictive modelling Predictive modelling was conducted to identify markers of remote problem gambling. Markers were assessed in a hierarchical manner in the order: Demographic attributes that could be available at the first interaction with an online operator Summarised account or betting behaviours that are observed over a period of time Summarised behaviours that are distinctive for particular customer segments This enables an approach that identifies markers on-entry through demographics, over time using behavioural summaries, and that can be tailored to account for distinctive patterns of betting behaviour. Data preparation The objective of the predictive modelling was to identify markers that discriminate between customers self-identified as problem gamblers and those not self-identified as problem gamblers. Phase 1 established the premise that harm is a consequence of problematic play, and therefore to reduce harm we have focused on markers of problem gambler behaviour. To create a clearer signal for markers of remote problem gambling the predictive modelling was conducted to discriminate directly between problem gamblers (PGSI: 8+) and non-problem gamblers (PGSI: 0). This reduces the modelling sample from 10,635 to 4622, and increases the proportion of problem gamblers from 6.2% to 14.6%. Markers identified through the predictive modelling can then be applied to any new customer or known customer with low risk (PGSI: 1-2) or moderate risk (PGSI: 3-7). An alternative approach explored was to examine the markers in the context of the ordered banding of PGSI categories i.e. across non-problem gamblers (PGSI: 0), low risk customer (PGSI: 1-2), 17 Constants were approximated to provide closer transformations to normal distributions 22
26 moderate risk customers (PGSI: 3-7) and problem gamblers (PGSI: 8+). Risk scores developed through either mechanism identified low risk and moderate risk to have sequentially higher risk scores to non-problem gamblers, and equivalently lower risk score to problem gamblers. Notably, both results were equivalent using the same sample, and hence according to the principle of parsimony a binary discrimination approach is presented herein (for further details, see Appendix 5 for details). Time-bandings for betting behaviour were available for only three of the four operators, whilst the use of protection tools were only available for two operators. Both time-specific betting and use of protection tools were highlighted as important marker of problem gambling in Phase 1. For the purposes of the present study markers for both sets of measures are also explored with missing values imputed with the mean value across operators. The importance of these variables are therefore likely to be underestimated. An initial level was included in the predictive modelling that included fixed effects for the operators to address differences in the base rates of problem gambling in the samples, and variables that had systematic missing values were included last in the forward selection of markers in the models. Feature selection Nested models were built hierarchically using multiple logistic regression over the three levels of the modelling: demographics, behavioural summaries, and segment-specific behavioural summaries. At each level: Single variable logistic regressions were first conducted across the range of associated variables to assess their significance separately. These models were used to assess the nature of associations between predictors and problem gambling, such as linear assumptions, transformation requirements and the optimal grouping of categorical variables. Significant univariate markers were incrementally build into a parsimonious set of markers using forward selection. Forward and backward stepwise methods were used to guide the selection of features. However, due to the high collinearity between some covariates (e.g. standard deviation of average bet volume vs. coefficient of variation of average bet volume), several steps were revised to maintain suitable tolerances across variables in the fitted model. Variables added were assessed for stability across subsets of the data and satisfied a likelihood ratio statistic of p < Each set of refined features is built as a nested model on the preceding level The fitted models at each level of the modelling are evaluated using the area under the receiver operating characteristic curve (AUC). This represents the probability that a random problem gambler is given a higher risk score by the model than a random non-problem gambler. Risk scoring and classification A risk score is created for each customer that indicates their likelihood of being a self-reported problem gambler given the markers observed. A problem gambling risk score is calculated for each customer using the predicted probability of being a problem gambler from the predictive modelling. A separate risk score is created after adding each subsequent set of markers into 23

27 the modelling: demographic markers, behavioural summary markers, and segment-specific markers. After creating a risk score that probability needs to be classified into a discrete category. A threshold is set such that any risk score equal to or above that value is classified as a predicted problem gambler, but otherwise classified as a predicted non-problem gambler. The effectiveness of the predictive model and subsequent classification method is assessed by comparing the observations vs. the predictions, and using the following performance measures: Accuracy measures the proportion of problem and nonproblem gamblers predicted correctly: ((A+D) / (A+B+C+D)) Hit-rate measures the proportion of actual problem gamblers correctly predicted: (D / (B+D)) Precision measures the proportion of predicted problem gamblers that were correct: (D / (C+D)) As one of the design principles is to enable practical interventions a range of different thresholds can be evaluated that allow an explicit trade-off between hit-rate and precision. For comparability of the models we have selected a fixed threshold during the hierarchical model development. An illustrative threshold of 20% was selected as it is larger than the 14.6% of problem gamblers in the predictive modelling sample. This allows a more direct comparison of performance metrics that are based on the same proportion of customers classified as problem gamblers. As we move through the modelling process we select optimised thresholds based on different trade-offs. Cross validation A k-fold cross validation method was used with 10 folds to assess how the results will generalise beyond the present study. For each of the predictive models the average AUC and performance measures (accuracy, hit-rate and precision) across the out-of-sample folds is comparable to the metrics from the overall sample. The metrics for the overall sample are therefore presented in this report (see Appendix 6 for summaries of the cross validation output) Micro-clustering From our review of operator mechanisms to identify problem gamblers in Phase 1, some of the strongest signals used in their analytical and non-analytical detection were in-the-moment. These were out of the ordinary behaviours displayed as a reaction to betting outcomes that were unique to problem gambling. At the extreme end is a customer phoning up customer service and saying that they are suicidal after a big loss. A micro-clustering approach was adopted to identify harmful behaviour in-the-moment for two main reasons. The first was that behavioural markers develop over time but are not as sensitive to dramatic changes to play behaviour distinct volatility in play is a strong signal 24
28 of problem gambling. The second was to enable a practical approach for operators to intervene quickly when distinct in-the-moment harmful game play is detected. The micro-clustering was applied to a range of daily features in order to determine groups of days that have similar patterns. For example, number of bets placed increases in reaction to a net winning day on the previous betting day. A wide range of daily patterns are assessed and clusters of days are retained for which the majority of customers associated are problem gamblers. These daily patterns are characterised as daily triggers that allow operators to intervene once observed, and thereby minimise harmful behaviour for these customers. Data preparation Micro-clustering was conducted by analysing all the individual betting days in the sample, in combination with their relationship to the preceding betting day. This comprised over 1m betting days. After preliminary analyses, the approach was refined to a key set of 6 variables: Customer segment Bet value Bet volume Outcome of previous betting day (net win or net loss) Bet value on previous betting day Bet volume on previous betting day Distinct patterns were observed between segments and whether the previous betting day was preceded by a net winning day or a net losing day. These differences were hard-wired into subsets of betting day data 18. The micro-clustering approach was then applied to the remaining variables separately within each of these subsets. Clustering method The micro-clustering was conducted using the same two-step clustering procedure outlined in the customer segmentation method section. The individual days were first clustered into a smaller set of nodes using the DBSCAN algorithm, which were then grouped using hierarchical clustering Marker testing In the present study, markers of remote problem gambling were evaluated in the context of a self-reported measure of remote problem gambling via PGSI. However, an additional dataset was requested from the operators that would include a sample of customers validated as problem gamblers by the operators through customer contacts and other manual processes (operator identified problem gamblers). This additional testing exercise enables an evaluation of the predictive markers developed for a proxy measure of problem gambling through PGSI against customers flagged and verified as problem gamblers by the operators through a number of manual review processes, such as a conversation with a trained call centre expert, complemented by a review of information from 18 As the memory requirements for hierarchical clustering are O(n 2 ) this also served to reduce the size of distance matrix in the hierarchical clustering without over-tuning the DBSCAN algorithm 25
29 public sources, such as investigating a customer s lifestyle and employment status via Facebook and LinkedIn. We learned in Phase 1 that these manual processes are the typical requirement (sometimes complemented with more automated and analytical processes) before an operator would be confident enough that a customer should be frozen or excluded. The purpose of this step was to build confidence that markers run in an automated and more consistent process could still identify such customers. Data requested and received Data for approximately 1,000 customers over a 13 month period was requested from the same four operators and in the same formats as previously provided. The data was required to have sufficient behavioural markers in order to recreate the methodology outlined in this study. At least 60 customers (6%) were requested to be flagged as problem gamblers using the operators own existing identification and verification mechanisms. However, an additional dataset with operator verified problem gamblers was only provided by two of the operators and for one of those only a self-exclusion criteria for identifying problem gamblers was provided. As discussed in Phase 1, customers who self-exclude do so for a variety of reasons and therefore is not a direct proxy for problem gambling. We learned in Phase 1 that the number of customers identified as problem gamblers in this way is low. Therefore the marker testing was conducted on one operator using the approach set out in our design principles. The results of this test is set out in the results section. 26
30 Surveyed customers Surveyed customers 6. Descriptive analysis 6.1 Data profile of survey results The results of the survey comprising of demographics, gambling activity and PGSI questions are presented in this section. There were 10,635 respondents across the four operators. Full survey questions, structure and supplementary results can be found in Appendix PGSI score and bands The survey included 9 questions from the Problem Gambling Severity Index (PGSI; see Appendix 1, Q10) 19. For example, Have you bet more than you could really afford to lose? Questions are scored on a 4-point scale: Never (0), Sometimes (1), Most of the time (2) and Almost always (3). Responses to the questions are summed to calculate an index score from 0 to 27, which is categorised as: non-problem gambler (0), low risk (1-2), moderate risk (3-7) and problem gambler (8+). See Figure 5 for the distribution of the PGSI bands used throughout this report and Figure 6 for the raw PGSI scores. Appendix 1.1 contains a table with the raw data from the survey results for Q (37%) 3610 (34%) Figure 5. Distribution of PGSI bands (23%) (6%) 0 Non-problem Low risk Moderate risk Problem gambler PGSI Band Figure 6. Distribution of raw PGSI scores Non-problem Low risk Moderate risk Problem gambler 0 PGSI Score Survey responses 19 Ferris, J., & Wynne, H. (2001). The Canadian problem gambling index: Final report. Submitted for the Canadian Centre on Substance Abuse. 27
31 Surveyed customers (%) Q1) Which of the following do you consider to be the main device that you use to place bets online? (Please select ONE only) Across PGSI bands, mobile devices were most commonly used to place bets online (60%). However, a higher proportion of problem gamblers use their mobile as the main device to place bets (68%) compared to non-problem gamblers (54%). Table 1. Main device used to place bets online by PGSI band Nonproblem Low risk PGSI band Moderate risk Problem gambler Total Mobile Computer Tablet Other % 90% 80% 70% 60% 50% 40% 30% 20% 10% 0% 17% 13% 10% 9% 24% 25% 23% 28% 62% 65% 68% 54% Non-problem Low risk Moderate risk Problem gambler Other Tablet Computer Mobile Figure 7. Main device used to place bets online as a percentage of customers in each PGSI band 28
32 Surveyed customers (%) Q2) How much time do you estimate you spend gambling online? (hours per week) (Please select ONE only) Problem gamblers spent more time gambling online per week. For example, a higher proportion of problem gamblers spend more than 10 hours per week gambling (28%) compared to non-problem gamblers (7%). Table 2. Hours per week spent gambling online by PGSI band Nonproblem Low risk PGSI band Moderate risk Problem gambler Total < 2 hrs per week hrs per week hrs per week > 10 hrs per week Don't know / Prefer not to say % 90% 80% 70% 60% 50% 40% 30% 20% 10% 0% 7% 9% 8% 17% 11% 28% 24% 17% 34% 19% 38% 58% 30% 44% 26% 18% Non-problem Low risk Moderate risk Problem gambler Unknown > 10 hrs per week 6-10 hrs per week 2-5 hrs per week < 2 hrs per week Figure 8. Hours per week spent gambling online as a percentage of customers in each PGSI band 29
33 Surveyed customers (%) Q3) How many online gambling sites do you currently gamble with? (Please select ONE only) Across PGSI bands, over 60% of customers use more than one online gambling site. However, a lower proportion of problem gamblers have only one online gambling account (24%) compared to non-problem gamblers (48%). Table 3. Number of online gambling sites currently used by PGSI band Nonproblem Low risk PGSI band Moderate risk Problem gambler Total > Don't know / Prefer not to say % 90% 80% 70% 60% 50% 40% 30% 20% 10% 0% 10% 11% 15% 13% 5% 6% 11% 16% 9% 10% 24% 26% 18% 20% 27% 27% 48% 37% 27% 24% Non-problem Low risk Moderate risk Problem gambler Unknown > Figure 9. Number of online gambling sites currently used as a percentage of customers in each PGSI band 30
34 Q4) What is your current employment status? (Please select ONE only) A higher proportion of problem gamblers are not employed but currently looking for work (4%) compared to non-problem gamblers (1%), and a lower proportion of problem gamblers are retired (2%) compared to non-problem gamblers (15%). Table 4. Employment status by PGSI band Nonproblem Low risk PGSI band Moderate risk Problem gambler Total Employed full time Self-employed Retired Employed part time Student Not employed, but currently looking for work Staying at home to raise a family Not employed, but not currently looking for work Staying at home to care for a friend / family member Other Don't know / Prefer not to say Employed full time Self-employed Retired Employed part time Student Not employed, currently looking Staying at home to raise a family Not employed, not currently looking Staying at home as a carer Other Unknown Surveyed customers (%) 0% 10% 20% 30% 40% 50% 60% 70% 80% Non-problem Low risk Moderate risk Problem gambler Figure 10. Employment status as a percentage of customers in each PGSI band 31
35 Surveyed customers (%) Q5) What is your marital status? (Please select ONE only) A higher proportion of problem gamblers are single never married (43%) compared to nonproblem gamblers (21%), and a lower proportion are married, in a civil union or partnership (27%) compared to non-problem gamblers (50%). Table 5. Marital status by PGSI band Nonproblem Low risk PGSI band Moderate risk Problem gambler Total Married / civil union / civil partnership Single, never married Living with partner Divorced Separated Widowed / widower Other % 90% 80% 70% 60% 50% 40% 30% 20% 10% 0% 6% 4% 4% 4% 19% 21% 24% 24% 21% 50% 30% 41% 34% 35% 43% 27% Non-problem Low risk Moderate risk Problem gambler Other Widowed Separated Divorced Living with partner Single, never married Married Figure 11. Martial status as a percentage of customers in each PGSI band 32
36 Surveyed customers (%) Q6 a) Do you have children? (Please select ONE only) b) [If Yes at Question 6a] What age groups do they belong to? (Please select ALL that apply) A lower proportion of problem gamblers have children (52%) compared to non-problem gamblers (67%), whilst problem gamblers that do have children have a lower proportion of adult children (25%) compared to non-problem gamblers (55%). Table 6a. Children by PGSI band Nonproblem Low risk PGSI band Moderate risk Problem gambler Total Yes No Don't know / Prefer not to say % 90% 80% 70% 60% 50% 40% 30% 20% 10% 0% 32% 41% 45% 47% 67% 58% 55% 52% Non-problem Low risk Moderate risk Problem gambler Unknown No Yes Figure 12. Children as a percentage of customers in each PGSI band 33
37 Table 6b. Age groups of children by PGSI band Nonproblem Low risk PGSI band Moderate risk Problem gambler Total 0-5 years years years years > 18 years Prefer not to say Surveyed customers (%) 0% 10% 20% 30% 40% 50% 60% 0-5 years 6 10 years years years > 18 years Unknown Non-problem Low risk Moderate risk Problem gambler Figure 13. Age groups of children as a percentage of customers that have children in each PGSI band 34
38 Q7) Please indicate to which occupational group the Chief Income Earner in your household belongs, or which group fits best? A higher proportion of problem gamblers responded semi or unskilled manual work (19%) compared to non-problem gamblers (12%), and a lower proportion of problem gamblers responded retired (1%) compared to non-problem gamblers (8%). Table 7. Occupational group of the household chief income earner by PGSI band Nonproblem Low risk PGSI band Moderate risk Problem gambler Total Skilled manual worker Supervisory or clerical / junior managerial Intermediate managerial Semi or unskilled manual work Higher managerial Retired and living on state pension Unemployed or not working due to longterm sickness Student Full-time carer of other household member Casual worker not in permanent employment Homemaker Don t know / Prefer not to say Skilled manual worker Supervisory or clerical / junior managerial Intermediate managerial Semi or unskilled manual work Higher managerial Retired and living on state pension Unemployed or long-term sickness Student Full-time carer of other household member Casual worker not in permanent employment Homemaker Unknown Surveyed customers (%) 0% 5% 10% 15% 20% 25% 30% Non-problem Low risk Moderate risk Problem gambler Figure 14. Occupational group of the household chief income earner as a percentage of customers in each PGSI band 35
39 Surveyed customers (%) Q8) Have you ever had concerns about your gambling behaviour? (Please select ONE only) A higher proportion of problem gamblers have had concerns about their gambling behaviour (77%) compared to non-problem gamblers (1%). Table 8. Concerns about gambling behaviour by PGSI band Nonproblem Low risk PGSI band Moderate risk Problem gambler Total Yes No Don't know / Prefer not to say % 90% 80% 70% 60% 50% 40% 30% 20% 10% 0% 17% 52% 99% 93% 77% 44% 1% 6% Non-problem Low risk Moderate risk Problem gambler Yes No Unknown Figure 15. Concerns about gambling behaviour as a percentage of customers in each PGSI band 36
40 Surveyed customers (%) Q9 a) Have you ever used any safeguards to restrict your online gambling behaviour? (Please select ONE only) b) [If Yes Question 9a] Please provide further details of the safeguards you have used. (Please select ALL that apply) A higher proportion of problem gamblers have used safeguards to restrict their online gambling behaviour (54%) compared to non-problem gamblers (17%). Across PGSI bands, deposit limits were most commonly used to place bets online (26%; 93% of those that used a safeguard). For those that used safeguards, a lower proportion of problem gamblers used deposit limits (89%) compared to non-problem gamblers (97%). Notably, problem gamblers used a higher proportion of self-exclusions (37%) compared to non-problem gamblers (3%). Table 9a. Use of safeguards to restrict online gambling behaviour by PGSI band Nonproblem Low risk PGSI band Moderate risk Problem gambler Total Yes No Don't know / Prefer not to say % 90% 80% 70% 60% 50% 40% 30% 20% 10% 0% 57% 43% 82% 74% 54% 42% 17% 25% Non-problem Low risk Moderate risk Problem gambler Yes No Unknown Figure 16. Use of safeguards to restrict online gambling behaviour as a percentage of customers in each PGSI band 37
41 Table 9b. Types of safeguards used to restrict online gambling behaviour by PGSI bands PGSI band Nonproblem risk risk gambler Low Moderate Problem Total Deposit limits Self-exclusion from an operator Time-outs Time limits Accessed information from Gamble Aware Contacted Gamblers Anonymous Contacted the National Gambling Helpline Other Customers that use safeguards (%) 0% 10% 20% 30% 40% 50% 60% 70% 80% 90% 100% Deposit limits Self-exclusion from an operator Time-outs Time limits Accessed information from Gamble Aware Contacted Gamblers Anonymous Contacted the National Gambling Helpline Other Non-problem Low risk Moderate risk Problem gambler Figure 17. Types of safeguards used to restrict online gambling behaviour as a percentage of customers that use safeguards in each PGSI band 38
42 Q11 a) Which of the following gambling activities have you taken part in online in the last 12 months? (Please select ALL that apply) 20 Betting on football was the most common online gambling activity (83%), which was comparable across PGSI bands. However notably, a relatively lower proportion of problem gamblers bet on horse racing online (63%) compared to non-problem gamblers (76%), whilst a relatively higher proportion of problem gamblers played casino games online (54%) compared to non-problem gamblers (16%). Appendix 1.1 contains the survey responses to Q11b with a frequency table of these online gambling activities. Table 10. Gambling activities taken part in online in the last 12 months by PGSI band Nonproblem Low risk PGSI band Moderate risk Problem gambler Total Lottery Betting on football Betting on horse racing Betting on other sports or events Casino games Slots and gaming machines Bingo Poker Betting exchanges Spread betting Surveyed customers (%) 0% 10% 20% 30% 40% 50% 60% 70% 80% 90% 100% Lottery Betting on football Betting on horse racing Betting on other sports or events Casino games Slots and gaming machines Bingo Poker Betting exchanges Spread betting Non-problem Low risk Moderate risk Problem gambler Figure 18. Gambling activities taken part in online in the last 12 months as a percentage of customers in each PGSI band 20 Q10 contained 9 questions from the Problem Gambling Severity Index (PGSI). Appendix 1.1 contains a table with the raw data from the survey results for Q10 39
43 Q12a) Thinking outside of your online gambling, what forms of gambling activities have you taken part in on the high street, in betting shops, in casinos or other retail premises in the last 12 months? (Please select ALL that apply) The lottery was the most common form of gambling activity outside of online gambling (37%), which was comparable across PGSI bands. However, problem gamblers were involved in a higher proportion of gambling, across all other forms outside of online gambling. In particular, a higher proportion of problem gamblers played casino games (24%) or on slots and gaming machines (32%) compared to non-problem gamblers (5% and 8% respectively). Appendix 1.1 contains the survey responses to Q12b with a frequency table of these gambling activities. Table 11. Gambling activities taken part in on the high street, in betting shops, in casinos or other retail premises in the last 12 months by PGSI band PGSI band Nonproblem risk risk gambler Low Moderate Problem Total Lottery Betting on football Betting on horse racing Betting on other sports or events Casino games Slots and gaming machines Bingo Poker Surveyed customers (%) 0% 10% 20% 30% 40% 50% 60% 70% 80% 90% 100% Lottery Betting on football Betting on horse racing Betting on other sports or events Casino games Slots and gaming machines Bingo Poker Non-problem Low risk Moderate risk Problem gambler Figure 19. Gambling activities taken part in on the high street, in betting shops, in casinos or other retail premises in the last 12 months as a percentage of customers in each PGSI band 40
44 Summary of survey results These survey results demonstrate clear differences in behaviour between the PGSI bands, which are typically incremental across the bands with the greatest differences apparent between the problem gambler and non-problem gambler PGSI groups. There are notable demographic differences with problem gamblers more likely to be single and not employed, but currently looking for work. They also appear to be less likely to have children and for those that do, less likely to have adult children. With regards to gambling activity, there also appears to be incremental increases in the hours per week across the PGSI bands from non-problem gamblers to problem gamblers. Furthermore, use of safeguards, multisite usage and increased activity online and offline is notably higher in the problem gambler PGSI band. 41
45 6.2 Data profile of operator data Transactional betting and account behaviour data for each of the survey respondents was provided by the four operators. Summary statistics for these behaviours across respondents are presented in this section. Demographics The median age of customers decreases across the PGSI bands from non-problem gamblers (47) to problem gamblers (34), whilst a higher proportion of problem gamblers are male (78.5%) compared to non-problem gamblers (70.0%). Table 12. Age, median (inter-quartile range), and gender by PGSI band Age Nonproblem 47 (35-57) Low risk 39 (30-51) PGSI band Moderate risk 37 (29-48) Problem gambler 34 (28-43) Male 70.0% 73.5% 78.4% 78.5% Gender Female 11.2% 9.7% 9.8% 10.1% Not available 18.7% 16.8% 11.9% 11.4% Transactional and account behaviour The median proportion of betting days across the year is only marginally higher for problem gamblers (95) compared to non-problem gamblers (78). However, account behaviour notably increases across the PGSI bands with problem gamblers having proportionally higher median number of deposit days across the year (64) and withdrawal days across the year (8) compared to non-problem gamblers (respectively, 19 and 2). Furthermore, the typical number of bets placed on a betting day (bet volume), the typical size of bets placed (bet value), the total amount staked on a betting day (amount staked) and the volatility of that behaviour (coefficient of variance of the amount staked) all notably increase across the PGSI bands. Problem gamblers compared to non-problem gamblers have: higher median bet volumes (respectively, 14.0 and 3.3) higher median bet values (respectively, 5.01 and 3.25) higher median amounts staked on a betting day (respectively, 98 and 14) higher median bet volatility (respectively, 132% and 87%) 42
46 Table 13. Transactional and account behaviours by PGSI band: median (inter-quartile range) Betting days per year Deposit days per year Withdrawal days per year Daily bet volume (betting days only) Bet value (typical stake placed) Daily amount staked (betting days only) Coefficient of variance for amount staked Nonproblem 78 (35-158) 19 (7-47) 2 (0-7) 3.3 ( ) 3.25 ( ) 14 ( 7-31) 87% (69-116%) Low risk 92 (42-167) 31 (11-73) 4 (1-12) 4.1 ( ) 4.10 ( ) 22 ( 10-51) 99% (77-132%) PGSI band Moderate risk 108 (49-191) 51 (19-107) 7 (2-19) 6.0 ( ) 5.36 ( ) 43 ( ) 111% (85-149%) Problem gambler 95 (43-169) 64 (27-117) 8 (2-20) 14.0 ( ) 5.01 ( ) 98 ( ) 132% ( %) Games verticals played Across PGSI bands, the majority of customers placed bets on sports betting only (48.9%) and both sports and gaming (36.6%) over the period. However, a higher proportion of problem gamblers placed bets on both sports and gaming (49.6%) compared to non-problem gamblers (29.3%), whilst a lower proportion of problem gamblers placed bets on sports betting only (25.8%) compared to non-problem gamblers (58.8%). Table 14. Games verticals played by PGSI band Nonproblem Low risk PGSI band Moderate risk Problem gambler Sports betting only 58.8% 49.3% 38.5% 25.8% Gaming only 1.4% 1.3% 2.6% 4.4% Bingo only 0.6% 0.4% 0.5% 0.7% Sports and gaming 29.3% 37.2% 44.0% 49.6% Sports and bingo 1.3% 1.2% 0.8% 1.0% Gaming and bingo 0.9% 1.6% 2.4% 2.8% Sports, gaming and bingo 7.6% 8.9% 11.3% 15.6% 43
47 Average number of bets Proportion of bets placed (%) Day of the week and time of day Across PGSI bands, the majority of customers placed bets on Saturday (28.4%). However, a higher proportion of non-problem gamblers placed bets on a Saturday (32.1%) compared to problem gamblers (21.2%). Problem gamblers also appear to place proportionally higher bets late at night (see Figure 21). 35% 30% 25% 20% 15% 10% 5% 0% Non-problem Low Moderate Problem gambler Figure 20. Betting by day of the week across PGSI bands Non-problem Low Moderate Problem gambler 0 Time of day (hour) Figure 21. Betting by time of the day across PGSI bands Summary of operator data Comparable to the survey results, the transaction data shows notable differences across PGSI bands, and in particular between problem and non-problem gamblers. Problem gamblers are typically younger and a higher proportion are male. Problem gamblers are also associated with increased activity in general with more frequent betting, depositing and withdrawals. They also typically have higher bet volume, values and volatility, and are more likely to bet on multiple gaming verticals, bet during the week and late at night. 44
48 7. Results An exploration of predictive markers and approaches that could be taken to reduce harm for remote problem gamblers were then assessed along the six steps outlined below. These focus on how potentially harmful gambling behaviour can be mitigated at different stages of the customer life-cycle: on-entry, over time, and in-the-moment. 7.1 Analysis of demographic markers The first set of problem gambling markers to be assessed were from the demographic attributes. These comprised three attributes contained in the operator data: time as a customer, customer age, and gender, and four attributes from the customer survey: marital status, number of dependents, employment status, and occupation. Predictions from a derived set of demographic markers allows operators to take action on-entry, when they create a new account, before a gambler places a bet. Demographics model of problem gambling Using the demographics attributes a predictive model of problem gamblers was built. An AUC of was achieved with just the operator data and an AUC of with the full set of enriched demographics 21. A total of 6 demographic attributes were shown to be important, which resulted in 8 markers, 4 from existing data and 4 from supplementary survey data (see Table 15). At this phase of the overall programme the intention is not to create an operational model but to examine the application of predictive markers, integrated from various sources. Hence Table 15 illustrates the markers that were important and their direction of impact but not a prescriptive application, which would be the focus of a next phase to the programme. These markers with their associated coefficients from the analyses in this study are detailed in Appendix See also Appendix 6 for a summary of the cross validation methodology 45

49 Table 15. Demographic markers identified Operator data Customer survey Attribute Marker PG* Time as a customer Account open > 1 year Account open < 2 months 22 Customer age Age in years Gender Male Marital status Single Any other Children Number of children, age of children Employment status Not employed, but currently looking for work Retired Any other Occupation Intermediate or higher managerial occupation * Relationship to problem gambling: Any other Marker has no statistical relationship to problem gambling Marker has a positive statistical relationship to problem gambling Marker has a negative statistical relationship to problem gambling Assessment of problem gambler predictions The demographics model was then used to calculate a risk score for all customers (from 0 to 1). A classification threshold was determined such that the top 20% of riskiest customers i.e. those above the 80 th percentile of customers ranked by risk score, were classified as predicted problem gamblers with the rest classified as predicted non-problem gamblers (see Figure 22). At this stage the threshold is chosen for illustrative purposes and for comparability between models. It is subsequently refined in section 7.5, Optimising classification of problem gamblers. Figure 22. The proportion of problem gamblers and non-problem gamblers plotted across an illustrative range of risk score bands. This yields the following performance metrics: Accuracy: 78.7% Hit-rate: 45.3% Precision: 33.2% 22 This is possibly an artefact of the sampling adopted. Customers with an account less than 2 months old and that have made 5+ bets in that period are more active than those with an equivalent number of bets over the period of a year. 46
 and the highest risk score customer (a problem gambler) from the demographics model Interim conclusions The")


50 Figure 23. An example daily betting profile for the lowest risk score customer (a nonproblem gambler) and the highest risk score customer (a problem gambler) from the demographics model Interim conclusions The findings here demonstrate that a discriminating predictive model can already be made with the demographic attributes alone, and that there is predictive power from data already available to operators when a customer creates a new account. As 4 of the 8 markers originated from data not presently collected by operators it does suggest collection of a wider set of customer profile data on account creation may help identify potential problem gamblers onentry, though we recognise the operational limitation that customers may not want to disclose data such as employment status, and indeed this changes over time. Nevertheless, we believe lessons can be learned from the credit card industry for example, where demographics are more widely used to manage customer risk. However, most customers exhibited fairly low risk scores at this stage. It is only when many problem gambling markers align that problem gamblers can be more accurately classified. Nevertheless, small groups of customers do emerge with notably higher average risk scores. In particular, young unmarried men opening a new account, that are not employed but currently looking for work, as an example of where markers align. 47
51 7.2 Analysis of behavioural summary markers The second set of problem gambling markers to be assessed were from summarised account or betting behaviours observed over a period of time ( behavioural summaries ). These were developed in accordance with findings from Phase 1 and are structured as overall behavioural attributes, such as bet volume. These are then measured using a range of descriptive statistics, which include measures of central tendency (e.g. the mean), measures of variation (e.g. standard deviation or coefficient of variance), and other measures such as skewness. Over 200 potential measures were created in total. Predictions that incorporate significant behavioural summary markers allow operators to take more informed actions based on evidence that builds over time. Behavioural summary model of problem gambling The demographics model was extended to include a refined set of 10 behavioural markers 23 summarised over a 12-month window, extending the total number of markers from 8 to 18. This improved the AUC from to However, an AUC of was achieved with just the data held by all operators i.e. excluding time of day and use of protection tools. The significant markers are presented below: Table 16. Behavioural summary markers identified Attribute Measure PG* Bet volume Average number of bets per day Bet value Average value of bets placed over the period Gaps in betting days High variation of gaps between betting days Day of the week Proportion of bets made on a Saturday Time of day Proportion of sports bets made between 0-4 am Deposit frequency Proportion of deposit days by betting days** Daily net position High variation of amount won (on winning days) High variation of amount lost (on losing days) Negatively skewed daily outcomes (extreme losses) Protection tools Occurrence of a failed deposit * Relationship to problem gambling: Marker has no statistical relationship to problem gambling Marker has a positive statistical relationship to problem gambling Marker has a negative statistical relationship to problem gambling ** The conditional by betting days rather than over the period was used to remove a latent amount played correlation across bet, deposit and withdrawal frequencies The markers and their coefficients are detailed in Appendix Over 100 behavioural summary measures had significant univariate relationships with problem gambling. The remaining 10 key markers are a refined set of significant markers after accounting for other variables in the model. 24 See also Appendix 6 for a summary of the cross validation methodology 48

. Figure 24. Comparison of the distribution of customers by risk score for the demographics model and behavioural summaries model.")

52 Assessment of problem gambler predictions The behavioural summaries model, which includes both demographic and behavioural summary markers, was used to create a refined problem gambling risk score. As before, the top 20% of riskiest customers were classified as predicted problem gamblers, with the rest classified as predicted non-problem gamblers (see Figure 24). Figure 24. Comparison of the distribution of customers by risk score for the demographics model and behavioural summaries model. This yields the following performance metrics: Demographics model: Behavioural summaries model: Accuracy: 78.7% Accuracy: 86.8% Hit-rate: 45.3% Hit-rate: 73.3% Precision: 33.2% Precision: 53.5% Figure 25. example daily betting profile for the lowest risk score customer (a non-problem gambler) and the highest risk score customer (a problem gambler) from the behavioural summaries model 49
.")

53 Comparison over time The behavioural summaries used in the predictive model were created by summarised account or betting behaviour over a 12-month window, although we are not recommending at this stage the optimal window to use. A further comparison was made by varying this window from one week to 24 months, to explore the impact on the performance of the model (see Figure 26). The analysis shows a plateau at six months with only a small gain from using data beyond 6 months. Figure 26. A comparison of AUC scores from the demographics model and behavioural summaries models with varied summary windows from one week to two years. Interim conclusions Adding summaries of recent account and betting behaviour increases the number of predictive markers in the model from 8 to 18, which significantly improves performance of the model to identify problem gamblers. However, two of these markers are dependent on data that were not available from all operators: time of day bets are placed and use of protection tools. Nevertheless, their removal did not materially impact the performance of the model. Examination of the window over which those behaviours are summarised reveals that performance is greatly improved with as little as one week of historical observations, and begins to plateau between 3 and 6 months with only marginal benefit of using data from 12 months and above 25. This demonstrates that a customer s risk can be more accurately assessed as evidence builds over time, and that high predictability can be achieved with a relatively short period of customer engagement. Note, however, that our data covers a two year snapshot of players behaviour rather than the behaviour since the account opened. Therefore, the results for e.g. one week cannot be generalised to the first week since account opening. 25 See Appendix 9 for a comparison of the 12-month models to 3-month models 50

54 7.3 Segmenting customers by gambling profiles The analyses conducted so far consider only a one-size-fits-all approach to identifying problem gamblers. However, there is significant variation in the ways in which people gamble. Segmenting customers into peer groups according to their gambling profiles allows operators to better understand the distinct patterns of play of online gambling. This allows a refined strategy to be developed by customer segment, as discussed in the subsequent sections. Customer segmentation through clustering Customer segmentation was conducted by statistical clustering, using the six betting and account behaviours: Bet frequency proportion of betting days over the period Bet volatility variation of daily betting amount Bet volume average number of bets per day Bet value average value of bets placed over the period Deposit frequency proportion of deposit days by betting days Withdrawal frequency proportion of days withdrawing money by betting days A two-stepped clustering algorithm was then applied, which resulted in nine distinct segments of online gamblers. A summary of all nine customer segments is presented in Appendix 10. A sharp distinction was observed between the top 4 segments ranked by prevalence of problem gamblers and segments 5-9 (see Figure 27). The top 4 segments contain 78% of sampled problem gamblers but only comprise 40% of the total sample. These customers also typically bet 87 in a day vs. 15 for those in segments 5-9. Figure 27. Comparison of problem gambler prevalence and typical daily betting amounts between segments 1-4 and segments 5-9. Classification of problem gamblers To illustrate how precision of the behavioural summaries model could be improved in each segment, we have focused on segments 1-4 where the majority of problem gamblers in the sample reside. As before, the top 20% of customers by risk score for this subset of data were then classified as problem gamblers (see Figure 28). 51
55 Transaction value Transaction value Transaction value Transaction value Figure 28. The proportion of problem gamblers and non-problem gamblers in segments 1-4 only plotted across an illustrative range of risk score bands. This yields the following performance metrics 26 : Accuracy: 73.1% Hit-rate: 40.7% Precision: 74.8% Segment 1 high intensity mixed gamer Erratic high value betting periods across game types Segment 2 high volume gaming bettor Regular high volume betting throughout the time period, mostly gaming May-2015 Aug-2015 Nov-2015 Feb-2016 May-2016 Deposit value Date Bet value May-2015 Aug-2015 Nov-2015 Feb-2016 May-2016 Date Deposit value Bet value Segment 3 high value sports bettor Less frequent but higher value betting, mostly on sports Segment 4 high frequency sports bettor Near daily betting but for lower amounts, mostly on sports May-2015 Aug-2015 Nov-2015 Feb-2016 May-2016 Deposit value Date Bet value May-2015 Aug-2015 Nov-2015 Feb-2016 May-2016 Date Deposit value Bet value Figure 29. A typical daily betting profile is presented for each of the top 4 segments. For a summary of each segment see Appendix These are not directly comparable with the preceding models because the base-rate of problem gamblers has increased from 14.6% to 33.5% (see section 6.5 on Optimising classification of problem gamblers ) 52

56 Impact of multi-site usage The behavioural summaries model developed inherently requires historical account and betting behaviour to be observed in order to create an accurate risk score for customers. One short-coming of this study s methodology is that the data could only be collected from one site per customer, notwithstanding the potential that we surveyed the same customer more than once via multiple operators but did not know this. Any behaviour at other sites will therefore be missed, leading to potentially underestimated risk scores of problem gambling for some customers. The customer survey contained a question about the number of online gambling sites used, and a notably a higher proportion of multisite usage (2+ online sites used) was observed for problem gamblers vs. non-problem gamblers, particularly for segments with lower levels of gambling behaviour, see Figure 30. Figure 30. Comparison of multi-site use for problem gamblers and nonproblem gamblers in segments 5-9. To examine this, an ordered logistic regression was conducted on the number of online sites used with two binary predictors: whether the customer is in segments 1-4 or segments 5-9, and whether the customer was a problem gambler or a non-problem gambler. Overall the model was significant (χ 3 2 =152.3, p<0.001). Segments 1-4 and problem gamblers were shown to use significantly more online gambling sites than segments 5-9 (t=5.422, p<0.001) and non-problem gamblers (t=5.389, p<0.001) respectively. However, there was also a significant interaction between the segment category and whether or not they were a problem gambler (t=2.404, p=0.016). Problem gamblers specific to segments 5-9 were shown to use disproportionately more online gambling sites. This therefore suggests that a disproportionate amount of betting behaviour from selfreported problem gamblers in segments 5-9 is unobserved at one site. To mediate the effects of the potential confounding effects of multisite usage, further analyses was restricted to segments 1-4 (see interim conclusions). 53
57 Interim conclusions The scope of this study covers multiple game types and multiple operators, and therefore patterns of play and account behaviour vary considerably across customers. Segmenting customers identified 9 distinct patterns, of which 4 were more commonly associated with problem gamblers. However, evidence also suggests that some self-reported problem gamblers in the study may not be using the operator providing their data as their primary betting site, meaning that their normal betting behaviour is not represented. This appears to impact segments 5-9 more than segments 1-4. This has two implications: a) Segmentation allows us to mediate the potential confounding effects of multisite usage by restricting analysis to segments 1-4. This improves the ability to correctly identify problem gambling by limiting the analysis to where we are more confident the associated betting behaviour has been observed. b) Single operator detection models have an inherent disadvantage at detecting problem gamblers that use multiple sites. To address this a multi-operator detection capability could be considered, which we recommend exploring the feasibility of in a Phase 3 of the programme. 54
58 7.4 Customising markers for each customer segment Having identified four distinct high risk customer segments, the predictive model of problem gamblers were refined separately for each of these customer segments. These improvements would allow operators to take differentiated approaches that account for distinct patterns of play. To improve the predictions by segment, iterative model fits were conducted. Across the segment-specific models, four additional markers were identified that significantly improved model fit from the base behavioural summaries model. Table 17. Segment-specific behavioural summary markers Attribute Measure PG* Bet volume High variation of gaming bet volume Seg. 3 ** Bet value High variation of bet value Seg. 1 Seg. 2 Seg. 4 Daily bet amount Average total value of gaming bets on betting days Seg. 2 Seg. 4 ** Withdrawal frequency Proportion of days withdrawing money by betting days*** Seg. 1 * Relationship to problem gambling, with impacted segment model labelled: Marker has no statistical relationship to problem gambling Marker has a positive statistical relationship to problem gambling Marker has a negative statistical relationship to problem gambling ** Segments 3 and 4 are typically but not exclusively sports betting, see Appendix 10 *** The conditional by betting days rather than over the period was used to remove a latent amount played correlation across bet, deposit and withdrawal frequencies In addition to new markers, several existing markers also needed updating: Segment 1 high intensity mixed gamer Age has a reduced impact on problem gambling Segment 2 high volume gaming bettor Gender has no impact on problem gambling Segment 3 high value sports bettor Bet value has an increased impact on problem gambling Positively skewed daily outcomes has no impact on problem gambling Failed deposits has an increased impact on problem gambling Segment 4 high frequency sports bettor Proportion of bets made on a Saturday has an increased impact on problem gambling 55
59 Classification of problem gamblers Using the revised models for the top four segments, the top 20% of customers by risk score were then classified as problem gamblers, with the rest classified as non-problem gamblers (see Figure 31). Figure 31. Comparison of the distribution of customers by risk score for the original and revised behavioural summaries models (segments 1-4 only). This yields the following performance metrics: Behavioural summaries model (segments 1-4) Revised behavioural summaries model (segments 1-4) Accuracy: 73.1% Accuracy: 74.0% Hit-rate: 40.7% Hit-rate: 41.8% Precision: 74.8% Precision: 77.0% Interim conclusions Tailoring the behavioural summaries models separately for each of the four high risk segments increases the number of predictive markers used from 18 to 22, which marginally improves performance of the models to identify problem gamblers. This suggests that whilst there is some variability in the importance of markers for problem gambling across segments, there is a high degree of similarity in their strength of association with problem gambling. However, separating the models also allows a more tailored approach to classifying predictions, as discussed in the next section. 56
60 Performance metric 7.5 Optimising classification of problem gamblers To this point in our analysis, the predictive models have classified customers as problem gamblers with an illustrative and fixed threshold i.e. the top 20% of customers by risk score. This enables easier comparability between models but is not optimised to the associated costs of false predictions, which requires an explicit ethical and commercial judgement about the trade-off between falsely predicting self-reported non-problem gamblers as problem gamblers (false positives) and failing to predict true problem gamblers as problem gamblers (false negatives). We present different thresholds that allow the industry to explicitly consider the cost trade-offs of any classification strategy. We expect this judgement and associated interventions to be a key part of supporting the development of an industry harm minimisation framework. Performance metrics across risk score percentiles The full range of accuracy, hit-rate and precision performance metrics can be measured for any threshold set across the risk score percentiles, as shown in Figure % 80% 60% 40% 20% 0% 0% 10% 20% 30% 40% 50% 60% 70% 80% 90% 100% Customers ranked by risk score percentile (low to high) Accuracy Hit-rate Precision Figure 32. The performance metrics accuracy, hit-rate and precision presented across the percentiles of risk score This illustrates the range of thresholds that could be chosen for the purposes of classifying an observed customer as a problem gambler. However, that decision is dependent on the associated cost trade-offs between false positives and false negatives. A preference for minimising false positives is achieved through increased precision i.e. avoiding falsely predicting self-reported non-problem gamblers as problem gamblers, whilst a preference for minimising false negatives is achieved through an increased hit-rate i.e. capturing a higher proportion of true problem gamblers as problem gamblers. We include three thresholds below as illustrations, not recommendations at this stage. 57
61 Number of customers Number of customers Low threshold: above-chance classification A low threshold for identifying problem gamblers, resulting in a higher proportion of customers classified as problem gamblers, is set whereby any lowering of that threshold would incrementally classify problem gamblers correctly at a rate lower than the base rate of the sample. Using this criterion, false negatives are judged to be proportionally more important than false positives. See Figure 33 for a visual illustration. Low threshold % 10% 20% 30% 40% 50% 60% 70% 80% 90% 100% Customers ranked by risk score percentile (low to high) Figure 33. The threshold is set at the 53 rd percentile i.e. the top 48% of customers by risk score are classified as problem gamblers. Accuracy: 75.0% Hit-rate: 81.3% Precision: 62.3% Problem gambler Non-problem Base-rate Mid threshold: maximised classification accuracy A mid-level threshold for identifying problem gamblers, resulting in a balanced proportion of customers classified as problem gamblers, is set at the point that maximises the classification accuracy. Using this criterion, both false negatives and false positives are judged to be equally important. See Figure 34 for a visual illustration Mid threshold Figure 34. The threshold is set at the 69 th percentile i.e. the top 32% of customers by risk score are classified as problem gamblers % 10% 20% 30% 40% 50% 60% 70% 80% 90% 100% Customers ranked by risk score percentile (low to high) Accuracy: 76.8% Hit-rate: 61.9% Precision: 71.2% Problem gambler Non-problem Base-rate High threshold: minimal rate of false positives A high threshold for identifying problem gamblers, resulting in a lower proportion of customers classified as problem gamblers, is set at a level that minimises a cost function whereby false positives are explicitly three times more important to avoid than false negatives. See Figure 35 for a visual illustration. 58
62 Number of customers High threshold % 10% 20% 30% 40% 50% 60% 70% 80% 90% 100% Customers ranked by risk score percentile (low to high) Figure 35. The threshold is set at the 94 th percentile i.e. the top 7% of customers by risk score are classified as problem gamblers. Accuracy: 68.1% Hit-rate: 16.3% Precision: 85.2% Problem gambler Non-problem Base-rate Setting multiple thresholds by segment The approach above is used to identify three contrasting thresholds across all customers in segments 1-4. However, the approach can also be used to assign distinct thresholds for each segment. Aggregated together classifying customers using segment-specific thresholds further improve the classification performance metrics. Table 18. Performance metric comparison across low, mid and high threshold case studies, set either uniformly over segments 1-4 or tailored to each segment Low threshold Mid threshold High threshold Uniform thresholds Accuracy: 75.0% 76.8% 68.1% Hit-rate: 81.3% 61.9% 16.3% Precision: 62.3% 71.2% 85.2% Segmented thresholds Accuracy: 75.2% 77.8% 71.1% Hit-rate: 81.3% 66.7% 25.8% Precision: 62.5% 71.0% 85.8% Interim conclusions Varying the classification threshold for identifying problem gamblers allows an explicit tradeoff between false positives and false negatives. This would facilitate a graded intervention strategy that could allow operators to take alternative actions, dependent on their levels of confidence in the customer risk. Developing an industry intervention strategy will be explored in the next phase of work. 59
63 7.6 Identifying daily triggers The highest risk problem gambler presented in Figure 25 and the illustrations of problem gamblers from across segments in Figure 29 are all characterised by and present examples of volatile, erratic behaviour with many unexpected spikes across their betting profiles. Such spikes in betting behaviour that are specifically characteristic of problem gambler may go undetected by risk models that are slow to react (e.g. if updated daily overnight) and that dilute extreme behaviour with preceding betting behaviour observed. To reduce the risk of harm, problem gambling behaviours should be detected, and interventions enacted as quickly as is appropriate. To supplement the existing models, a micro-clustering approach is taken to identify particular patterns of behaviour that are unique to problem gamblers at a daily level. The development of such daily triggers will allow operators to take action in-the-moment. We have tested this approach using segments 1-4 where the majority of problem gambling play occurs in the sample. Daily segmentation through micro-clustering Micro-clustering was conducted to identify patterns and groupings across a sample of approximately 434,000 individual betting days across the dataset. After preliminary analyses, an approach was refined using a key set of 6 daily attributes: By customer segment Bet value Bet volume Outcome of previous betting day (net win or net loss) Bet value on previous betting day Bet volume on previous betting day Micro-clustering was used to identify patterns of daily play in those subsets of data that are distinctive to problem gamblers. For example, whether and to what extent the number of bets placed increase from one day to another in reaction to a net winning day on the previous betting day. A summary of the daily triggers identified is presented in Table 19. Examples of the type of daily triggers identified are shown in Figure 36. A full list of the individual daily triggers identified is presented in Appendix
64 Bet volume Bet volume Table 19. Summary of daily triggers identified Segment Reaction Number of daily triggers 1 After win 5 After loss 4 2 After win 6 After loss 8 3 After win - After loss 4 4 After win 9 After loss 3 Betting days flagged by daily triggers Problem gamblers flagged by daily triggers 162 (1.1%) 47 (36.4%) 244 (1.8%) 35 (25.2%) 50 (1.1%) 11 (12.0%) 192 (1.3%) 7 (10.9%) Reaction to win Reaction to loss Example betting day flagged by daily trigger 0 23-May 30-May 06-Jun 13-Jun Betting day Example betting day flagged by daily trigger 0 26-Nov Dec Dec Dec-15 Betting day Figure 36. Daily triggers for customers in segment 2 (high volume gaming bettors) Interim conclusions The daily triggers approach reveals interesting inter-day patterns of play that are unique to high risk and problem gamblers, and which vary between customer segments. A total of 39 individual daily triggers were identified, which when observed, can be used to prevent potential harmful gambling behaviour in-the-moment as it is occurring. However, it is considered that the observed daily triggers are specific instances of harmful behaviour that are indicative of a deeper structure, and which should be converted into broader preventative rules that can be deployed to flag high risk play behaviour for appropriate intervention. For example, for segment 2 (high volume gaming bettor): If they have a bet volume > 800 and increase bet volume by 50% or more on the next betting day This was not explicitly covered in the present study and merits further exploration with the online operators. 61
65 May Jun Jul Aug Sep Oct Nov Dec Jan Feb Mar Apr May Risk score May Jun Jul Aug Sep Oct Nov Dec Jan Feb Mar Apr May Total daily stake ( ) 7.7 Illustration of detection mechanisms applied over time The refined risk score can be calculated on a continuous basis with rolling windows applied over any period of time. An illustration is presented in Figure 37 that shows the total amount staked per day over a year for an example problem gambler from segment 1 (high intensity mixed gamer) and the associated risk score calculated using the preceding markers over a rolling 3-month period. Notably, using a 3-month window requires a minimum of 3 months of observed behaviour before creating a risk prediction and to allocate a customer to a segment (see Figure 26 and Appendix 9 for a comparison of window length performances). Individual days that were flagged using the daily triggers are also highlighted. These indicate occasions where in-the-moment interventions could be made, thereby overriding the current risk score which would otherwise only be updated prior to the next betting day and after the harmful betting day has transpired. 5k 4k 3k 2k Daily triggers Figure 37. The total daily stake for an example problem gambler from segment 1 (high intensity mixed gamer), the associated risk score and individual days flagged using the daily triggers 1k k Low risk Moderate risk High risk 62
66 Percentage of customers across segments 8. Marker testing We requested additional data for approximately 1,000 customers over a 13-month period from the same four operators and in the same formats as previously provided. The data was required to include the same demographic and behavioural markers in order to recreate the methodology outlined in this study. At least 60 customers (6%) were requested to be flagged as problem gamblers using the operators own existing identification and verification mechanisms. However, an additional dataset with operator identified problem gamblers was only provided by one operator and for another only a self-exclusion criterion for identifying problem gamblers was provided. The findings for the one operator who provided the required dataset are below. Operator 1 provided data for 984 customers: 86 flagged customers (9%), and 898 active customers (91%). The flagged sample was a mix of 50 self-excluded customers and 36 operator excluded customers where the operator had conducted sufficient processes to be confident that the customer was gambling in a harmful manner. All customers were then assigned to different segments and risk bands and segments using the statistical clustering and predictive modelling from this study. For the statistical clustering, 92% of the flagged customers and 38% of the active customers were classified as being in segments 1 to 4. See Figure 38 for those customers classified in segments 1 to 4 and Table 20 that presents the performance metrics for the mechanisms applied to this new data. The hit rate for each threshold exceeds the optimised segment models but precision is significantly reduced. Segments % 40% 30% 20% 10% 0% 39% 30% 31% 24% 21% 18% 20% 11% 11% 9% 5% 3% No risk Low risk Mod. risk High risk Predicted risk classification Active customers Self-excluded Operator excluded Figure 38. Active customers and customers flagged as problem gamblers using operator 1 s existing identification methods compared with the predicted risk classification using the predictive model and illustrative thresholds 63
67 Table 20. Performance metrics for the active and flagged customers provided by operator 1 27 Low threshold Mid threshold High threshold Operator excluded Accuracy: 83% 85% 87% Hit-rate: 81% 69% 31% Precision: 45% 49% 62% Self-excluded Accuracy: 82% 83% 87% Hit-rate: 74% 54% 30% Precision: 42% 43% 61% Interim conclusions For operator 1 the three risk bands applied to the flagged sample have comparable hit-rates to the original results using the self-report measure of problem gambling. Notably, the operator excluded sample is shown to have a higher hit-rate across risk bands than for self-reported problem gambling, which supports the finding from Phase 1 that self-exclusion is not a direct proxy for problem gambling. Whilst the sample size is small it indicates that the mechanism developed with a self-reported PGSI for identifying problem gamblers using automated markers also holds for problem gamblers identified through more manual and lengthy customer processes. The precision scores are lower across risk bands for the operator testing dataset compared with the original self-reported dataset. This either implies: Over-sensitiveness of the present methodology at identifying problem gamblers in the operator data There are customers exhibiting problem gambling behaviour which were not identified using the operator mechanisms We can conclude that with a comparable hit rate between the proxy self-reported problem gamblers (PGSI: 8+) and operator identified problem gamblers there is a degree of confidence that this testing data set will hold up in an operational environment. However, the conclusion is limited by the availability of information provided to perform this test. We recommend that further validation is performed on a dataset containing proven problem gamblers behaviour, ideally with a set of customers identified via independent processes e.g. another research process that has identified problem gamblers via more extensive and perhaps qualitative investigation. 27 For comparison the proportion of flagged customers is rescaled to the 14.6% of problem gamblers in the sample for the predictive models across all segments 64


68 9. Application discussion 9.1 Summary of findings In this study we examined different markers throughout three states of the customer lifecycle: on-entry, over time and in-the-moment. A refined set of 22 predictive markers, across demographics and behavioural summaries and 39 instances of daily triggers were used to identify problem gambling. These provide insight into how actions could be taken at various phases of the relationship with a customer. Table 21. Summary of problem gambling markers Category Identification Markers Demographic On-entry 8 Behavioural Builds over time 14 Daily triggers In-the-moment 39 We defined a set of questions we aimed to answer in this study and summarise our findings here: Can remote problem gamblers be identified by their online transactional behaviour? Yes. After transactional behaviour is observed, remote problem gamblers are more clearly identifiable. In particular, problem gamblers typically place higher value bets, bet in higher volumes on days that they gamble and deposit money more frequently. However, they are also more erratic on the days that they play and the amount they bet when they do. Moreover, operators can identify many gamblers with a high risk of harm accurately with a week of play data, with further evidence that builds over time, beginning to plateau between 3 and 6 months of data. How soon can operators identify remote problem gamblers in their customer lifecycle? Demographic markers such as age, gender, and the age of the account are available to operators before customers deposit money or place a bet. However the data presently collected by the four operators does not cover all the markers that were identified to be predictive at this point. Furthermore, only a few very distinct demographic groups generate meaningfully high risk scores at this point in the customer lifecycle, and therefore transactional data are also required to provide sufficient evidence of problem gambling. Our analysis suggests that such predictions can be made after 1 week of transactional data and mature after 3-6 months. The use of daily triggers also enable an operator to detect and intervene in-the-moment during any day of play that is highly predictive of problem gambling. 65
69 Do markers of remote problem gambling vary for different groups of customers? An examination of gambling profiles revealed nine distinct customer segments, of which four were notably higher risk with a significantly higher proportion of problem gamblers. For each segment there were unique behavioural and daily trigger markers identified but also many similarities across segments. However, tailoring the approach of classifying customers as problem gamblers according to their gambling profile segment improves the ability to respond to these different customers. Could operators identify a remote problem gambler in-the-moment? We have identified specific unique markers of problem gambling related to play activity that can be used as triggers to intervene in-the-moment rather than wait for a risk score to develop over time. These need to be converted into rules that can be applied consistently across the customer base to enable in-the-moment interventions. What markers are practical to implement online, especially given the level of false positives for those predicted as remote problem gamblers? Models of this type can be highly predictive but can have a significant false positive rate. We have illustrated different threshold scenarios that enable an operator to trade off detection versus precision and customise these thresholds for different segments, devising an appropriate intervention to match the degree of confidence in the problem gambler prediction. 9.2 Marker usage throughout the customer lifecycle At each state of the customer life cycle there are practical applications of these markers but also limitations that need to be considered in any operational model used by operators. On-entry the demographic predictions demonstrated that there are relevant markers that operators can use on-entry but that only generate meaningfully high problem gambling risk scores for distinct customer groups. This suggests that account creation filters based on basic demographic data presently collected by operators would be quite limited. We have demonstrated additional demographic data adds to the model performance so we propose to test in Phase 3 pilots what additional data could be collected on account creation to improve identification on-entry. Over time as a new customer begins to play their betting activity will build a profile that defines their relevant segment and generates a behavioural risk score which matures at around three months of play. Whilst transaction behaviour provides strong signals of problem gambling where the customer is a primary account user, the impact of multi-operator gambling needs to be considered in certain segments which could mean the models miss problem gamblers due to low volume betting profiles. We also note from a practical perspective that customer contact data may add additional predictive markers but this needs more work by the operators to able access. Until these data sets are available and can be considered, their inclusion is not practical. In-the-moment we have identified daily triggers, which are distinct daily betting patterns observed by problem gamblers. These can be used to identify when play behaviour observed within a day crosses a threshold for a particular daily trigger rule that is associated with 66
70 Risk score problem gamblers. This approach enables operators to intervene immediately as harmful play is detected and suggest harm minimisation actions. Application of these approaches in live operator environments would allow a more effective and automated mechanism for the identification of problem gamblers or behaviour indicative of problem gambling. Phase 1 noted that the main method operators currently use to determine where there is an actual or potential harm occurring is through a number of manual review processes such as a conversation with a trained call centre expert, complemented by a review of information from public sources such as Facebook and LinkedIn. Developing such a mechanism would allow more consistent problem gambler classification and mitigation across the industry, thereby reducing costs and the rate of false negatives during detection i.e. those problem gambler that previously went undetected because it relied on a reaction by the operator such as a call centre alert. 9.3 Graded intervention The behavioural summary risk scores enable a graded intervention strategy. This would allow operators to take alternative actions, dependent on their levels of confidence in a customer s risk. Further exploration of such a strategy and the development of specific interventions would be addressed in a next phase of the project (Phase 3). An indicative strategy is presented in Figure Aug Sep Oct Nov Dec Jan Feb Mar Apr May Daily triggers Low risk Moderate risk High risk Limit betting Contact customer Add to watch list Observe daily trigger: Enact in-the-moment intervention Figure 39: Illustration of a potential graded intervention strategy The behavioural risk score would run daily to score all customers and group them into high risk, moderate risk, low risk or no action groups so specific interventions could be implemented. The risk scores are an aggregate of behaviour over time so may not be immediately sensitive to volatile or sudden higher volumes of play. This can be complemented by daily trigger markers run continuously that when triggered initiate in-the-moment interventions (e.g. in game messaging, automated protection limits or customer service intervention) to limit harmful play. This combination of daily and continuous marker detection would cover a range of behaviour over the customer life cycle. 67
71 9.4 Operator detection model recommendations Having identified a method by which problematic gambling can be detected from data held by operators, we summarise here a set of principles we recommend operators use in their ongoing and future practices to minimise harm. Applying these principles to an operational model that can be used in practice will be developed and tested in the next phase, which is discussed in the next section. Based on our learnings from Phase 1 and 2 of research our view is that operators should: 1. Use self-reported PGSI survey results to train detection models, not self-exclusion data 2. Use a range of data sets in detection models, including: a. Demographics (e.g. age, gender) b. Account activity (e.g. deposits, withdrawals, use of protection tools) c. Play activity (e.g. volume of bets) d. Customer service contacts Use customer segmentation based on play behaviour to identify higher risk gambling groups 4. Use multivariate models to capture complex combinations of features 5. Run detection models from the day the account is created, starting with demographic data to identify higher risk groups 6. Update detection models daily to create customer risk scores that change as play behaviour develops over time 7. Complement this with daily detection of specific problem gambling triggers to enable immediate investigation and potentially intervention 8. Use risk thresholds customised by segment to set detection and intervention policies 9.5 Limitations The present study explored a range of predictive markers of problem gambling. Throughout the design principles, approach and method, various limitations are highlighted. Whilst the response rate is reasonable compared to typical online surveys, unknown biases have to be accepted as a potential limitation. In addition, we note two key areas that could not be examined with the present dataset. Operator-held data concerning the use of customer protection tools and customer service contacts were not consistently available and could not adequately be assessed in the context of the other predictive markers. These are expected to reveal significant markers of problem gambling, which could be used to improve interventions over the customer life-cycle. Furthermore, not all operators were able to provide data at the individual bet level. There is evidence to suggest the proportion of sports betting placed between 0-4am is an important marker of problem gambling. However, there may be other distinct patterns observed within- 28 Following additional research that measures any incremental performance improvement through their inclusion 68
72 day that could be used as additional behavioural markers or that could be used as the basis of additional daily trigger preventative rules. Evidence provided by the present study also suggests that there are many problem gamblers that play across online and retail channels and with multiple operators. This would result in underestimated risk scores for problem gambling that are analysed separately for each account rather than from behaviour across accounts. We therefore propose to test the feasibility of a multi-operator detection capability, which we recommend to explore in Phase 3 of the programme. Furthermore, given the inherent bias during sampling towards active customers, many of the conclusions for the present study cannot be generalised to the larger population of online gamblers at this stage. In particular, precision scores throughout the analyses are likely to be inflated as a result of problem gamblers being overrepresented in the samples collected. This is partly mitigated by refining the predictive models to the four highest risk segments only, which are less likely to be diluted by low volume customers excluded from the present study. However, this limited the scope of analysis to that reduced set of customers and for which the prevalence in the population is unknown. The application of varying thresholds for classification requires a cost trade-off between falsely predicting self-reported non-problem gamblers as problem gamblers (false positives) and failing to predict true problem gamblers as problem gamblers (false negatives). This has important ethical implications because it requires a direct comparison between over-action and inaction. Setting the net too wide, thereby increasing the rate of false positives has both a direct financial cost to the operators and a welfare cost of intervening with customers that are not problem gamblers or not at risk of becoming one. In contrast setting the net too narrow, thereby increasing the rate of false negatives has the moral and social consequences of allowing problem gamblers to continue gambling. This is beyond the scope of the present study but needs to be considered in Phase 3 as part of any intervention strategy developed. 9.6 Conclusions So to conclude: can available operator data identify markers that could be predictive of problem gambling? Yes, this study has demonstrated that there are opportunities to identify markers across the customer lifecycle and across three gaming verticals. There are key limitations around multi operator play but with a combination of approaches markers can be detected across the life-cycle to identify problem gamblers, and therefore harm can be minimised with the appropriate use of interventions. This is the focus of the next phase of this programme. 69
73 10. Recommendations for Phase 3 The overall objective of a Phase 3 is to develop, test and refine an intervention strategy for minimising harm from remote gambling in the UK. By using the predictive markers and exploratory approaches developed in Phase 2, we aim to start identifying individuals at risk of harm in a pilot experiment running against live customer betting. We would then begin testing the efficacy of a set of industry agreed interventions to see what, if any, are effective at reducing the sort of play patterns we believe are predictive of problematic gambling. The outcome of Phase 3 would be a model containing operationally tested markers that can be utilised by remote bookmakers in their responsible gambling operations, and some recommended interventions. Recommendations will be based on an evaluation of the impact on reducing harmful or risky gambling behaviour and practicality. We aim to achieve this phase s goals through the following steps which we recommend to start in 2017: a) Learning workshops enable gambling operators to learn and embed the knowledge and capabilities developed over Phase 2 to ensure a base-line capacity for harm identification in the industry. Therefore mitigate the risk of limited or differentiated responses due to a lack of consistent training. b) Pilot test design design a framework and parameters for an industry pilot test in order to recruit operators. Incorporate operator, regulator and other stakeholder feedback early and check the technological feasibility of intervention types before starting design. c) Industry intervention framework establish an intervention strategy for operators to pilot, which would stratify gamblers based on agreed risk thresholds and have appropriate interventions deployed (e.g. monitor, message, exclude). We recommend that an industry working group could build on ongoing work on intervention messaging which we believe could be made available as an input to this phase. d) Live pilot test test in a live pilot the usefulness of the risk algorithm to identify atrisk customers and the effectiveness of interventions to reduce harmful gambling. Player behaviour will be monitored over time to understand the effects of the interventions. Within this pilot, an operational model that can be deployed by operators will be developed. The operational model should incorporate a number of improvements identified in this study such as daily triggers and customer segmentation. d) Broader application feasibility study the feasibility of a range of ways to create a broader industry-wide harm minimisation framework, incorporating the strategy developed and tested in this research programme, but widening it for further application (e.g. use in land-based environments, links to self-exclusion schemes, the creation of a national risk register with cross-operator data sharing). A feasibility study would test the legal, technical and commercial considerations of a variety of enhancements. 70
74 11. Glossary Gross Gambling Revenue - For games in which the operator accepts risk gross gambling revenue is defined as stakes less winnings; for games in which the operator accepts no risk gross gambling revenue is the revenue that accrues to the operator (e.g. commission or equivalent charges) Harm (no commonly accepted definition) - The adverse financial, personal and social consequences to player, their families and wider social networks that can be caused by uncontrolled gambling Marker - A behaviour or indicator which can be used to reliably predict another behaviour or state, such as problem gambling Problem gambling (no commonly accepted definition) - A progressive disorder characterised by a continuous or periodic loss of control over gambling; a preoccupation with gambling and with obtaining money with which to gamble; irrational thinking; and a continuation of the behaviour despite adverse consequences Problem Gambling Severity Index (PGSI) - A measure that allows for the assessment of social and environmental aspects of gambling with the ability to identify levels of problem gambling Operator identified problem gambler - In this context we mean a customer where an operator has completed sufficiently thorough investigations (which often means manual processes completed by an expert) that a player is frozen or the account is closed. There is no commonly accepted means of proving someone is a problem gambler by operators. The PGSI is a validated measure but it is self-reported. Risk score - A problem gambling risk score is calculated for each customer using the predicted probability of being a problem gambler from the predictive modelling. 71
75 12. Appendix Appendix 1: customer survey RGT remote gambling research Introduction Welcome to the Responsbile Gambling Trust (RGT) remote gambling research study. The RGT is the leading charity in the UK committed to minimising gambling related harm. RGT has engaged PwC for their support in improving customer protection during online gambling. As a customer of online gambling, we would be delighted if you would participate in this important study. It will take no longer then 5 minutes to complete The survey will ask you questions about your experience of online gambling. When answering these questions please think about them as referring to your online gambling only, unless the question says otherwise. All information provided in this survey will be kept anonymous and will not be used beyond research purposes or shared with your gambling operator. Your name will not be requested at any point. By participating in this survey, you will have the chance to win 1 of 10 ipads we re giving away. Completing the Survey The 'Back' and 'Next' buttons at the bottom of each screen allow you to navigate through the survey. Please note that using the web browser 'back' button will take you out of the survey without saving your answers. Some screens may require you to use the scroll bar at the right-hand side of the screen in order to move down the page and answer the rest of the question. The navigation buttons will be located at the end of each set of questions. It is best to complete the survey in one sitting. However, if you need to save your questionnaire and return to it later, please do so by clicking the Save now, complete later button, located in the top right hand corner of your screen. To restart the survey click on the link included in your message. The survey will open at the last question submitted. Q1) Which of the following do you consider to be the main device that you use to place bets online. (Please select ONE only) Mobile 1 Tablet 2 Computer 3 Other (please specify) 94 Q2) How much time do you estimate you spend gambling online? (hours per week) (Please select ONE only) < 2 hours per week hours per week hours per week 3 > 10 hours per week 4 Don t know/prefer not to say 96 72
76 Q3) How many online gambling sites do you currently gamble with? (Please select ONE only) More than 5 6 Don t know/prefer not to say 96 Q4) What is your current employment status? (Please select ONE only) Employed full time 1 Employed part time 2 Self-employed 3 Not employed, but currently looking for work 4 Not employed, but not currently looking for work 5 Student 6 Retired 7 Staying at home to raise a family 8 Staying at home to care for a friend / family member 9 Other (please specify) 94 Don t know/prefer not to say 96 Q5) What is your marital status? (Please select ONE only) Single, never married 1 Married/Civil Union/Civil Partnership 2 Living with partner 3 Separated 4 Divorced 5 Widowed / widower 6 Prefer not to answer 7 Other (please specify) 94 Don t know/prefer not to say 96 Q6a) Do you have children? (Please select ONE only) Yes 1 No 2 Don t know/prefer not to say 96 Continue to Q6b Skip to Q7 73
77 Q6b) [IF YES AT Q6A] What age groups do they belong to? (Please select ALL that apply) 0 5 years old years old years old years old 4 > 18 years old 5 Don t know/prefer not to say 96 Q7) Please indicate to which occupational group the Chief Income Earner in your household belongs, or which group fits best. (Hover: Chief Income Earner is the person in your household with the largest income) If the Chief Income Earner is retired and has an occupational pension please answer for their most recent occupation. If the Chief Income Earner is not in paid employment but has been out of work for less than 6 months, please answer for their most recent occupation. ) (Please select ONE only) Semi or unskilled manual work (e.g. Manual workers, all apprentices to be skilled trades, Caretaker, Park keeper, non-hgv driver, shop assistant) 1 Skilled manual worker (e.g. Skilled Bricklayer, Carpenter, Plumber, Painter, Bus/ Ambulance Driver, HGV driver, AA patrolman, pub/bar worker, etc.) 2 Supervisory or clerical/ junior managerial/ professional/ administrative (e.g. Office worker, Student Doctor, Foreman with 25+ employees, salesperson, etc.) 3 Intermediate managerial/ professional/ administrative (e.g. Newly qualified (under 3 years) doctor, Solicitor, Board director small organisation, middle manager in large 4 organisation, principal officer in civil service/local government) Higher managerial/ professional/ administrative (e.g. Established doctor, Solicitor, Board Director in a large organisation (200+ employees, top level civil 5 servant/public service employee) Student 6 Casual worker not in permanent employment 7 Homemaker 8 Retired and living on state pension 9 Unemployed or not working due to long-term sickness 10 Full-time carer of other household member 11 Don t know/prefer not to say 96 Q8) Have you ever had concerns about your gambling behaviour? (Please select ONE only) Yes 1 No 2 Don t know/prefer not to say 96 74
78 Q9a) Have you ever used any safeguards to restrict your online gambling behaviour? (Hover text: Safeguards definition to be provided) (Please select ONE only) Yes 1 Don t know/prefer not to say 96 Continue to Q9b No 2 Skip to Q10 Q9b) [IF YES AT Q9A] You have indicated that you have used safeguards to restrict your online gambling behaviour. Please provide further details of the safeguards you have used. (Please select ALL that apply) Deposit Limits 1 Time Limits 2 Time-Outs 3 Self-exclusion from an operator 4 Contacted the National Gambling Helpline 5 Accessed information from Gamble Aware 6 Contacted Gamblers Anonymous 7 Other 96 If Other, please indicate in the box provided 75
79 Q10) Thinking about the last 12 months of online gambling (Please select ONE response for each row) Never Sometimes Most of the time Almost always Have you bet more than you could really afford to lose? Have you needed to gamble with larger amounts of money to get the same feeling of excitement? When you gambled, did you go back another day to try to win back the money you lost? Have you borrowed money or sold anything to get money to gamble? Have you felt that you might have a problem with gambling? Has gambling caused you any health problems, including stress or anxiety? Have people criticised your betting or told you that you had a gambling problem, regardless of whether or not you thought it was true? Has your gambling caused any financial problems for your household? Have you felt guilty about the way you gamble or what happens when you gamble? Q11a) Which of the following gambling activities have you taken part in online in the last 12 months? (Please select ALL that apply) Lottery 1 Bingo 2 Poker 3 Casino games 4 Slots and gaming machines 5 Betting exchanges 6 Spread betting 7 Betting on horse racing 8 Betting on football 9 Betting on other sports or events 10 Don t know/prefer not to say 96 76
80 Q11b) How frequently do you take part in these gambling activities online? (Please select ONE response for each row) Never 1 Once a year 2 Every 2-3 months 3 Once a month times a mont Weekly times a week 7 Daily 8 Lottery Bingo Poker Casino games Slots and gaming machines Betting exchange Spread betting Betting on horse racing Betting on football Betting on other sports or events Q12a) Thinking outside of your online gambling, what forms of gambling activities have you taken part in on the high street, in betting shops, in casinos or other retail premises in the last 12 months? (Please select ALL that apply) Lottery 1 Bingo 2 Poker 3 Casino games 4 Slots and gaming machines 5 Betting on horse racing 8 Betting on football 9 Betting on other sports or events 10 Don t know/prefer not to say 96 77
81 Q12b) How frequently do you take part in these gambling activities in retail premises? (Please select ONE response for each row) Never 1 Once a year 2 Every 2-3 months 3 Once a month times a mont Weekly times a week 7 Daily 8 Lottery Bingo Poker Casino games Slots and gaming machines Betting on horse racing Betting on football Betting on other sports or events Thank you for taking the time to complete this survey. 78
82 Appendix 1.1: supplementary customer survey results Q10) Thinking about the last 12 months of online gambling (Please select ONE response for each row) PGSI Non-problem Low risk Moderate risk Problem gambler Questions Never Never Sometimes Most of the time Never Sometimes Most of the time Almost always Never Sometimes Most of the time Almost always When you gambled, did you go back another day to try to win back the money you lost? Have you felt guilty about the way you gamble or what happens when you gamble? Have you bet more than you could really afford to lose? Have you felt that you might have a problem with gambling? Have you needed to gamble with larger amounts of money to get the same feeling of excitement? Have people criticised your betting or told you that you had a gambling problem, regardless of whether or not you thought it was true? Has gambling caused you any health problems, including stress or anxiety? Has your gambling caused any financial problems for your household? Have you borrowed money or sold anything to get money to gamble? 3,954 1,128 2, , ,954 3, , ,954 3, , ,954 3, ,009 1, ,954 3, ,258 1, ,954 3, ,298 1, ,954 3, , ,954 3, , ,954 3, ,
83 Q11b) How frequently do you take part in these gambling activities online? (Please select ONE response for each row) Freq. Activity Non-problem Low risk Moderate risk Problem gambler Spread betting Betting exchanges Poker Bingo Slots and gaming machines Casino games Betting on other sports or events Lottery Betting on horse racing Betting on football Spread betting Betting exchanges Poker Bingo Slots and gaming machines Casino games Betting on other sports or events Lottery Betting on horse racing Betting on football Spread betting Betting exchanges Poker Bingo Slots and gaming machines Casino games Betting on other sports or events Lottery Betting on horse racing Betting on football 1,439 1, Spread betting Betting exchanges Poker Bingo Slots and gaming machines Casino games Betting on other sports or events Lottery Betting on horse racing Betting on football Spread betting Betting exchanges Poker Bingo Slots and gaming machines Casino games Betting on other sports or events Lottery Betting on horse racing Betting on football Spread betting Betting exchanges Poker Bingo Slots and gaming machines Casino games Betting on other sports or events Lottery Betting on horse racing Betting on football Spread betting Betting exchanges Poker Bingo Slots and gaming machines Casino games Betting on other sports or events Lottery Betting on horse racing Betting on football Don t know / Prefer not to say Daily 2-3 times a week Weekly 2-3 times a month Once a month Every 2-3 months Once a year 80
84 Q12b) How frequently do you take part in these gambling activities in retail premises? (Please select ONE response for each row) Freq. Activity Non-problem Low risk Moderate risk Problem gambler Betting on football Betting on horse racing Betting on other sports or events Bingo Casino games Lottery Poker Slots and gaming machines Betting on football Betting on horse racing Betting on other sports or events Bingo Casino games Lottery Poker Slots and gaming machines Betting on football Betting on horse racing Betting on other sports or events Bingo Casino games Lottery Poker Slots and gaming machines Betting on football Betting on horse racing Betting on other sports or events Bingo Casino games Lottery Poker Slots and gaming machines Daily 2-3 times a week Weekly 2-3 times a month Once a month Every 2-3 months Once a year Betting on football Betting on horse racing Betting on other sports or events Bingo Casino games Lottery Poker Slots and gaming machines Betting on football Betting on horse racing Betting on other sports or events Bingo Casino games Lottery Poker Slots and gaming machines Betting on football Betting on horse racing Betting on other sports or events Bingo Casino games Lottery Poker Slots and gaming machines Don't know / Prefer not to say Online only 1,417 1,
85 Appendix 2: customer service markers All of the operators have a system that captures data on contacts made with customer service. However, being able to link customer service data to account and transactional data wasn t uniformly straightforward. A separate request was made for available contact data for a sample of survey respondents. A sample of 196 customers was provided by one operator, of which 96 were problem gamblers and 100 non-problem gamblers. On average non-problem gamblers made 4.7 contacts per year, problem gamblers made 7.0 contacts, approximately a 50% increase. Topics more common to problem gamblers included: Bonus marketing (119 contacts vs 89, +34%) Account related (114 contacts vs 51, +124%) Technical issues (65 vs 34, +91%) Following increased betting behaviour, problem gamblers mostly contact customer service to discuss deposits, transactions, rule explanations and missing/trapped funds. 82
86 Appendix 3: markers and measures Demographics Marker Measure Comments Age Age Children Children Employment Employment Gender Gender Marital Marital Occupation Occupation Operator Operator Time accountholder Numeric_account_creation Time accountholder Time_accountholder_yrs Betting behaviour Marker Measure Comments Bet frequency Bet_freq Bet frequency Bet_freq_t Transformed (e.g. log) Bet sparsity Bet_sparsity_cov Coefficient of variance Bet sparsity Bet_sparsity_mean Bet sparsity Bet_sparsity_sd Standard deviation Bet sparsity Bet_sparsity_sk Skewness Bet value Bet_perBetVal_daily_overall_avg Bet value Bet_perBetVal_daily_overall_cov Coefficient of variance Bet value Bet_perBetVal_daily_overall_sd Standard deviation Bet value Bet_perBetVal_daily_overall_sk Skewness Bet value Bet_val_avg Bet value Bet_val_avg_avg Bet value Bet_val_avg_avg_cov Coefficient of variance Bet value Bet_val_avg_avg_sd Standard deviation Bet value Bet_val_avg_avg_sk Skewness Bet value Bet_val_avg_t Transformed (e.g. log) Bet volume Bet_all_days Bet volume Bet_volume Bet volume Bet_volume_cov Coefficient of variance Bet volume Bet_volume_sd Standard deviation Bet volume Bet_volume_sk Skewness Bet volume Bet_volume_t Transformed (e.g. log) Daily bet value Bet_val_daily_overall_avg Daily bet value Bet_val_daily_overall_cov Coefficient of variance Daily bet value Bet_val_daily_overall_cov_t Transformed (e.g. log) Daily bet value Bet_val_daily_overall_sd Standard deviation Daily bet value Bet_val_daily_overall_sk Skewness 83
87 Account behaviour Marker Measure Comments Cancelled withdrawal flags Cancelled_withd01 Deposit frequency Dep_freq_bybets Deposit Bet day Deposit frequency Dep_freq_bybets_t Transformed (e.g. log) Deposit sparsity Dep_sparsity_cov Coefficient of variance Deposit sparsity Dep_sparsity_mean Deposit sparsity Dep_sparsity_sd Standard deviation Deposit sparsity Dep_sparsity_sk Skewness Deposit value Dep_val_avg Deposit value total_deposit Failed deposit flag Failed_dep01 Use of protection tools Protection_tools01 Withdrawal frequency With_freq_bybets_t Transformed (e.g. log) Withdrawal frequency Withd_freq_bybets Withdrawal sparsity W_sparsity_cov Coefficient of variance Withdrawal sparsity W_sparsity_mean Withdrawal sparsity W_sparsity_sd Standard deviation Withdrawal sparsity W_sparsity_sk Skewness Withdrawal value total_with Withdrawal value Withd_perW_val Withdrawal value Withd_perW_val_cov Coefficient of variance Withdrawal value Withd_perW_val_sd Standard deviation Withdrawal value Withd_perW_val_sk Skewness Withdrawal value Withd_val_avg Win / loss behaviour Marker Measure Comments Net position (winnings - stake) Net_position_cov Coefficient of variance Net position (winnings - stake) Net_position_mean Net position (winnings - stake) Net_position_sd Standard deviation Net position (winnings - stake) Net_position_sk Skewness Net position (winnings - stake) total_net_position Net position given overall loss in day Net_position_loss_cov Coefficient of variance Net position given overall loss in day Net_position_loss_mean Net position given overall loss in day Net_position_loss_min Net position given overall loss in day Net_position_loss_sd Standard deviation Net position given overall loss in day Net_position_loss_skewness Skewness Net position given overall win in day Net_position_win_cov Coefficient of variance Net position given overall win in day Net_position_win_max 84
88 Net position given overall win in day Net_position_win_mean Net position given overall win in day Net_position_win_sd Standard deviation Net position given overall win in day Net_position_win_sk Skewness Win frequency Win frequency Win frequency Win_days Win_freq Win_freq_transaction Day of the week and time of day Marker Measure Comments By game length of gaps between play Gap_bingo_time_cov Coefficient of variance By game length of gaps between play Gap_bingo_time_hrs By game length of gaps between play Gap_bingo_time_sd Standard deviation By game length of gaps between play Gap_bingo_time_sk Skewness By game length of gaps between play Gap_gaming_time_cov Coefficient of variance By game length of gaps between play Gap_gaming_time_hrs By game length of gaps between play Gap_gaming_time_sd Standard deviation By game length of gaps between play Gap_gaming_time_sk Skewness By game number of play sessions within day Gap_no_bingo_avg By game number of play sessions within day Gap_no_bingo_cov Coefficient of variance By game number of play sessions within day Gap_no_bingo_sd Standard deviation By game number of play sessions within day Gap_no_bingo_sk Skewness By game number of play sessions within day Gap_no_gaming_avg By game number of play sessions within day Gap_no_gaming_cov Coefficient of variance By game number of play sessions within day Gap_no_gaming_sd Standard deviation By game number of play sessions within day Gap_no_gaming_sk Skewness By game number of play sessions within day Gap_no_sports_avg By game number of play sessions within day Gap_no_sports_cov Coefficient of variance By game number of play sessions within day Gap_no_sports_sd Standard deviation By game number of play sessions within day Gap_no_sports_sk Skewness By game number of play sessions within day Gap_sports_time_cov Coefficient of variance By game number of play sessions within day Gap_sports_time_hrs 85
89 By game number of play sessions within day Gap_sports_time_sd Standard deviation By game number of play sessions within day Gap_sports_time_sk Skewness By game Saturday betting Bet_bingo_not_sat By game session time Bet_bingo_time_cov Coefficient of variance By game session time Bet_bingo_time_hrs By game session time Bet_bingo_time_sd Standard deviation By game session time Bet_bingo_time_sk Skewness By game session time Bet_sports_time_cov Coefficient of variance By game session time Bet_sports_time_hrs By game session time Bet_sports_time_sd Standard deviation By game session time Bet_sports_time_sk Skewness By game time of day bets made (e.g. 0-4am) Bet_late0004_bingo_cov Coefficient of variance By game time of day bets made (e.g. 0-4am) Bet_late0004_bingo_mean By game time of day bets made (e.g. 0-4am) Bet_late0004_bingo_sd Standard deviation By game time of day bets made (e.g. 0-4am) Bet_late0004_bingo_sk Skewness By game time of day bets made (e.g. 0-4am) Bet_late0004_gaming_cov Coefficient of variance By game time of day bets made (e.g. 0-4am) Bet_late0004_gaming_mean By game time of day bets made (e.g. 0-4am) Bet_late0004_gaming_sd Standard deviation By game time of day bets made (e.g. 0-4am) Bet_late0004_gaming_sk Skewness By game time of day bets made (e.g. 0-4am) Bet_late0004_sports_cov Coefficient of variance By game time of day bets made (e.g. 0-4am) Bet_late0004_sports_mean By game time of day bets made (e.g. 0-4am) Bet_late0004_sports_sd Standard deviation By game time of day bets made (e.g. 0-4am) Bet_late0004_sports_sk Skewness By game time of day bets made (e.g. 0-4am) Bet_late2024_bingo_cov Coefficient of variance By game time of day bets made (e.g. 0-4am) Bet_late2024_bingo_mean By game time of day bets made (e.g. 0-4am) Bet_late2024_bingo_sd Standard deviation By game time of day bets made (e.g. 0-4am) Bet_late2024_bingo_sk Skewness By game time of day bets made (e.g. 0-4am) Bet_late2024_gaming_cov Coefficient of variance By game time of day bets made (e.g. 0-4am) Bet_late2024_gaming_mean By game time of day bets made (e.g. 0-4am) Bet_late2024_gaming_sd Standard deviation By game time of day bets made (e.g. 0-4am) Bet_late2024_gaming_sk Skewness By game time of day bets made (e.g. 0-4am) Bet_late2024_sports_cov Coefficient of variance 86
90 Games verticals played Marker Measure Comments Mixture of games played Bet_xGBgames_days Mixture of games played Bet_xGgames_days Mixture of games played Bet_xSBgames_days Mixture of games played Bet_xSgames_days Mixture of games played Bet_xSGBgames_days Mixture of games played Bet_xSGgames_days Mixture of games played xbgames Mixture of games played xbgames_days Mixture of games played xgbgames Mixture of games played xgbgames_days Mixture of games played xggames Mixture of games played xggames_days Mixture of games played xsbgames Mixture of games played xsbgames_days Mixture of games played xsgames Mixture of games played xsgames_days Mixture of games played xsgbgames Mixture of games played xsgbgames_days Mixture of games played xsggames Mixture of games played xsggames_days Sports multipliers Bet_all_multi_days Sports multipliers Bet_sport_multi_cov Coefficient of variance Sports multipliers Bet_sport_multi_sd Standard deviation Sports multipliers Bet_sport_multi_sk Skewness Mixture of games played Bet_xBgames_days Sports multipliers Bet_multipliers Sports multipliers Bet_single_days By game bet frequency Bet_gaming_cov Coefficient of variance By game bet frequency Bet_gaming_days By game bet frequency Bet_gaming_freq By game Saturday betting Bet_gaming_not_sat By game bet value Bet_gaming_perBetVal_daily_avg By game bet value Bet_gaming_perBetVal_daily_cov Coefficient of variance By game bet value Bet_gaming_perBetVal_daily_sd Standard deviation By game bet value Bet_gaming_perBetVal_daily_sk Skewness By game bet frequency Bet_gaming_sd Standard deviation By game bet frequency Bet_gaming_sk Skewness By game session time Bet_gaming_time_cov Coefficient of variance By game session time Bet_gaming_time_hrs By game session time Bet_gaming_time_sd Standard deviation By game session time Bet_gaming_time_sk Skewness By game bet value Bet_gaming_val_avg By game bet value Bet_gaming_val_daily_avg By game bet value Bet_gaming_val_daily_cov Coefficient of variance 87
91 By game bet value Bet_gaming_val_daily_sd Standard deviation By game bet value Bet_gaming_val_total By game bet volume Bet_volume_gaming By game bet volume Bet_volume_gaming_cov Coefficient of variance By game bet volume Bet_volume_gaming_sd Standard deviation By game bet volume Bet_volume_gaming_sk Skewness By game bet frequency Bet_sports_cov Coefficient of variance By game bet value Bet_sports_perBetVal_daily_avg By game bet value Bet_sports_perBetVal_daily_cov Coefficient of variance By game bet value Bet_sports_perBetVal_daily_sd Standard deviation By game bet value Bet_sports_perBetVal_daily_sk Skewness By game bet frequency Bet_sports_sd Standard deviation By game bet frequency Bet_sports_sk Skewness By game bet sparsity Bet_sports_sparsity_mean By game daily bet value Bet_sports_val_daily_avg By game daily bet value Bet_sports_val_daily_cov Coefficient of variance By game daily bet value Bet_sports_val_daily_sd Standard deviation By game daily bet value Bet_sports_val_daily_sk Skewness By game bet value Bet_sport_val_avg By game bet value Bet_sport_val_total By game bet frequency Bet_sports_days By game bet frequency Bet_sports_freq By game Saturday betting Bet_sports_not_sat By game bet volume Bet_volume_sports By game bet volume Bet_volume_sports_cov Coefficient of variance By game bet volume Bet_volume_sports_sd Standard deviation By game bet volume Bet_volume_sports_sk Skewness By game bet frequency Bet_bingo_cov Coefficient of variance By game bet frequency Bet_bingo_days By game bet frequency Bet_bingo_freq By game bet value Bet_bingo_perBetVal_daily_avg By game bet value Bet_bingo_perBetVal_daily_cov Coefficient of variance By game bet value Bet_bingo_perBetVal_daily_sd Standard deviation By game bet value Bet_bingo_perBetVal_daily_sk Skewness By game bet frequency Bet_bingo_sd Standard deviation By game bet frequency Bet_bingo_sk Skewness By game bet sparsity Bet_bingo_sparsity_mean By game bet value Bet_bingo_val_avg By game bet value Bet_bingo_val_daily_avg By game bet value Bet_bingo_val_daily_cov Coefficient of variance By game bet value Bet_bingo_val_daily_sd By game bet value Bet_bingo_val_total By game bet volume Bet_volume_bingo By game bet volume Bet_volume_bingo_cov Coefficient of variance By game bet volume Bet_volume_bingo_sd Standard deviation By game bet volume Bet_volume_bingo_sk Skewness 88
92 By game time of day bets made (e.g. 0-4am) Bet_late2024_sports_mean By game time of day bets made (e.g. 0-4am) Bet_late2024_sports_sd Standard deviation By game time of day bets made (e.g. 0-4am) Bet_late2024_sports_sk Skewness Saturday betting Bet_not_sat Session time Bet_time_cov Coefficient of variance Session time Bet_time_hrs Session time Bet_time_sd Standard deviation Session time Bet_time_sk Skewness 89

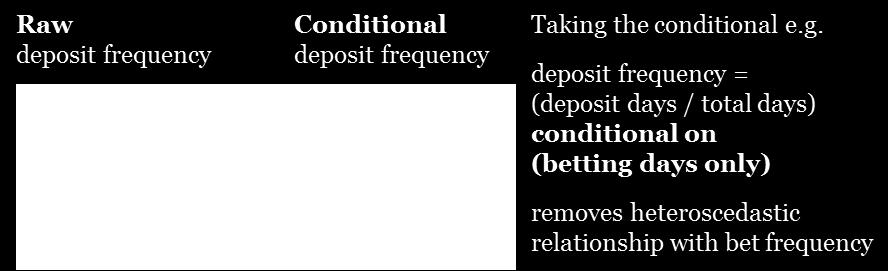
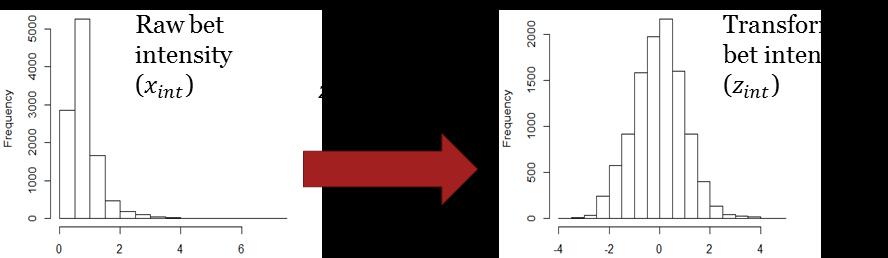

93 Appendix 4: illustrative variable pre-processing Variable creation e.g. Variable transformations e.g. 90
Assessing the impact of interactive gambling and new technologies
 Assessing the impact of interactive gambling and new technologies Dr. Sally Gainsbury Centre for Gambling Education and Research, Southern Cross University 10 th European Conference on Gambling Studies
Outcome-based payment schemes: government s use of payment by results
 Report by the Comptroller and Auditor General Cross-government Outcome-based payment schemes: government s use of payment by results HC 86 SESSION 2015-16 19 JUNE 2015 Outcome-based payment schemes: government
Evaluating the Influence of R3 Treatments on Fishing License Sales in Pennsylvania
 Evaluating the Influence of R3 Treatments on Fishing License Sales in Pennsylvania Prepared for the: Pennsylvania Fish and Boat Commission Produced by: PO Box 6435 Fernandina Beach, FL 32035 Tel (904)
Patterns of play: analysis of data from machines in bookmakers
 Patterns of play: analysis of data from machines in bookmakers Authors: Heather Wardle, Eleanor Ireland, Stephen Sharman, David Excell and Daniel Gonzalez-Ordonez Date: 18.06.2015 Prepared for: The Responsible
2009 New Brunswick Gambling Prevalence Study
 2009 New Brunswick Gambling Prevalence Study Prepared for: Government of New Brunswick Centennial Building P.O. Box 6000 Fredericton, NB E3B 5H1 Prepared by: TABLE OF CONTENTS EXECUTIVE SUMMARY... 1 STUDY
EXPLORING MOTIVATION AND TOURIST TYPOLOGY: THE CASE OF KOREAN GOLF TOURISTS TRAVELLING IN THE ASIA PACIFIC. Jae Hak Kim
 EXPLORING MOTIVATION AND TOURIST TYPOLOGY: THE CASE OF KOREAN GOLF TOURISTS TRAVELLING IN THE ASIA PACIFIC Jae Hak Kim Thesis submitted for the degree of Doctor of Philosophy at the University of Canberra
Danish gambling market statistics Third quarter, 2017
 Danish gambling market statistics Third quarter, Third Quarter, 7. december Third Quarter, Danish gambling market statistics 1 Indhold A. Introduction... 2 B. Quarterly market statistics for the Danish
Submission to the Victorian Government s Review into Static Betting Advertising
 Submission to the Victorian Government s Review into Static Betting Advertising 19 September 2016 About bet365 bet365 is a privately held group of companies which was founded in Stoke-on-Trent in the UK
London Organising Committee of the Olympic Games and Paralympic Games. 14 June 2010
 London Organising Committee of the Olympic Games and Paralympic Games 14 June 2010 London 2012 Olympic and Paralympic Games Volunteer Protocol Title This document shall be known as the London 2012 Olympic
Northern Territory. Code of Practice For Responsible Gambling
 Northern Territory Code of Practice For Responsible Gambling 2 Statement This Code of Practice reflects a partnership between Northern Territory gambling providers, Government, regulators and counseling
Do wagering inducements encourage impulse betting amongst sports bettors?
 Do wagering inducements encourage impulse betting amongst sports bettors? Nerilee Hing, Alex Russell, En Li, Peter Vitartas Presenter: Professor Nerilee Hing n.hing@cqu.edu.au International Gambling Conference
Baseline Survey of New Zealanders' Attitudes and Behaviours towards Cycling in Urban Settings
 Baseline Survey of New Zealanders' Attitudes and Behaviours towards Cycling in Urban Settings Highlights 67% of urban New Zealanders, 18 years of age or more own or have access to a bicycle that is in
Campaign for Fairer Gambling
 FOBT Research Report 18 th June 2013 London San Francisco Los Angeles New York Singapore Hong Kong www.2cv.com Methodology and Sample Campaign for Fairer Gambling Face to face interviews were conducted
University of Leeds Travel Plan
 University of Leeds Travel Plan 2015-2018 Contents 1: Introduction 1.1 What is a Travel Plan? 1.2 Why do we need one? 1.3 Sustainability Strategy 2: Overview 2.1 The bigger picture 2.2 The City scale 2.3
BRITISH AND IRISH INDUSTRIES UNITE TO SUPPORT RESPONSIBLE GAMBLING WEEK 2018
 For release, June 19 th, 2018 BRITISH AND IRISH INDUSTRIES UNITE TO SUPPORT RESPONSIBLE GAMBLING WEEK 2018 The Industry Group for Responsible Gambling (IGRG) has announced that Responsible Gambling Week
Follow-up study of loyalty card customers
 Follow-up study of loyalty card customers Changes in gambling behaviour over time Authors: Heather Wardle, Elizabeth Fuller, Natalie Maplethorpe and Hollie Jones Date: 25/01/2017 Prepared for: GambleAware
PERSONALISED TRAVEL PLANNING IN MIDLETON, COUNTY CORK
 PERSONALISED TRAVEL PLANNING IN MIDLETON, COUNTY CORK Elaine Brick Principal Transport Planner AECOM Abstract Smarter Travel funding was awarded to the Chartered Institute of Highways and Transportation
Planning for tennis in your Local Government Area. A resource from Tennis Australia
 Planning for tennis in your Local Government Area A resource from Tennis Australia Part 1 July 2016 ABOUT THIS RESOURCE This resource forms part of Tennis Australia's Local Government Engagement Program.
REPORT. RECOMMENDATION: 1. That the report on Pilot Results Free Transit for Seniors, dated October 25, 2012, from Oakville Transit be received.
 REPORT MEETING DATE: NOVEMBER 15, 2012 FROM: Oakville Transit DATE: October 25, 2012 SUBJECT: Pilot Results - Free Transit for Seniors LOCATION: Town Wide WARD: Town wide Page 1 RECOMMENDATION: 1. That
The Future of Retailing in Canada to 2018
 Comprehensive data overview of the market, with retail sales value and forecasts to 2018 Report Code: RT0191MR Report Price: US$4,950 (Single Copy) www.conlumino-winesandspirits.com Summary The Future
Danish gambling market statistics First quarter 2017
 Danish gambling market statistics First quarter 2017 6. juni 2017 Danish gambling market statistics 1 Introduction The Danish gambling market underwent a partial liberalisation in 2012, with the markets
Foreword. Richard Burt Chief Executive Officer RACING AND WAGERING WESTERN AUSTRALIA
 Foreword While participating in wagering activities may be a pleasurable leisure pursuit for many, the WA Racing Industry acknowledges that for some users, gambling has the potential to become a significant
Loughborough University Travel Planning
 Document Ti tle Client Name Loughborough University Travel Planning Loughborough University Travel Plan Executive Summary 2015-2020 23 December 2015 Loughborough University Travel Planning Project no:
MINE SAFETY TARGETED ASSESSMENT PROGRAM. Ground or strata failure NSW metalliferous mines. April
 MINE SAFETY TARGETED ASSESSMENT PROGRAM Ground or strata failure NSW metalliferous mines April 2017 www.resourcesandenergy.nsw.gov.au Document control Publication title: Ground or strata failure NSW metalliferous
Discussion Paper Men s and Boy s Competition Review 26 May 2017
 BACKGROUND As we enter into the third year of the Men s National Premier League (NPL) three-year licence period, and having launched the Women s NPL off the back of last year s Women s and Girl s Competition
EXECUTIVE SUMMARY. Methods
 EXECUTIVE SUMMARY In the United States, there has been both an explosion in access to gambling, and an explosion in the senior population as the baby boom generation ages. As seniors seek out recreational
Best Practice RBI Technology Process by SVT-PP SIMTECH
 Best Practice RBI Technology Process by SVT-PP SIMTECH We define the best practice in RBI as a proactive technology process which is used to formally and reliably optimise the inspection efforts for each
5. Golf Industry Trends and Developments in the US 6. The US Macro Economy Factors and Impact over Golf Industry
 TABLE OF CONTENTS 1. Golf Industry Performance Worldwide 1.1. Overview 1.2. Global Golf Equipment Demand and Economy 2. The US Golf Industry Overview 2.1. Industry Segmentation 3. Industry Performance
Codebook for Behavioral Characteristics of Internet Gamblers Who Trigger Corporate Responsible Gambling Interventions
 Codebook for Behavioral Characteristics of Internet Gamblers Who Trigger Corporate Responsible Gambling Interventions This codebook provides information for both the raw and analytic datasets used to generate
Update June 2018 OUR 2017 PUBLIC ENGAGEMENT
 Update June 2018 Hi, Let s Get Wellington Moving (LGWM) is developing a Recommended Programme of Investment (RPI) that meets our programme objectives and supports the city s and region s growth. As part
The Economic Impact of Colonial Downs in Virginia
 The Economic Impact of Colonial Downs in Virginia Prepared for Revolutionary Racing January 31, 2018 1309 E Cary Street, Richmond, VA 23219 1025 Huron Road East, Cleveland, OH 44115 chmuraecon.com Table
Codebook for Using Cross-game Behavioral Markers for Early Identification of High-risk Internet Gamblers
 Codebook for Using Cross-game Behavioral Markers for Early Identification of High-risk Internet Gamblers This codebook provides information for both raw and analytic datasets used to generate an algorithm
EPIDEMIOLOGICAL STUDY OF THE PREVALENCE OF PATHOLOGICAL GAMBLING IN THE ADULT POPULATION OF CATALONIA
 EPIDEMIOLOGICAL STUDY OF THE PREVALENCE OF PATHOLOGICAL GAMBLING IN THE ADULT POPULATION OF CATALONIA 2007-2008 EPIDEMIOLOGICAL STUDY Coordinators : Àngels González Ibáñez. Psychiatric Service, Mataró
Using a Mixed-Method Approach to Evaluate the Behavioural Effects of the Cycling City and Towns Programme
 1 of 25 Using a Mixed-Method Approach to Evaluate the Behavioural Effects of the Cycling City and Towns Programme Kiron Chatterjee (Centre for Transport & Society, UWE) with acknowledgements to research
4 Ridership Growth Study
 Clause 4 in Report No. 15 of Committee of the Whole was adopted, without amendment, by the Council of The Regional Municipality of York at its meeting held on November 16, 2017. 4 Ridership Growth Study
Danish gambling market statistics First quarter 2018
 Danish gambling market statistics First quarter, 2018 First quarter 2018 28. juni 2018 Indhold A. Introduction... 1 B. Overview over market developments in first quarter of 2018... 2 C. Online casinos...
At each type of conflict location, the risk is affected by certain parameters:
 TN001 April 2016 The separated cycleway options tool (SCOT) was developed to partially address some of the gaps identified in Stage 1 of the Cycling Network Guidance project relating to separated cycleways.
The Future of Retailing in Norway to 2018
 Comprehensive data overview of the market, with retail sales value and forecasts to 2018 Report Code: RT0197MR Report Price: US$4,950 (Single Copy) www.conlumino-winesandspirits.com Summary The Future
Global Online Gambling Market: Industry Analysis & Outlook ( )
") Industry Research by Koncept Analytics Global Online Gambling Market: Industry Analysis & Outlook ----------------------------------------- (2017-2021) November 2017 1 Executive Summary Online Gambling
Industry Research by Koncept Analytics Global Online Gambling Market: Industry Analysis & Outlook ----------------------------------------- (2017-2021) November 2017 1 Executive Summary Online Gambling
Qualification Purpose Statement: 1st4sport Level 3 Certificate in Coaching Judo (QCF)
") Qualification Purpose Statement: 1st4sport Level 3 Certificate in Coaching Judo (QCF) Regulation Qualification title Qualification No. Level Credit GLHs 1 1st4sport Level 3 Certificate in Coaching Judo
Qualification Purpose Statement: 1st4sport Level 3 Certificate in Coaching Judo (QCF) Regulation Qualification title Qualification No. Level Credit GLHs 1 1st4sport Level 3 Certificate in Coaching Judo
Nightriders why extending your opening hours could unlock new profit potential
 Nightriders why extending your opening hours could unlock new profit potential NIGHTRIDERS Why extending your opening hours could unlock new profit potential The UK is turning into a nation of night owls
The Future of Retailing in the Philippines to 2018
 Comprehensive data overview of the market, with retail sales value and forecasts to 2018 Report Code: RT0185MR Report Price: US$4,950 (Single Copy) www.conlumino-winesandspirits.com Summary "The Future
ONE SIZE DOESN T FIT ALL RECONCILING OVERLAPPING TRANSPORT NETWORKS IN A CONSTRAINED URBAN ENVIRONMENT
 One Size Doesn t Fit All S Corbett, C Chenery Page 1 ONE SIZE DOESN T FIT ALL RECONCILING OVERLAPPING TRANSPORT NETWORKS IN A CONSTRAINED URBAN ENVIRONMENT Authors/Presenters: Sam Corbett, Principal Transport
COALITION OF MAJOR PROFESSIONAL & PARTICIPATION SPORTS SUBMISSION TO THE OFFICE OF THE HON KEVIN ANDREWS MP
 COALITION OF MAJOR PROFESSIONAL & PARTICIPATION SPORTS SUBMISSION TO THE OFFICE OF THE HON KEVIN ANDREWS MP THE COALITION S POLICY DISCUSSION PAPER ON GAMBLING REFORM 2 INTRODUCTION The Coalition of Major
Australian Churches Gambling Taskforce
 Australian Churches Gambling Taskforce SUBMISSION Senate Community Affairs Legislation Committee Inquiry into the Social Services and Other Legislation Amendment Bill 2013 9 December 2013 Contacts Rev
COUNTY SPORTS PARTNERSHIP (CSP) CORE SPECIFICATION INTERPRETATION GUIDE
 CORE SPECIFICATION INTERPRETATION GUIDE") COUNTY SPORTS PARTNERSHIP (CSP) CORE SPECIFICATION INTERPRETATION GUIDE Sport England has worked closely with a working group from the County Sports Partnership Network (CSPN) to develop a process and
COUNTY SPORTS PARTNERSHIP (CSP) CORE SPECIFICATION INTERPRETATION GUIDE Sport England has worked closely with a working group from the County Sports Partnership Network (CSPN) to develop a process and
Recommendations for the Risk Assessment of Buffer Stops and End Impact Walls
 Recommendations for the Risk Assessment of Buffer Stops and End Synopsis This document gives details of a recommended method which, if followed, would meet the requirements of section 11, Buffer Stops
Safety Standards Acknowledgement and Consent (SSAC) CAP 1395
 CAP 1395") Safety Standards Acknowledgement and Consent (SSAC) CAP 1395 Contents Published by the Civil Aviation Authority, 2015 Civil Aviation Authority, Aviation House, Gatwick Airport South, West Sussex, RH6 0YR.
Safety Standards Acknowledgement and Consent (SSAC) CAP 1395 Contents Published by the Civil Aviation Authority, 2015 Civil Aviation Authority, Aviation House, Gatwick Airport South, West Sussex, RH6 0YR.
Transport Poverty in Scotland. August 2016
 Transport Poverty in Scotland August 2016 About Sustrans Sustrans makes smarter travel choices possible, desirable and inevitable. We re a leading UK charity enabling people to travel by foot, bike or
Win or Lose The Latest in Limit Setting. Lia Nower, JD, PhD, Rutgers University Professor and Director, Center for Gambling Studies.
 Win or Lose The Latest in Limit Setting Lia Nower, JD, PhD, Rutgers University Professor and Director, Introduction This presentation will: Outline considerations and challenges in developing a centralized
Advice in relation to the DCMS review of gaming machines and social responsibility measures
 Advice in relation to the DCMS review of gaming machines and social responsibility measures 31 January 2017 1 I: Executive summary 1. This document is the advice of the Responsible Gambling Strategy Board
IGEM/TD/2 Edition 2 with amendments July 2015 Communication 1779 Assessing the risks from high pressure Natural Gas pipelines
 Communication 1779 Assessing the risks from high pressure Natural Gas pipelines Founded 1863 Royal Charter 1929 Patron: Her Majesty the Queen Communication 1779 Assessing the risks from high pressure Natural
Global Sports Betting Market
 Global Sports Betting Market 2016-2020 #834779 $2500 57 pages In Stock Report Description About Sports Betting Sports betting is a very popular type of gambling that involves predicting sports results
INDEPENDENT EVALUATION GROUP - IFC APPROACH PAPER
 82211 INDEPENDENT EVALUATION GROUP - IFC Evaluation of IFC s Private Enterprise Partnership Technical Assistance Program in the Former Soviet Union (PEP study). APPROACH PAPER A. Introduction 1. This evaluation
Active travel and economic performance: A What Works review of evidence from cycling and walking schemes
 1 Making the economic case for active travel Active travel and economic performance: A What Works review of evidence from cycling and walking schemes Active Travel Toolkit Slide Pack July 2017 Active travel
Safety Monitor Requirements. September 2012
 Introduction This document sets out Safety Monitors for the 2012/13 winter, pursuant to National Grid s obligations under the Uniform Network Code (UNC), Section Q. Safety Monitors were introduced in 2004
International Weightlifting Federation
 INTRODUCTION The purpose of this explanatory presentation is to provide IWF Member Federations (MFs) with a contextual and practical overview of the Weightlifting Qualification System to be implemented
STAFF PAPER. TRG Agenda ref 47. November 9, 2015
 TRG Agenda ref 47 STAFF PAPER Project Paper topic November 9, 2015 FASB/IASB Joint Transition Resource Group for Revenue Recognition Whether Fixed Odds Wagering Contracts are Included or Excluded from
Wildlife Ad Awareness & Attitudes Survey 2015
 Wildlife Ad Awareness & Attitudes Survey 2015 Contents Executive Summary 3 Key Findings: 2015 Survey 8 Comparison between 2014 and 2015 Findings 27 Methodology Appendix 41 2 Executive Summary and Key Observations
Rochester Area Bike Sharing Program Study
 roc bike share Rochester Area Bike Sharing Program Study Executive Summary ~ January 2015 JANUARY 2015 8484 Georgia Avenue, Suite 800 Silver Spring, MD 20910 3495 Winton Pl., Bldg E, Suite 110 Rochester,
Life Transitions and Travel Behaviour Study. Job changes and home moves disrupt established commuting patterns
 Life Transitions and Travel Behaviour Study Evidence Summary 2 Drivers of change to commuting mode Job changes and home moves disrupt established commuting patterns This leaflet summarises new analysis
Report Subject: Netball participation and social class
 Report Subject: Netball participation and social class briefing paper Background For many years, research has highlighted variations in the levels of sports participation across different socioeconomic
#19 MONITORING AND PREDICTING PEDESTRIAN BEHAVIOR USING TRAFFIC CAMERAS
 #19 MONITORING AND PREDICTING PEDESTRIAN BEHAVIOR USING TRAFFIC CAMERAS Final Research Report Luis E. Navarro-Serment, Ph.D. The Robotics Institute Carnegie Mellon University November 25, 2018. Disclaimer
TECHNICAL NOTE THROUGH KERBSIDE LANE UTILISATION AT SIGNALISED INTERSECTIONS
 TECHNICAL NOTE THROUGH KERBSIDE LANE UTILISATION AT SIGNALISED INTERSECTIONS Authors: Randhir Karma NDip: Eng (Civil) B. Tech Eng (Civil) M Eng (Hons) (Transportation) Auckland Traffic Service Group Manager
OHRIA Ontario Horse Racing Industry Association
 OHRIA Ontario Horse Racing Industry Association P.O. Box 456, Stn. B, Toronto, ON M9W 5L4 Tel: 416-679-0741 Fax: 416-679-9114 Email: ohria@ohria.com Submission to the Standing Committee of Finance and
1999 On-Board Sacramento Regional Transit District Survey
 SACOG-00-009 1999 On-Board Sacramento Regional Transit District Survey June 2000 Sacramento Area Council of Governments 1999 On-Board Sacramento Regional Transit District Survey June 2000 Table of Contents
Marine Strategy Framework Directive (MSFD) Common Implementation Strategy
 Common Implementation Strategy") Marine Strategy Framework Directive (MSFD) Common Implementation Strategy Good Environmental Status Working Group on Descriptor 3 24-25 April 2012, Paris Title: Statement on the Definition of MSFD Descriptor
Marine Strategy Framework Directive (MSFD) Common Implementation Strategy Good Environmental Status Working Group on Descriptor 3 24-25 April 2012, Paris Title: Statement on the Definition of MSFD Descriptor
Westminster s Joint Health and Wellbeing Strategy
 Westminster s Joint Health and Wellbeing Strategy 2013 2016 Response from Sustrans General comments From a strategic perspective, Sustrans welcomes the Health and Wellbeing Strategy s focus on encouraging
Evaluation of Living Streets' Walking Works Pathfinder Employers Scheme
 Loughborough University Institutional Repository Evaluation of Living Streets' Walking Works Pathfinder Employers Scheme This item was submitted to Loughborough University's Institutional Repository by
Gambling behaviour in England and Scotland
 Gambling behaviour in England and Scotland Findings from the Health Survey for England 2012 and Scottish Health Survey 2012 Authors: Heather Wardle, Carla Seabury, Hashim Ahmed, Colin Payne, Christos Byron,
Report to COUNCIL for decision
 17 152 Title: Section: Prepared by: Olympic Pool Business Case Community & Recreation Andrew White (Community & Recreation Manager) Meeting Date: 18 May 2017 Legal Financial Significance = Medium Report
ANNEX1 The investment required to achieve the Government s ambition to double cycling activity by 2025
 ANNEX1 The investment required to achieve the Government s ambition to double cycling activity by 2025 May 2016 About Sustrans Sustrans makes smarter travel choices possible, desirable and inevitable.
The development of Emergency Aquatic Animal Disease Response Arrangements
 Working together for animal health The development of Emergency Aquatic Animal Disease Response Arrangements 1. What are emergency response arrangements? Australia has a number of emergency response arrangements
CASE STUDY City of Monrovia: Leveraging emerging ridesharing services to expand mobility options
 Advancing Mobility Management CASE STUDY City of Monrovia: Leveraging emerging ridesharing services to expand mobility options Agency: Location: Service Area: Modes: Community Context: Key Contacts: City
UK Sport Consultation - Call for Evidence: Submission by the Sport and Recreation Alliance
 UK Sport Consultation - Call for Evidence: Submission by the Sport and Recreation Alliance The Sport and Recreation Alliance The Sport and Recreation Alliance believes that the power of sport and recreation
Dockless Cycle Share
 Dockless Cycle Share Code of Practice December 2017 135 Albert Street Private Bag 92300, Auckland 1142 aucklandcouncil.govt.nz Ph 09 301 0101 1. Introduction Auckland has seen a significant increase in
HORSERACE BETTING LEVY BOARD FIFTY-FIRST LEVY SCHEME 1st April 2012 to 31st March 2013 FORM OF DECLARATION ( FOD )
") HORSERACE BETTING LEVY BOARD FIFTY-FIRST LEVY SCHEME 1st April 2012 to 31st March 2013 FORM OF DECLARATION ( FOD ) 51 The Levy Scheme applies to all holders of Gambling Commission operating licences and
HORSERACE BETTING LEVY BOARD FIFTY-FIRST LEVY SCHEME 1st April 2012 to 31st March 2013 FORM OF DECLARATION ( FOD ) 51 The Levy Scheme applies to all holders of Gambling Commission operating licences and
THE ECONOMIC CONTRIBUTION FROM HORSES
 THE ECONOMIC CONTRIBUTION FROM HORSES ECONOMIC CONTRIBUTION FROM HORSES HIGHLIGHTS The horse industry contributes more than $19 billion annually to the Canadian economy On-farm activities with horses generate
GD 0043/18 ACTIVE TRAVEL STRATEGY
 GD 0043/18 ACTIVE TRAVEL STRATEGY 2018-2021 May 2018 Minister s Introduction There is strong evidence that regular physical activity reduces the risk of a range of health conditions. The best way to increase
Golfers in Colorado: The Role of Golf in Recreational and Tourism Lifestyles and Expenditures
 Golfers in Colorado: The Role of Golf in Recreational and Tourism Lifestyles and Expenditures by Josh Wilson, Phil Watson, Dawn Thilmany and Steve Davies Graduate Research Assistants, Associate Professor
Foreword 3. Mission & Objectives 4. Financial Overview 8. Money In 10. Money Out 11. Delivering Services 12. Services Explained 13
 2016 BUDGET GUIDE Foreword 3 Mission & Objectives 4 Financial Overview 8 Money In 10 Money Out 11 Delivering Services 12 Services Explained 13 Cost to Participants 14 FOREWORD NICK RUST CHIEF EXECUTIVE
School Games EXECUTIVE SUMMARY YEAR 1 August 2012
 School Games EXECUTIVE SUMMARY YEAR 1 August 2012 1 EXECUTIVE SUMMARY Background The School Games is a competitive school sport programme designed to motivate and inspire millions of young people across
Irish Bookmakers Association
 Irish Bookmakers Association Pre Budget Submission October, 2011 2 Contents Overview and Key Proposals... 3 Level the Playing Field... 4 Modernise the Sector... 5 Economic Impact of Modernisation and Liberalisation...
This document is meant purely as a documentation tool and the institutions do not assume any liability for its contents
 1999L0092 EN 27.06.2007 001.001 1 This document is meant purely as a documentation tool and the institutions do not assume any liability for its contents B DIRECTIVE 1999/92/EC OF THE EUROPEAN PARLIAMENT
BCLC Employee Survey Final Report. August 31, 2016
 BCLC Employee Survey Final Report August 31, 2016 BACKGROUND AND METHODOLOGY Survey Background Canadian research indicates that gaming workers exhibit rates of problem gambling that are over three times
World Wrestling Plan. Our strategy for a stronger future. Round 1:
 World Wrestling Plan Our strategy for a stronger future Round 1: 2013-2016 Table of Contents Why a World Wrestling Plan? Page 04 How does the Plan work? Page 07 Phase 1: The International Level Page 08
PDMS Report 2012, NZG Consultation Process National Membership Statistics, Casual Golf Membership Research.
 . STRATEGIC PLAN Throughout the various review processes and studies carried out over the past five years, it has become clear there are a number of core issues facing the golf industry in New Zealand.
Paddy Power Betfair plc Q Trading Update
 Paddy Power Betfair plc 2018 Trading Update 2 November 2018 Paddy Power Betfair (the Group ) announces a trading update for the three months ended 30 September 2018. Unaudited Revenue Underlying EBITDA
Speed Limit Policy Isle of Wight Council
 APPENDIX B Speed Limit Policy Isle of Wight Council 2009 Contents Section 1 Introduction 1.1 Links with the Local Transport Plan Section 2 Speed Limits on Urban Roads and Residential Areas 2.1 20mph Limits
Brookfield Asset Management O AK T R E E ACQUISITION M A R C H 1 3,
 Brookfield Asset Management O AK T R E E ACQUISITION M A R C H 1 3, 2 0 19 Transaction Summary On March 13, 2019, Brookfield Asset Management ( BAM ) and Oaktree Capital Group ( OAK ) announced an agreement
DSBG Findings Helping Fishermen and Policy Makers Explore the Economics of Deep Set Buoy Gear in the West Coast Swordfish Fishery
 June 2016 DSBG Findings Helping Fishermen and Policy Makers Explore the Economics of Deep Set Buoy Gear in the West Coast Swordfish Fishery Photos courtesy of The Pew Charitable Trusts Developed by Cap
Section 2 Strategic Alignment. Contents
 Section 2 Strategic Alignment Contents 2 Strategic Alignment... 2 2.1 General... 2 2.2 SmartGrowth Strategy and Implementation Plan... 2 2.3 Walking and Cycling Strategy... 3 2.4 Built Environment Strategy...
Safety Monitor Requirements Revised. February 2018
 This report is an update of the Safety Monitor Report published in September 2017. We are updating the report due to changes with Rough Storage, and Non Storage Supply (NSS) flows observed so far this
Response to SNH s Scientific Advisory Committee (SAC) Review of the SNH Licence for Strathbraan: removal of ravens
 Review of the SNH Licence for Strathbraan: removal of ravens") Response to SNH s Scientific Advisory Committee (SAC) Review of the SNH Licence for Strathbraan: removal of ravens Summary 1. The SAC review of the Strathbraan Community Collaboration for Waders (SCCW)
Response to SNH s Scientific Advisory Committee (SAC) Review of the SNH Licence for Strathbraan: removal of ravens Summary 1. The SAC review of the Strathbraan Community Collaboration for Waders (SCCW)
DETERMINATION OF SAFETY REQUIREMENTS FOR SAFETY- RELATED PROTECTION AND CONTROL SYSTEMS - IEC 61508
 DETERMINATION OF SAFETY REQUIREMENTS FOR SAFETY- RELATED PROTECTION AND CONTROL SYSTEMS - IEC 61508 Simon J Brown Technology Division, Health & Safety Executive, Bootle, Merseyside L20 3QZ, UK Crown Copyright
WELLINGTON S FUTURE FOOTBALL HUB
 WELLINGTON S FUTURE FOOTBALL HUB APPLICATION BY AND SUPPORTED BY ARTIFICIAL FOOTBALL TURF AT HUTT CITY S MEMORIAL PARK APPLICATION FOR FUNDING TO PUB CHARITY - JULY 2011 Early artist s impression of turf
Trial 3: Interactions Between Autonomous Vehicles and Pedestrians and Cyclists
 Trial 3: Interactions Between Autonomous Vehicles and Pedestrians and Cyclists What is VENTURER? VENTURER is a 5m research and development project funded by government and industry and delivered by Innovate
Interim Management Statement and Details of change to licensing arrangements for the Betting Exchange in the UK
 8 th March 2011 Betfair Group plc ( Betfair ) Interim Management Statement and Details of change to licensing arrangements for the Betting Exchange in the UK Betfair (LSE:BET), the world s biggest betting
Why walk? Introducing Heart Foundation Walking! What is Heart Foundation Walking? Your role. Host Organisation
 An Introduction Why walk? It s an inexpensive form of physical activity It s easy doesn t require special skills or equipment It has psychological and community benefits improves mental health and social
Transport Poverty in Scotland. August 2016
 Transport Poverty in Scotland August 2016 About Sustrans Sustrans is the charity making it easier for people to walk and cycle. We connect people and places, create liveable neighbourhoods, transform the