The Economic Contribution and Financing of Racecourses in Ireland 2017
|
|
|
- Jayson Newman
- 6 years ago
- Views:
Transcription
1
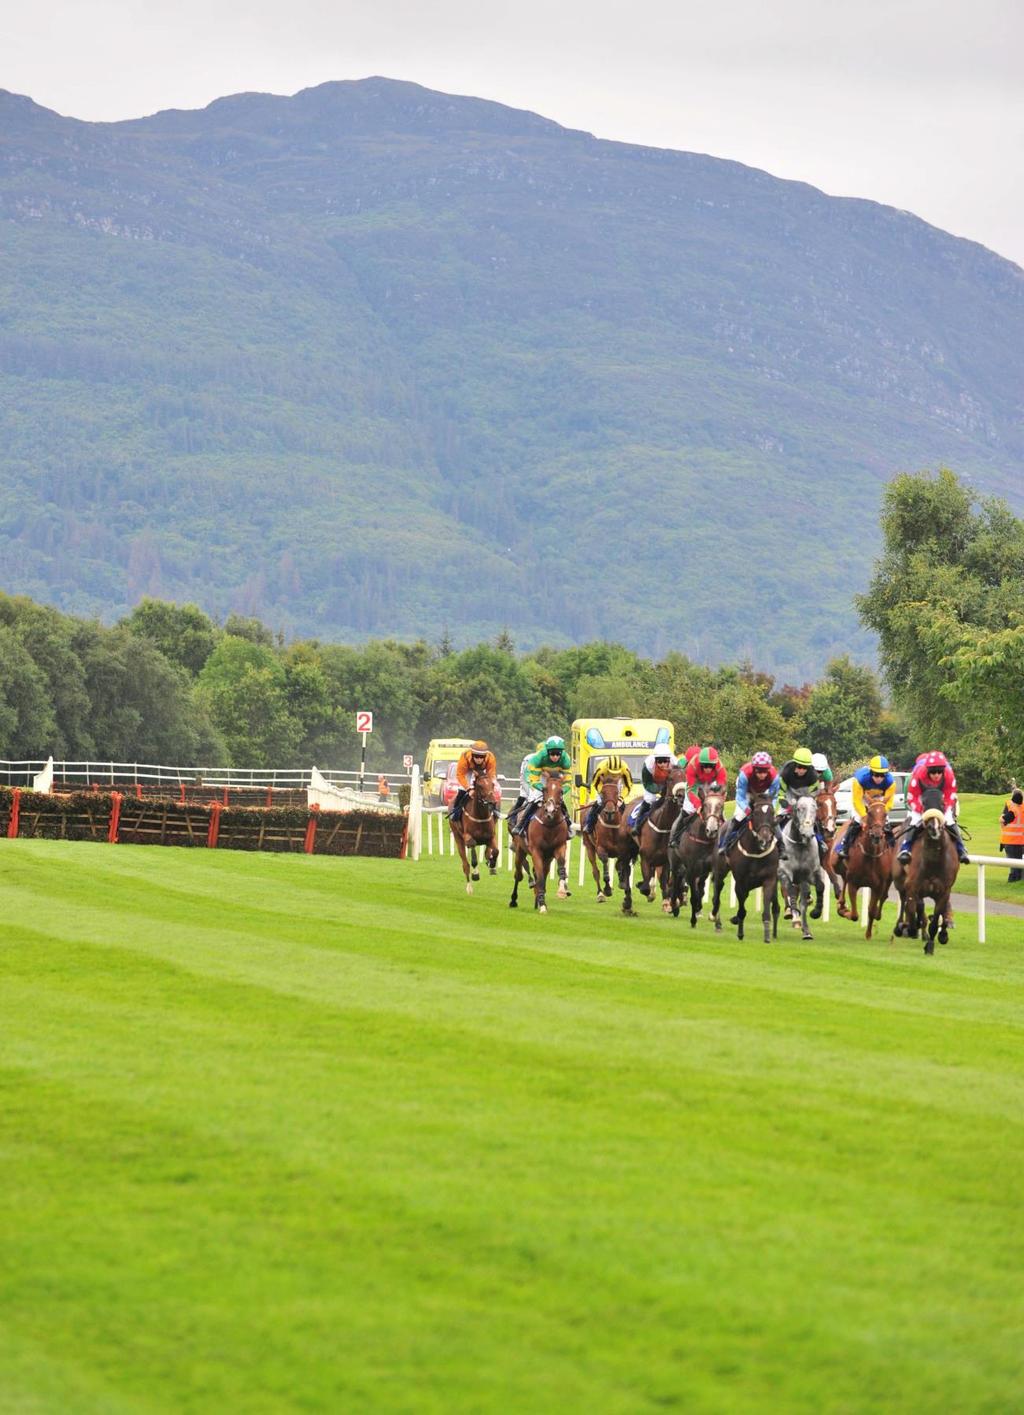
2 Cover Page: Killarney Racecourse August 2017, Healy Racing Photographers
3 CONTENTS PAGE 1. EXECUTIVE SUMMARY TERMS OF REFERENCE AND METHODOLOGY BACKGROUND METHODOLOGY SCOPE OF THE REVIEW STRUCTURE OF THE REVIEW ECONOMIC CONTRIBUTION OF RACECOURSES OVERVIEW SERVICES PROVIDED AT RACECOURSES ECONOMIC INPUTS AND OUTPUTS RELATING TO RACECOURSES IMPACT ON LOCAL ECONOMIES: TOURISM EMPLOYMENT BY RACECOURSES EMPLOYMENT IN THE OVERALL HORSERACING INDUSTRY HORSERACING INDUSTRY EMPLOYMENT BY OCCUPATIONAL GROUP IMPACT ON HORSE BREEDING SECTOR PRIZE MONEY AND SPONSORSHIP QUALITATIVE DATA FROM QUESTIONNAIRES CURRENT AND FUTURE ISSUES QUALITATIVE RESPONSES FINANCIAL REVIEW OF RACECOURSES OVERVIEW OF RACECOURSE FINANCING ATTENDANCES PROFITABILITY OF RACECOURSES PUBLIC INFORMATION FILED WITH THE COMPANIES REGISTRATION OFFICE RATIO ANALYSIS CAPITAL EXPENDITURE - PAST AND FUTURE CASH FLOW IMPLICATIONS AND FUNDING FUTURE CAPITAL EXPENDITURE TAXES AND CHARGES LAND AND BUILDINGS THE COST OF STAGING FIXTURES APPENDIX 1 LIST OF RACECOURSES...54 Petrus Consulting 1
4 1. EXECUTIVE SUMMARY The core Breeding and Racing industry is estimated to generate 1.05 billion gross expenditure, which results in economic input of 914m into the Irish economy and core employment is estimated at 21, Racecourses are the critical element for horseracing to take place without the well-developed network of 26 racecourses located in nineteen different counties on the island, which are capable of hosting both National Hunt and flat race meetings, horseracing in Ireland simply would not happen and the related economic activities such as training, horse breeding and betting would either not be possible or would be seriously curtailed. In this sense, racecourses may be seen as the underlying network infrastructure over which the spectacle of horseracing, with all its ancillary add-on activities, is provided to the public. Key Indicators. In recent years, previous declines in several key indicators for the overall horseracing industry have been reversed and improvements have taken place in a number of areas. However, long term issues remain total attendances have increased in recent years but are still well below the level seen at the peak and average attendance is weak. There has been a small increase in the number of fixtures and races held and industry funding has increased along with prize money. More betting activity is subject to tax but on course bookmakers are under severe pressure. The number of horse owners and horses in training have each shown steep declines which is a cause for concern for the future of horseracing. Economic Contribution. Racecourses are only one part of the overall horseracing and breeding industry but, if it is accepted that racecourses are an essential precursor to all the related activities, then the racecourse activity is critically important and has a very high multiplier effect for all the other related activities in the wider horseracing industry. The 2017 Deloitte report on the Economic Impact of Irish Breeding and Racing estimated that the core breeding and racing industry generated 1.05 billion gross expenditure and, when secondary effects are included, that total economy wide expenditure amounted to 1.84 billion. Tourism. Recent information on the relationship between horseracing and tourism is lacking. However, from earlier work in this area, it is clear that racecourses play an important part in Ireland s tourism industry, with a number of racing festivals coinciding with peak holiday times within the country. As a result, racing festivals held at Irish racecourses have an important role to play in the development of tourism within the country by attracting attendance at race meetings from domestic sources and from overseas. A research study commissioned for HRI in estimated the annual expenditure in the economy by overseas visitors who attend race meetings in Ireland came to just over 67 million. This study estimated that the number of overseas visitors attending race meetings in the period June 2008 to May 2009 came to 68,405 who, between them spent an average of 980 per visit, yielding a total spend over the period of 67,036,900.The same study found that overseas visitors made up 9% of all attendees at race meetings in Ireland. Employment. - Wages and salaries for full time, part time and casual racing staff amount to just over 12 million annually. It is estimated that there are approximately 407 full time equivalent (FTE) jobs supported by racecourses directly and employment has increased slightly over the 4 year period The figure of 407 FTEs is made up of 225 full time staff, 60 part time FTEs and 120 casual FTEs. Average cost per full time equivalent employee has increased by 18% in the period. On-course and off-course activities in areas such as training, breeding, catering, betting, regulation and transport, all have high employment content and are supported or enabled by the existence of racecourses. Core and directly attributable employment is estimated at 21,200 in 2016 in horseracing, breeding, betting and directly attributable activities. Each job on the racecourse supports over 50 jobs off the racecourse and each racecourse supports over 800 jobs across the core breeding and racing sectors. 1 Economic Impact of Irish Breeding and Racing 2017, Deloitte for Horse Racing Ireland 2 Overseas Visitors Quantitative Research 2008/09 Prepared August 2009 by Behaviour & Attitudes for Horse Racing Ireland. Petrus Consulting 2
5 Qualitative Response Assessment. On a qualitative basis racecourses are somewhat more positive about the current and future position of racecourses. While the general economic downturn appears to have been mostly overcome, it has been replaced by concerns about the effect of Brexit on the industry and on racecourses. Racecourses are now less concerned than previously about their financial position and their ability to support future investment. However, racecourses have concerns about a number of critical issues relating to Brexit, attendance levels, the continuation of media rights income and managing operating costs. Summary Financial Assessment. The overall assessment of the financial position of racecourses is that the loss making position seen in earlier years has now been reversed and racecourses are making a reasonable level of profits and generating positive cash flows. Almost all revenue sources have increased and this, combined with the continued support from media rights income means that the racecourse sector is in a better financial position than previously. However, the returns are not uniform across all racecourses. The financial situation of individual racecourses can differ markedly from the overall average position. We have identified seven racecourses that are either unprofitable, marginally profitable or whose profitability is highly exposed. Debt levels have been reduced but the aggregate working capital position of racecourses is too low and needs attention. The level of return on assets is still low and lower still when calculated on a replacement cost basis. Total revenue for all racecourses is estimated to have been over 56 million in Revenues from all sources - other than non-racing income - have increased over the period 2013 to 2016 and show a continuation of the recovery from the sharp declines in previous years that arose as a consequence of the economic downturn and its impact on key revenue elements such as Attendance, Betting, Advertising and Sponsorship etc. Media Rights income rose by just over 3.3 million in the period. Although Media Rights Income is now somewhat smaller as a proportion of total revenue it is still by far the largest income source for racecourses and, if non-racing income is excluded, represents half of all racing related income. Media rights income remains the single most important revenue source for racecourses and a critical dependency for the industry overall. Media Rights income is both the biggest support to Irish racecourses and, at the same time, the biggest risk to racecourses and to the industry more generally. The dependency ratio, defined as Media Rights as a percentage of Total Revenues, has reduced slightly overall in recent years. However, the dependency ratio varies considerably by Grade of racecourse with Premium Racecourses depending on Media Rights for 30% of their total revenues, Grade 1 racecourses depending on Media Rights for 55% of their total revenues while Grade 2 racecourses depend on Media Rights for 67% of total revenues. Any material reduction in media rights income would compromise the ability of racecourses to maintain and invest in the racetrack asset, threaten the ability of many racetracks to continue as going concerns and, ultimately, endanger the future of the overall horseracing industry. Other Revenue Streams. There has been an increase in the proportion of total revenues contributed by racegoers from 31% in 2012 to 34% or approximately one third of total revenues in Advertising and Sponsorship has remained relatively stable as a proportion of total revenue at 4%. Non-racing income represents about 6% of total revenues. Profitability for all racecourses combined, expressed as a percentage of turnover, is estimated at 10.6% in 2016 but this is heavily dependent on media rights and non-racing income levels. Results vary between individual racecourses and course types with Grade II type courses earning 13% profit on turnover and Grade I type courses earning 9% with Premier racecourses earning 11%. The level of profitability of racecourses has to be considered in terms of their core purpose which is to generate funds in order to provide venues for fixtures for the benefit of all horseracing stakeholders including owners, trainers, jockeys, bookies, breeders and the racegoing public. The on-going capital investment required is provided by means of capital grants, by borrowings and by the level of cash reserves that racecourses can provide directly from profits generated and Petrus Consulting 3
6 retained for investment purposes. Without media rights income, racecourses would have experienced aggregate losses of over 18 million. This shows the very high level of dependency of the racecourses on this revenue stream. Operating Costs. Operating costs for racecourses are high at 75% of total revenues. This figure is similar across Premier, Grade 1 and Grade 2 racecourses. The figure has increased when compared to the level seen in the previous report where operating costs were estimated to amount to 64% of revenues. The data do not fully allow an analysis of all the constituent elements of operating costs or the changes in the period but the increase identified in average wages and salaries would explain the increase. This cost needs to be carefully controlled in the future. Given the sensitivity of all the elements of the profitability mix a small increase in costs over time can erode the limited level of profitability of individual racecourses and the sector overall. Debt and Liquidity. During the period 2012 to 2015 racecourses are estimated to have reduced their total liabilities by approximately 20 million. Interest costs have declined consistently since 2008 reflecting racecourses paying off loans, reducing interest costs and a reduction in capital investment overall. The working capital ratio is a measure of the working capital position measuring the ability of racecourses to pay their bills as they become due. Levels above 2 are generally considered adequate and this ratio, at 1.20, is in the risk area. The reason for the adverse movement in the ratio is that current liabilities have risen and, within that, the dependence on short term loans has increased. Return on Assets and Return on Capital Employed Ratios. In 2015, the return on assets and capital employed ratios are positive but at a low level namely 3.5% and 3% respectively. These levels of return are higher than previously achieved but are insufficient to ensure long term sustainability and support future capital investment. When computed on the basis of replacement costs the return ratio falls below 2%. Capital Intensity. Operating a racecourse is a capital intensive business that earns low returns which, if they are made, are reinvested for the future. Each 1 in revenues is estimated to require 4 in capital investment. Over the past 15 years racecourses have invested 212 million and plan to invest 296 million over the coming 15 years. The benefits provided by racecourses do not accrue to the racecourses themselves but, rather, to the other horseracing participants such as owners, trainers, jockeys, bookies, breeders, support and ancillary service providers. Benefits also accrue to the wider economy in the form of employment and taxes/charges paid. Racecourses are distinguished by the fact that their objective is not to earn a return for shareholders but to maintain and develop their facilities in order to provide safe and enjoyable venues for holding race meetings. They do not pay dividends and if profits are earned such profits are re-invested in the racetrack and associated facilities for the benefit of all stakeholders. Racecourse Asset. The most important function of racecourses is to develop and maintain the racetracks themselves, which are located on land holdings encompassing 3,500 acres owned and operated by the 26 racecourses. Racecourse facilities have to be developed and maintained throughout the year even though racing may only take place on a small number of days during the year. Racecourses in total are used for about 4% of the time available but must be maintained for the remaining 96% of the time. Required future capital investment is estimated by racecourses to be 296 million in order to upgrade facilities across all racecourses over the next 15 years. This is a considerable increase in the level of future investment seen in the last report and may reflect underinvestment in more recent years along with pressure to upgrade facilities and rising construction costs. It is also the case that there will be investments listed that do not materialise because they cannot be funded as a result of the situation of individual racecourses. Racecourses have estimated that grant funding of approximately 97 million will be provided and the balance of 200 million will be provided by racecourses either directly or by borrowings undertaken for the purpose. Whether through borrowings or by direct contribution by the racecourses, the cost of the racecourse Petrus Consulting 4
7 investment in terms of interest and capital payments and to provide racecourses own direct financial contribution comes from profits generated and retained for reinvestment. The investment required net of anticipated grants at 33% cannot be funded by all racecourses on the basis of current profitability and cash flows generated. Racecourses, in aggregate, need to generate free net cash flow of c million annually to repay their loans for new investment, repay existing borrowings, and allow them to contribute their portion of their own funding. This figure compares to the approximate 12.5 million cash flow that racecourses are estimated to have generated in 2016 meaning that there is a shortfall in the ability of the racecourses to finance the required investment. Either the investment has to be reduced, grant aid increased, profitability and free cash flow increased or a combination of all of these elements. Implicit assumptions include that there are no cost increases or additional operating costs incurred and that revenue sources and in particular media rights income remain stable into the future. This is also an aggregate calculation taking all racecourses together and the Premier racecourses having the largest investment plans will find it more difficult than the Grade 1 and Grade 2 racecourses that have more achievable investment plans. In order to fund the required investment the following are required: Investment requirements to be prioritised with associated business cases Improved profitability and free cash flow to be generated by racecourses from all sources Increased revenue and / or decreased costs for all racecourses Capital grant level to be increased Racecourses have only recently become moderately profitable but the level of profitability and cash flow generated is still inadequate to fund the level of capital investment identified by racecourses as being required over the next 15 years. The racecourse asset requires considerable investment over the coming years which can only be provided from grant aid, borrowings and cash reserves. Racecourses need to increase the current level of profitability or else the necessary capital investment cannot be made. If racecourses cannot invest to maintain and develop the racecourse asset then horseracing itself and all the related stakeholders will suffer. Taxes and Charges. Racecourses are estimated to pay over 5 million annually in taxes and charges equivalent to over 37% of operating profit. Asset Replacement Cost. The overall replacement cost for the land and buildings for all racecourses is estimated to be over 325 million. Cost per Attendee. The average cost per attendee taken across all racecourses is 37 compared to the average admission price of approximately 15 showing that racegoer attendees are paying a small proportion of the cost of holding the fixture. The balance is made up partly by income from bookmakers, non-racing income and advertising. However, the largest contribution is made from media rights income that contributes over 18 per racegoer without which racecourses could not survive. Cost per Fixture. The average cost to hold a fixture across all racecourses is almost 140k. This cost varies widely according to the specific cost structure of each racecourse and the nature of the meeting from a low of c. 60,000 to a high of c. 340,000. The average per fixture cost is 260,000, 114,000 and 90,000 for Premier, Grade 1 and Grade 2 racecourses respectively. Petrus Consulting 5
8 2. TERMS OF REFERENCE AND METHODOLOGY 2.1. BACKGROUND Petrus Consulting was engaged by the Association of Irish Racecourses ( the Association ) to carry out a review of the financing and economic contribution of Irish racecourses. The review is a follow-up to a similar review carried out in This current review can be read as a standalone report without reference to the previous review. For this reason, where relevant, the review repeats some material provided in the earlier review. Every racecourse in Ireland is a member of the Association and a list of racecourses is included as Appendix 1. The summarised objectives of the Association include furthering the interests of horseracing generally in Ireland and particularly the interests of racecourse owners and executives and advising and assisting members individually and, or, collectively on all matters pertaining to their separate and collective interests. The earlier review highlighted the importance of racecourses to the overall ecosystem of horseracing across the island. It identified the highly capital intensive nature of the business and the low level of return on investment, the critical importance of media rights income and the need for continuing and significant capital investment in the racecourse asset in future years in order to maintain and improve facilities for the benefit of all stakeholders. The review sought to highlight the economic contribution of racecourses and their financial structure in order to raise understanding among other industry participants about the high cost structure of racecourses, their capital investment requirements and their low level of profitability. The terms of reference for this current review are the same as before namely to: Update the previous review by examining the contribution which the racecourses make to the overall horseracing industry (including to owners, trainers, breeders, on and off course betting, attendees at meetings, sponsors and all the other associated direct and indirect social and economic benefits.) Review and examine the overall finances of the racecourses with particular attention to the following: income streams from all sources including attendances, sponsorship, media rights, grants the costs associated with operating these racecourses the level of capital expenditure which has taken place over the last 15 years future aggregate investment requirements borrowings, loans and cash position of the racecourses METHODOLOGY The methodology for the review comprised the following: A questionnaire was circulated to all racecourses requesting quantitative information on, for example, their income and expenditure levels and the trends therein, past and future capital expenditure and employment levels. Respondents were also asked to provide qualitative information on their views about the current and future issues facing their racecourses. The Association of Irish Racecourses assisted in circulating the questionnaire and used its influence to obtain responses. We wish to thank all the racecourses for responding to the questionnaire and for providing us with their detailed financial information and views on racecourses. A desk analysis of previous reports and reviews on the horseracing and related industries was carried out. In some cases, aspects of these reports which have a direct bearing on the racecourse element of the overall industry were updated for use in this report based on more recently available data. Petrus Consulting 6
9 Financial information for racecourses was obtained from the returned questionnaires and also from the annual financial statements which several racecourses also provided. These annual financial statements were supplemented by accessing information from the Companies Registration Office ( CRO ) which in many cases was available in greater detail. However, some racecourses are exempt from filing full financial statements or became exempt during the period examined. Similarly, most racecourses have filed financial statements for years up to and including Some, but not all racecourses, have filed financial statements for This means that care must be taken in examining trend information based on CRO information throughout this report because the base of racecourses in succeeding years may not be comparable. Where meaningful or where the confidentiality of data provided by individual racecourses would not be compromised we analysed the data provided by racecourses according to the grade of racecourse in the categories of Premier, Grade I and Grade II to highlight differences in financial performance according to the size of racecourse. See Appendix 1 for the categorisations of racecourse used. A set of ratios related to profitability and return on investment was applied to the financial data for each racecourse, the separate grades of racecourse and the racecourses in aggregate SCOPE OF THE REVIEW The time period covered by the review is based on the most recently available information. The questionnaires provided information in all cases based on income and 2016 expenditure levels. CRO financial statements were obtained from 2006 up to the most recently available time period which in most cases was 2015 with, in some cases, information for The racecourses included in the review comprise all the members of the Association of Irish Racecourses. There are 26 such racecourses as set out in Appendix 1. The economic review deals mainly with issues related to racecourses directly and also take into consideration several of the closely related horseracing activities such as betting. The review does not go beyond the horseracing industry into the wider economy although it is recognised that the horseracing industry is a key contributor to the overall economy in terms of breeding, betting and, in addition, provides social and amenity benefits not captured in economic terms as well as being an employer in its own right. The scope of this review therefore concerns racecourses within the context of the overall horse racing industry. However, in certain areas we have considered the wider contribution of racecourses such as, for example, the role that racecourses play in tourism or the linkages between horseracing and the bloodstock, media and gambling industries. Our main focus is on the horse racing industry and we only consider wider social and economic impacts to the extent necessary to provide a clear view of the overall impact of racecourses with the pool of related and supporting activities STRUCTURE OF THE REVIEW This report is structured as follows: Section 1 Section 2 Section 3 Section 4 Executive Summary contains a summary of the main findings from the review. Background, terms of reference and methodology for the report. An assessment of the economic contribution of racecourses. An assessment of the financial position of racecourses and their future outlook. Petrus Consulting 7

10 3. ECONOMIC CONTRIBUTION OF RACECOURSES 3.1. OVERVIEW Since the previous review in 2013 there has been a general improvement in the economic environment and the effects of this can be seen in several of the key indicators for the horseracing sector and for the industry overall. A key measure of the resilience of Irish racecourses is that all 26 survived the economic crisis enabled in no small part by the availability of media rights income and the effort and dedication of racecourse owners, management and staff. Irish racecourses make an important economic contribution to the horseracing sector within the country. At a basic level, racecourses are the critical element for horseracing to take place without the well-developed network of 26 racecourses located in nineteen different counties on the island, which are capable of hosting both National Hunt and flat race meetings, horseracing in Ireland simply would not happen and the related economic activities such as training, horse breeding, and betting would either not be possible or would be seriously curtailed. In this sense, racecourses may be seen as the underlying network infrastructure over which the spectacle of horseracing, with all its ancillary add-on activities, is provided to the public. Figure 1: Location of Racecourses in Ireland Source: Horse Racing Ireland Factbook Petrus Consulting 8
11 It would be easy to extend this analogy to imagine that the network of racecourses which exists bears strong similarities to other types of networks, over which services are provided to end-users. It is quickly apparent, however, that any such analogy is quite limited, given that the economic activities that occur over the racecourse network involve very different kinds of relationships between the various parties involved compared to the provision of services over other network industries, such as electricity, gas, telecommunications, railways and so forth. These other network industries were for many years characterised by monopoly provision of services to end-users, with a vertically integrated monopolist both owning the infrastructure and providing all the services along the value chain. In those network industries where competition has been allowed to take place, the ex-monopolist incumbents have typically retained a very strong presence within their respective sectors, with intervention from sectoral regulators required to ensure that other economic operators are granted access to the incumbents networks in order to provide their own services to endusers. In a number of these sectors such as the retail supply of electricity and gas the ex-monopolists have retained high market shares while in others for example, railway services competition has yet to be introduced at all. In this case, the integrated monopoly that owns and operates the network infrastructure also controls and operates every facet of production in relation to the service provided. In contrast, racecourses have never acted and would never have been in any position to act - as monopolists in the provision of horseracing services on their network of racecourses. Instead, racecourses 3 have actively co-operated with other parties - such as regulators, owners, trainers, oncourse bookmakers, facilities providers, sponsors, media companies, the racegoing public etc. - to create between them an attractive year-round programme of race meetings across the country. In this regard, while the existence of racecourses themselves is a necessary condition for horseracing to take place, it is not in itself a sufficient condition. For horseracing to happen, the active input of all the other key players listed above is required as well. It is also instructive to view the provision of horseracing services and, in particular, the active collaboration in doing so by a number of disparate and different economic agents as a type of economic ecosystem, whereby the different parties bring very different resources, inputs and skills to horseracing overall which, when combined together, enables the provision of an attractive and important sporting spectacle. As well as providing their own inputs to the process, these different entities have their own individual expectations about the kind of outputs they expect to derive from their involvement in horseracing. The kinds of inputs provided and outputs derived by the various parties involved in horseracing tend to be well established amongst the parties involved. Sudden changes in commercial arrangements governing any of these inputs or outputs say, for example, a rapid decrease in the amount of sponsorship money being made available or a significant rise in entrance ticket charges to the racegoing public would clearly have the capability of upsetting the quite delicate balance that currently exists 3 There are many racecourse owners and the racecourse network is not owned by a single entity: four of the 26 racecourses are owned by HRI but the remainder are owned and operated by local committees and/or companies. In contrast, in other network industries the entire network infrastructure tends to be owned by a single entity (aside from telecommunications, where a number of competing networks exist). Petrus Consulting 9
12 between the various economic agents operating in the horseracing sector. Changes in what entities pay for services provided to them by others or in payments for services they themselves provide therefore require careful consideration in terms of the impact such shifts might have for the financial and economic wellbeing of the sector as a whole. We review a number of key trends within the industry before setting out a description of the services that are typically provided at Irish racecourses. We then focus on the inputs to horseracing made by Irish racecourses and the outputs the courses deliver from their involvement on the industry. We examine indirect as well as direct economic effects and focus on the positive spin-off effects generated by horseracing, focusing in particular on the key areas of tourism and employment. Finally, we set out a forward-looking assessment by the racecourse operators themselves of the prospects for Irish racecourses derived from the qualitative responses to the questionnaire. Petrus Consulting 10
13 Table 1: Irish Horse Racing and Betting Industries in Numbers ( ) The Economic Contribution and Financing of Racecourses in Ireland 2017 Key Indicators for Horseracing Betting and Exchequer Funding Total Betting m. 3,667 3,926 3,903 3,281 3,257 2,858 2,843 2,675 2,755 3,262 5,245 0% 3, Total On Course Betting m % Total Off-Course Betting m. 3,405 3,644 3,666 3,099 3,093 2, ,542 2,616 3,106 5,075 0% 3, Total Government Funding of HRI m % Prize Money Total Irish Horse Racing Prize Money m % HRI Funding of Prize Money m % Commercial and Other Prize Money m % Owners' Funding of Prize Money m % Attendance, Fixtures, Races and Entries Total Racecourse Attendance 000's 1,447 1,461 1,392 1,237 1,198 1,238 1,194 1,238 1,285 1,276 1,317-10% 1, Average Attendance 4,536 4,387 4,070 3,586 3,587 3,685 3,413 3, ,636 3,700-18% 3, No of Fixtures % No of Races 2,268 2,397 2,454 2,444 2,381 2,397 2,516 2,530 2,489 2,522 2,577 0% 2, No of Race Entries 000's % Racehorse Numbers and Sales No. of Stallions Mares and Foals in 000's % Ireland of which foals born 000's % No. of Irish Foaled Horses Exported n/a n/a 5,016 5,315 5,181 4,987 4,837 4,844 5,028 5,115 4,992-6% 4, Agg. Value of Irish Horses sold in Irish m % Sales No. of Horses in Training 6,585 6,742 6,817 6,483 5,769 5,030 4,846 4,556 4,175 4,026 4,154-39% 4, No. of Racehorse Owners 5,207 5,588 5,641 5,107 4,667 4,278 3,457 3,289 3,108 3,011 3,038-46% 3, Source: HRI Factbooks, Petrus Analysis Petrus Consulting 11 Change from Peak Avg. Level Avg. Change
14 Table 1 sets out a number of key indicators for the overall horseracing and betting industries in Ireland from 2006 to 2016 inclusive. Since the previous review, several indicators have improved substantially but many still remain below the peaks achieved in earlier years. Total betting and government funding of HRI have increased significantly although on-course betting still remains well below the levels seen in earlier years albeit with some increase in more recent years. This is as a result of a technology shift whereby an increasing number of racegoers can place bets using smartphones while on the course. The substantial increase in revenues recorded from off-course betting from 2015 onwards is a result of enacting the Betting (Amendment) Act, 2015 that brought online betting into the tax net. KEY TRENDS RELATING TO RACECOURSES The number of racing fixtures (Figure 2) and races held (Figure 3) have increased since Despite a decline in both races and fixtures in 2009, 2010 and 2014, the number of each in 2016 surpassed the former peak values in 2012 and 2013, respectively. Figure 2: Number of racing fixtures, Source: HRI Factbooks, Petrus Analysis Figure 3: Number of races held, Source: HRI Factbooks, Petrus Analysis Petrus Consulting 12
15 Despite increasing numbers of both races and fixtures, the attendance at race meetings has declined from its peak of 1.46 million in the year 2007 (Figure 4). By 2012 there had been an 18% decrease in attendance to 1.19 million, with the largest fall in attendance observed between 2008 and 2009, during a period of sharp economic contraction. Since 2012, attendance at race meetings has increased moderately, from 1.19 million to million, an annual average increase of approximately 30,000 racegoers. Figure 4: Attendances at race meetings, Source: HRI Factbooks, Petrus Analysis However, as seen above, the number of racing fixtures has increased since Given the decline in overall attendance it is unsurprising that the average number of racegoers attending each race fixture has declined by a greater amount and is still considerably below the peak level achieved in 2006 Figure 5 below. In 2016, average attendance was 3,700 compared to an average attendance in 2006 of just over 4,500. There has been an 18% decline in average attendance over the period. The trend line, (shown in red) illustrates the decline and the more recent modest uplift in average attendance. As will be seen later in this report the fixed costs associated with holding a fixture are considerable and declining attendances are a serious concern for the future financial wellbeing of racecourses. Petrus Consulting 13
16 Figure 5: Average Attendances at Race Meetings, Source: HRI Factbooks, Petrus Analysis A sharp decline in government funding of HRI is observed between the years 2008 and 2010, with a 22% reduction from 61 million to 47.4 million over the two years (Figure 6). From 2010 to 2014 there was a steady decline in HRI government funding, from 47.4 million to 43.3 million, a 9% decrease. There was a sharp increase in government funding in the years 2015 and 2016; from 47.4 million to 54.4 million in 2015 and 59.2 million in 2016, a 37% increase from the 2014 figure. This increase is welcome and shows that the impact of bringing online betting within the tax net by the enactment of the Betting (Amendment) Act Figure 6: Total Government funding of Horse Racing Ireland, Source: HRI Factbooks, Petrus Analysis Petrus Consulting 14
17 A similar trend to that seen in Figure 6 is observed in the figures for the prize money available for horseracing (Figure 7) which declined from its peak of 60 million in 2008 to 46 million in 2010, a 23% decline. An increase in prize money is observed from 2011 onwards, with the sharpest increase observed from 2014 to 2016; from 48.6 million to 56.8 million, a 17% increase. However prize money in total has still not reached the level seen at the peak in This increase is also welcome as it supports the wider horseracing industry but has only an indirect impact on racecourses as it is racehorse owners who benefit in the first instance. Figure 7: Prize money, Source: HRI Factbooks, Petrus Analysis Betting revenues, shown in Figure 8 and 9, experienced a significant decline, beginning as early as In the case of total betting revenues (Figure 8), the decline is relatively steady, from a peak of 3.9 billion in 2007 to 2.7 billion in 2013 (a 32% reduction). In the case of on-course betting (Figure 9) the decline was relatively drastic; from 282 million in 2007 to just 133 million by 2013 (a 53% reduction). This can be attributed in part to the attendance levels at racecourses but a more important factor was the rise in popularity of online betting. In both cases, there has been an increase in betting revenues from 2013 onwards. Total betting revenues have increased from 2.7 billion in 2013 to 5.2 billion in 2016 (a 49% increase). At noted above the main element of this increase is a result of bringing online betting within the tax net from late Petrus Consulting 15
18 Figure 8: Betting revenues (total), Source: HRI Factbooks, Petrus Analysis The level of on-course betting revenues has seen a modest increase in recent years and the trend is positive but is 40% below the peak level seen in Figure 9: On-course betting revenues, Source: HRI Factbooks, Petrus Analysis Since 2008, there has been a steady decline in the number of racehorse owners. In 2006 there were 5,207 racehorse owners and by 2016 this number had declined to 3,038. The figures for horses in training show a large reduction - from a peak in 2008 of 6,817 horses in training, by 2016 this number had declined to 4,154. Petrus Consulting 16
19 Figure 10 below shows the level of horse ownership and horses in training from 2006 to 2016 with 2006 as the base year. It can be seen that there is a close correlation between the decline in horse ownership and horses in training. Horse ownership and horses in training are a key indicator for the present and future strength of the industry and the decline in these numbers is a particular concern. Figure 10: Level of Horse Ownership and Horses in Training Source: HRI Factbooks, Petrus Analysis Summary of Key Indicators Indicator Trend Impact on Racecourses Racing Fixtures Small Increase Somewhat positive but see declining Average Attendance Races Held Small Increase Positive impact on Media rights Income Total Attendance Small increase in recent years Positive but insufficient to counteract rising costs. On a per fixture basis the increase is minimal Average Attendance Still well below Peak Cost structure for racecourses is predominantly fixed and there is a high cost per fixture. Government Funding Almost at peak levels Recent increases are welcome and beneficial Prize Money Almost at peak levels and Welcome but only indirect impact on racecourses increases in recent years generally Betting Strong increase in recent years Widened funding source is welcome Revenues from inclusion of online betting On-course Betting revenues Still far below peak levels but small recent increase On-course bookie revenue is important to racecourses and they are under severe threat Racehorse Owners Horses Training in Source: Petrus Analysis Large reduction in number of owners and Large reduction in horses in training As key indicators for the present and future of horseracing, the large reduction in both indicators is cause for concern. Petrus Consulting 17
20 3.2. SERVICES PROVIDED AT RACECOURSES As well as providing the locations at which owners, trainers, jockeys and race-goers can all benefit from and enjoy the spectacle of horseracing, racecourses also provide the occasion and the facilities for other horseracing industry participants to supply a number of important services. Such services include the provision of dedicated, serviced areas for on-course catering, stabling and on-course betting. Racecourses also enable the racing fixtures to be broadcast to a far wider audience across the world for enjoyment and for off-course betting purposes in Ireland and in other countries. Racecourse venues are also used for a variety of other non-racing purposes, ranging from conferences to car boot sales, and some racecourses have facilities such as co-located golf courses and gyms. Racecourses provide and pay for a number of services that enable race meetings to take place. The most important function of racecourses is to develop and maintain the racetracks themselves, which are located on land holdings encompassing 3,500 acres owned and operated by the 26 racecourses. Racecourse facilities have to be developed and maintained throughout the year even though racing may only take place on a small number of days during the year. Racecourses in total are used for about 4% of the time available but must be maintained for the remaining 96% of the time. As well as the racetracks, racecourses also have other facilities such as turnstiles, stands, car parks, enclosures, bars, restaurants, weighing rooms, first-aid rooms, stable yards and facilities for on-course betting (comprising both on-course bookmakers, typically located in a bookmakers ring, and the Tote). From the returned questionnaires, racecourses reported employing almost 1,300 staff for race days in total comprising both full time staff and part time race day employees. The related employment costs for these staff are reported at over 12 million. Racecourses also provide and pay for necessary racing-related equipment such as admission systems for racing participants, public address systems, closed-circuit TV systems, race cards and race form information, telephones and media facilities, including dedicated press rooms. Racecourses also arrange for the provision of important support personnel and services at race meetings. Key personnel include stewards, doctors (usually a minimum of two), Order of Malta personnel (usually at least 12), two ambulances, two veterinary surgeons (in addition to the veterinary surgeon provided by the Turf Club), a Blue Cross horse ambulance, farriers and security personnel. Racecourses provide support to and liaise with An Garda Síochána in the area of traffic management in the vicinity of racecourses on race meeting days. Racecourses are also obliged by the Health and Safety Authority (HSA) to prepare and maintain event emergency plans in relation to race meetings held at their tracks. Racecourses are also subject to stringent regulation from a variety of bodies such as the Health and Safety Authority, Local County Councils regarding fire, water, waste and development planning, the Food Safety Authority for catering facilities, Revenue Commissioners for tax purposes, the Turf Club for participant facilities and Horse Racing Ireland for physical infrastructure. This regulatory oversight has improved horseracing and racecourses for the benefit of everyone involved in the sport but the burden of regulation itself falls principally on racecourses. Petrus Consulting 18
21 3.3. ECONOMIC INPUTS AND OUTPUTS RELATING TO RACECOURSES Table 2: Racecourse Benefits Provided and Received to and from Stakeholders Stakeholders Benefits/Inputs from Outputs from Stakeholders Racecourses to to Racecourses Stakeholders Owners Racecourse Facilities Racehorses (but no financial benefit to racecourses) Trainers and Jockeys Racecourse Facilities Racehorses (but no financial benefit to racecourses) Caterers Racecourse Facilities Concession fees On-course Racecourse Facilities Pitch fees Bookmakers Off-course Race meeting content Media rights income Bookmakers provided Sponsors Exposure/publicity Fees for Sponsors guests. Racecourses also raise race sponsorship for the benefit of other stakeholders Advertisers Exposure/publicity On course Advertising fees Racegoers Racecourse Facilities - Race Entrance money meetings Media Race meeting content and press facilities Exposure/publicity (but no financial benefit to racecourses) Breeders Showcase/Shop window Racehorses indirectly (but no financial benefit to racecourses) Government/HRI Racecourse Facilities, Taxes Capital Grants/Fixture Management, Regulatory and Charges Source: Petrus Analysis The economic activities of racecourses may be seen in the context of a number of key inputs and outputs. These are summarised in Table 2 above. As can be seen, racecourses provide a variety of important inputs to various other entities or stakeholders involved in the horse racing industry, some of which are remunerated in monetary form whereas others are not. A critical input provided by racecourses is the range of on-course facilities described above that are made available to owners and trainers when they bring their horses to race meetings. Racecourses provide on-course facilities such as stabling, changing facilities for jockeys, parking etc. as well as the track itself over which the races take place. Racecourses also provide on-course facilities to other stakeholders that in turn provide retail services to the racegoing public at race meetings. The main providers of such services include the different oncourse caterers (which range from table service offered to premium ticket holders to fast food outlets) as well as on-course bookmakers, including the Tote. Racecourses also provide important exposure and publicity both on-course and over TV and other media for companies and organisations who rent advertising space at strategic locations around the course. Race sponsors are also provided with the same kind of on-course and off-course exposure and publicity. Petrus Consulting 19
22 The key input provided by racecourses is, however, the venues themselves, with the racegoing public gaining access to the entertainment spectacle of an Irish race meeting, while media organisations gain access to valuable race meeting content for use in their TV programming. Live content from Irish race meetings is broadcast over a variety of Irish, UK and international TV channels, as well as being broadcast on a closed circuit TV basis and to off-course betting shops. Races held at Irish racecourses also provide breeders with important opportunities for showcasing equine talent. In this sense, racecourses act as the shop window for the breeding industry as was pointed out by many of those responding to the racecourse questionnaire. For Government too racecourses are an important outlet for showcasing an important national industry, which means that racecourses may be seen as a key input to national policy aimed at the development of the Irish horseracing industry. Associated with each of these inputs provided by the racecourses, there are a series of corresponding outputs that racecourses may or may not receive. Caterers, on-course bookmakers and other on-course service providers pay concession/pitch fees to the racecourses in return for the facilities provided to them by the racecourses to enable them to trade at race meetings. However, owners pay race entry fees to HRI and trainers do not pay fees to racecourses. Companies and organisations who take advertising space at racecourses pay fees to racecourses for doing so and in return receive marketing exposure for their products or services. Racecourses raise race sponsorship funds that are then transferred to and administered by HRI for the ultimate benefit of winning owners and connections. Race sponsors also get exposure but in this case the racecourse tends not to receive direct remuneration as the winning owners take this in the form of prize money. Racecourses may receive a small percentage of revenues from sponsors indirectly through the payments made by caterers for sponsors' guests. In recent years, an important benefit for racecourses has been generated via media rights income ultimately paid by off-course bookmakers in return for the supply of race meeting content. Racecourses also derive monetary gains from racegoers and from the Government (via HRI), the former by way of entrance fees to race meetings and the latter via capital grants for the development of racecourses. In a later section we set out the revenue and cost structure of the racecourse element of the overall horseracing spectacle. HRI also provides important capital grants which benefit racecourses and fixture management services to the overall horseracing industry. The inputs made and outputs that are derived from horseracing are not, of course, limited to those that directly involve the racecourses themselves, although it remains the case that without the existence of racecourses none of these inputs or outputs would occur. Examples of these include the relationships between bookmakers on the one hand and racegoers and owners on the other in relation to bets laid and winnings paid out on races, food and drink provided by caterers to racegoers, owners and trainers and the revenues earned by them arising from this and the relationship between breeders and owners, which is so dependent on the results garnered by horses in races held at Irish racecourses. Taken together, these relationships of themselves constitute a significant volume of economic activity much of which bypasses the racecourses and is captured, in an economic sense, by other industry participants. Petrus Consulting 20
23 3.4. IMPACT ON LOCAL ECONOMIES: TOURISM Recent information on the relationship between horseracing and tourism is lacking. However, from earlier work in this area, it is clear that racecourses play an important part in Ireland s tourism industry, with a number of racing festivals coinciding with peak holiday times within the country. As a result, racing festivals held at Irish racecourses have an important role to play in the development of tourism within the country by attracting attendance at race meetings from domestic sources and from overseas. A research study commissioned for HRI in estimated the annual expenditure in the economy by overseas visitors who attend race meetings in Ireland came to just over 67 million. This study estimated that the number of overseas visitors attending race meetings in the period June 2008 to May 2009 came to 68,405 who, between them spent an average of 980 per visit, yielding a total spend over the period of 67,036,900. The same study found that overseas visitors made up 9% of all attendees at race meetings in Ireland. Of this percentage, a sizeable proportion stated that attendance at a race meeting was the primary purpose of their visit to the country. Overseas visitors were found to be very similar to their Irish counterparts in terms of age and gender and, like Irish racegoers, had a slight preference for attending racing festivals. Three-quarters of all overseas visitors came from the UK (60%) or the United States (14%) and over half of them attended race meetings in Dublin (14%) or the rest of Leinster (38%). The same study conducted market research with overseas visitors to determine their reasons for visiting the country to attend race meetings. The principal reasons provided are illustrated below. The quality of the spectacle and the atmosphere at Irish race meetings were the two principal reasons provided for attending race meetings here. Figure 11: Reasons for Visiting Ireland for a Race Meeting Source: Horse Racing Ireland - Overseas Visitors Quantitative Research 2008/09 A 2012 study carried out by National University of Ireland Maynooth (NUIM) estimated the value of the previous year s Punchestown festival at just under 60 million. 5 This study estimated that in addition to the direct economic contribution of 59,800,000 a further 9 to 12 million could be added to take account of indirect spin-off benefits to the local economy. The study estimated that the 59.8 million 4 Overseas Visitors Quantitative Research 2008/09 Prepared August 2009 by Behaviour & Attitudes for Horse Racing Ireland. 5 The Economic Contribution of the 2011 Irish National Hunt Festival at Punchestown to the Economy of Kildare and its Surrounding Regions, Report for Punchestown Racecourse by NUIM, January 2012, available at: Petrus Consulting 21
24 direct economic effect comprised spending inside the racecourse of 21.4 million, spending outside the racecourse of 24.8 million, spending on attire of 7 million and spending on travel of 6.6 million. An earlier 2003 study estimated that the value to the local economy arising from the Galway festival was at a similar level to that of Punchestown. This study, carried out by the Marketing Development Programme of the Michael Smurfit Graduate School of Business, UCD found that the full economic impact of the Galway festival totalled 58 million. 6 The 2017 Deloitte report on the Economic Impact of Irish Breeding and Racing estimated that the core breeding and racing industry generated 1.05 billion gross expenditure and, when secondary effects are included, that total economy wide expenditure amounted to 1.84 billion. Key elements included in the figure of 1.05 billion include Breeding 583million, Owners 176 million and Racegoers 145 million. From analysis of the returned questionnaires for this report we have identified approximately 23.4 million direct racecourse turnover from sources including admission fees, bar and catering income, advertising and income from bookmakers. For current purposes we exclude media income, non-racing income and grants and subsidies. While there may be some doubt over the gross value of the industry as a consequence of missing or insufficient data and the extent of the secondary expenditure effects, it is clear that racecourses are critical enablers of a very large multiplier linking the various sectors of the industry and enabling the wider economic benefits to flow to all parties EMPLOYMENT BY RACECOURSES Table 3: Employment Numbers and Cost Estimate All Racecourses 2016 Employee Numbers Core Full Time Employees Core Part Time Employees Race Day Full Time Employees Race Day Part Time 1,128 1,174 1,168 1,220 Employees Race Day Total Employees 1,282 1,334 1,327 1,386 Full Time Equivalents Source: Petrus Questionnaire Full time and core part time employment on racecourses is estimated to be 225 core full time employees and 119 core part time employees respectively. Race day employees are estimated to be 166 and 1,220 for race day full time and race day part time respectively. In terms of the total numbers, there has been a small increase in the employment level seen in our previous report. On racedays it is estimated that 1,386 casual employees are employed in total across all 26 racecourses or an average of 53 part time employees per course. 6 See Galway races 60 million win for local economy, Irish Independent, 9th July 2003 available at: Petrus Consulting 22
25 Wages and salaries for full time, part time and casual racing staff amount to just over 12 million annually. To estimate the number of full time equivalents and an average cost per person we have taken the same approach as in the previous review with each part time position representing 50% of a full time position and each race day employee as representing 10% of a full time position. The number of full time equivalent employees has risen modestly each year and is estimated at 407 in 2016 compared to 380 in In the previous report the average cost per full time equivalent employee saw a decrease over the years 2009 to 2012 with an average cost per employee of 33,240 in 2009 reducing to 28,028 in Cost per full time equivalent has risen in the current review and is estimated at 33,194 for 2016 including non-racing costs. It is estimated that there are approximately 407 full time equivalent (FTE) jobs supported by racecourses directly and that employment has increased slightly over the 4 year period Average cost per full time equivalent employee has increased by 18%. The figure of 407 FTEs is made up of 225 full time staff, 60 part time FTEs and 122 casual FTEs EMPLOYMENT IN THE OVERALL HORSERACING INDUSTRY The employment numbers estimated above represent only a small part of the overall employment in the horseracing industry. On-course and off-course activities in areas such as training, breeding, catering, betting, regulation, and transport all have high employment content and are supported or enabled by the existence of the racecourses. In the recent Deloitte report, Economic Impact of Irish Breeding and Racing 2017, it was estimated that the total employment in the industry and including secondary employment effects amounted to 28,900 in Excluding the secondary employment effects, core and directly attributable employment is estimated at 21,200 in horseracing, breeding, betting and directly attributable activities. The breakdown of employment shows the wide range of activities and occupations involved in the horseracing industry. Breeding activities employ 4,100 individuals and racing and racing support services such as stable staff, Point to Point training yards, pre-training, breaking yards, breeze ups, catering and administration staff account for 4,048 individuals. Betting activities comprising bookmakers, on course clerks, total bookmakers off course and tote staff account for another 6,175. Trainers and Jockeys comprise 883 and 225 individuals respectively. Bearing in mind the network and ecosystem concepts referred to earlier, the racecourses are only one part of the overall horseracing and breeding industry but, if it is accepted that racecourses are an essential precursor to all the related activities, then the racecourse activity is critically important and has a very high multiplier effect for all the other related activities in the wider horseracing industry HORSERACING INDUSTRY EMPLOYMENT BY OCCUPATIONAL GROUP The Central Statistics Office previously provided a special tabulation extracting information from the 2011 census as it relates solely to horseracing. The detailed classification of occupations within the Horseracing category is not yet available from the 2016 census although the figures are available at a total level. The total number classified as employed under Horseracing Activities has increased from 4,241 to 4,570 between 2011 and 2016 representing an increase over the period of 7.7%. Petrus Consulting 23
26 The original table is included below along with the updated total figures and shows persons aged 15 years and over classified by occupational group and industrial group for Other reports show a higher level of employment in the horseracing industry which can be explained by the categorisation of occupation and industry used by the CSO to record activity. For example, Gambling and betting activity (CSO employment 6,204) is a separate industry group, (included as part of Arts, Entertainment and Recreation) to horseracing (included as part of Agriculture, Forestry and Fishing). The different categorisations of occupations and industries explain the main differences between the figures generally understood to comprise employment in the overall horseracing industry (c.21,000) and employment reported by the CSO (4,570). The table below shows that there are many occupations in the horseracing sector with a high level of employment for Managers, Professionals, Associate Professionals and Skilled Trades and also for Elementary occupations. Figures are also provided for employment in Gambling and Betting activities and in Sports, Amusement and Recreation activities. Those involved in horseracing enjoy a wide variety of occupations with employment generated at many different levels. Table 4: Occupation Analysis in Horseracing Occupation Analysis 2011 Horseracing Activities Gambling and betting activities Sports activities, amusement recreation activities Corporate managers and directors Other managers and proprietors 304 1,153 1,515 Science, research, engineering and technology professionals Health professionals Business, media and public service professionals Science, engineering and technology associate professionals Health and social care associate professionals Culture, media and sports occupations ,034 Business and public service associate professionals Administrative occupations 232 1,770 1,093 Secretarial and related occupations Skilled agricultural and related trades ,548 Skilled metal, electrical and electronic trades Skilled construction and building trades Textiles, printing and other skilled trades Caring personal service occupations Leisure, travel and related personal service occupations ,027 Sales occupations Customer service occupations Process, plant and machine operatives Transport and mobile machine drivers and operatives Elementary trades and related occupations 1, Elementary administration and service occupations ,195 Not stated Total ,241 5,912 13,553 Total ,570 6,204 15,363 Change % 7.7% 4.9% 22.7% Source: Central Statistics Office Census 2011 Special Tabulation, Census 2016 Summary Results Petrus Consulting 24
27 It can be seen from the figures above that there is a wide variation in the estimated numbers employed in the horse racing industry. Our questionnaire identifies 407 full time equivalents directly employed by racecourses on-course. The CSO estimates that 4,570 are employed in horse racing activities which includes many of the off-course direct occupations. The figure of c. 21,200 employed across all categories is the most comprehensive figure taking in other related activities and can be considered as the equivalent of what we refer to as the network or ecosystem employment level. Looking at racecourse employment and activity levels from another perspective it can be seen that each full time equivalent job on the racecourse supports over 50 jobs off the racecourse. On a per racecourse basis, each racecourse supports over 800 jobs across the core breeding and racing sectors IMPACT ON HORSE BREEDING SECTOR The Irish horse breeding sector is an important success story within the national economy. The performance of the sector in recent years has been very strong with total sales of Irish horses sold in Irish sales reaching million in Table 5: Horse Sales Agg. Value of Irish Horses sold in Irish m Sales Annual Change % 19.1% 15.8% 42.2% 10.5% 3.5% 7.6% Number of Horses Sold 4,248 4,555 5,129 5,488 5,762 5,965 Annual Change in Number of % 7% 7% 13% 7% 5% 4% Horses Sold Average Value of Horses Sold 18,965 20,595 26,013 26,858 26,470 27,516 Annual Change in Average Value % 11% 9% 26% 3% -1% 4% Source HRI Factbook 2016, Petrus Analysis The total value of sales of Irish horses in Irish sales has more than doubled since the low point in 2009 and 2010 when sales amounted to just 68 million. In 2016 sales of Irish horses sold in Irish sales amounted to 164 million. This increase in total sales value is a function of an increase in the number of horses sold along with an increase in the average sale value. Table 5 shows that there has been a fairly consistent increase in the number of horses sold. Average sales value also increased strongly in the early years of the decade with increases of 11%, 9% and 26% recorded in 2011, 2012 and The change in average sales value has been lower in more recent years including a small decrease in High individual sales prices in any one year may lead to some distortion in the overall averages but it is clear that, taken as a whole, the horse breeding sector has recovered strongly in recent years. The consistent view from racecourses is that they provide a shop-window for the rest of the horseracing industry. They act as the focal point of the industry by bringing together owners and trainers, racegoers and bookmakers and all the other stakeholders while trying to meet the needs of each of their stakeholders to the best of their ability. While no one part of the industry could survive without the others, each plays an important role for each of the other elements. Petrus Consulting 25
28 It is still the case, as was pointed out in the previous review, that without a well-developed network of racecourses offering a year-round programme of racing events, it is impossible to imagine that the horse breeding industry in this country would have become anything like as successful as it undoubtedly has. As noted earlier, racecourses provide breeders with an important shop window for equine talent and, as a result, a significant proportion of the value of the horse breeding sector may be traced to the part played by racecourses in providing a critical proving ground for breeders efforts PRIZE MONEY AND SPONSORSHIP Prize money and the sponsorship of races are essential components of the horse racing industry, providing an important source of income for owners and trainers while also increasing the attractiveness of the Irish racing calendar. The previous report identified a significant decrease in the level of prize money on offer at Irish races falling from a total of over 60 million in 2008 to just under 45 million in Since 2012 however the prize money available has increased considerably and in 2016 reached 56.8 million - not far below the level of prize money seen at the peak in From the low point in 2011 where prize money was 44.4 million it has increased by nearly 28%. HRI has announced that prize money for 2017 will increase to 60.5 and, with that increase, prize money will slightly exceed the peak level seen in While prize money is important for the overall well-being of the industry it has little if any impact on racecourse finances. Race sponsorship is also a key factor underpinning the success of the horse racing industry in this country. Racecourses raise sponsorship money thereby increasing the attractiveness of races and fixtures. The sponsorship money is part of the overall prize money available to owners. In 2016 almost two thirds of all races run in Ireland were sponsored races, with sponsorship funding coming from commercial sources and the European Breeders Fund (EBF). The former contributed some 4.8 million in sponsorship money in 2016 while the latter contributed 1.7 million. As is the case with the breeding industry, not all of the value created for the horse racing industry in the form of prize money and sponsorship can be attributed to the racecourses. It is, however, equally apparent that without a network of racecourses on which to run races including globally recognised events such as the Irish Derby and iconic tourist events like the Galway Races none of this value would arise in the first place and it would not accrue to owners and trainers in the important way that it does. As it is in so many other areas of the horse racing industry, racecourses are the key enablers for unlocking this important source of income within the sector to the benefit of other market participants. Petrus Consulting 26

29 3.10. QUALITATIVE DATA FROM QUESTIONNAIRES Figures 11 and 12 below set out in aggregate form the responses received from racecourses to a set of qualitative questions contained in the questionnaire about the sector and its future prospects 7. Summary for All Racecourses Figure 11: Qualitative Responses to Questionnaire A Source: Petrus Questionnaire Figure 11 shows that there is a high level of concern 48% - across nearly all racecourses regarding the potential impact of Brexit on the ability of racecourses to maintain and reinvest in facilities. The level of concern shown in this survey regarding the economic situation and Brexit is the same as the level of 7 Respondents were asked to choose between the following options in relation to each statement: Strongly Agree, Agree, Unsure, Disagree and Strongly Disagree. Figures are rounded and may therefore not sum to 100%. Petrus Consulting 27
30 concern regarding the economic downturn in the earlier review. This is in spite of the general improvement in the economic climate overall and is attributed to the uncertainty arising from Brexit. The potential impacts of Brexit on racecourses are both direct and indirect. Direct impacts are likely arising from a reduction in UK based visitor numbers and a reduction in spend by those UK based visitors who continue to attend as a result of the weakened value of sterling. Further direct impact would be to the level and value of media rights because they are denominated in sterling. Indirect impacts may arise from the behaviour of trainers, owners and breeders where there may be significant impediments to, for example, the movement of horses into or out of the country and the value of horses at sales arising from the weakness of sterling. Regarding whether the current business model for racecourses can support future investment the results this year are more optimistic with only 16% (2012: 39%) believing that the current model cannot support future investment and 42% believing that it is sustainable. Likewise, there is more optimism regarding the statement that the financial position of racecourses has dis-improved in recent years, with just 16% (2012: 43%) believing that the position has dis-improved in recent years. 92% (2012: 95%) of respondents were in strong agreement or agreement that all funds are re-invested into improving facilities. This represents, effectively, unanimous agreement because a number of racecourses do not either generate funds for reinvestment and/or do not need to invest in facilities. 80% (2012: 91%) of respondents strongly agreed or agreed that racecourses earn a low financial return on capital employed. There was almost unanimous support at 96% (2012: 95%) meaning agreement or strong agreement, for the statement concerning we are a showcase for the rest of the horseracing industry The statement that racecourses try to purchase locally wherever possible was unanimously supported (2012: 100%) as was the statement that racecourses provide a safe environment for participants and spectators. Racecourses also tend not to benefit from voluntary unpaid labour. Some smaller racecourses benefit but overall it is not a feature. Petrus Consulting 28
 that racecourses are a local and international tourism product in their own right.")
31 Figure 12: Qualitative Responses to Questionnaire B Source: Petrus Questionnaire Respondents unanimously (100%) (2012: 95%) believe that entrance charges are below comparable sporting and leisure venues. There was unanimous agreement (2012: 100%) that racecourses are a local and international tourism product in their own right. When considering the future development of racecourses, there was a very high level of agreement for the statement that the marketing of Irish racing should be a joint responsibility of all industry participants (88%) (2012: 96%) and a similar level of agreement with 88% (2012: 86%) strongly agreeing or agreeing that more should be done to market Irish racing. It is not just in relation to the marketing of horseracing that racecourses are looking to other market participants to play a greater role. Almost half (2012: 67%) of all respondents either strongly agreed or agreed with the statement that racecourses are not being properly rewarded for the services provided to third parties. Petrus Consulting 29
32 Looking to the future, sentiment amongst respondents was somewhat negative, with 48% (2012: 62%) stating that they either strongly agreed or agreed with the statement that racecourse facilities are likely to degrade over a 5-10 year period. Similarly, there are concerns for the future of racecourses with 64% (2012: 62%) agreeing or strongly agreeing with the statement I am concerned about the future prospects of Irish racecourses. Racecourses were more optimistic than previously about the danger of racecourse closure within the next 5 10 years with 72% (2016: 76%) disagreeing or disagreeing strongly about the risk of closure. Petrus Consulting 30


33 Figure 13: Analysis of Qualitative Responses by Grade of Racecourse The Economic Contribution and Financing of Racecourses in Ireland 2017 Premier Racecourses Grade 1 Racecourses Grade 2 Racecourses Petrus Consulting 31


34 Figure 14: Analysis of Qualitative Responses by Grade of Racecourse Premier Racecourses Grade 1 Racecourses Grade 2 Racecourses Petrus Consulting 32
1. Executive summary Purpose Objectives Strategy: Specific priorities 4
 HORSERACE BETTING LEVY BOARD BUSINESS PLAN 2018/2019 CONTENTS 1. Executive summary 1 2. Purpose 2 3. Objectives 3 4. Strategy: Specific priorities 4 5. Income 5.1 New Levy mechanism 5 5.2 Bank interest
THE ECONOMIC CONTRIBUTION FROM HORSES
 THE ECONOMIC CONTRIBUTION FROM HORSES ECONOMIC CONTRIBUTION FROM HORSES HIGHLIGHTS The horse industry contributes more than $19 billion annually to the Canadian economy On-farm activities with horses generate
Introduction to racing. Robin Mounsey, British Horseracing Authority Head of Media
 Introduction to racing Robin Mounsey, British Horseracing Authority Head of Media What is racing? A sport? An industry? A betting product? A leisure pastime? It is ALL of these, and so much more British
New Zealand Thoroughbred Racing (NZTR) Job Description
 Job Description") New Zealand Thoroughbred Racing (NZTR) Job Description Position Director, NZTR Board External and Internal Key Relationships Internal: NZTR CEO Managers & Staff of NZTR External: NZ Racing Board (NZRB)
New Zealand Thoroughbred Racing (NZTR) Job Description Position Director, NZTR Board External and Internal Key Relationships Internal: NZTR CEO Managers & Staff of NZTR External: NZ Racing Board (NZRB)
STATE OF NEW YORK OFFICE OF THE STATE COMPTROLLER 110 STATE STREET ALBANY, NEW YORK September 2015
 THOMAS P. DiNAPOLI COMPTROLLER STATE OF NEW YORK OFFICE OF THE STATE COMPTROLLER 110 STATE STREET ALBANY, NEW YORK 12236 GABRIEL F. DEYO DEPUTY COMPTROLLER DIVISION OF LOCAL GOVERNMENT AND SCHOOL ACCOUNTABILITY
HORSERACE BETTING LEVY BOARD BUSINESS PLAN 2014
 HORSERACE BETTING LEVY BOARD BUSINESS PLAN 2014 INTRODUCTION 1. Section 24(1) of the Betting, Gaming and Lotteries Act 1963 requires the Horserace Betting Levy Board to assess and collect monetary contributions
STATE OF NEW YORK OFFICE OF THE STATE COMPTROLLER 110 STATE STREET ALBANY, NEW YORK September 2015
 THOMAS P. DiNAPOLI COMPTROLLER STATE OF NEW YORK OFFICE OF THE STATE COMPTROLLER 110 STATE STREET ALBANY, NEW YORK 12236 GABRIEL F. DEYO DEPUTY COMPTROLLER DIVISION OF LOCAL GOVERNMENT AND SCHOOL ACCOUNTABILITY
The Racing Association: The Sport Of Horseracing. 1. Background
 The Racing Association: The Sport Of Horseracing 1. Background The Racing Association was incorporated in December 1997 following the signing of a Memorandum of Understanding between the Horseracing Industry
The Economic Impact of Colonial Downs in Virginia
 The Economic Impact of Colonial Downs in Virginia Prepared for Revolutionary Racing January 31, 2018 1309 E Cary Street, Richmond, VA 23219 1025 Huron Road East, Cleveland, OH 44115 chmuraecon.com Table
WESTERN AUSTRALIAN RACING INDUSTRY
 WESTERN AUSTRALIAN RACING INDUSTRY ECONOMIC & SOCIAL IMPACT REPORT HIGHLIGHTS OUR RACING INDUSTRY THOROUGHBRED RACING IS THE THIRD HIGHEST ATTENDED SPORT IN WA The Western Australian racing industry plays
Price to Public (1) % $99,765,625
 % $99,765,625") OFFERING CIRCULAR SUPPLEMENT (to Offering Circular Dated September 13, 1995) $100,000,000 Federal Home Loan Mortgage Corporation 6.65% Fixed Rate Debentures Due 2003 Redeemable in accordance with amortization
OFFERING CIRCULAR SUPPLEMENT (to Offering Circular Dated September 13, 1995) $100,000,000 Federal Home Loan Mortgage Corporation 6.65% Fixed Rate Debentures Due 2003 Redeemable in accordance with amortization
British racing - the structure of the industry. Joe Rendall, British Horseracing Authority
 British racing - the structure of the industry Joe Rendall, British Horseracing Authority British racing headline numbers THE NUMBERS The British racing industry World-leading in international Racing Second
Welcome to William Hill
 1 Welcome to William Hill 2 Today s running order Highlights and year-to-date overview Ralph Topping Financial results Simon Lane Online overview Ralph Topping Henry Birch Current trading, summary and
Annual results Accell Group 2016
 Annual results Accell Group 2016 Amsterdam, 10 March 2017 René J. Takens, CEO Hielke H. Sybesma, CFO Agenda 1. Key results 2016 2. Strategy 3. Outlook 10 March 2017 Accell Group N.V. presentation annual
ECONOMIC IMPACT OF IRISH breeding
 ECONOMIC IMPACT OF IRISH breeding and RACING 2017 28,900 Direct, indirect and secondary employment 1.3 million Attendees at Irish racing 1.84 billion Total direct and stimulated expenditure 438m Bloodstock
THE ECONOMIC IMPACT OF THE IOWA RACE HORSE INDUSTRY ON THE IOWA ECONOMY
 THE ECONOMIC IMPACT OF THE IOWA RACE HORSE INDUSTRY ON THE IOWA ECONOMY by (TRA, Inc.) 107 West Short Street Lexington, KY 40507 Telephone: (859) 255-3073 Fax: (859) 254-8103 e-mail: rthal@gte.net for
QUEENSLAND RACING INDUSTRY. Economic & Social Impact Report Highlights
 QUEENSLAND RACING INDUSTRY Economic & Social Impact Report Highlights PREPARED BY IER OCTOBER 2017 OUR RACING INDUSTRY The Queensland racing industry plays an important economic and social role, enhancing
OHRIA Ontario Horse Racing Industry Association
 OHRIA Ontario Horse Racing Industry Association P.O. Box 456, Stn. B, Toronto, ON M9W 5L4 Tel: 416-679-0741 Fax: 416-679-9114 Email: ohria@ohria.com Submission to the Standing Committee of Finance and
What did the World Student Games do for Sheffield? The 1991 Games as the catalyst for the regeneration of Sheffield
 What did the World Student Games do for Sheffield? The 1991 Games as the catalyst for the regeneration of Sheffield Peter Taylor Emeritus Professor Sheffield Hallam University England Why host a major
Web.com Completes Acquisition of Yodle Deal strengthens Web.com s portfolio of products that help small businesses compete and succeed online
 Web.com Group, Inc. 12808 Gran Bay Parkway West Jacksonville, FL 32258 T: (904) 680-6600 F: (904) 880-0350 NASDAQ: WEB Web.com Completes Acquisition of Yodle Deal strengthens Web.com s portfolio of products
Report to COUNCIL for decision
 17 152 Title: Section: Prepared by: Olympic Pool Business Case Community & Recreation Andrew White (Community & Recreation Manager) Meeting Date: 18 May 2017 Legal Financial Significance = Medium Report
Working Draft: Gaming Revenue Recognition Implementation Issue. Financial Reporting Center Revenue Recognition
 October 2, 2017 Financial Reporting Center Revenue Recognition Working Draft: Gaming Revenue Recognition Implementation Issue Issue # 6-12: Accounting for Racetrack Fees Expected Overall Level of Impact
Foreword 3. Mission & Objectives 4. Financial Overview 8. Money In 10. Money Out 11. Delivering Services 12. Services Explained 13
 2016 BUDGET GUIDE Foreword 3 Mission & Objectives 4 Financial Overview 8 Money In 10 Money Out 11 Delivering Services 12 Services Explained 13 Cost to Participants 14 FOREWORD NICK RUST CHIEF EXECUTIVE
Danish gambling market statistics Third quarter, 2017
 Danish gambling market statistics Third quarter, Third Quarter, 7. december Third Quarter, Danish gambling market statistics 1 Indhold A. Introduction... 2 B. Quarterly market statistics for the Danish
A Threatened Bay: Challenges to the Future of the Penobscot Bay Region and its Communities
 A Threatened Bay: Challenges to the Future of the Penobscot Bay Region and its Communities 1 A A Threatened Bay: Challenges to the Future of the Penobscot Bay Region and its Communities In 1996 the Island
NEW ZEALAND RACING INDUSTRY
 SIZE & SCOPE OF THE NEW ZEALAND RACING INDUSTRY PREPARED BY IER / FEBRUARY 2018 IER PTY. LTD. Size and Scope of the New Zealand Racing Board / XX KEY FINDINGS 04 INTRODUCTION 08 ECONOMIC IMPACTS 12 EMPLOYMENT
Hunter and Angler Expenditures, Characteristics, and Economic Effects, North Dakota,
 Agribusiness and Applied Economics Report No. 507-S January 2003 Hunter and Angler Expenditures, Characteristics, and Economic Effects, North Dakota, 2001-2002 Dean A. Bangsund and F. Larry Leistritz*
SEAFISH ECONOMIC ANALYSIS
 SEAFISH ECONOMIC ANALYSIS UK 15m & over Scallop Fleet Area VII Economic analysis of the UK 15m and over scallop fishing fleet in ICES Area VII March 2016 AUTHORS: Arina Motova (Seafish) Hazel Curtis (Seafish)
CENTRAL OTAGO DISTRICT COUNCIL
 CENTRAL OTAGO DISTRICT COUNCIL DATE: 1 December, 2008 SUBJECT: Blossom Festival Research Survey Report 2008 (EDT 01-02-11) Purpose The purpose of this report is to summarise the outcomes of a visitor survey
Economic Impact Study: NFL International Series London, 28 October 2012
 LONDON & PARTNERS Economic Impact Study: NFL International Series London, 28 October 2012 December 2012 LONDON & PARTNERS ECONOMIC IMPACT STUDY NFL INTERNATIONAL SERIES LONDON, 28 OCTOBER 2012 DECEMBER
Economic Impact of British Racing
 Economic Impact of British Racing 2009 Contents Foreword 2 Executive summary 4 Introduction 8 Section 1: Overall economic impact Overall economic impact 10 Racing s cash flow 12 Section 2: Economic factors
ANNEX1 The investment required to achieve the Government s ambition to double cycling activity by 2025
 ANNEX1 The investment required to achieve the Government s ambition to double cycling activity by 2025 May 2016 About Sustrans Sustrans makes smarter travel choices possible, desirable and inevitable.
The NSW Greyhound Breeders, Owners & Trainers Association
 ACN 000 043 756 ABN 68 000 043 756 The NSW Greyhound Breeders, Owners & Trainers Association Submission to GRNSW re: Proposed Welfare and Integrity Levy From: The NSW GBOTA Date Submitted: March 27, 2015
Funding Agreement & New Ontario Racing Overview. Spring 2018
 Funding Agreement & New Ontario Racing Overview Spring 2018 Background In September of 2016, OLG, Ontario Racing Association and Woodbine Entertainment Group (WEG) entered into a non-binding Letter of
PDMS Report 2012, NZG Consultation Process National Membership Statistics, Casual Golf Membership Research.
 . STRATEGIC PLAN Throughout the various review processes and studies carried out over the past five years, it has become clear there are a number of core issues facing the golf industry in New Zealand.
The University of Georgia
 The University of Georgia Center for Agribusiness and Economic Development College of Agricultural and Environmental Sciences Economic Impacts of Alabama Quail Hunting Prepared by: Archie Flanders and
Equine Business Year in Review 2003 Dean, Dorton & Ford, P.S.C. Page 1
 is published by Dean, Dorton & Ford's Equine Industry Group. We hope you find the information we present regarding thoroughbreds to be interesting and helpful. We welcome your feedback. Located in the
RACING & WAGERING PERFORMANCE OVERVIEW
 RACING & WAGERING PERFORMANCE OVERVIEW FIRST HALF OF 17/18 RACING SEASON (AUGUST 17 - JANUARY 18) Published March 18 INTRODUCTION 17/18 RACING SEASON H1 OVERVIEW IT IS NOW 1 MONTHS SINCE WE COMMITTED TO
Please initially allow me to submit some background information on the Ballarat Football League Social Club Inc.
 BALLARAT FOOTBALL LEAGUE SOCIAL CLUB INC. SUBMISSION - GAMING MACHINE ARRANGEMENTS REVIEW 2016 The Ballarat Football League Social Club Inc (trading as the Ballarat Leagues Club) wishes to submit the following
Independent Economic Analysis Board. Review of the Estimated Economic Impacts of Salmon Fishing in Idaho. Task Number 99
 IEAB Independent Economic Analysis Board Roger Mann, Chair Noelwah R. Netusil, Vice-Chair Kenneth L. Casavant Daniel D. Huppert Joel R. Hamilton Lon L. Peters Susan S. Hanna Hans Radtke Review of the Estimated
LOGO. Racing s Lifeblood The Future Landscape for Wagering
 LOGO Racing s Lifeblood The Future Landscape for Wagering LOGO Racing s Lifeblood The Future Landscape for Wagering Speaker: Paul Bittar Chief Executive, British Horseracing Authority BRITISH RACING AND
Regional Profile Ebbw Vale & Blaenau Gwent
 Regional Profile Ebbw Vale & Blaenau Gwent Content Overview of Ebbw Vale Economy of Ebbw Vale & Blaenau Gwent Workforce Skills Addressing Youth Unemployment Summary Ebbw Vale & Blaenau Gwent Overview of
Preliminary Unaudited Financial Results for 2016
 REGULATORY ANNOUNCEMENT March 9 th, 2017 Fortuna Entertainment Group N.V. Preliminary Unaudited Financial Results for 2016 Amsterdam - Fortuna Entertainment Group N.V. announces its preliminary unaudited
Brookfield Asset Management O AK T R E E ACQUISITION M A R C H 1 3,
 Brookfield Asset Management O AK T R E E ACQUISITION M A R C H 1 3, 2 0 19 Transaction Summary On March 13, 2019, Brookfield Asset Management ( BAM ) and Oaktree Capital Group ( OAK ) announced an agreement
Apprentice and conditional jockeys
 Apprentice and conditional jockeys The following is a brief guide for trainers with apprentice or conditional jockeys. It does not seek to cover every scenario nor individual cases but gives an overview
An Bille um Rásaíocht Capall Éireann, 2015 Horse Racing Ireland Bill Meabhrán Mínitheach Explanatory Memorandum
 An Bille um Rásaíocht Capall Éireann, 2015 Horse Racing Ireland Bill 2015 Meabhrán Mínitheach Explanatory Memorandum AN BILLE UM RÁSAÍOCHT CAPALL ÉIREANN, 2015 HORSE RACING IRELAND BILL 2015 EXPLANATORY
WANAKA SWIMMING FACILITIES STATEMENT OF PROPOSAL
 WANAKA SWIMMING FACILITIES STATEMENT OF PROPOSAL 17 October 2014 Contents Executive Summary Background National Guidelines The Status Quo Issue One Timing Issue Two Location Issue Three Size Issue Four
15, 2015 EXECUTIVE SUMMARY
 Economic Contribution, Impacts, and Economic Benefits of Deer, Waterfowl and Upland Game Bird Hunting in North and South Dakota: Relationship to CRP Lands Dr. John Loomis and Dr. Michelle Haefele in cooperation
ASSETS Swiss Francs Swiss Francs
 INTERNATIONAL SKATING UNION, LAUSANNE BALANCE SHEET AS OF DECEMBER 31, 2015 31.12.2015 31.12.2014 ASSETS Swiss Francs Swiss Francs Current Assets Cash 14'562.31 16'103.63 Post / Bank - current accounts
London Organising Committee of the Olympic Games and Paralympic Games. 14 June 2010
 London Organising Committee of the Olympic Games and Paralympic Games 14 June 2010 London 2012 Olympic and Paralympic Games Volunteer Protocol Title This document shall be known as the London 2012 Olympic
Presentation half-year results 2012
 Presentation half-year results 2012 Okura Hotel, Amsterdam 26 July 2012 René J. Takens, CEO Hielke H. Sybesma, CFO Jeroen M. Snijders Blok, COO Agenda 1. Accell Group in H1 2012 2. Accell Group share 3.
FUNDING THE INFRASTRUCTURE OF THE SPORT OF BASKETBALL IN AUSTRALIA
 FUNDING THE INFRASTRUCTURE OF THE SPORT OF BASKETBALL IN AUSTRALIA Why We Need to Have Registration Fees 1. How is the Infrastructure of Basketball in Australia Funded? The registration fee system in basketball,
Presentation first-half results 2010
 Presentation first-half results 2010 Okura Hotel, Amsterdam 23 July 2010 René J. Takens, CEO Hielke H. Sybesma, CFO Jeroen M. Snijders Blok, COO Agenda 1. Accell Group in H1 2010 2. Segments and countries
Agriculture and the Economy: A View from the Chicago Fed
 Agriculture and the Economy: A View from the Chicago Fed March 3, 2016 Riverside, Iowa David Oppedahl Senior Business Economist 312-322-6122 david.oppedahl@chi.frb.org Federal Reserve System Twelve District
FEASIBILITY ASSESSMENT OF TOURISM SUBPROJECTS
 FEASIBILITY ASSESSMENT OF TOURISM SUBPROJECTS A. Overview 1. The proposed investment support for community based tourism was reviewed during an ADB mission from 17 th to 23 rd September 2016. The selected
Agenda Report PARK, RECREATION & OPEN SPACE COMMISSION ARTS, RECREATION & COMMUNITY SERVICES DEPARTMENT
 Agenda Item No. 4b DATE: FEBRUARY 8, 2010 Agenda Report TO: FROM: PARK, RECREATION & OPEN SPACE COMMISSION ARTS, RECREATION & COMMUNITY SERVICES DEPARTMENT SUBJECT: BOUNDARY OAK GOLF COURSE STATUS REPORT
Growing Racecourse Attendance
 Growing Racecourse Attendance Background In March 2015, Britain s 58 RCA racecourses came together for the first time to share their customer data in British racing s biggest and most farreaching piece
CRICKET HONG KONG 2019 AGM CHAIRMAN S REPORT
 CRICKET HONG KONG 2019 AGM CHAIRMAN S REPORT INTRODUCTION The 2019 AGM is a major milestone in the history of cricket in Hong Kong. The board elected at this AGM will be the first under the new constitution
AN BILLE UM RÁSAÍOCHT CAPALL AGUS CON, 2001 HORSE AND GREYHOUND RACING BILL, Mar a tionscnaíodh As initiated ARRANGEMENT OF SECTIONS
 AN BILLE UM RÁSAÍOCHT CAPALL AGUS CON, 2001 HORSE AND GREYHOUND RACING BILL, 2001 Mar a tionscnaíodh As initiated Section 1. Short title. 2. Interpretation. 3. Establishment day. ARRANGEMENT OF SECTIONS
Golfers in Colorado: The Role of Golf in Recreational and Tourism Lifestyles and Expenditures
 Golfers in Colorado: The Role of Golf in Recreational and Tourism Lifestyles and Expenditures by Josh Wilson, Phil Watson, Dawn Thilmany and Steve Davies Graduate Research Assistants, Associate Professor
Course Invitation 2011 From GreenFree 2 for 1 Golf
 Driving more golfers to your club Course Invitation 2011 From GreenFree 2 for 1 Golf GreenFree Partner Course : Celtic Manor Resort Contents Page Testimonials 5 Good for golfers... Great for the game GreenFree
How to Explain Car Rental to Banks and Investors
 How to Explain Car Rental to Banks and Investors Scott White Senior Managing Director, Head of Investment Banking C.L. King & Associates March 8-9, 2011 Las Vegas Hilton 1 My Background 18 Years Advising
Private-Public Partnership. Presentation to Metropolitan Council October 2, 2017
 Private-Public Partnership Presentation to Metropolitan Council October 2, 2017 THE FAIRGROUNDS NASHVILLE 160 unique events annually drawing more than 1.4 million attendees Christmas Village 2 FAIRGROUNDS
39B, Kingfisher Court, Hambridge Road Newbury, Berkshire RG14 5SJ
 Part 4 JOCKEYS TAX & VAT BOOKLET 39B, Kingfisher Court, Hambridge Road Newbury, Berkshire RG14 5SJ Telephone: Newbury (01635) 44102 Fax: (01635) 37932 email: info@thepja.co.uk Web: www.thepja.co.uk 1 I
Course Invitation 2015
 GreenFree Partner Course Celtic Manor Resort GreenFree 2 for 1 Golf Course Invitation 2015 RECOMMENDED Golf Monthly recommends GreenFree 2 for 1 Golf Good for golfers... Great for the game GreenFree Partner
THE PERRYMAN GROUP. The Economic Benefits of the Precision Dance Industry Inspired by the Kilgore College Rangerettes
 The Economic Benefits of the Precision Dance Industry Inspired by the Kilgore College Rangerettes THE PERRYMAN GROUP 510 N. Valley Mills Dr. Suite 300 Waco, TX 76710 ph. 254.751.9595 fax 254.751.7855 info@perrymangroup.com
Irish Bookmakers Association
 Irish Bookmakers Association Pre Budget Submission October, 2011 2 Contents Overview and Key Proposals... 3 Level the Playing Field... 4 Modernise the Sector... 5 Economic Impact of Modernisation and Liberalisation...
FIRST QUARTER 2012 GROSS WIN UP 15.9% YOY, PROFITABILITY MAINTAINED
 REGULATORY ANNOUNCEMENT 10 May 2012 Interim Management Statement of Fortuna Entertainment Group N.V. for the period from January 1, 2012 to May 10, 2012 FIRST QUARTER 2012 GROSS WIN UP 15.9% YOY, PROFITABILITY
Half year results Accell Group 2017
 Half year results Accell Group 2017 Hielke Sybesma, Interim CEO & CFO Jeroen Snijders Blok, COO Jeroen Both, CSCO July 21, 2017 Agenda 1. Key results H1 2017 2. Strategy 3. Outlook July 21, 2017 Accell
Danish gambling market statistics First quarter 2018
 Danish gambling market statistics First quarter, 2018 First quarter 2018 28. juni 2018 Indhold A. Introduction... 1 B. Overview over market developments in first quarter of 2018... 2 C. Online casinos...
School Games EXECUTIVE SUMMARY YEAR 1 August 2012
 School Games EXECUTIVE SUMMARY YEAR 1 August 2012 1 EXECUTIVE SUMMARY Background The School Games is a competitive school sport programme designed to motivate and inspire millions of young people across
Economic Impact of the Michigan Equine Industry, 2006
 Economic Impact of the Michigan Equine Industry, 2006 Summary Animals and operations 155,000 equine animals housed in Michigan on June 1, 2007-86,000 at private residences - 21,000 at breeding farms -
The primary purpose of the TFF is to help promote a healthy farm tenanted sector in Scotland. It aims to fulfil this purpose by:
 T e n a n t F a r m i n g F o r u m S u b m i s s i o n o f E v i d e n c e t o t h e L a n d R e f o r m R e v i e w G r o u p I N T R O D U C T I O N The Tenant Farming Forum (TFF) is a membership organisation
Cricket Ireland Active Clubs Coordinator
 Cricket Ireland Active Clubs Coordinator Fixed Term Contract Candidate Brief BACKGROUND Cricket Ireland is the governing body for the game at both performance and participation levels throughout Ireland,
Video Lottery/Tourism Promotion
 1 Video Lottery/Tourism Promotion The proposed amendment to the Colorado Constitution: requires the Colorado Lottery Commission to implement a state-supervised video lottery program at specific horse and
Tabcorp Holdings Limited. Citigroup Wagering Forum 9 November 2011
 Tabcorp Holdings Limited Citigroup Wagering Forum 9 November 2011 Agenda Investment highlights Wagering market growth 1Q Wagering KPIs Fixed odds Distribution platforms Victorian Wagering and Betting licence
HORSERACE BETTING LEVY BOARD BUSINESS PLAN 2013
 HORSERACE BETTING LEVY BOARD BUSINESS PLAN 2013 INTRODUCTION 1. Section 24(1) of the Betting, Gaming and Lotteries Act 1963 requires the Horserace Betting Levy Board to assess and collect monetary contributions
Community Update. Life in the Heartland Community Information Evening. Pembina Pipeline Corporation
 Pembina Pipeline Corporation Community Update Life in the Heartland Community Information Evening Wayne Carey Manager, Field Projects, Redwater Facility October 23, 2017 Forward-Looking Statements This
The Economic Benefits of Hunting and Fishing Activities in Alberta in 2008
 The Economic Benefits of Hunting and Fishing Activities in Alberta in 2008 Submitted to Hunting For Tomorrow Foundation Submitted by May, 2009 Introduction Hunting and Fishing related expenditures by Alberta
Review of Outlook
 Review of 2012 2013 Outlook Our membership now numbers over 200,000 racing fans and on average we see around 1,700 new members joining us per week. 2012 Highlights Q1 Sponsor of the Rewards4Racing Cleeve
HORSE RACING AND CALIFORNIA FAIRS
 CALIFORNIA AUTHORITY OF RACING FAIRS HORSE RACING AND CALIFORNIA FAIRS BACKGROUND PLANNING UPDATES PRESENTED AT THE 2009 WFA CONVENTION PREPARED BY CALIFORNIA AUTHORITY OF RACING FAIRS CHRISTOPHER KORBY,
APPLICATION FOR BOOKMAKERS ON-COURSE BETTING PERMIT
 APPLICATION FOR BOOKMAKERS ON-COURSE BETTING PERMIT Existing Permit No: I,, hereby apply to Horse Racing Ireland for an on-course betting permit to carry on the business of bookmaking in respect of horse
FIRST QUARTER 2014 RESULTS APPROVED
 Press Release Mediaset Board of Directors Meeting 13 May 2014 FIRST QUARTER 2014 RESULTS APPROVED Consolidated results Net revenues: 820.8 million Operating profit (EBIT): 29.6 million Net debt: down to
Active travel and economic performance: A What Works review of evidence from cycling and walking schemes
 1 Making the economic case for active travel Active travel and economic performance: A What Works review of evidence from cycling and walking schemes Active Travel Toolkit Slide Pack July 2017 Active travel
Economic Transformation and Recovery in Hong Kong and Singapore
 School of Economics and Finance, The University of Hong Kong Presentation given at the followings : - Zonta Club 1999 Accountancy Conference, Vocational Training Council on October 8, 1999 The Society
INTERIM FINANCIAL STATEMENTS
 AMERICAN GREEN INC INTERIM FINANCIAL STATEMENTS (UNAUDITED) For the three and nine months ended March 31, 2016 and 2015 AMERICAN GREEN INC. UNAUDITED CONSOLIDATED BALANCE SHEET AT MARCH 31, 2016 ASSETS
TOUR DE FRANCE GRAND DÉPART YORKSHIRE
 TOUR DE FRANCE GRAND DÉPART YORKSHIRE Economic Impact Assessment Report for Calderdale Metropolitan Borough Council New Economy www.neweconomymanchester.com 28 September 2012 New Economy 1 1 Introduction
CRV is a non-for-profit organisation that exists for the promotion and facilitation of country horse racing for its members and the wide community.
 26 February 2016 Gaming Machine Arrangements Review Office of Liquor, Gaming and Racing Department of Justice and Regulation PO Box 18055 Collins Street East MELBOURNE VIC 8003 Email: Olgr.gmar@justice.vic.gov.au
A Measure of the Economic Impact of Keeneland Racing and Sales on Lexington-Fayette County. Prepared by the Center for Business and Economic Research
 A Measure of the Economic Impact of Keeneland Racing and Sales on Lexington-Fayette County Prepared by the Gatton College of Business and Economics April 20, 2015 Gatton College of Business and Economics
12. School travel Introduction. Part III Chapter 12. School travel
 12. School travel 12.1 Introduction This chapter presents the evidence on changes in travel patterns for the journey to school in the three towns over the period of the Sustainable Travel Town project.
Rochester Area Bike Sharing Program Study
 roc bike share Rochester Area Bike Sharing Program Study Executive Summary ~ January 2015 JANUARY 2015 8484 Georgia Avenue, Suite 800 Silver Spring, MD 20910 3495 Winton Pl., Bldg E, Suite 110 Rochester,
Active Travel Strategy Dumfries and Galloway
 Active Travel Strategy Dumfries and Galloway Our Active Travel Strategy The agreed Interventions for Dumfries and Galloway Council s Local Transport Strategy includes an action to Develop an Active Travel
THE FA WOMEN S HIGH-PERFORMANCE FOOTBALL CENTRES PROSPECTUS MARCH 2017
 THE FA WOMEN S HIGH-PERFORMANCE FOOTBALL CENTRES PROSPECTUS MARCH 2017 2 FA WOMEN S HIGH-PERFORMANCE FOOTBALL CENTRE PROSPECTUS CONTENTS Our goals Benefits Focus areas The FA s commitment Application process
Sony Centre for Performing Arts
 CAPITAL PROGRAM SUMMARY Highlights Overview I: 10-Year Capital 6 II: Issues for Discussion 15 Sony Centre for Performing Arts 2016 2025 CAPITAL BUDGET AND PLAN OVERVIEW The Sony Centre for the Performing
Nightriders why extending your opening hours could unlock new profit potential
 Nightriders why extending your opening hours could unlock new profit potential NIGHTRIDERS Why extending your opening hours could unlock new profit potential The UK is turning into a nation of night owls
Government finances A long term assessment. Presented by Edwina Matos Pereira
 Government finances A long term assessment Presented by Edwina Matos Pereira Walter Mosher June 22, 2010 Structure 1. Aruba s current fiscal landscape 2. Long term outlook & scenarios 3. Aruba s GDP volatility
Fiscal Impact of SunTrust Park and The Battery Atlanta on Cobb County Executive Summary Sept. 18, 2018
 Fiscal Impact of SunTrust Park and The Battery Atlanta on Cobb County Executive Summary Sept. 18, 2018 Overview Historically, professional sports stadiums were privately owned by the sports teams that
SEASONAL POOLS REVIEW AND STRATEGY
 SEASONAL POOLS REVIEW AND STRATEGY 1 ACKNOWLEDGEMENTS The Seasonal Pools Review and Strategy Project Team acknowledges the input and support from a range of Council staff and representatives from external
Danish gambling market statistics Third quarter 2018
 Danish gambling market statistics Third quarter, Third quarter 5. december Content A. Introduction... 1 B. Overview over market developments in third quarter of... 2 C. Online casinos... 5 Developments