Minnesota Lottery Gambler Plus Segmentation Study
|
|
|
- Oswald Allen
- 5 years ago
- Views:
Transcription


1 Minnesota Lottery Gambler Plus Segmentation Study Presentation April 21, 2015 Nobody s Unpredictable


2 Background Agenda Objectives & Methodology The Segments Highlights of Results Questions/Discussion 2


3 Setting the Stage: What Do We Already Know About Minnesota? Among the General Population in Minnesota Participation Corporate Image Awareness Past Year 52% Positive Overall Opinion 57% Any Game 51% Past Month 29% Lottery Players are People Like Me 38% Advertising 56% Where is there Opportunity? Open to lottery 85% Morally opposed 15% 3


4 What don t we know about Minnesota? Who are the opportunity lottery players outside of the transaction? What makes them tick? The magnitude of their gambling motivations? What are their attitudes towards life? How they view technology and its role in their life? Their views on policy? What media habits do they have? 4


5 Why do we want to know? A game that appeals to this player may not at all appeal to this player An ad that drives trial for this player may not appeal to this player Reaching this player may be easy...but isn t as easy for this player You can t be everything to everyone. You want to grow the pie among those where an opportunity presents itself But which people? And how? 5
6 How Can A GamblerPlus Segmentation Help? Those not morally opposed to playing the lottery is a subset of the general population. It consists of Minnesotans aged 18+ who are open to playing the lottery. However, it is otherwise heterogeneous. Market General Population Segmentation looks for similarities between people in this market and clusters them together into different groups based on these similarities. The resulting segments are made up of people that are a lot alike internally. While individuals in each segment are similar, individuals between segments are not. Market Segments 6


7 Segmentation : How do we do it? 7 Participation Gambling Views Media towards / Habits & Lottery Spend the in Attitudes Technology towards life Lottery motivations Lottery & Gambling


8 Overview of Research 8 Phase 1: Quantitative Phase Online Survey with Minnesotans open to playing the lottery Segmentation Classification Phase 2: Qualitative Phase Mini-Groups with Each of the Segments identified in the Quantitative Phase Segment Naming
9 The Segments Nobody s Unpredictable
10 2005 Market Segments of the Adult Gaming Population in Minnesota OPTIMISTIC ENTHUSIASTS 20% Highest proportion of past year spending Passionate and optimistic Fans of the MN lottery; positive outlook on corporate image Motivated to play by the anticipation of winning a big prize. Also play because they think it is fun and entertaining Superstitious, believers in fate and generally feel lucky Daydream and are hopeful about winning big Like the act of scratching and like scratch tickets that are more involved 20% 28% 23% 15% 14% 10
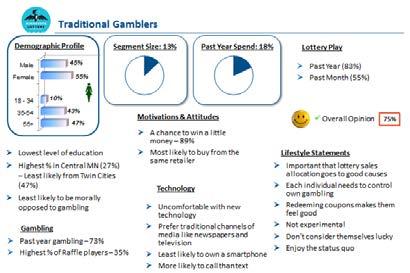
11 Demographic Profile Segment Size: 13% Past Year Lottery Players: 18% Lottery Play Male Female 45% 55% Past Year (83%) Past Month (55%) % % of Past Year Spend: 19% Gambling 43% 47% Lowest level of education Highest % in Central MN (27%) Least likely from Twin Cities (47%) Most likely to have no issues with the morality of gambling Past year gambling 73% Highest % of Raffle players 35% Motivations & Attitudes A chance to win a little money 89% Most likely to buy from the same retailer Technology Uncomfortable with new technology Prefer traditional channels of media like newspapers and television Least likely to own a smartphone More likely to call than text Overall Opinion 75% Lifestyle Statements Important that lottery sales allocation goes to good causes Each individual needs to control own gambling Redeeming coupons makes them feel good Not experimental Don t consider themselves lucky Enjoy the status quo Minnesota Gambler Plus Segmentation Report 11
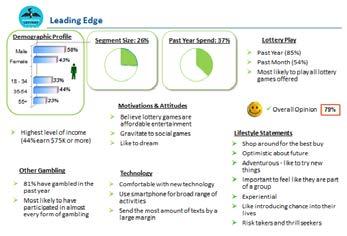
12 Leading Edge Demographic Profile Male Female % 33% Other Gambling 43% 44% 58% Highest level of income (44% earn $75K or more) 81% have gambled in the past year Most likely to have participated in almost every form of gambling Segment Size: 26% Motivations & Attitudes Believe lottery games are affordable entertainment Gravitate to social games Like to dream Technology Past Year Lottery Players : 37% with new technology Use smartphone for broad range of activities Send the most amount of texts by a large margin Lottery Play Past Year (85%) Past Month (54%) Most likely to play all lottery games offered % of Past Year Spend: 54% Lifestyle Statements Overall Opinion Shop around for the best buy Optimistic about future Adventurous - like to try new things 79% Important to feel like they are part of a group Experiential Like introducing chance into their lives Risk takers and thrill seekers Minnesota Gambler Plus Segmentation Report 12
13 2005 Market Segments of the Adult Gaming Population in Minnesota SELF-ASSURED REALISTS 28% Highest proportion of past year players, 2nd highest proportion of spending Play the lottery for entertainment 2nd most positive outlook on MN Lottery s corporate image Not risk-averse and don t look to the past or feel that everything is changing too fast today Connected highest proportion of internet access and average weekly hours spent online 20% 28% 23% 15% 14% 13
 Highest level of income Other Gambling 72% have gambled in the past year Motivations & Attitudes Most likely to be jackpot motivated Look")

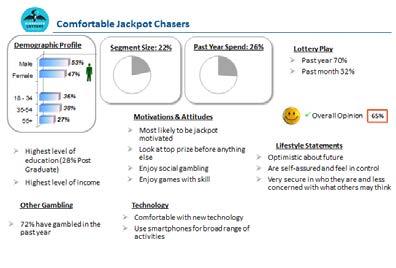
14 Jackpot Demographic Profile Male 53% Female 47% Segment Size: 22% Past Year Lottery Players: 26% Lottery Play Past year 70% Past month 32% % % of Past Year Spend: 15% % 38% Highest level of education (28% Post Graduate) Highest level of income Other Gambling 72% have gambled in the past year Motivations & Attitudes Most likely to be jackpot motivated Look at top prize before anything else Enjoy social gambling Enjoy games with skill Technology with new technology Use smartphones for broad range of activities Lifestyle Statements Overall Opinion Optimistic about future 65% Are self-assured and feel in control Very secure in who they are and less concerned with what others may think Minnesota Gambler Plus Segmentation Report 14
15 2005 Market Segments of the Adult Gaming Population in Minnesota CONFLICTED FOLLOWERS - 23% Conflicted internally - tied for the highest ratings of harm 23% of past year players and account for 15% of spending More females than males Non-initiators will play lottery games if someone else organizes the pool Feel least informed about who the lottery is and what they do 23% 20% 15% 14% 28% 15
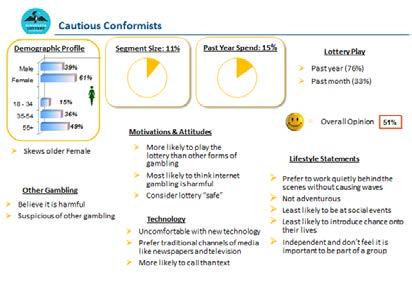
16 Demographic Profile Segment Size: 11% Past Year Lottery Players: 15% Lottery Play Male Female 39% 61% Past year (76%) Past month (33%) % % of Past Year Spend: 9% % 49% Motivations & Attitudes = Overall Opinion 51% Skews older Female Other Gambling Believe it is harmful Suspicious of other gambling More likely to play the lottery than other forms of gambling Most likely to think internet gambling is harmful Consider lottery safe Technology Uncomfortable with new technology Prefer traditional channels of media like newspapers and television More likely to call than text Lifestyle Statements Prefer to work quietly behind the scenes without causing waves Not adventurous Least likely to be at social events Least likely to introduce chance onto their lives Independent and don t feel it is important to be part of a group Minnesota Gambler Plus Segmentation Report 16
17 2005 Market Segments of the Adult Gaming Population in Minnesota 20% 28% 23% 15% 14% DABBLING CRITICS 14% Negative brand image of the lottery, see it as foolish and risky Lowest proportion of participation and spending Feel informed of who the lottery is and what they do Have a negative opinion of the lottery in general, lowest ratings on corporate image Playing the lottery is not important 17
 Other Gambling Believe it is harmful More open to other gambling than playing the lottery Motivations &")

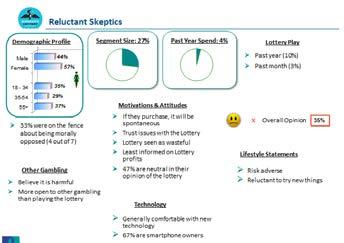
18 Reluctant Skeptics Demographic Profile Segment Size: 27% Past Year Lottery Players: 4% Lottery Play Male 44% Past year (10%) Female 57% Past month (3%) % % of Past Year Spend: 2% % 37% 33% were on the fence about being morally opposed (4 out of 7) Other Gambling Believe it is harmful More open to other gambling than playing the lottery Motivations & Attitudes If they purchase, it will be spontaneous Trust issues with the Lottery Lottery seen as wasteful Least informed on Lottery profits 47% are neutral in their opinion of the lottery Technology Generally comfortable with new technology 67% are smartphone owners x Overall Opinion 35% Lifestyle Statements Risk adverse Reluctant to try new things Minnesota Gambler Plus Segmentation Report 18
19 2005 Market Segments of the Adult Gaming Population in Minnesota 20% 28% 23% 15% 14% DISENCHANTED TRADITIONALISTS 15% Ranked second last for proportion of playing and spending Realists not dreamers, don t believe in fate Not motivated to play the lottery Live with some regret Minnesota Gambler Plus Segmentation Report 19
20 Proportion of Lottery Game Participation & Spending by Segment % of Adults % of PY Spending on Lotteries 13% 11% 26% Leading Edge Jackpot Reluctant Skeptics 19% 2% 9% 54% 28% 22% % of PY Lottery Players 15% 5% 15% % Other gaming spend 37% 20% 18% 1% 51% 4% 26% 23% Minnesota Gambler Plus Segmentation Report
21 Older Educated 65% Tech/Comm. College 19% University/Post-Grad Degree Reluctant Skeptics (avg. age 53 years) 49% 55 years + HH Income 35% $75K+ Least likely to be Highly Educated 21% High School or Less 10% University/Post-Grad Degree Oldest (avg. age 54 years) 55% 47% 55 years + HH Income 30% $75K+ 57% 61% Demographic Comparison 9% of 19% 15% Segments 34% $75K+ Older (avg. age 47 years) 37% 55 years + Leading Edge 58% Educated 74% Tech/Comm. College 14% University/ Post-Grad Degree 38% 35 to 54 years Younger (avg. age 45 years) 44% Youngest 35 to 54 years High HH Income 44% $75K+ Jackpot 53% Highly Educated (avg. age 44 years) Highly Educated 68% Tech/Comm. College 28% University/Post-Grad Degree HH Income 49% $75K+ 66% Tech/Comm. College 22% University/Post-Grad Degree 21
22 Highlights of Results Nobody s Unpredictable
23 Corporate image Nobody s Unpredictable
24 Overall Opinion of the Lottery % Negative Opinion (rated 1, 2, 3) % Neutral (rated 4) % Positive Opinion (rated 5, 6, 7) 10% Total (n=1,203) 30% 60% 8% (n=152) 17% 75% CDE 9% B 4% Leading Edge (n=316) 17% Jackpot (n=267) 26% AB 65% DE 79% CDE 8% (n=137) 41% ABC 51% E 18% ABCD Reluctant Skeptics (n=330) 47% ABC 35% Base: All respondents A1. How would you describe your overall opinion of the Minnesota Lottery on a scale from 1 to 7, where 1 means your opinion is Very Negative and 7 means your opinion is Very Positive? 24
25 Corporate Image Statements Total (Top3Box) (n=1,203) (n=152) Leading Edge (n=316) Jackpot (n=267) (n=137) Reluctant Skeptics (n=330) I know where to purchase lottery tickets 92% 96% DE 96% DE 98% DE 88% 84% Lottery games are easy to play 81% 90% DE 89% DE 88% DE 74% 68% It would be almost impossible to cheat on a lottery game The Lottery makes a positive contribution to the State of Minnesota The Minnesota State Lottery is a trustworthy organization Proceeds from the Lottery are going to worthy causes 67% 64% 62% 55% 73% DE 76% DE 77% DE 56% 51% 80% CDE 77% CDE 63% E 60% E 47% 73% DE 71% DE 64% E 55% 47% 65% DE 66% DE 58% E 49% 41% Lottery games are affordable 55% 65% DE 72% CDE 61% DE 50% E 30% Lottery games are fun and entertaining 53% 68% CDE 79% ACDE 56% DE 39% E 23% Minnesota Lottery players are people like me 42% 60% CDE 64% CDE 39% E 38% E 15% continued Base: All respondents *Statement A2. Here are added some statements Q3 13 **Statement that could be made added about Q1 the 14 Minnesota Statement Lottery. Please asked indicate March how you 13 feel only about each of these statements on a scale of 1 to 7, where 1 means you Strongly Disagree and 7 means you Strongly Agree with the statement. 25
26 Corporate Image Statements (continued) Total (Top3Box) (n=1,203) (n=152) Leading Edge (n=316) Jackpot (n=267) (n=137) Reluctant Skeptics (n=330) Playing the lottery is wasteful I worry about the people becoming addicted to lottery games Lottery games are winnable Jackpot games like Powerball are for people like me Lottery games are for people like me 41% 41% 39% 37% 37% 27% 32% 43% AB 36% 57% ABCD 29% 43% A 35% 44% A 47% AC 48% CDE 57% CDE 37% E 31% 23% 54% CDE 61% CDE 38% E 31% E 9% 55% CDE 63% CDE 36% E 30% E 8% Lottery games are social 23% 25% DE 41% ACDE 20% E 14% 11% Lottery games are confusing I would be embarrassed to be seen buying a lottery ticket 7% 13% 15% 12% 9% 15% 15% 4% 6% 7% 3% 11% ABD Base: All respondents *Statement A2. Here are added some statements Q3 13 **Statement that could be made added about Q1 the 14 Minnesota Statement Lottery. Please asked indicate March how you 13 feel only about each of these statements on a scale of 1 to 7, where 1 means you Strongly Disagree and 7 means you Strongly Agree with the statement. 26
27 Awareness of Lottery Profits Allocation Total (n=1,203) (n=152) Leading Edge (n=316) Jackpot (n=267) (n=137) Reluctant Skeptics (n=330) Yes 43% 50% E 50% E 43% E 44% E 31% No 57% 50% 50% 57% 56% 69% ABCD Base: All respondents A3. Do you know where the profits generated by the sales of lottery games are allocated? 27
28 Knowledge of How Lottery Funds Are Allocated Total (n=514) (n=75)* Leading Edge (n=158) Jackpot (n=116) (n=60)* Reluctant Skeptics (n=104) Environmental programs 82% 85% 82% 83% 78% 82% State parks and trails Programs to improve hunting and fishing Programs to help compulsive gamblers 48% 60% 69% 68% 71% 74% 61% 66% 67% 59% 61% 52% 57% 51% 56% CD 41% 37% 47% Education 32% Awareness of how the profit can 20% be improved 38% as A 34% 24% 34% Arts & culture programs A stadium for the Minnesota Vikings General support of state government 29% 27% 27% 31% 33% 22% 29% 30% 22% 33% 24% 19% 31% 22% 30% 26% 20% 31% Tax relief 9% 4% 13% A 7% 9% 10% Other Don t know 2% 1% 6% B 1% 3% 3% 1% 4% BCE * Small base size, interpret with caution. Base: Aware of Lottery Profit Allocation A4. To the best of your knowledge, how are proceeds from the Minnesota Lottery used? (Select all that apply) 28
29 Lottery Games Overview Nobody s Unpredictable
30 Unaided Awareness of Lottery Games Total (n=1,203) (n=152) Leading Edge (n=316) Jackpot (n=267) (n=137) Reluctant Skeptics (n=330) Any Game 80% 86%E 86%DE 87%DE 78%E 67% Powerball 61% 67% E 66% E 70% E 62% E 45% Gopher 5 37% 52% CDE 46% CE 34% E 39% E 23% Mega Millions Scratch games Hot Lotto Daily 3 Specific Scratch Off Game Northstar Minnesota Monopoly (unspecified) 23% 18% 11% 11% 7% 6% 4% 3% 27% E 28% E 27% E 27% E 12% 23% E 25% E 18% E 21% E 9% 20% BCE 13% E 9% 14% E 7% 14% E 14% E 12% E 10% 6% 9% DE 13% CDE 6% 2% 4% 7% E 11% CE 4% 8% E 2% 5% 4% 4% 3% 4% 1% 5% E 4% E 2% 1% Base: All respondents Note: Only mentions of 3% or more are shown. B1. Please use the text boxes below to write down which Minnesota Lottery games, if any, you are aware of. ABCDE: Group next to the letter is significantly higher than the group represented by the letter. 30
31 Awareness of Lottery Games Total (n=1,203) (n=152) Leading Edge (n=316) Jackpot (n=267) (n=137) Reluctant Skeptics (n=330) Powerball Scratch games Gopher5 MegaMillions 100% 96% 90% 90% 100% 99% 100% 100% 99% 99% E 98% E 98% E 99% E 89% 97% CE 94% E 90% E 93% E 82% 94% E 96% CE 91% E 92% E 80% Daily 3 78% 91% CDE 85% CE 76% E 81% E 66% Hot Lotto Second chance drawings for non-winning tickets Electronic scratch tickets 61% 57% 67% 81% CDE 81% CDE 64% E 68% E 49% 71% BCE 73% BCE 59% BE 66% BE 45% B 69% CDE 66% CDE 54% 53% 47% Northstar Cash Minnesota Millionaire Raffle Monopoly Millionaires Club All or Nothing Progressive Print-n-Play Games 30% 27% 37% 48% 57% Base: All respondents B2. Which of the following statements best describes your involvement with the following lottery games? - I've purchased in the past month - I've purchased in the last 12 months, but not in the past month - I've purchased, but not in the last 12 months - I've heard of this game, but never purchased it - I've never heard of this game 71% CDE 70% CDE 56% E 58% E 40% 62% CDE 62% CDE 47% E 48% E 29% 46% CDE 50% CDE 35% E 34% E 25% 37% DE 43% CDE 32% E 25% E 15% 33% CDE 44% ACDE 22% 19% 16% ABCDE: Group next to the letter is significantly higher than the group represented by the letter. 31
32 Lottery Participation Summary Have Ever Played Any Game Ever Played 84% 94% E 98% ACDE 91% E 93% E 56% Total (n=1,203) (n=152) Leading Edge (n=316) Jackpot (n=267) Comformists (n=137) Reluctant Skeptics (n=330) $ $ CD $ CD $ $ $ Adjusted mean $ last year (among PY players of any game) Base: All respondents B2. Which of the following statements best describes your involvement with the following lottery games? B3. Please enter how much you have spent on each of the following Minnesota Lottery games in the past 12 months and past 4 weeks. ABCDE: Group next to the letter is significantly higher than the group represented by the letter. 32
33 Lottery Participation Summary Lapsed Player Ever Played, But Not in the Past Year 47% ABCD 24% 11% 13% 21% AB 17% Total (n=1,203) (n=152) Leading Edge (n=316) Jackpot (n=267) Comformists (n=137) Reluctant Skeptics (n=330) Base: All respondents B2. Which of the following statements best describes your involvement with the following lottery games? B3. Please enter how much you have spent on each of the following Minnesota Lottery games in the past 12 months and past 4 weeks. ABCDE: Group next to the letter is significantly higher than the group represented by the letter. 33
34 Lottery Participation Purchased past month Purchased in last 12 months, but not past month Purchased but not last 12 months Total (n=1,203) 33% 27% 24% (n=152) Leading Edge (n=316) 55% CDE 54% CDE 28% E 31% E 11% 13% Core Players Jackpot (n=267) (n=137) 32% E 33% E 38% AE 43% ABE 21% AB 17% Infrequent Players Reluctant Skeptics (n=330) 3% 7% 47% ABCD Lapsed Players Base: All respondents B2. Which of the following statements best describes your involvement with the following lottery games? ABCDE: Group next to the letter is significantly higher than the group represented by the letter. 34
35 Proportion of Lottery Participation & Spending (n=152) 13% 18% E 19% DE Leading Edge (n=316) Jackpot (n=267) 26% AD 22% AD 26% DE 15% E 37% ACDE 54% ACDE % of adults % of past year players % of past year spending by segment (n=137) 11% 15% E 9% E Reluctant Skeptics (n=330) 4% 2% 27% AD Base: All respondents B2. Which of the following statements best describes your involvement with the following lottery games? B3. In the boxes below, please enter how much you have spent on each of the following Minnesota Lottery games in the past 12 months and past 4 weeks. ABCDE: Group next to the letter is significantly higher than the group represented by the letter. 35
36 Lotto Games Purchase Behavior Total (Top3Box) (n=636) (n=113) Leading Edge (n=243) Jackpot (n=164) (n=89)* Reluctant Skeptics (n=26)** I only buy tickets once in a while when the jackpot is very large 69% 66% 67% 74% 72% ** I am satisfied with the materials provided by my lottery retailer I usually decide to buy my lottery tickets at the last minute when I m buying something else 51% 58% 64% D 64% D 59% D 40% ** 53% 54% 52% 48% ** I enjoy the anticipation of waiting for the next draw 31% 37% CD 42% CD 21% 15% ** I regret it when I forget to buy my tickets for a specific drawing 19% 21% CD 29% CD 11% 7% ** I have a special set of numbers that I play for lottery games 16% 19% D 21% CD 12% 9% ** * Small base size, interpret with caution; ** Base too small to report. Base: Past Year Draw game players B9. Please indicate your level of agreement with the following statements about playing lottery games. ABCDE: Group next to the letter is significantly higher than the group represented by the letter. 36
37 Lottery Game Purchase Behavior Total (Top3Box) (n=715) (n=126) Leading Edge (n=268) Jackpot (n=187) (n=104) Reluctant Skeptics (n=30)** It is easy to find places that sell Minnesota Lottery games and tickets 94% 98% D 94% 94% 89% ** The store clerks are willing to check my tickets 68% 71% 73% C 61% 62% ** When I hear about someone having won something, it makes me dream about the chance to win I feel good about playing Minnesota Lottery games when I hear about people who have won even smaller prizes I enjoy talking to my friends or family about what I would do if I won the lottery 41% 38% 54% 58% C 70% ACD 39% 45% ** 48% CD 58% CD 27% 23% ** 41% D 49% CD 33% D 21% ** I always go to the same retailer to buy my tickets/play lottery games 21% 30% C 22% 16% 23% ** Seeing or hearing about lottery winners is important to my decision to play lottery games 19% 25% CD 30% CD 8% 11% ** I get uncomfortable when talking or thinking about how much I spend on Lottery tickets 6% 4% 8% 6% 4% ** I am concerned with what other people would think of me if I play the lottery 4% 1% 6% A 3% 4% ** ** Base too small to report. Base: Past Year players of Any game B9. Please indicate your level of agreement with the following statements about playing lottery games. ABCDE: Group next to the letter is significantly higher than the group represented by the letter. 37
38 Planned Lottery Purchases (n=126) Leading Edge (n=268) Jackpot (n=187) (n=104) Reluctant Skeptics (n=30)** 0% to 10% 36% 33% 37% 34% 38% ** 11% to 50% 22% 25% D 28% CD 18% 13% ** 51% to 100% 28% 33% 25% 31% 28% ** Refused 11% 6% 7% 14% B 19% AB ** I haven t bought any lottery products in the past 6 months 4% 2% 2% 4% 3% ** ** Base too small to report. Base: Past Year players of Any game B10. Think about your visits to lottery game retailers over the past 6 months where you have purchased lottery games - what percent of your visits were because you planned to buy lottery games vs. you were there to purchase other things and bought lottery games at the same time? ABCDE: Group next to the letter is significantly higher than the group represented by the letter. 38
39 I see the jackpot advertising at the store and decide to buy a ticket I go to the retailer with the intention of buying a lottery game Seeing the tickets within the store I have a few dollars left after purchasing other items I see the Scratch-off tickets and one catches my eye Seeing lottery signs within the store Seeing promotions within the store Seeing/hearing someone else buy a ticket Influencers of Lottery Game Purchases Total (Top3Box) (n=620) 29% 27% 35% 45% 44% 42% 52% 52% (n=116) Leading Edge (n=246) Jackpot (n=154) (n=85)* Reluctant Skeptics (n=20)** 52% D 63% CD 47% 38% ** 52% 58% D 49% 41% ** 42% CD 65% ACD 30% 27% ** 50% CD 63% ACD 26% 23% ** 43% CD 62% ACD 27% 21% ** 35% D 49% ACD 28% D 16% ** 22% 49% ACD 14% 12% ** 23% C 45% ACD 12% 13% ** Recall advertising Seeing/hearing someone cashing in a winning ticket Seeing tickets in a vending machine The store clerk asking me if I want to buy 25% 23% 16% 10% 25% 35% CD 15% 17% ** 23% CD 39% ACD 9% 9% ** 9% 28% ACD 9% 4% ** 8% C 17% ACD 2% 5% ** * Small base size, interpret with caution; ** Base too small to report. Base: Have purchased in past 6 months B11. How influential are the following in helping you make the decision to buy a lottery product at the retailer after you have arrived there? ABCDE: Group next to the letter is significantly higher than the group represented by the letter. 39
40 A Look at Lapsed Players Nobody s Unpredictable
41 Reasons for Lapsed Play I would rather spend my money on other forms of entertainment Total (n=488) 88% (n=26)** Leading Edge (n=49)** Jackpot (n=80)* (n=33)** Reluctant Skeptics (n=300) ** ** 85% ** 91% The odds of winning are poor 84% ** ** 82% ** 85% I don t like taking risks with my money 72% ** ** 59% ** 76% C I never win anything I don t have the extra money available The lottery Is not fun or entertaining I never hear about other people winning 58% 52% 44% 37% ** ** 64% ** 55% ** ** 42% ** 54% ** ** 34% ** 49% C ** ** 40% ** 35% I don t know how profits from the lottery are used I don t see or notice lottery games when I go to the store People like me don t play the lottery 28% 27% 26% ** ** 24% ** 28% ** ** 25% ** 28% ** ** 20% ** 30% * Small base size, interpret with caution; ** Base too small to report. Base: Have not bought any lottery games in the past year or longer B14. You have indicated that you did not play the Lottery in the past year. Below are some reasons other people like yourself have given for why they don't play the lottery. Please check off the reasons why you don't play. ABCDE: Group next to the letter is significantly higher than the group represented by the letter. 41
42 I won t play if the line is too long Reasons for Lapsed Play Continued 25% Total (n=488) (n=26)** Leading Edge (n=49)** Jackpot (n=80)* (n=33)** Reluctant Skeptics (n=300) ** ** 29% ** 24% There are too many games to choose from I like other types of gambling more than the lottery Playing the lottery is not social enough for me I d like to play, but I just never remember to 24% 22% 20% 17% ** ** 25% ** 20% ** ** 36% E ** 13% ** ** 22% ** 18% ** ** 20% ** 12% I am not sure how to play I can t use my credit card to purchase lottery games 16% 15% Stigma not an issue ** ** 12% ** 17% ** ** 15% ** 15% I don t go into stores where lottery tickets are sold I m afraid of holding up the line if I buy lottery tickets I am concerned with what other people would think of me if I play the lottery 14% 8% 5% ** ** ** ** ** ** 16% 4% 13% E ** ** ** 14% 8% 3% * Small base size, interpret with caution; ** Base too small to report. Base: Have not bought any lottery games in the past year or longer B14. You have indicated that you did not play the Lottery in the past year. Below are some reasons other people like yourself have given for why they don't play the lottery. Please check off the reasons why you don't play. ABCDE: Group next to the letter is significantly higher than the group represented by the letter. 42
43 Other Gambling Participation Nobody s Unpredictable
44 Gambling at casinos in Minnesota or neighboring states Past Year Other Gambling Participation Total (n=1,203) 28% (n=152) Leading Edge (n=316) Jackpot (n=267) (n=137) Reluctant Skeptics (n=330) 47% CDE 48% CDE 29% E 23% E 1% Purchasing raffle tickets 23% 35% DE 32% E 30% E 23% E 3% Playing Bingo Paper or electronic pulltabs 15% 15% 19% E 25% CDE 18% E 15% E 1% 16% DE 33% ACDE 15% DE 5% E Gambling at resort casinos 11% 16% DE 20% DE 14% DE 5% E 1% Fantasy sports Betting on horse racing at the race track Playing card games at locations other than a casino Sports betting 8% 8% 6% 4% 8% DE 16% ADE 12% DE 3% 1% 12% E 13% DE 11% E 6% E <1% 8% DE 8% DE 9% DE 2% 1% 6% DE 6% DE 5% E 1% Base: Spent money on [INSERT GAME] QC1. In the past 12 months, have you spent any money on any of the following activities? (Select all that apply) ABCDE: Group next to the letter is significantly higher than the group represented by the letter. 44
45 Most Recent Gambling Spending Total (Mean Spend) (n=1,203) (n=152) Leading Edge (n=316) Jackpot (n=267) (n=137) Reluctant Skeptics (n=330) Gambling at resort casinos $271.9 $304.0 $315.6 $213.3 $161.5 $25.3 Gambling at casinos in Minnesota or neighboring states $136.8 $166.3 D $153.9 CD $103.9 $85.3 $35.2 Fantasy sports Playing card games at locations other than a casino Sports betting Paper or electronic pulltabs Betting on horse racing at the race track $74.7 $60.1 $57.7 $42.3 $40.8 $45.5 $73.6 $100.2 $15.7 $25.7 $56.0 $70.5 $53.2 $75.4 $5.0 $50.7 $60.6 $61.3 $25.0 $0.0 $24.9 $47.9 $39.4 $34.2 $0.0 $43.5 $41.2 $39.9 $39.0 $2.0 Purchasing raffle tickets $26.3 $34.4 CD $26.1 $21.9 $21.8 $35.3 Playing Bingo $26.0 $26.9 $25.9 $27.1 $25.3 $15.6 Base: All respondents QC2. Thinking back to the most recent time that you did the following, how much money did you spend on betting only, not counting any money you may have won and then re-spent? ABCDE: Group next to the letter is significantly higher than the group represented by the letter. 45
46 Lifestyle And Gaming Perceptions Nobody s Unpredictable
47 Gambling Motivation Total (Top3Box) (n=914) (n=152) Leading Edge (n=316) Jackpot (n=267) (n=137) Reluctant Skeptics (n=41)** The chance to win a little bit of money 73% 89% CD 87% CD 68% D 51% ** For entertainment or fun 70% 86% CD 86% CD 64% D 49% ** When the jackpot is high 69% 68% D 82% ACD 66% D 54% ** For the anticipation of winning 62% 76% CD 82% CD 52% D 37% ** Because it s easy to play So you can dream about what you would do if you won big As part of a special occasion or evening out It s fun to gamble with friends Because you feel lucky that day 54% 49% 43% 43% 39% 71% CD 72% CD 42% 35% ** 58% CD 71% ACD 37% 27% ** 54% CD 60% CD 36% D 17% ** 52% CD 65% ACD 36% D 9% ** 46% CD 65% ACD 19% 18% ** When you have spare change 38% 39% CD 58% ACD 27% 21% ** ** Base size too small to report. Base: Have participated in gambling C3. Here are some reasons why people say they like to gamble. Please tell me how you feel about each statement, using a scale from 1 to 7, where 1 means you strongly disagree with the statement and 7 means you strongly agree with the statement. ABCDE: Group next to the letter is significantly higher than the group represented by the letter. 47
48 Gambling Motivation Continued Total (Top3Box) (n=914) (n=152) Leading Edge (n=316) Jackpot (n=267) (n=137) Reluctant Skeptics (n=41)** To support worthy causes I d rather gamble on games that require some skill For the challenge As a distraction from everyday routines It gives us something to do when we are at the bar or club Because you play in a pool or group with other people For a break in your day 37% 34% 29% 29% 28% 26% 24% 40% CD 50% CD 29% 22% ** 34% D 42% D 35% D 20% ** 38% CD 49% ACD 16% D 5% ** 53% CD 46% CD 12% 6% ** 23% CD 54% ACD 15% D 6% ** 26% D 39% ACD 21% 14% ** 33% CD 43% CD 8% 4% ** I like competing with other players 18% After you see or hear advertising 16% 16% CD 29% ACD 9% 5% ** Because you get an omen or sign that reminds you 14% 17% CD 28% ACD 4% 3% ** to play Because if you don t play, your numbers will come up 13% 14% CD 26% ACD 2% 4% ** and you ll miss your chance ** Base size too small to report. Base: Have participated in gambling C3. Here are some reasons why people say they like to gamble. Please tell me how you feel about each statement, using a scale from 1 to 7, where 1 means you strongly disagree with the statement and 7 means you strongly agree with the statement. 11% D 32% ACD 17% D <1% ** ABCDE: Group next to the letter is significantly higher than the group represented by the letter. 48
49 Policy Perceptions It s important that the money the State gets from gambling goes to a good cause Total (Top3Box) (n=1,203) 84% (n=152) Leading Edge (n=316) Jackpot (n=267) (n=137) Reluctant Skeptics (n=330) 91% CE 85% 81% 86% 81% It is up to each individual to control their own gambling 83% 90% DE 88% DE 83% E 80% 75% I m concerned that many of the people who gamble can t really afford it 57% 57% 57% 55% 49% 64% CD Gambling is an appropriate way to raise money for good causes 50% 66% CDE 67% CDE 54% DE 41% E 28% Legal gambling venues in Minnesota are operated fairly and honestly 47% Trust 58% DE 58% DE 49% DE 33% 36% I worry about people becoming addicted to gambling 44% 38% 43% 39% 45% 50% AC People who gamble and people who don t gamble are the same kinds of people 36% 39% E 41% DE 40% DE 29% 29% Base: All respondents D1. Please indicate your level of agreement with the following statements that could be made about gambling in Minnesota. ABCDE: Group next to the letter is significantly higher than the group represented by the letter. 49
50 Policy Perceptions Continued Total (Top3Box) (n=1,203) (n=152) Leading Edge (n=316) Jackpot (n=267) (n=137) Reluctant Skeptics (n=330) Gambling is an innocent form of entertainment 36% 50% CDE 49% CDE 39% DE 22% 19% Promoting gambling sends the wrong message to kids 35% 27% 30% 26% 34% 50% ABCD It s fun to gamble even when I don t win 33% 55% CDE 57% CDE 30% DE 17% E 9% Gambling is part of Minnesota life Gambling provides a good entertainment value for my dollar 27% 32% 47% CDE 43% CDE 28% E 26% 19% 50% CDE 50% CDE 22% DE 12% E 5% More controls should be placed on where and when people can gamble There is too much gambling in Minnesota 14% 14% 8% 15% A 15% A 13% 17% A 11% 12% 10% 15% 22% ABC Base: All respondents D1. Please indicate your level of agreement with the following statements that could be made about gambling in Minnesota. ABCDE: Group next to the letter is significantly higher than the group represented by the letter. 50
51 Perceptions of Harm Total (Top3Box) (n=1,203) (n=152) Leading Edge (n=316) Jackpot (n=267) (n=137) Reluctant Skeptics (n=330) Gambling or wagering money on the internet 58% 61% 53% 53% 69% BC 61% Casinos in Las Vegas 38% 31% 39% 34% 37% 46% AC Sports betting 33% 33% 30% 28% 38% 39% BC Horse track betting 30% 27% 28% 23% 31% 39% ABC Casinos in Minnesota 30% 24% 25% 28% 32% 36% ABC Pull-tabs 21% 21% 18% 15% 24% C 28% BC Lottery games with big prizes, such as Powerball 19% 13% 17% 13% 16% 30% ABCD Base: All respondents D2. The following list contains different games and gambling activities. Please indicate the level of harm you personally associate with each. ABCDE: Group next to the letter is significantly higher than the group represented by the letter. 51
52 Perceptions of Harm Continued Total (Top3Box) (n=1,203) (n=152) Leading Edge (n=316) Jackpot (n=267) (n=137) Reluctant Skeptics (n=330) Fantasy sports 17% 16% 13% 11% 29% ABC 21% BC Lottery scratch games Lottery games with smaller jackpots like Gopher 5 and Northstar Cash Playing lottery or casino games for fun on the internet (without money) Games of chance where proceeds go to churches or charities Playing Poker for fun on the internet (without money) 15% 13% 10% 9% 8% 11% 12% 14% 12% 21% ABCD 9% 12% 9% 9% 21% ABCD 9% 7% 9% 10% 15% BC 6% 10% 6% 8% 12% AC 6% 7% 5% 7% 14% ABCD Bingo 8% 9% 10% C 5% 5% 9% Base: All respondents D2. The following list contains different games and gambling activities. Please indicate the level of harm you personally associate with each. ABCDE: Group next to the letter is significantly higher than the group represented by the letter. 52
53 Attitudes Towards Life Total (Top3Box) (n=1,203) (n=152) Leading Edge (n=316) Jackpot (n=267) (n=137) Reluctant Skeptics (n=330) It s in my nature to shop around for the best buy Formal education beyond high school is essential for success today I feel optimistic about my future Redeeming coupons makes me feel good I consider myself well-informed about current events I feel comfortable with new technologies When it comes to money I try to balance potential losses and gains I don t like taking risks with my money I prefer to work quietly behind the scenes without causing waves It s more important to me to understand my inner self than it is to be rich and powerful People should have the right to do what they want to do even if it could have a negative impact on them 78% 76% 71% 70% 68% 66% 66% 59% 59% 57% 54% 78% 82% D 79% 70% 78% 78% 76% 80% D 70% 75% 69% 78% ADE 79% ADE 60% 63% 84% BCDE 75% CE 63% 67% 67% 64% 76% ADE 76% ADE 57% 61% 30% 83% ADE 89% ADE 26% 65% AD 68% D 76% CDE 66% D 53% 59% 48% 46% 54% 70% ABC 78% ABC 68% BC 51% 54% 70% BCE 60% 50% 57% 53% 57% 63% AC 54% D 59% DE 61% DE 41% 49% Base: All respondents E1. The following are some general descriptions of how different people approach life. Please indicate your level of agreement with each statement. ABCDE: Group next to the letter is significantly higher than the group represented by the letter. 53

54 Attitudes Towards Life Continued Total (Top3Box) (n=1,203) (n=152) Leading Edge (n=316) Jackpot (n=267) (n=137) Reluctant Skeptics (n=330) The most important education happens outside of school I am an adventurer I like to try new things I believe in fate some things are destined to happen People deserve to get only things they have worked for Life should be enjoyed as much as possible today without worrying about the future I often daydream about what I would do and what it would be like if I won the lottery I like to win and enjoy the feeling that I have beaten the rest of the world I often look at the past and think of things I should have said or done I enjoy introducing some element of chance into my life Change is happening too fast today I like discussions about how to spend money 52% 49% 47% 46% 46% 41% 40% 39% 37% 33% 33% 57% C 60% CD 41% 46% 53% C 31% D 73% ACDE 52% AD 19% 46% AD 60% CDE 66% CDE 33% 41% 38% 46% 57% ACDE 41% 39% 43% 54% CDE 63% CDE 37% 33% 38% 60% CDE 58% CDE 33% 36% E 26% 46% DE 59% ACDE 39% DE 17% 28% D 45% CE 49% CDE 33% 38% 32% 54% CDE 65% ACDE 34% DE 12% 17% 54% BCE 33% C 18% 55% BCE 28% C 19% 48% ACDE 34% AD 20% 30% AD Base: All respondents E1. The following are some general descriptions of how different people approach life. Please indicate your level of agreement with each statement. ABCDE: Group next to the letter is significantly higher than the group represented by the letter. 54
55 Attitudes Towards Life Continued Total (Top3Box) (n=1,203) (n=152) Leading Edge (n=316) Jackpot (n=267) (n=137) Reluctant Skeptics (n=330) I enjoy the kind of challenge where I can pit myself against the odds I often try new products before my friends and neighbors do I am generally a lucky person Things in my life are not as good as they used to be It is very important for me to feel that I am part of a group I am more experimental than traditional The things you own say a lot about how well you are doing in life I am not interested in financial gains I just try to avoid losses When I see a new brand on the shelf, I often buy it, just to see what it s like I often feel left out of decisions that affect me Most nights of the week I am out at a social event of some sort 27% 26% 26% 26% 26% 25% 24% 21% 16% 14% 7% 31% DE 49% ACDE 26% DE 8% 15% 6% 51% ACDE 31% ADE 6% 18% AD 22% 42% ACDE 21% 15% 22% 30% C 29% C 16% 35% CE 24% C 20% 37% ACDE 24% D 13% 23% D 13% 42% ACDE 27% ADE 6% 20% D 24% 37% ACDE 19% 18% 17% 25% C 25% C 14% 22% 20% 12% 30% ACDE 10% 6% 12% 15% 17% C 9% 14% 15% C 2% 15% ACDE 6% 2% 6% Base: All respondents E1. The following are some general descriptions of how different people approach life. Please indicate your level of agreement with each statement. ABCDE: Group next to the letter is significantly higher than the group represented by the letter. 55
56 Technology Nobody s Unpredictable
57 Attitudes Toward Technology Total Top3Box) (n=1,203) (n=152) Leading Edge (n=316) Jackpot (n=267) (n=137) Reluctant Skeptics (n=330) I feel comfortable with new technologies The world seems so much closer thanks to internet technology I don t want to have to think about technology, I just want it to work Internet technology is negatively impacting social interaction 62% 61% 58% 54% 26% 81% ADE 86% ADE 21% 60% AD 51% 73% ADE 69% ADE 43% 56% D 72% BCE 57% 50% 70% BCE 55% 71% BCE 52% 43% 66% BCE 52% I often seek the advice of others when it comes to technology Technology helps me gain control over my life I am more knowledgeable about technology than most people 44% 42% 41% 71% BCDE 43% C 26% 56% BCE 40% C 18% 62% ADE 56% ADE 15% 35% AD 5% 64% ADE 58% ADE 11% 35% AD Base: All respondents F1. In today s changing world, different people have different attitudes towards technology. Please indicate the level to which you agree with the following statements. ABCDE: Group next to the letter is significantly higher than the group represented by the letter. 57
58 I am concerned about using technology such as the internet for personal financial transactions Attitudes Toward Technology Continued Total (Top3Box) (n=1,203) 35% (n=152) Leading Edge (n=316) Jackpot (n=267) (n=137) Reluctant Skeptics (n=330) 55% BCE 35% C 21% 47% BCE 32% C Sometimes I feel like a slave to technology I d rather get news and information in traditional ways like newspapers and television The world would get along just fine without so much technology Others often seek my opinions about technology 33% 33% 32% 32% 41% CE 43% CE 26% 36% CE 26% 61% BCE 28% C 15% 50% BCE 33% C 48% BCDE 35% C 19% 35% C 31% C 2% 51% ADE 48% ADE 4% 27% AD I like to be the first among my group of friends to try the latest technology Technology is part of what defines my self-image 21% 19% 3% 40% ACDE 23% AD 18% AD 2% 33% ACDE 23% ADE 2% 16% AD Base: All respondents F1. In today s changing world, different people have different attitudes towards technology. Please indicate the level to which you agree with the following statements. ABCDE: Group next to the letter is significantly higher than the group represented by the letter. 58
59 Cell Phone Ownership Total (n=1,203) (n=152) Leading Edge (n=316) Jackpot (n=267) (n=137) Reluctant Skeptics (n=330) Smartphone (Net) 73% 56% 83% ADE 86% ADE 62% 67% A Android 35% 25% 42% ADE 41% ADE 24% 32% iphone 33% 27% 36% 40% ADE 27% 30% Smartphone other than iphone, Android, Blackberry 10% 6% 12% 9% 13% A 10% Blackberry 2% 1% 2% 3% 1% 1% Cellular phone (not including smart phones 27% 44% BCE 20% 17% 33% BC 30% BC I don t own a mobile phone 4% 4% 1% 2% 7% BC 7% BC Base: All respondents F2. Please indicate which products and/or services from the list below that you currently have. (Select all that apply) ABCDE: Group next to the letter is significantly higher than the group represented by the letter. 59
60 Smartphone Activities Total (n=882) (n=85)* Leading Edge (n=261) Jackpot (n=229) (n=85)* Reluctant Skeptics (n=221) Sent or received text messages Browsed the internet Sent or received Checked weather or local news Sent or received photos Got directions or mapped a location Visited social networking websites Downloaded applications (apps) other than games Downloaded or played games Downloaded or listened to music Posted photos or videos to a social network website Downloaded content from the internet Sent or received video or multimedia messages 92% 86% 85% 84% 83% 78% 68% 61% 54% 51% 48% 45% 43% 91% 89% 95% D 87% 93% 73% 89% AD 93% ADE 75% 83% 73% 88% AD 91% AD 78% 84% A 79% 87% D 88% D 71% 83% D 74% 83% 87% A 80% 82% 68% 81% AD 87% ADE 64% 74% 60% 74% AD 73% AD 56% 65% 44% 66% ADE 75% ADE 44% 55% 48% 64% ADE 56% D 42% 48% 28% 58% AD 63% ADE 30% 47% AD 40% 56% ADE 58% ADE 34% 37% 27% 49% AD 51% AD 31% 44% A 27% 45% A 54% ADE 35% 38% * Small base size, interpret with caution. Base: Currently owns a smartphone F3. Thinking about the past six months, please indicate if you personally have conducted any of the following activities using your smartphone. ABCDE: Group next to the letter is significantly higher than the group represented by the letter. 60
61 Used a mobile issued coupon or ticket Paid bills or done any other dayto-day banking online Bought or purchased something from an online retailer Participated in a loyalty program for consumer products Downloaded or watched TV/video programs Entered promotions/sweepstakes Purchased a coupon through a site such as Groupon or Dealfind Smartphone Activities Continued Checked in at locations Total (n=882) 42% 40% 35% 30% 27% 23% 20% 20% (n=85)* Leading Edge (n=261) Jackpot (n=229) (n=85)* Reluctant Skeptics (n=221) 31% 46% AD 49% ADE 26% 38% 15% 50% AD 42% AD 19% 41% AD 17% 43% AD 40% AD 18% 35% AD 17% 38% ADE 39% ADE 18% 21% 11% 37% ADE 34% ADE 9% 21% D 15% 37% ACDE 23% D 9% 15% 14% 26% ADE 24% DE 12% 15% 15% 25% DE 24% DE 7% 15% Called others using an app Clicked on a QR code Responded to a mobile promotion Checked winning lottery numbers None of the above 19% 19% 15% 11% 1% 8% 23% AD 24% AD 8% 18% AD 14% 21% D 24% AD 5% 18% D 9% 21% ADE 17% 10% 10% 16% DE 21% CDE 12% E 4% 1% 5% BE 1% 1% 2% 1% * Small base size, interpret with caution. Base: Currently owns a smartphone F3. Thinking about the past six months, please indicate if you personally have conducted any of the following activities using your smartphone. ABCDE: Group next to the letter is significantly higher than the group represented by the letter. 61
 Total (n=807) (n=78)* Leading Edge (n=233) Text 44% 43% 45% 47% 44% 42% (n=146) Leading Edge")
 (n=74)* Reluctant Skeptics (n=206) Email 21% 18% 19% 21% 21% (n=127) Reluctant Skeptics (n=308) Mean (excl. 0) 85.70 77.60 73.")
, how many text messages would you say that you send in a given week? F5.")
62 Wireless Communication Average number of text/ instant messages sent in a given week Percent of time spent calling vs. text messaging vs. ing 47% 56% BC Call 43% 39% 53% BC 49% BC Total (n=1,156) Total (n=807) (n=78)* Leading Edge (n=233) Text 44% 43% 45% 47% 44% 42% (n=146) Leading Edge (n=312) Jackpot (n=263) Mean (excl. 0) Jackpot (n=217) (n=74)* Reluctant Skeptics (n=206) 21% 18% 19% 21% 21% (n=127) Reluctant Skeptics (n=308) Mean (excl. 0) % B * Small base size, interpret with caution. Base: (varies) F4. On average (a rough estimate is fine), how many text messages would you say that you send in a given week? F5. Of all the communicating that you use your cellular phone or Smartphone for, what percentage of the time would you say that you call someone vs. text message someone vs. someone? ABCDE: Group next to the letter is significantly higher than the group represented by the letter. 62
63 Media Habits Nobody s Unpredictable
64 Media Consumption 1 Hour or More Total (n=1,203) (n=152) Leading Edge (n=316) Jackpot (n=267) (n=137) Reluctant Skeptics (n=330) Actively viewing content on the internet 98% 97% 98% 99% D 95% 98% Watch TV 96% 98% 97% 98% E 95% 93% Listen to the radio at home, at work, or in the car 92% 93% 96% DE 93% 90% 88% Reading newspapers 68% 82% BCE 70% CE 57% 81% BCE 61% Reading magazines 63% 68% E 64% 62% 71% E 58% Base: All respondents G1. In an average week, how many hours do you personally do the following? ABCDE: Group next to the letter is significantly higher than the group represented by the letter. 64
65 TV Content Total (n=1,155) (n=148) Leading Edge (n=306) Jackpot (n=263) (n=130) Reluctant Skeptics (n=308) Real-time TV 62% 75% BCE 57% 53% 69% BC 66% BC Recorded TV 21% 18% 23% E 25% AE 20% 16% Streamed TV 14% 6% 16% AD 18% AD 8% 16% AD Free downloaded shows 2% 1% 3% 2% 2% 2% Paid downloaded shows 1% <1% 2% AE 2% A 2% A 1% Base: Watch TV G2. What percentage of the time do you watch TV content using each of the following methods? Please enter the approximate percent of time for each in the boxes below. ABCDE: Group next to the letter is significantly higher than the group represented by the letter. 65
66 Ad Exposure Watch Ads on Recorded or Downloaded TV Look at Ads in Print Publications Total (n=642) 8% Total (n=956) 40% (n=75)* 8% (n=138) 38% Leading Edge (n=198) 8% Leading Edge (n=250) 31% Jackpot (n=157) 4% Jackpot (n=208) 47% B (n=65)* 11% C (n=124) 45% B Reluctant Skeptics (n=148) 11% C Reluctant Skeptics (n=236) * Small base size, interpret with caution. Base G3: Watch TV Content Using Recorded TV/ Free Downloaded/ Paid Downloaded Shows Base G4: Read Newspapers/ Magazines G3. When you watch recorded or downloaded TV, do you skip through the ads? G4. When you read magazines or newspapers, do you look at/read the printed ads? 43% B ABCDE: Group next to the letter is significantly higher than the group represented by the letter. 66
67 Awareness of Minnesota Lottery Website Aware of Site Visited Site Total (n=1,203) 80% Total (n=966) 55% (n=152) 89% DE (n=135) 69% E Leading Edge (n=316) 86% E Leading Edge (n=273) 71% CDE Jackpot (n=267) 85% E Jackpot (n=228) 58% E (n=137) 80% E (n=110) 59% E Reluctant Skeptics (n=330) 67% Reluctant Skeptics (n=220) 23% Base G5: All respondents Base G6: Aware Of Minnesota Lottery Website G5. Are you aware that the Minnesota Lottery has a website? G6. Have you ever visited the Minnesota Lottery s website? ABCDE: Group next to the letter is significantly higher than the group represented by the letter. 67
68 Social Networking Sites Registered Total (n=1,203) (n=152) Leading Edge (n=316) Jackpot (n=267) (n=137) Reluctant Skeptics (n=330) Facebook 78% 74% 85% ADE 85% ADE 70% 72% LinkedIn YouTube Google+ Twitter Pinterest 47% 41% 40% 35% 33% 35% 52% AE 58% ADE 44% 41% 25% 56% ADE 51% ADE 22% 32% D 23% 52% ADE 49% ADE 25% 37% AD 19% 45% ADE 49% ADE 18% 28% AD 27% 38% ADE 41% ADE 27% 29% Instagram 18% 6% 27% ADE 27% ADE 8% 13% A Foursquare Flickr Reddit Vimeo 7% 6% 4% 3% 12% ADE 8% A 3% A 5% A 4% 8% 6% 5% 5% 3% 5% D 5% 1% 4% <1% 5% A 3% 4% A 4% A Base: All respondents G7. Please select one response for each of the following social networking sites listed below. ABCDE: Group next to the letter is significantly higher than the group represented by the letter. 68
69 Login Frequency on Social Networking Sites Once a day or more Total Leading Edge Jackpot Reluctant Skeptics Facebook 75% 73% 79% 72% 76% 74% Reddit 64% 63% 54% 82% 66% Twitter Instagram Google+ YouTube Pinterest Foursquare 40% 40% 32% 32% 28% 23% 32% 49% 38% 27% 37% 32% 49% 33% 71% BC 48% 32% 41% CE 28% 28% 26% 23% 37% E 32% 39% 24% 17% 42% ACDE 24% 18% 25% 30% 25% 10% LinkedIn Vimeo Flickr 11% 8% 5% 9% 12% 15% D 4% 8% 16% 11% 7% 16% 4% Base: All respondents (n=varies) G8. Which of the following statements would you say best describes how often you login or check your social networking account(s)? ABCDE: Group next to the letter is significantly higher than the group represented by the letter. 69
70 Next Steps Nobody s Unpredictable


71 Next Steps Workshop Collaborative effort to bring the segments to life Tracking Incorporated in to ongoing tracking so the Lottery can monitor shifts in segment patterns and segment sizes over time Business Plan With support from Ipsos, The Lottery can use segments to target efforts and grow the business 71
Oregon State Lottery Behavior & Attitude Tracking Study
 Oregon State Lottery Behavior & Attitude Tracking Study Presentation of Findings November 2012 Wave Prepared by: Topics Covered Brief Overview of Objectives and Methodology Key Trends Related to: Attitudes
2009 New Brunswick Gambling Prevalence Study
 2009 New Brunswick Gambling Prevalence Study Prepared for: Government of New Brunswick Centennial Building P.O. Box 6000 Fredericton, NB E3B 5H1 Prepared by: TABLE OF CONTENTS EXECUTIVE SUMMARY... 1 STUDY
BCLC Employee Survey Final Report. August 31, 2016
 BCLC Employee Survey Final Report August 31, 2016 BACKGROUND AND METHODOLOGY Survey Background Canadian research indicates that gaming workers exhibit rates of problem gambling that are over three times
A Comprehensive Look at the Next Generation of Draw Games in North America. Research conducted by
 A Comprehensive Look at the Next Generation of Draw Games in North America. Research conducted by If I could show you Adds in-store value to retailers a new draw game that Projects 12-16 cents PC with
ROLLER DERBY DEMOGRAPHICS:
 ROLLER DERBY DEMOGRAPHICS: Results from the Third Annual Comprehensive Data Collection on Skaters and Fans Women s Flat Track Derby Association Published March 2012 Methodology Data for this survey were
GAMBLING BEHAVIORS AND PERCEPTIONS OF THE EFFECTS OF GAMBLING IN THE LEHIGH VALLEY 2009 SURVEY OF RESIDENTS. February 2010
 GAMBLING BEHAVIORS AND PERCEPTIONS OF THE EFFECTS OF GAMBLING IN THE LEHIGH VALLEY 2009 SURVEY OF RESIDENTS February 2010 Prepared by Michele Moser Deegan, Ph.D. Director Lehigh Valley Research Consortium
Campaign for Fairer Gambling
 FOBT Research Report 18 th June 2013 London San Francisco Los Angeles New York Singapore Hong Kong www.2cv.com Methodology and Sample Campaign for Fairer Gambling Face to face interviews were conducted
Revenue Estimating Conference Lottery Sales Executive Summary
 Revenue Estimating Conference Lottery Sales Executive Summary November 6, 2014 The Revenue Estimating Conference reviewed Lottery revenues on November 6, 2014. The total ticket sales forecast was decreased
Anatomy of a Jackpot: Characteristics of Purchasers of Large Jackpot Lottery Tickets
 Anatomy of a Jackpot: Characteristics of Purchasers of Large Jackpot Lottery Tickets The 15 th International Conference on Gambling & Risk Taking May 27-31, 2013 Todd Maki & Don Feeney 1 Although not shown
Gambling -- Final Questionnaire. For today's survey, we're asking Canadians some questions about gambling.
 Gambling -- Final Questionnaire For today's survey, we're asking Canadians some questions about gambling. Q1a. Over the past year, how often, if at all, have you yourself participated in the following
Revenue Estimating Conference Lottery Sales Executive Summary August 1, 2018
 Revenue Estimating Conference Lottery Sales Executive Summary August 1, 2018 The Revenue Estimating Conference reviewed Lottery revenues on August 1, 2018. Total ticket sales were $134.0 million over estimate
Revenue Estimating Conference Executive Summary for Lottery Ticket Sales and the EETF December 4, 2018
 Revenue Estimating Conference Executive Summary for Lottery Ticket Sales and the EETF December 4, 2018 The Revenue Estimating Conference reviewed Lottery revenues on December 4, 2018. Total ticket sales
Massachusetts State Lottery Commission Meeting
 Massachusetts State Lottery Commission Meeting Executive Director s Report Delivered by: Michael R. Sweeney April 25, 2017 Lottery Sales Update March Overall sales for March of 2017 were down $4.4 million
Gambling Involvement and Problem Gambling in Manitoba. April 2002
 Gambling Involvement and Problem Gambling in Manitoba April 2002 Gambling Involvement and Problem Gambling in Manitoba April 2002 Addictions Foundation of Manitoba David Patton, PhD David Brown, PhD Jastej
Gendered spheres of gambling in Sweden. Jessika Svensson, Phd student, Mid Sweden University and Swedish National Institute of Public Health
 Gendered spheres of gambling in Sweden Jessika Svensson, Phd student, Mid Sweden University and Swedish National Institute of Public Health Contents Analyzing the regular gamblers in Sweden from a gender
WSCGA. Understanding the member profile and their purchase behavior.
 WSCGA Understanding the member profile and their purchase behavior. 2015 Agenda Background and Key Summary What does a WSCGA Member look like? What do members think about the WSCGA? What is their recent
SAMPLE REPORT SUPPLEMENTAL REPORT
 SAMPLE REPORT SUPPLEMENTAL REPORT Handgun Consumers: An In-Depth Exploration Supplement to the Consumer Segmentation Analysis on the Commercial Firearms & Accessories Market 2017 Southwick Associates,
EXECUTIVE SUMMARY. Methods
 EXECUTIVE SUMMARY In the United States, there has been both an explosion in access to gambling, and an explosion in the senior population as the baby boom generation ages. As seniors seek out recreational
Ticket Sales. Other Income. Unclaimed Prizes. Distribution to EETF from Lottery Receipts
 LOTTERY ESTIMATING CONFERENCE, August 8, 2017 LOTTERY SALES PROJECTIONS SUMMARY Ticket Sales Dec 2016 Aug 2017 Diff. 2015-16 6063.2 6063.2 0.0 2016-17 5954.5 6157.0 202.4 2017-18 6025.0 6358.9 333.9 2018-19
STUDY BACKGROUND. Trends in NCAA Student-Athlete Gambling Behaviors and Attitudes. Executive Summary
 STUDY BACKGROUND Trends in NCAA Student-Athlete Gambling Behaviors and Attitudes Executive Summary November 2017 Overall rates of gambling among NCAA men have decreased. Fifty-five percent of men in the
Revenue Estimating Conference Lottery Sales Executive Summary
 Revenue Estimating Conference Lottery Sales Executive Summary July 14, 2014 The Revenue Estimating Conference reviewed Lottery revenues on July 14, 2014, and decreased the overall forecast from the one
Wildlife Ad Awareness & Attitudes Survey 2015
 Wildlife Ad Awareness & Attitudes Survey 2015 Contents Executive Summary 3 Key Findings: 2015 Survey 8 Comparison between 2014 and 2015 Findings 27 Methodology Appendix 41 2 Executive Summary and Key Observations
Read & Download (PDF Kindle) Lotto Wheel Five To Win
 Lotto Wheel Five To Win") Read & Download (PDF Kindle) Lotto Wheel Five To Win Fifty-three (53) first prize lotto jackpots have been won with Gail Howard's systems in pick-5 lotto games: Fantasy 5, Cash 5, Take 5, Match 5, Little
Read & Download (PDF Kindle) Lotto Wheel Five To Win Fifty-three (53) first prize lotto jackpots have been won with Gail Howard's systems in pick-5 lotto games: Fantasy 5, Cash 5, Take 5, Match 5, Little
Minnesota State Lottery Opti-Mix Study
 Minnesota State Lottery Opti-Mix Study inal Report June 2009 June 2009 Nobody s Unpredictable genda ackground & Objectives Methodology Lottery Participation Second hance rawings and Prizing Options Opti-mix
Northwest Parkland-Prairie Deer Goal Setting Block G7 Landowner and Hunter Survey Results
 Northwest Parkland-Prairie Deer Goal Setting Block G7 Landowner and Hunter Survey Results Table of Contents Public Surveys for Deer Goal Setting... 1 Methods... 1 Hunter Survey... 2 Demographics... 2 Population
Availability of Legal Gaming in Canada As of July 2006 By: Rhys Stevens, Alberta Gaming Research Institute
 Availability of Legal Gaming in Canada As of July 2006 By: Rhys Stevens, Alberta Gaming Research Institute Casino Gaming BC AB SK MB ON QC NB NS PE NL NU NT YT 1. Electronic Horse
First-Time and Repeat Angler Analysis: Key Findings & Next Steps December 11, 2013
 First-Time and Repeat Angler Analysis: Key Findings & Next Steps December 11, 2013 Stephanie Hussey, RBFF Rob Southwick, Southwick Associates RESEARCH OVERVIEW Purpose To identify and characterize first-time
Central Hills Prairie Deer Goal Setting Block G9 Landowner and Hunter Survey Results
 Central Hills Prairie Deer Goal Setting Block G9 Landowner and Hunter Survey Results Table of Contents Public Surveys for Deer Goal Setting... 1 Methods... 1 Hunter Survey... 2 Demographics... 2 Population
CITY OF VICTORIA. Campaign Plan INSPIRED COMMUNICATIONS
 CITY OF VICTORIA Campaign Plan INSPIRED COMMUNICATIONS AGENDA Preliminary Research Organizational background Communication analysis Situation analysis Research & Big Idea Methods Results Interpretation
Most hit keno numbers ohio
 content="http://dpsinfo.com/2001/teens/index.html"> Most hit keno numbers ohio Numbers Frequency Drawn ago Days ago Last Drawn Date. Numbers Frequency Drawn ago Days ago Last Drawn Date. Numbers Frequency
Video Lottery/Tourism Promotion
 1 Video Lottery/Tourism Promotion The proposed amendment to the Colorado Constitution: requires the Colorado Lottery Commission to implement a state-supervised video lottery program at specific horse and
Q1 CORPORATE REPORT July 1 September 30, October 27, 2018
 Q1 CORPORATE REPORT July 1 September 30, 2018 October 27, 2018 OVERVIEW / AGENDA State of the Lottery Summary Financial Update Sales Update Corporate Responsibility Marketing Updates Campaign Updates Game
WEEKLY SALES SUMMARY Unaudited Week Ending: 12/30/2017
 WEEKLY SALES SUMMARY Week Ending: 12/30/2017 Fiscal Year to Date Sales Comparison Through the Week Ending 12/30/2017 (18 Weeks) $ Change % Change FY 2018 to FY 2018 to FY 2018 to FY 2018 to Sales by Game
Revenue Estimating Conference Lottery Sales Executive Summary January 16, 2018
 Revenue Estimating Conference Lottery Sales Executive Summary January 16, 2018 The Revenue Estimating Conference reviewed Lottery revenues on January 16, 2018. Total ticket sales were running about $171.5
PROFIT RECALL 2 USER GUIDE
 PROFIT RECALL vbeta 2 USER GUIDE DISCLAIMER Please make sure you read this disclaimer all the way through and contact us if there is anything you don't understand before you use the contents of this guide.
I.tJ11E1?.S Eagletori Institute of Polihcs New Brunswick New Jersey / !JEhc tar-icbgcf/eagleton POLL
 background memo will appear in Sunday s Star-Ledger. Other A story based on the survey findings presented in this release and RELEASE INFORMATION RELEASE: SL/EP12-4 EP62-4) ASSOCIATE DIRECTOR FOR RELEASE:
Q2 CORPORATE REPORT October 1 December 31, January 31, 2019
 Q2 CORPORATE REPORT October 1 December 31, 2018 January 31, 2019 OVERVIEW / AGENDA State of the Lottery Summary Financial Update Sales Update Corporate Responsibility Marketing Updates Campaign Updates
MARKET SEGMENTATION PROFILE EXECUTIVE SUMMARY
 MARKET SEGMENTATION PROFILE EXECUTIVE SUMMARY February 18, 2011 Research Objectives 2 Achieving significant gains in fishing and boating participation is going to require reaching new audiences with new
Lotto Wheel Five To Win, 3rd Edition PDF
 Lotto Wheel Five To Win, 3rd Edition PDF Fifty-three (53) first prize lotto jackpots have been won with Gail Howard's systems in pick-5 lotto games: Fantasy 5, Cash 5, Take 5, Match 5, Little Lotto, Lucky
Revenue Estimating Conference Lottery Sales March 6, 2013 Executive Summary
 Revenue Estimating Conference Lottery Sales March 6, 2013 Executive Summary The Revenue Estimating Conference met concerning Lottery revenues on March 6, 2013. The conference adopted a baseline forecast
TWICE DAILY PICK-4 BRINGS YOU FUN, EXCITEMENT AND PRIZES.
 VIP Club Home Draw Games Daily Games Pick-4 PICK-4 TWICE DAILY PICK-4 BRINGS YOU FUN, EXCITEMENT AND PRIZES. CURRENT WINNING NUMBERS MIDDAY (02/12/2017) 9 2 0 7 EVENING (02/12/2017) 7 5 2 0 MIDDAY DRAW
Starting SEPTEMBER 15, 2013, Lotto 6/49 will offer players more ways to win! It will be the same game only better!
 Starting SEPTEMBER, 0, will offer players more ways to win! It will be the same game only better! RETAILER INFORMATION Hospitality Network SOMEBODY S GOING TO WIN. It could be you. The Retailer Information
FINAL REPORT December 2015
 ALTERNATIVE GOLF EXPERIENCES FINAL REPORT December 2015 BACKGROUND There are a wide variety of golf-related experiences that are off-shoots of the traditional game. Their one common thread is that their
Interactive Gambling in Australia
 Interactive Gambling in Australia Sally Gainsbury 15 th International Conference on Gambling & Risk Taking May 30, 2013 What forms of Internet gambling are legal in Australia? What forms of Internet gambling
Gambling report. Results from the 2016 Health and Lifestyles Survey
 Gambling report Results from the 2016 Health and Lifestyles Survey February 2018 ISBN: 978-0-478-44924-2 Prepared for the Health Promotion Agency by: Thewaporn (Wa) Thimasarn-Anwar, Dr Hanna Squire, Dr
YOU WILL INCREASE YOUR CHANCES OF WINNING
 DISCLAIMER: By Richard Lustig LOTTERYWINNERUNIVERSITY.COM GUARANTEEING YOU WILL INCREASE YOUR CHANCES OF WINNING USING THE SCRATCH OFF SECRETS REVEALED. THE LOTTERY IS A GAMBLE AND SHOULD BE TREATED AS
Dicey decisions. Lesson 3
 Leaps and Lesson 3 Dicey decisions SPECIFIC OUTCOMES W-6.1 Evaluate the need for balance and variety in daily activities that promote personal health W-6.4 Examine how health habits/behaviours influence
Appendix Questionnaire Screen Shots
 Appendix Questionnaire Screen Shots ALSPAC Gambling Survey This survey is designed to understand the attitudes and actions of the ALSPAC study participants towards gambling. Please answer the questions
Baseline Survey of New Zealanders' Attitudes and Behaviours towards Cycling in Urban Settings
 Baseline Survey of New Zealanders' Attitudes and Behaviours towards Cycling in Urban Settings Highlights 67% of urban New Zealanders, 18 years of age or more own or have access to a bicycle that is in
101 Ways to. Way #27 Understanding the Odds.
 101 Ways to TM Way #27 Understanding the Odds. What is PlayWise? PlayWise is a collection of tips and tools to help you make informed decisions when you play. From understanding how the games work to knowing
U.S. Bicycling Participation Study
 U.S. Bicycling Participation Study Report of findings from the 2016 survey Conducted by Corona Insights Commissioned by PeopleForBikes Released July 2017 Table of Contents Background and Objectives 3 Research
WEEKLY SALES SUMMARY Unaudited Week Ending: 12/02/2017
 WEEKLY SALES SUMMARY Week Ending: 12/02/2017 Fiscal Year to Date Sales Comparison Through the Week Ending 12/02/2017 (14 Weeks) $ Change % Change FY 2018 to FY 2018 to FY 2018 to FY 2018 to Sales by Game
WEEKLY SALES SUMMARY Unaudited Week Ending: 12/29/2018
 WEEKLY SALES SUMMARY Week Ending: 12/29/2018 Fiscal Year to Date Sales Comparison Through the Week Ending 12/29/2018 (18 Weeks) $ Change % Change FY 2019 to FY 2019 to FY 2019 to FY 2019 to Sales by Game
DOWNLOAD PDF TELEPHONE NUMBERS THAT PROVIDE THE WINNING NUMBERS FOR EACH LOTTERY.
 Chapter 1 : Most Common Winning Lottery Numbers Are Not The Best Numbers In the event of a discrepancy between the information displayed on this website concerning winning numbers and prize payouts and
LOTTERY CIRCLE MANUAL
 LOTTERY CIRCLE MANUAL ACE LEE COPYRIGHT 2016 WWW.LOTTERYCIRCLE.COM COPYRIGHT, LEGAL NOTICE AND DISCLAIMER: THE BOOK LOTTERY CIRCLE MANUAL IS COPYRIGHT 2016 BY WWW.LOTTERYCIRCLE.COM. NO PART OF THIS BOOK
The Xfinity Mobile Effect
 The Xfinity Mobile Effect Evaluating the success and competitive threat of cable companies offering wireless service ISO 20252 Certified Prepared by: Jeffrey T. Johnson jeffrey.johnson@marketstrategies.com
Daily Internet Tracking Survey Topline March 1-31 and May 2-19, 2002
 Daily Internet Tracking Survey Topline 05.24.02 March 1-31 and May 2-19, 1 Princeton Survey Research Associates for the Pew Internet & American Life Project Sample: n = 3,553 adults 18 and older Interviewing
Assessing the impact of interactive gambling and new technologies
 Assessing the impact of interactive gambling and new technologies Dr. Sally Gainsbury Centre for Gambling Education and Research, Southern Cross University 10 th European Conference on Gambling Studies
Segmentation of Current, Lapsed and Latent Golfers England Golf Annual Conference and Awards Segmentation Workshop
 Segmentation of, Lapsed and Latent Golfers England Golf Annual Conference and Awards Segmentation Workshop Hazel Fletcher April 2015 Contents Why undertake a segmentation? What will the outputs be? How
Content. Research Objectives. A Survey on Gambling Behaviours: Will you become a gambler?
 A Survey on Gambling Behaviours: Will you become a gambler? Prof. Leo Sin Yat-min Prof. Stella So Lai-man Dr. Susanna Kwok Betting Turnover ($million) 2005/06 2004/05 Horse racing 600.5 626.6 Football
Halifax Regional Municipality 2016 Heads Up Halifax Post-Campaign Study Final Report
 Halifax Regional Municipality 2016 Heads Up Halifax Post-Campaign Study Final Report March 2017 Prepared for Halifax Regional Municipality by: Background & Objectives The Halifax Regional Municipality
Lotto Winner for La Primitiva Lottery 1/10. /two-dimensional-lotto-winner-apps/lotto-winner-for-la-primitiva-lottery/
 La Primitiva two-dimensional lotto app for lottery winner Mylotto-App.com :: Powerball,Powerball winning numbers,powerball numbers,mega Millions,Mega Millions numbers,euromillions,national lottery,lottery,lotto,texas
2011 Countywide Attitudinal and Awareness Survey Results
 2011 Countywide Attitudinal and Awareness Survey Results Purpose of Study Establish baseline for measuring future performance Identify perceptions about transportation system, issues, priorities Assess
The impact of partial liberalization of internet gambling: a comparison of internet and noninternet
 Southern Cross University epublications@scu School of Tourism and Hospitality Management 2013 The impact of partial liberalization of internet gambling: a comparison of internet and noninternet gamblers
SPONSORSHIP OPPORTUNITY. 3 rd. Weekend. in April. 20 th, 21 st, 22 nd
 SPONSORSHIP OPPORTUNITY 3 rd Weekend in April 20 th, 21 st, 22 nd 2018 Proudly Ce lebrating ou r 9 7 t h A n n ua l Red Bluff Round-Up Since 1921 530.527.1000 www.redbluffroundup.com BECOME A SPONSOR OF
Lottery Master Guide PDF
 Lottery Master Guide PDF Lottery Master Guide is the most comprehensive book on scientific lottery strategy ever written. Once you apply the methods in this book, you will never look at Lotto numbers the
SPORTS BETTORS RESPONSES TO SPORTS- EMBEDDED GAMBLING PROMOTIONS: COMPARISONS AMONGST PGSI GROUPS
 1 SPORTS BETTORS RESPONSES TO SPORTS- EMBEDDED GAMBLING PROMOTIONS: COMPARISONS AMONGST PGSI GROUPS Nerilee Hing, Matt Lamont, Peter Vitartas, Elian Fink Presenter: Professor Nerilee Hing This study was
Discussion of Lottery Revenues
 The Virginia Lottery Discussion of Lottery Revenues House Appropriations Committee Paula I. Otto Executive Director, Virginia Lottery Copyright 2005, Virginia Lottery 1 Overview Update: NC Lottery impact
1999 On-Board Sacramento Regional Transit District Survey
 SACOG-00-009 1999 On-Board Sacramento Regional Transit District Survey June 2000 Sacramento Area Council of Governments 1999 On-Board Sacramento Regional Transit District Survey June 2000 Table of Contents
Running head: THE DANGERS OF GAMBLING 1. The Dangers of Gambling. Joe Student. Keiser University
 Running head: THE DANGERS OF GAMBLING 1 The Dangers of Gambling Joe Student Keiser University THE DANGERS OF GAMBLING 2 The Dangers of Gambling Gambling is legal or illegal betting. Most gambling takes
SWELOGS a longitudinal study on Gambling and Health
 SWELOGS a longitudinal study on Gambling and Health A presentation of some results based on the first data collection Ulla Romild, Ph D in Statistics Contents Gambling in Sweden Cluster Analysis The different
WEEKLY SALES SUMMARY Unaudited Week Ending: 3/31/2018
 WEEKLY SALES SUMMARY Week Ending: 3/31/2018 Fiscal Year to Date Sales Comparison Through the Week Ending 3/31/2018 (31 Weeks) $ Change % Change FY 2018 to FY 2018 to FY 2018 to FY 2018 to Sales by Game
As part of our Top Employer Strategy, we participated in 2 outside surveys to continue our efforts at becoming and remaining a Top Employer to work
 Scoreboard Measures Our Strategy As part of our Top Employer Strategy, we participated in 2 outside surveys to continue our efforts at becoming and remaining a Top Employer to work for. Results How scores
WEEKLY SALES SUMMARY Unaudited Week Ending: 11/10/2018
 WEEKLY SALES SUMMARY Week Ending: 11/10/2018 Fiscal Year to Date Sales Comparison Through the Week Ending 11/10/2018 (11 Weeks) $ Change % Change FY 2019 to FY 2019 to FY 2019 to FY 2019 to Sales by Game
MORE AMERICANS BET ON LEGALIZING SPORTS WAGERING THAN OPPOSE IT
 For immediate release: Wednesday, November 2, 2016 Contact: Krista Jenkins; kjenkins@fdu.edu 973.443.8390 Donald Hoover; dhoover@fdu.edu 609.432.7297 6 pp. MORE AMERICANS BET ON LEGALIZING SPORTS WAGERING
Massachusetts State Lottery Commission Meeting
 Massachusetts State Lottery Commission Meeting Executive Director s Report Delivered by Paul R. Sternburg December 17, 2013 1 Lottery Sales Update Lottery sales were down $30 million overall for the month
Setting. Stories of innovation.
 Setting the pace Stories of innovation. Stories of innovation from William Hill William Hill is one of the world s leading betting and gaming companies. This year we are continuing to transform the business,
WEEKLY SALES SUMMARY Unaudited Week Ending: 11/17/2018
 WEEKLY SALES SUMMARY Week Ending: 11/17/2018 Fiscal Year to Date Sales Comparison Through the Week Ending 11/17/2018 (12 Weeks) $ Change % Change FY 2019 to FY 2019 to FY 2019 to FY 2019 to Sales by Game
PATHS TO PARTICIPATION. How to help hunters and target shooters try new shooting sports activities.
 PATHS TO PARTICIPATION How to help hunters and target shooters try new shooting sports activities. Overview The purpose of this project is to help improve hunting and shooting sports marketing efforts
2020 K Street NW, Suite 410 Washington, DC (202)
") 2020 K Street NW, Suite 410 Washington, DC 20006 (202) 463-7300 Interview dates: October 24 25, 2013 Interviews: 1,008 adults CONDUCTED BY IPSOS PUBLIC AFFAIRS These are findings of an Ipsos online poll
2020 K Street NW, Suite 410 Washington, DC 20006 (202) 463-7300 Interview dates: October 24 25, 2013 Interviews: 1,008 adults CONDUCTED BY IPSOS PUBLIC AFFAIRS These are findings of an Ipsos online poll
2018 Citizen Perspectives Survey Report
 ISC: UNRESTRICTED ATTACHMENT 2 OPC2018-0977 2018 Citizen Perspectives Survey Report August 21, 2018 Presented by the Corporate Research Team Customer Service & Communications The City of Calgary Methodology
Conseil de développement économique des Territoires du Nord-Ouest Quebec Travel conversion study 2008 Report May 26, 2009
 Conseil de développement économique des Territoires du Nord-Ouest Quebec Travel conversion study 2008 Report May 26, 2009 226-388 donald street winnipeg manitoba canada R3B 2J4 204.989.8002 fax 204.989.8048
Uk49 lunch time results for Address Submit
 Uk49 lunch time results for 14 10 2017 Email Address Submit All you need to do is select up to five numbers from 1 to 49 to bet on. You can either choose your own numbers or opt for a Lucky Dip. Specify
PATHS TO PARTICIPATION. How to help hunters and target shooters try new shooting sports activities.
 PATHS TO PARTICIPATION How to help hunters and target shooters try new shooting sports activities. Overview The purpose of this project is to help improve hunting and shooting sports marketing efforts
GENERAL MATHEMATICS 3 WEEK 16 NOTES TERM 2
 GENERAL MATHEMATICS 3 WEEK 16 NOTES TERM 2 Calculating probability often involves large numbers. For example, in Lotto there are 8 145 060 combinations of 6 numbers (in Lotto you choose 6 numbers out of
Members survey August 2017
 Members survey August 2017 Background Trust launched to membership on 21 st January 2017 Membership as at 28 th August 1200 First survey to member base (more to follow) Objectives to research demographics
Connection. Ideas and Information for RETAILERS
 Connection INSIDE: Director's note and Security, page 2 Retailer of the Month, page 3 30 Year Lottery Timeline, page 4 & 5 Read to Win, page 6 New scratch tickets, page 7 Powerball Bonus Drawing, page
AHRC EQUINE INFLUENZA FORUM QHRB MARKETING CHALLENGES FACED POST EI (STATE PERSPECTIVE)?
?") AHRC EQUINE INFLUENZA FORUM QHRB MARKETING CHALLENGES FACED POST EI (STATE PERSPECTIVE)? WHAT HAPPENED TO OUR CONSUMERS? 18 to 65 year old blue collar males with a predisposition to addictive behaviours:
AHRC EQUINE INFLUENZA FORUM QHRB MARKETING CHALLENGES FACED POST EI (STATE PERSPECTIVE)? WHAT HAPPENED TO OUR CONSUMERS? 18 to 65 year old blue collar males with a predisposition to addictive behaviours:
Almost Half Say Smartphone Makers Not Doing Enough To Fight Addiction
 FOR IMMEDIATE RELEASE Almost Half Say Smartphone Makers Not Doing Enough To Fight Addiction A third say they respond to messages "within a few minutes" Toronto, January 26th - In a random sampling of public
Lottery By Patricia Wood
 Lottery By Patricia Wood If you are looking for a ebook Lottery by Patricia Wood in pdf format, then you've come to correct site. We presented utter variation of this book in txt, DjVu, PDF, epub, doc
WEEKLY SALES SUMMARY Unaudited Week Ending: 3/16/2019
 WEEKLY SALES SUMMARY Week Ending: 3/16/2019 Fiscal Year to Date Sales Comparison Through the Week Ending 3/16/2019 (29 Weeks) $ Change % Change FY 2019 to FY 2019 to FY 2019 to FY 2019 to Sales by Game
WEEKLY SALES SUMMARY Unaudited Week Ending: 3/09/2019
 WEEKLY SALES SUMMARY Week Ending: 3/09/2019 Fiscal Year to Date Sales Comparison Through the Week Ending 3/09/2019 (28 Weeks) $ Change % Change FY 2019 to FY 2019 to FY 2019 to FY 2019 to Sales by Game
GREAT LAKES EQUESTRIAN FESTIVAL 2019 SPONSORSHIP OPPORTUNITIES. Flintfields Horse Park Traverse City, Michigan July 3 - August 11
 GREAT LAKES EQUESTRIAN FESTIVAL 2019 SPONSORSHIP OPPORTUNITIES Flintfields Horse Park Traverse City, Michigan July 3 - August 11 WE BELIEVE The Great Lakes Equestrian Festival and the Morrissey Management
Cobb Community Transit
 Cobb Community Transit Ridership Survey January 2014 1 Methodology Paper survey of 315 CCT riders 165 on local routes (margin of sampling error: ± 7.6%) 150 on express routes (margin of sampling error:
British Icon Index II. How home-grown brands, industries and institutions carry the story of modern Britain to the world
 British Icon Index II How home-grown brands, industries and institutions carry the story of modern Britain to the world 2018 Foreword Highlights Over the coming months there will be countless column inches
$10 million for golf s 15-year-old Wie
 www.breaking News English.com Ready-to-use ESL / EFL Lessons $10 million for golf s 15-year-old Wie URL: http://www.breakingnewsenglish.com/0510/051007-michelle_wie-e.html Today s contents The Article
Sports in Romania. Brief Report Prepared for HyperSport & MyBike.ro Public Release February Quantix Marketing Consulting
 Sports in Romania Brief Report Prepared for HyperSport & MyBike.ro Public Release February 2009 Quantix Marketing Consulting Content Methodology Executive Summary All Sports Sports practice Sport goods
PATHS TO PARTICIPATION. How to help hunters and target shooters try new shooting sports activities.
 PATHS TO PARTICIPATION How to help hunters and target shooters try new shooting sports activities. Overview The purpose of this project is to help improve hunting and shooting sports marketing efforts
Customer Satisfaction Tracking Report 2016 Quarter 1
 Customer Satisfaction Tracking Report 2016 Quarter 1 May 2016 Prepared by: NRG Research Group Project no. 317-15-1445 Suite 1380-1100 Melville Street Vancouver, BC V6E 4A6 Table of Contents Background
South Florida Commuter Travel Survey Summary and Preliminary Results. Southeast Florida FSUTMS User Group Meeting June 1, 2012
 South Florida Commuter Travel Survey Summary and Preliminary Results Southeast Florida FSUTMS User Group Meeting June 1, 2012 Agenda Introduction Survey Design Survey Implementation Preliminary Findings