REVIEWING ILLINOIS REGIONS AND WORKFORCE AREAS
|
|
|
- Ella Atkins
- 6 years ago
- Views:
Transcription
1 REVIEWING ILLINOIS REGIONS AND WORKFORCE AREAS TO ALIGN ECONOMIC AND WORKFORCE DEVELOPMENT AND TO MEET WORKFORCE INNOVATION AND OPPORTUNITIES ACT (WIOA) REQUIREMENTS Page 1 of 62
2 WIOA REQUIREMENTS Page 2 of 62
3 WIOA The Workforce InnovaBon & Opportunity Act is the federal legislabon that has replaced the Workforce Investment Act as the basis for federally- funded workforce development services across the country Page 3 of 62
4 REGIONS UNDER WIOA Regions are 1, 2 or more Local Areas which must undertake regional planning and coordinabon efforts The Governor must develop a policy and process for idenbfying regions, which must include: ConsultaBon with the Local Boards and chief local elected officials in the local area(s); and ConsideraBon of the extent to which the local areas in a proposed region: Share a single labor market; Share a common economic development area; and Possess the Federal and non- Federal resources, including appropriate educabon and training insbtubons, to administer acbvibes under WIOA Other factors the Governor may also consider include: PopulaBon centers CommuBng pa\erns Industrial composibon Page 4 of 62
5 CURRENT STATUS Page 5 of 62
 Page")
6 Illinois currently has 22 Local Workforce Investment Areas (LWIAs) Page 6 of 62
 Page")
7 Illinois currently has 22 Local Workforce Investment Areas (LWIAs) Page 7 of 62

8 Illinois currently has 10 Economic Development Regions Page 8 of 62
9 There are only a few instances where ED Regions cross LWIA boundaries Page 9 of 62
10 There are only a few instances where ED Regions cross LWIA boundaries Page 10 of 62
11 There are only a few instances where ED Regions cross LWIA boundaries Page 11 of 62
12 There are only a few instances where ED Regions cross LWIA boundaries Page 12 of 62
13 There are only a few instances where ED Regions cross LWIA boundaries Page 13 of 62

14 There are only a few instances where ED Regions cross LWIA boundaries Page 14 of 62
15 REVISING REGIONS Page 15 of 62
16 STEP 1 IDENTIFY MULTI- COUNTY METROPOLITAN STATISTICAL AREAS FROM 2010 CENSUS REVISING REGIONS Page 16 of 62
17 REVISING REGIONS METROPOLITAN STATISTICAL AREAS (MSAs) Defined by the U.S. Office of Management & Budget MSAs are re- delineated every 10 years A core urban area, together with surrounding communibes that have a high degree of economic and integrabon with that core Based on county boundaries Economic integrabon is measured through worker commubng Bes MulBple counbes are included in an MSA if at least 25 percent of employed residents in a county commute to work in another county Page 17 of 62
18 REVISING REGIONS METROPOLITAN STATISTICAL AREAS (MSAs) Defined by the U.S. Office of Management & Budget MSAs are re- delineated every 10 years A core urban area, together with surrounding communibes that have a high degree of economic and integrabon with that core Based on county boundaries Economic integrabon is measured through worker commubng Bes MulBple counbes are included in an MSA if at least 25 percent of employed residents in a county commute to work in another county Page 18 of 62
19 REVISING REGIONS METROPOLITAN STATISTICAL AREAS (MSAs) Defined by the U.S. Office of Management & Budget MSAs are re- delineated every 10 years A core urban area, together with surrounding communibes that have a high degree of economic and integrabon with that core Based on county boundaries Economic integrabon is measured through worker commubng Bes MulBple counbes are included in an MSA if at least 25 percent of employed residents in a county commute to work in another county Page 19 of 62
20 REVISING REGIONS METROPOLITAN STATISTICAL AREAS (MSAs) MulBple- County MSAs were chosen as the inibal basis for regional designabon By definibon, they contain two or more counbes that are highly integrated economically For this reason, they should not be split up when regions are defined Other counbes may be joined to them in a region, but counbes in a mulb- county MSA should always be in the same region Page 20 of 62
21 11 MulB- County Metropolitan StaBsBcal Areas were idenbfied by the US Census Bureau, based on 2010 Census Data (and other survey data) Page 21 of 62
22 Chicago 11 MulB- County Metropolitan StaBsBcal Areas were idenbfied by the US Census Bureau, based on 2010 Census Data (and other survey data) Page 22 of 62
 Page 23 of")
23 Chicago Rockford 11 MulB- County Metropolitan StaBsBcal Areas were idenbfied by the US Census Bureau, based on 2010 Census Data (and other survey data) Page 23 of 62
24 11 MulB- County Metropolitan StaBsBcal Areas were idenbfied by the US Census Bureau, based on 2010 Census Data (and other survey data) Chicago Rockford LaSalle/Peru Page 24 of 62
25 11 MulB- County Metropolitan StaBsBcal Areas were idenbfied by the US Census Bureau, based on 2010 Census Data (and other survey data) Chicago Rockford LaSalle/Peru Rock Island Page 25 of 62
26 11 MulB- County Metropolitan StaBsBcal Areas were idenbfied by the US Census Bureau, based on 2010 Census Data (and other survey data) Chicago Rockford LaSalle/Peru Rock Island Peoria Page 26 of 62
27 11 MulB- County Metropolitan StaBsBcal Areas were idenbfied by the US Census Bureau, based on 2010 Census Data (and other survey data) Chicago Rockford LaSalle/Peru Rock Island Peoria Bloomington Page 27 of 62
 Chicago Rockford LaSalle/Peru Rock Island Peoria Bloomington Champaign Page 28")
28 11 MulB- County Metropolitan StaBsBcal Areas were idenbfied by the US Census Bureau, based on 2010 Census Data (and other survey data) Chicago Rockford LaSalle/Peru Rock Island Peoria Bloomington Champaign Page 28 of 62
29 11 MulB- County Metropolitan StaBsBcal Areas were idenbfied by the US Census Bureau, based on 2010 Census Data (and other survey data) Chicago Rockford LaSalle/Peru Rock Island Peoria Bloomington Champaign Springfield Page 29 of 62
30 11 MulB- County Metropolitan StaBsBcal Areas were idenbfied by the US Census Bureau, based on 2010 Census Data (and other survey data) Chicago Rockford LaSalle/Peru Rock Island Peoria Bloomington Champaign Springfield Charleston Page 30 of 62
31 11 MulB- County Metropolitan StaBsBcal Areas were idenbfied by the US Census Bureau, based on 2010 Census Data (and other survey data) Chicago Rockford LaSalle/Peru Rock Island Peoria Bloomington Champaign Springfield Charleston Metro East Page 31 of 62
32 11 MulB- County Metropolitan StaBsBcal Areas were idenbfied by the US Census Bureau, based on 2010 Census Data (and other survey data) Chicago Rockford LaSalle/Peru Rock Island Peoria Bloomington Champaign Springfield Charleston Metro East Carbondale Page 32 of 62
33 11 MulB- County Metropolitan StaBsBcal Areas were idenbfied by the US Census Bureau, based on 2010 Census Data (and other survey data) Chicago Rockford LaSalle/Peru Rock Island Peoria Bloomington Champaign Springfield Charleston Metro East Carbondale Page 33 of 62
34 An addibonal 22 single- county MSAs were idenbfied. Page 34 of 62
35 Although 5 of these were the single Illinois county in a mulb- state, mulb- county MSA. Page 35 of 62


36 Although 5 of these were the single Illinois county in a mulb- state, mulb- county MSA. Page 36 of 62

37 In all, 8 of the 33 Illinois MSAs were part of mulb- state, mulb- county MSAs. Page 37 of 62
38 STEP 2 ATTACH ADDITIONAL COUNTIES TO THESE MULTI- COUNTY MSAs BASED ON 20% COMMUTATION RATES INTO THOSE MSAs REVISING REGIONS Page 38 of 62
39 CounBes who export 20% or more of their workers to exisbng mulb- county MSAs are added to those MSAs Page 39 of 62
40 CounBes who export 20% or more of their workers to exisbng mulb- county MSAs are added to those MSAs Kankakee Co. is a\ached to Chicago Page 40 of 62
41 CounBes who export 20% or more of their workers to exisbng mulb- county MSAs are added to those MSAs Ogle Co. is a\ached to Rockford Page 41 of 62
42 CounBes who export 20% or more of their workers to exisbng mulb- county MSAs are added to those MSAs Fulton and Mason Cos. are a\ached to Peoria Page 42 of 62

43 CounBes who export 20% or more of their workers to exisbng mulb- county MSAs are added to those MSAs Douglas Co. Is a\ached to Champaign Page 43 of 62
44 CounBes who export 20% or more of their workers to exisbng mulb- county MSAs are added to those MSAs ChrisBan Co. Is a\ached to Springfield Page 44 of 62

45 CounBes who export 20% or more of their workers to exisbng mulb- county MSAs are added to those MSAs Washington & Greene Cos. are a\ached to Metro East Page 45 of 62
46 CounBes who export 20% or more of their workers to exisbng mulb- county MSAs are added to those MSAs Franklin, Union and Johnson Cos. are a\ached to Carbondale Page 46 of 62
47 These are the 11 augmented mulb- county MSAs that should form the basis for regional definibons Page 47 of 62
48 There are only three counbes that seem to be mis- aligned under current EDR boundaries: Page 48 of 62
49 There are only three counbes that seem to be mis- aligned under current EDR boundaries: Douglas Page 49 of 62
50 There are only three counbes that seem to be mis- aligned under current EDR boundaries: Douglas, Macoupin Page 50 of 62
51 There are only three counbes that seem to be mis- aligned under current EDR boundaries: Douglas, Macoupin & Greene Page 51 of 62

52 The Community College Districts which encompass most of these counbes also orient them towards their new EDRs Page 52 of 62

53 The result of Step 2 would be to change the Southwest and East Central EDR boundaries to include those 3 counbes Page 53 of 62
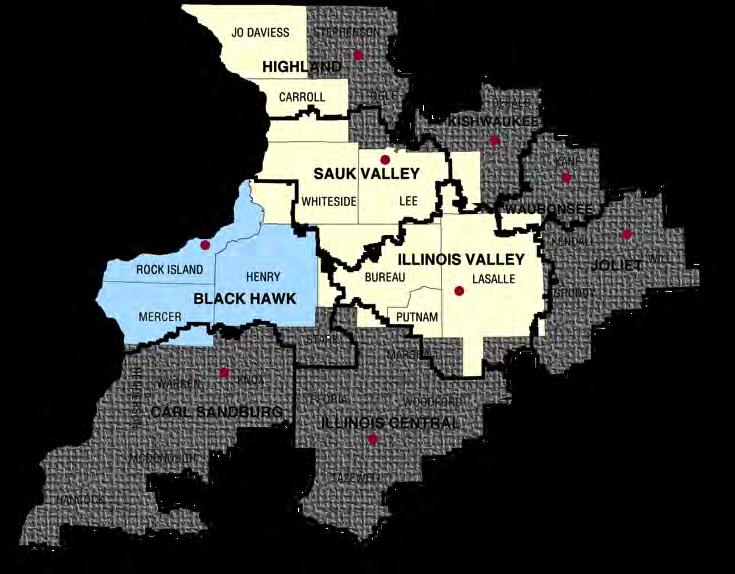
54 Overlaying the current LWIA boundaries to this inibal proposed EDR change results in this map: Page 54 of 62
55 NEXT STEPS We are asking for a team effort from: Business Development Community Development Workforce Development To lay the groundwork for the definibon and implementabon of regions and areas over the next two years Page 55 of 62
56 NEXT STEPS To idenbfy the important local and regional players across the state who should be consulted in this process To develop baseline regional analyses for idenbfied regions To map business development, community development and workforce development resources in each region Page 56 of 62

57 As an example, these are exisbng regional economic development organizabons Page 57 of 62


58 NORTHWEST ECONOMIC DEVELOPMENT REGION Page 58 of 62
59 Northwest)EDR)Counties 2013)Population) Estimates Percent)of)EDR) Population Northwest)EDR)Population) Centers 2013)Population) Estimates Percent)of)EDR) Population Bureau,,,,,,,,,, 34,056 6% Carroll,,,,,,,,,, 14,910 3% Henry,,,,,,,,,, 49,860 9% Jo,Daviess,,,,,,,,,, 22,407 4% LaSalle,,,,,,,, 112,183 20% Lee,,,,,,,,,, 34,858 6% Mercer,,,,,,,,,, 16,178 3% Putnam,,,,,,,,,,,, 5,801 1% Rock,Island,,,,,,,, 147,258 27% Whiteside,,,,,,,,,, 57,557 10% Total,Population,,,,,,,, 495,068 &510,000&& 4.36%! Moline,,,,,,,,,, 43,116 9% Rock,Island,,,,,,,,,, 38,877 8% East,Moline,,,,,,,,,, 21,360 4% Ottawa,,,,,,,,,, 18,562 4% Dixon,,,,,,,,,, 15,333 3% Sterling,,,,,,,,,, 15,152 3% Northwest&EDR&Popula<on:&1990&E&2013&!506,127!! 4.40%& Popula<on& &505,000&& &500,000&& &495,000&&!498,707!! 4.08%! 501,968! 495,068! 4.25%& 4.10%& 3.95%& Share&of&Illinois&Popula<on& 3.91%! 3.84%! &490,000&& 1990& 2000& 2010& 2013& Year& 3.80%& Popula<on& Share&of&Illinois&Popula<on& Page 59 of 62


60 Northwest"EDR"vs."Illinois"PopulaKon"by"Age:"2013"" Northwest*EDR* Percent*Foreign(Born:*2013* * NW"EDR" Ages"5318" 16.4%" Ages"19364" 59.7%" 65+"Years"Old" 18.2%" Foreign( Born* Persons* 4.2%* <"5"Years"Old" 5.7%" Illinois:*13.9%* Illinois" <"5"Years"Old" 6.2%" Ages"5318" 17.3%" Ages"19364" 63.0%" 65+"Years"Old" 13.5%" Northwest'EDR' Percent'with'Language'Other'Than' English'Spoken'At'Home:'2013' ' Northwest(EDR( Veterans:(2013( ( Veterans( (42,008(( 8.5%( Illinois:'21.0%' Language' Other' Than' English' Spoken'At' Home' 7.2%' Illinois:(5.7%( Page 60 of 62


61 Northwest$EDR$vs.$Illinois$ Age$25+$PopulaLon$by$EducaLonal$AOainment:$2013$$ NW$EDR$ Not$HS$Grad$ 13.3%$ HS$Grad$ 68.6%$ Bachelor's$or$Higher$ 18.1%$ Illinois$ Not$HS$Grad$ 12.7%$ HS$Grad$ 55.9%$ Bachelor's$or$Higher$ 31.4%$ Northwest'EDR'vs.'Illinois'Median' Household'Income:'2013' $50,279' $57,792' Northwest'EDR' Percent'Below'Poverty'Level:'2013' ' Persons' Below' Poverty' Level' '59,723'' 12.1%' $0# $10,000# $20,000# $30,000# $40,000# $50,000# $60,000# Northwest'EDR' Illinois' Illinois:'14.1%' Page 61 of 62

62 Page 62 of 62
FY ' 04 Apiary Inspection Report Illinois Department of Agriculture (July 1, 2003 through June 30, 2004)
") FY ' 04 Apiary Inspection Report Illinois Department Agriculture (July 1, 2003 through June 30, 2004) The Apiary Inspection Section the Illinois Department Agriculture administers the Illinois Bees and
FY ' 04 Apiary Inspection Report Illinois Department Agriculture (July 1, 2003 through June 30, 2004) The Apiary Inspection Section the Illinois Department Agriculture administers the Illinois Bees and
FY ' 06 Apiary Inspection Report Illinois Department of Agriculture (July 1, 2005 through June 30, 2006)
") FY ' 06 Apiary Inspection Report Illinois Department of Agriculture (July 1, 2005 through June 30, 2006) The Apiary Inspection Section of the Illinois Department of Agriculture administers the Illinois
FY ' 06 Apiary Inspection Report Illinois Department of Agriculture (July 1, 2005 through June 30, 2006) The Apiary Inspection Section of the Illinois Department of Agriculture administers the Illinois
Population Change during Trying Times: Illinois New Demographic Reality
 Change during Trying Times: Illinois New Demographic Reality Dr. Matthew Hall IGPA Faculty Member Assistant Professor of Sociology, University of Illinois at Chicago Highlights 1. Illinois grew by 411,399
Pasture Cash Rental Rates
 $/acre Pasture Cash Rental Rates One of the most common questions fielded by Extension pertains to rental rates. In Illinois, pasture land can be variable not just county to county, but also farm to farm.
ILLINO PRODUCTION NOTE. University of Illinois at Urbana-Champaign Library Large-scale Digitization Project, 2007.
 ILLINO S UNIVERSITY OF ILLINOIS AT URBANA-CHAMPAIGN PRODUCTION NOTE University of Illinois at Urbana-Champaign Library Large-scale Digitization Project,. ADMINISTRATIVE REPORT HUNTER ACTIVITY AND WILDLIFE
Jackson, TN MSA 64,810 62,540 2, Johnson City-Kingsport-Bristol, TN-VA CSA 230, ,020 7,
 Labor Force Estimates - United States & Tennessee Release: 1:30 PM CT on 12/27/2018 November, 2018 preliminary Oct. '18 revised Nov. '17 Seasonally Adjusted* Labor Force Employed Unemployed Rate Rate Change
HEALTH INSURANCE COVERAGE STATUS American Community Survey 1-Year Estimates
 S2701 HEALTH INSURANCE COVERAGE STATUS 2014 American Community Survey 1-Year Estimates Supporting documentation on code lists, subject definitions, data accuracy, and statistical testing can be found on
New Data for Vermont and our Communities: A Focus on Programs of the U.S. Census Bureau Town Officer Education Seminars uvm.
 New Data for Vermont and our Communities: A Focus on Programs of the U.S. Census Bureau 2011 Town Officer Education Seminars Our Focus Today Accessing the Data Target to serve 2010 Census and ACS 5 year
The Illinois DA List
 Brad Paisley Christian County Courthouse, 101 South Main Taylorville, IL 62568 Phone (217) 824-4747 Fax (217) 824-4815 Brian J. Towne Lasalle County 707 East Etna Road, Rm. 251 Ottawa, IL 61350 Phone (815)
Future of Housing Trends and the Housing Market Demographic Waves in the Region and Future of Housing. Illinois Finance Forum January 25, 2019
 Future of Housing Trends and the Housing Market Demographic Waves in the Region and Future of Housing Illinois Finance Forum January 25, 2019 Millions OUR STATE S POPULATION 2000-2017 13.0 12.4 M 12.9
JERRY D. PARRISH, PH.D. Chief Economist Florida Chamber
 JERRY D. PARRISH, PH.D. Chief Economist Florida Chamber Foundation jparrish@flfoundation.org @DrJerryParrish 2007 2007 2014 US versus Florida Coincident Indicators 190 180 170 160 150 140 130 120 110 100
Appendix C. Corridor Spacing Research
 Appendix C. Corridor Spacing Research Task 3 of the Twin Cities Bicycle Study called for the development of bicycle corridor spacing guidelines. This section summarizes research of the spacing of planned
Population workforce, and employment in Florida :
 University of South Florida Scholar Commons College of Business Publications College of Business 1-1-2000 Population workforce, and employment in Florida : 1999-2000 University of South Florida. Center
Changing Commuting Patterns and Impacts on Planning & Infrastructure. William E. Frawley, AICP Texas A&M Transportation Institute October 3, 2013
 Changing Commuting Patterns and Impacts on Planning & Infrastructure William E. Frawley, AICP Texas A&M Transportation Institute October 3, 2013 Change is Constant... Various studies and data sources 1960
Kansas City Metro Transportation Snapshot Data for the transportation planning boundary
 Kansas City Metro Transportation Snapshot Data for the transportation planning boundary Total eight-county population: 1,993,490 KS counties: 861,450 MO counties: 1,132,040 Miami: 32,964 Leavenworth: 80,204
Zions Bank Economic Overview
 Zions Bank Economic Overview Kenworth National Dealers Conference November 8, 2018 1 National Economic Conditions 2 Volatility Returns to the Stock Market 27,000 Dow Jones Industrial Average October 10,
INDUSTRIAL / OFFICE AREA INVENTORY
 ALL NEW Kankakee County INDUSTRIAL / OFFICE AREA INVENTORY 2005 Technical Study 1B Table of Contents Table of Contents..I Forward...II Introduction.III Industrial Park location Map..IV Industrial & Office
INTERSECTIONS. Metro Denver 2016 Economic Forecast January 2016
 INTERSECTIONS Metro Denver 2016 Economic Forecast January 2016 Employment Intersections Employment growth and Great Recession recovery Industry clusters Average annual salary Photo Credit: istockphoto
Missing Opportunities: Racial and Ethnic Disparities in the Twin Cities Metro in 2016
 New MetroStats Missing Opportunities: Racial and Ethnic Disparities in the Twin Cities Metro in 2016 10/2/2017 Community Development Committee What s New American Community Survey data released (9/14)
2014 Economic Indicators, Trends & Observations. 51 South Main Street Janesville, WI P F RockCountyAlliance.
 2014 Economic Indicators, Trends & Observations 51 South Main Street Janesville, WI 53545 P.608.757.5598 F.608.757.5586 RockCountyAlliance.com Indicators, Trends & Observations National Level State of
Zions Bank Economic Overview
 Zions Bank Economic Overview Intermountain Credit Education League May 10, 2018 Dow Tops 26,000 Up 48% Since 2016 Election Jan 26, 2018 26,616 Oct 30, 2016 17,888 Source: Wall Street Journal Dow Around
NC Demographic Trends Through 2035
 NC Demographic Trends Through 2035 Joint Appropriation Committee on Transportation February 21, 2017 Rebecca Tippett, PhD Director, Carolina Demography July 1 Population (Millions) North Carolina s Total
Demographic Change in North Carolina
 Demographic Change in North Carolina 5 Trends to Watch North Carolina Aggregates Association June 29, 2017 Rebecca Tippett, PhD Director, Carolina Demography July 1 Population (Millions) North Carolina
A Comparison of Highway Construction Costs in the Midwest and Nationally
 A Comparison of Highway Construction Costs in the Midwest and Nationally March 20, 2018 Mary Craighead, AICP 1 INTRODUCTION State Departments of Transportation play a significant role in the construction
Analyzing Traffic Engineering Problems in Small Cities D onald S. Berry
 Analyzing Traffic Engineering Problems in Small Cities D onald S. Berry Director, Traffic and Transportation Division National Safety Council Chicago, Illinois According to the Public Roads Administration,
Economic Update Edward Seiler NH&RA
 Economic Update Edward Seiler NH&RA 2 Annual Real GDP Growth (%) 5.0 4.0 Actual (BEA) Forecast (CBO in red, OMB red + orange) 3.0 2.0 1.0 0.0-1.0 1990 1991 1992 1993 1994 1995 1996 1997 1998 1999 2000
Guidelines for Providing Access to Public Transportation Stations APPENDIX C TRANSIT STATION ACCESS PLANNING TOOL INSTRUCTIONS
 APPENDIX C TRANSIT STATION ACCESS PLANNING TOOL INSTRUCTIONS Transit Station Access Planning Tool Instructions Page C-1 Revised Final Report September 2011 TRANSIT STATION ACCESS PLANNING TOOL INSTRUCTIONS
PHILADELPHIA HOUSE PRICE INDICES
 PHILADELPHIA HOUSE PRICE INDICES February 13, 2017 KEVIN C. GILLEN, Ph.D. Kevin.C.Gillen@Drexel.edu Disclaimers and Acknowledgments: The Lindy Institute for Urban Innovation at Drexel University provides
On The Road Again CLAREMORE INDUSTRIAL PARK COMMUTING STUDY
 On The Road Again CLAREMORE INDUSTRIAL PARK COMMUTING STUDY 2 On The Road Again Overview of Study Every day, almost 2,000 people go to work at the Claremore Industrial Park. The park is located in Rogers
FINAL Tax Computation Report Livingston County
 Tax Year: 217 Taxing District J55 - PARKLAND CC 55 Equalization Factor 1. EAV Rate Setting EAV PTELL Values 41,964,163 2,736,622 41,821,16 2,687,819 Commercial 6,746,951 6,525,45 Industrial 1,89,115 1,89,115
Zions Bank Economic Overview
 Zions Bank Economic Overview Veteran Owned Business Conference May 11, 2018 Dow Tops 26,000 Up 48% Since 2016 Election Jan 26, 2018 26,616 Oct 30, 2016 17,888 Source: Wall Street Journal Dow Around Correction
Labor Force Estimates - United States & Tennessee. Labor Force Estimates - Combined Statistical Areas (CSA)
") Labor Force Estimates - United States & Tennessee Seasonally Adjusted* UNITED STATES 153,716,000 142,099,000 11,616,000 7.6% 7.2% 0.4% 4.9% 2.7% TENNESSEE 3,035,200 2,773,400 261,800 8.6% 7.6% 1.0% 5.3%
Labor Force Estimates - United States & Tennessee Seasonally Adjusted* UNITED STATES 153,716,000 142,099,000 11,616,000 7.6% 7.2% 0.4% 4.9% 2.7% TENNESSEE 3,035,200 2,773,400 261,800 8.6% 7.6% 1.0% 5.3%
Northwest Economic Research Center College of Urban and Public Affairs Forecast Breakfast Economic Outlook
 Northwest Economic Research Center College of Urban and Public Affairs 2019 Forecast Breakfast Economic Outlook 1/10/2019 2 U.S. ECONOMY 1/10/2019 3 1980 1982 1984 1986 1988 1990 1992 1994 1996 1998 2000
Community Forum Scottsbluff
 Community Forum Scottsbluff Jerry Deichert Center for Public Affairs Research University of Nebraska at Omaha December 3, 2013 State Population Summary In 2010, Nebraska had a population count of 1,826,341
What HQ2 Finalist Cities Think about Amazon Moving to Town. Table of Contents
 What HQ2 Finalist Cities Think about Amazon Moving to Town Survey of Adult Residents in U.S. Finalist MSAs In Partnership with the Business Journals March 30 th April 3 rd, 2018 Table of Contents SURVEY
Life Transitions and Travel Behaviour Study. Job changes and home moves disrupt established commuting patterns
 Life Transitions and Travel Behaviour Study Evidence Summary 2 Drivers of change to commuting mode Job changes and home moves disrupt established commuting patterns This leaflet summarises new analysis
Blue Ribbon Commission Report Recommendations on Pedestrian and Bicycle Infrastructure Improvements
 Recommendations on Pedestrian and Bicycle Infrastructure Improvements July 2017 Plan Development: Our committee consisted of seven individuals appointed by the Mayor and Village Board. Those members included:
PHILADELPHIA HOUSE PRICE INDICES
 PHILADELPHIA HOUSE PRICE INDICES July 20, 2017 KEVIN C. GILLEN, Ph.D. Kevin.C.Gillen@Drexel.edu Disclaimers and Acknowledgments: The Lindy Institute for Urban Innovation at Drexel University provides this
Leasing and Sales Book COLEMAN S CROSSING. Marysville, Ohio
 Leasing and Sales Book COLEMAN S CROSSING Marysville, Ohio Coleman s Crossing 339-555 Coleman s Crossing Blvd. Marysville, Ohio TABLE OF CONTENTS OVERVIEW 1 Property Profile Available Outlots Available
2016 Special Mercury Advisory
 2016 Special Mercury Advisory Water Fish Species Size Women beyond childbearing age and males more than 15 years old Pregnant or nursing women, women of childbearing age, and children less than 15 years
Sport Fishing Expenditures and Economic Impacts on Public Lands in Oregon
 Sport Fishing Expenditures and Economic Impacts on Public Lands in Oregon For: Northwest Sportfishing Industry Association By: Southwick Associates October 2013 PO Box 6435 Fernandina Beach, FL32035 Tel
NC Demographic Trends Through 2035
 NC Demographic Trends Through 2035 House Select Committee on Strategic Transportation Planning and Long Term Funding Solutions February 22, 2016 Rebecca Tippett, University of North Carolina July 1 Population
BIKE TRANSIT INTEGRATION IN NORTH AMERICA. John Pucher & Ralph Buehler
 BIKE TRANSIT INTEGRATION IN NORTH AMERICA John Pucher & Ralph Buehler Synergies: Bicycling and Public Transport: Perfect Together? Cycling extends catchment areas of transit stops far beyond walking range
Growth, Innovation, and the Future of the Arizona Economy. Michael Crow Arizona State University December 21, 2016
 Growth, Innovation, and the Future of the Arizona Economy Michael Crow Arizona State University December 21, 2016 Billions Arizona Gross Domestic Product, 2005-2016 $280 $275 $270 $265 $260 $255 $250 $245
Bottineau Transitway Health Impact Assessment Summary
 December 2013 Hennepin County Bottineau Transitway Health Impact Assessment Summary Prepared by Crystal Myslajek Overview of the Bottineau Transitway The Bottineau Transitway (METRO Blue Line extension)
Corporate Bicycle Engagement & Strategy
 July 11, 2012 Corporate Bicycle Engagement & Strategy Wrap Up: Bike to Work 2012 (Jessica Zenk) o Bike to Work Day & Month in Santa Clara & San Mateo CounBes o Member Company Engagement o Feedback: What
Technical Report. Crime and Victimization in the Three Largest Metropolitan Areas, Bureau of Justice Statistics
 U.S. Department of Justice Office of Justice Programs Bureau of Justice Statistics Technical Report March 2, NCJ 287 Crime and Victimization in the Three Largest Metropolitan Areas, 198-98 By Janet L.
NOTES FROM JUNIOR COUNCIL ORIENTATION SESSION HELD ON MONDAY, JANUARY 22, 2018, AT 3:30 PM IN COUNCIL CHAMBERS, CITY HALL
 CITY OF KAMLOOPS Junior Council Meeting Agenda March 12, 2018, at 3:30 pm in Council Chambers, 7 Victoria Street West, Kamloops, BC Page 1. APPROVAL OF THE AGENDA 2. MINUTES Attachment Recommendation:
METRO Now. Transit Leader. One of only four urban. gain bus ridership in Purple and Green Lines. Red Line is one
 Transit Leader Our commuter buses provide 8 million trips each year third most trips of any U.S. transit agency. 1 One of only four urban transit agencies in the country to gain bus ridership in 2016 2
2016 IHDA Opportunity Areas (October 2015) County Census Tract (if Applicable) Expiration Year COOK
 County Census Tract (if Applicable) Expiration Year COOK") AHPAA 17031802900 2018 17031803005 2018 17031803500 2018 17031803901 2018 17031805107 2018 17031803008 2019 Arlington Heights 17031803012 2019 17031803400 2019 17031802801 2019 17031803016 2019 17031803017
AHPAA 17031802900 2018 17031803005 2018 17031803500 2018 17031803901 2018 17031805107 2018 17031803008 2019 Arlington Heights 17031803012 2019 17031803400 2019 17031802801 2019 17031803016 2019 17031803017
FACTS AND FIGURES: MAKING THE CASE FOR COMPLETE STREETS IN LEE COUNTY
 FACTS AND FIGURES: MAKING THE CASE FOR COMPLETE STREETS IN LEE COUNTY Safety: Close to 5,000 pedestrians and bicyclists die each year on U.S. roads, and more than 70,000 are injured. [Mean Streets, Surface
EXISTING CONDITIONS 2017
 WHAT IS INDY MOVES? Indy Moves will connect Indianapolis transportation goals, plans, and projects into an integrated mobility future. A coordinated effort of city departments and the metropolitan planning
Sport Fishing Expenditures and Economic Impacts on Public Lands in Washington
 Sport Fishing Expenditures and Economic Impacts on Public Lands in Washington For: Northwest Sportfishing Industry Association By: Southwick Associates Released June 2015 PO Box 6435 Fernandina Beach,
TR NEWS. Public Health and Transportation. Innovation, Intervention, and Improvements NUMBER 299 SEPTEMBER OCTOBER 2015
 TR NEWS NUMBER 299 SEPTEMBER OCTOBER 2015 Public Health and Transportation Innovation, Intervention, and Improvements Public Health and Transportation Measuring the Health Benefits of Walking and Bicycling
APPENDIX A COUNTY-LEVEL HOUSING CHARACTERISTICS IN 2000
 APPENDIX A COUNTY-LEVEL HOUSING CHARACTERISTICS IN 2000 Overview There are 67 counties in Pennsylvania, some of which are urban and others rural. Pennsylvania is home to the major cities of Philadelphia
Typical Rush Hour Commute. PennyforTransportation.com
 Typical Rush Hour Commute In the News Overview of the Plan Collaborative plan with projects in every community Prioritizing connectivity and congestion relief Dedicated transportation-specific funding;
Measuring and Communicating Mobility:
 Measuring and Communicating Mobility: The District Mobility Project Stephanie Dock, District Department of Transportation TRB Transportation Issues in Major Cities Committee May 2, 2017 Deconstructing
Understanding the Pattern of Work Travel in India using the Census Data
 Understanding the Pattern of Work Travel in India using the Census Data Presented at Urban Mobility India Hyderabad (India), November 5 th 2017 Nishant Singh Research Scholar Department of Civil Engineering
TRAFFIC IMPACT ANALYSIS
 TRAFFIC IMPACT ANALYSIS FOR THE CHAMPAIGN UNIT#4 SCHOOL DISTRICT PROPOSED HIGH SCHOOL (SPALDING PARK SITE) IN THE CITY OF CHAMPAIGN Final Report Champaign Urbana Urbanized Area Transportation Study 6/24/2014
Westmead Innovation Precinct
 Westmead Innovation Precinct Graeme Loy A/Chief Executive Western Sydney Local Health District 16 November 2018 Westmead Innovation Precinct Westmead: our place in western Sydney Westmead Innovation Precinct:
JOINT INDUSTRY FORECAST
 JOINT INDUSTRY FORECAST January 2018 10-YEAR GOALS NET NEW JOBS CAPITAL INVESTMENT PER CAPITA INCOME Current: 144,599 Current: $8.9B Current: 24.4% Goal: 150,000 Pace: 184,594 Goal: $8B Pace: $11.1B Goal:
HOW UNINSURED RATES IN TENNESSEE COUNTIES VARY BY EMPLOYMENT AND INCOME
 HOW UNINSURED RATES IN TENNESSEE COUNTIES VARY BY EMPLOYMENT AND INCOME Some Tennesseans are more likely to have health insurance than others. Age, income, education, and race/ethnicity are a just few
Center for Urban Studies. Population Briefs
 Center for Urban Studies Population Briefs June 2001 This is the first in a series of population briefs that the Center for Urban Studies will be issuing on the 2000 Census. Future reports will detail
The Texas Gulf Coast Overview and Outlook
 The Texas Gulf Coast Overview and Outlook Jesse Thompson Federal Reserve Bank of Dallas Houston Branch 06/2018 The views expressed in this presentation are strictly those of the presenter and do not necessarily
BID Strategy Group and Stakeholders Meeting. April 17, 2018
 BID Strategy Group and Stakeholders Meeting April 17, 2018 Agenda Meeting Objectives Background Short-Term Improvements Long-Term Study Goals Data Review Schedule & Next Steps Open House April 17, 2018
Transportation 2040 Update: Travel Trends. Transportation Policy Board June 9, 2016
 Transportation 2040 Update: Travel Trends Transportation Policy Board June 9, 2016 2 Today s Discussion How has travel behavior changed? How are we growing and how has that affected our travel patterns?
REGIONAL HOUSEHOLD TRAVEL SURVEY:
 Defining the Vision. Shaping the Future. REGIONAL HOUSEHOLD TRAVEL SURVEY: Profile Why we travel How we travel Who we are and how often we travel When we travel Where we travel How far and how long we travel
Natick Comprehensive Master Plan PHASE I COMMUNITY MEETING. November 29, 2016
 Natick 2030+ Comprehensive Master Plan PHASE I COMMUNITY MEETING November 29, 2016 Tonight s Agenda Project Introduction Breakout group discussion of vision & goals: Land Use, Housing & Economic Development
University of Victoria Campus Cycling Plan Terms of Reference. 1.0 Project Description
 University of Victoria Campus Cycling Plan Terms of Reference 1.0 Project Description The Campus Cycling Plan, a first for the University, will provide a comprehensive and coordinated approach to support
OLDER PEDESTRIANS AT RISK
 OLDER PEDESTRIANS AT RISK A TEN-YEAR SURVEY AND A LOOK AHEAD August 0 The population of older adults is growing in the U.S. and in the tri-state region. According to AARP, one in three Americans is now
North Carolina Competitiveness
 ted@econleadership.com North Carolina Competitiveness NC 200,000 180,000 160,000 140,000 120,000 100,000 80,000 60,000 40,000 20,000 0 The Punch Job Change 1990 to 2012 182,905 The loss of about 8 of our
Non-motorized Transportation Planning Resource Book Mayor s Task Force on Walking and Bicycling City of Lansing, Michigan Spring 2007 pg.
 Non-motorized Transportation Planning Resource Book pg. 105 of 158 Non-motorized Transportation Planning Resource Book pg. 106 of 158 Non-motorized Transportation Planning Resource Book pg. 107 of 158
B. STUDY AREA OVERVIEW
 B. STUDY AREA OVERVIEW 1. Project Location The project is located in northeastern Illinois in Kankakee County to the south of Chicago as shown in Figure 1. The primary transportation network in Kankakee
ADOT Statewide Bicycle and Pedestrian Program Summary of Phase IV Activities APPENDIX B PEDESTRIAN DEMAND INDEX
 ADOT Statewide Bicycle and Pedestrian Program Summary of Activities APPENDIX B PEDESTRIAN DEMAND INDEX May 24, 2009 Pedestrian Demand Index for State Highway Facilities Revised: May 29, 2007 Introduction
Tulsa Metropolitan Area LONG RANGE TRANSPORTATION PLAN
 Tulsa Metropolitan Area LONG RANGE TRANSPORTATION PLAN Indian Nations Council of Governments August 2005 CONTACTING INCOG In developing the Destination 2030 Long Range Transportation Plan, INCOG s Transportation
What if YOU could help plan Northern Virginia s transportation future?
 What if YOU could help plan Northern Virginia s transportation future? Photo credits: Washington Metropolitan Area Transit Authority And improve the quality of life in your community -- for yourself, your
Bike Share Social Equity and Inclusion Target Neighborhoods
 Bike Share Social Equity and Inclusion Target Neighborhoods Target Neighborhoods West End/Visitation Park/Academy/Hamilton Heights Wellsgoodfellow/Kingsway West The Ville/Greater Ville Kingsway East/Fountain
APPENDIX M FOR THE JEFFERSON COUNTY PORTION OF THE VISION 2050 PLAN RECOMMENDATIONS MILWAUKEE URBANIZED AREA INTRODUCTION
 INTRODUCTION Following the 2010 U.S. Census, 70 the Milwaukee urbanized area boundary extends beyond the Southeastern Wisconsin Region across the boundary line between Waukesha and Jefferson Counties,
2017 Nebraska Profile
 2017 Nebraska Profile State, 9 NEW Regions, 93 Counties, plus 31 Cities Three Volumes Demographic Change in the State Economic Influences at Work Housing Statistics and Trends Summary of Findings Discuss
2015 Polychlorinated Biphenyl (PCB), Chlordane and Dioxin Fish Advisory
, Chlordane and Dioxin Fish Advisory") 2015 Polychlorinated Biphenyl (PCB), Chlordane and Dioxin Fish Advisory Water Fish Species 1 meal/week 1 meal/month 6 meals/year Do Not Eat Border Waters *Lake Michigan (P) Cook and Lake counties Brown
2015 Polychlorinated Biphenyl (PCB), Chlordane and Dioxin Fish Advisory Water Fish Species 1 meal/week 1 meal/month 6 meals/year Do Not Eat Border Waters *Lake Michigan (P) Cook and Lake counties Brown
The Economic Status of Women in the U.S. What Has Changed in the Last Years
 The Economic Status of Women in the U.S. What Has Changed in the Last 20 40 Years March 28, 2018 Heidi Hartmann, Ph.D. President, IWPR Scholar in Residence, American University Editor, Journal of Women,
NACTO Designing Cities 2014 Dongho Chang, City Traffic Engineer October 23, 2014
 NACTO Designing Cities 2014 Dongho Chang, City Traffic Engineer October 23, 2014 Presentation overview Perspective on Safety Changing needs of our cities How Seattle is meeting those needs Challenge for
University Of Maryland
 2000 Census Census Data 200 Census Change 2000 to 200 SUBJECT Number Percent SUBJECT Number Percent Number Percent TOTAL POPULATION 437 TOTAL POPULATION 246-9 -43.7 White 283 64.8 White 65 67. -8-4.7 Black
PHILADELPHIA HOUSE PRICE INDICES
 PHILADELPHIA HOUSE PRICE INDICES April 14, 2014 KEVIN C. GILLEN, Ph.D. gillenk@upenn.edu Disclaimers and Acknowledgments: The Fels Institute of Government at the University of Pennsylvania provides this
Southwest Ohio Regional Economy in Context. Richard Stock, PhD. Business Research Group
 Southwest Ohio Regional Economy in Context Richard Stock, PhD. Business Research Group State of the Metro Area (in January Each Year) Total Employment has slowly increased in the last three years after
Public Transport and Development: Making It Work
 Public Transport and Development: Making It Work Robert T. Dunphy Urban Land Institute World Bank Transport Forum 2006 March 28, 2006 Transportation Development Disconnect Now Few Then places w/o car Many
ILLINOIS INCLUDED IN METROPOLITAN STATISTICAL AREA Cape Girardeau-Jackson, MO-IL MSA St. Louis, MO-IL MSA Rockford, IL MSA
 2012 2013 ARTS MIDWEST TOURING FUND METROPOLITAN STATISTICAL AREA (MSA) DETERMINATIONS BY COUNTY For counties in Illinois, Indiana, Iowa, Michigan, Minnesota, North Dakota, Ohio, South Dakota, and Wisconsin
ACTION TRANSMITTAL No
 Transportation Advisory Board of the Metropolitan Council of the Twin Cities DATE: January 5, 2017 TO: FROM: ACTION TRANSMITTAL No. 2017-04 Transportation Advisory Board TAC Funding & Programming Committee
Competitiveness
 North Carolina ted@econleadership.com Competitiveness NC Everyone has a plan till they get hit in the mouth Mike Tyson The Punch Job Change 1990 to 2012 200,000 180,000 160,000 140,000 120,000 100,000
Commuting in America 2013
 Commuting in America 2013 The National Report on Commuting Patterns and Trends Brief 7. Vehicle and Transit Availability September 2013 About the AASHTO Census Transportation Planning Products Program
PHILADELPHIA HOUSE PRICE INDICES
 PHILADELPHIA HOUSE PRICE INDICES January 15, 2015 KEVIN C. GILLEN, Ph.D. Kevin.C.Gillen@Drexel.edu Disclaimers and Acknowledgments: The Lindy Institute for Urban Innovation at Drexel University provides
Nevada County Population Projections 2015 to 2034
 Nevada County Population Projections 2015 to 2034 Prepared By: Jeff Hardcastle, AICP Nevada State Demographer Nevada Department of Taxation Reno Office: 4600 Kietzke Lane, Building L Suite 235 Reno, NV
Original language: English CoP17 Doc CONVENTION ON INTERNATIONAL TRADE IN ENDANGERED SPECIES OF WILD FAUNA AND FLORA
 Original language: English CoP17 Doc. 39.2 CONVENTION ON INTERNATIONAL TRADE IN ENDANGERED SPECIES OF WILD FAUNA AND FLORA Seventeenth meeting of the Conference of the Parties Johannesburg (South Africa),
Spring Time for Housing
 Spring Time for Housing Arizona State University December 2 nd, 2015 Presented By: Elliott D. Pollack CEO, IN PHOENIX 1 2 The World has Changed Pre-2007 Post-2007 3 Employment Growth From Bottom of Recession
Pocatello Regional Transit Master Transit Plan Draft Recommendations
 Pocatello Regional Transit Master Transit Plan Draft Recommendations Presentation Outline 1. 2. 3. 4. What is the Master Transit Plan? An overview of the study Where Are We Today? Key take-aways from existing
MEMORANDUM. Santa Clara Valley Transportation Authority
 MEMORANDUM TO: FROM: Board of Directors Kurt Evans, Government Affairs Manager DATE: September 12, 2014 SUBJECT: Legislative Update: Cap-and-Trade Together, the FY 2015 Budget Act and SB 862, a budget
Notes to Benefit-Cost Analysis
 Executive Summary Project Matrix Current Status/ Problem to Be Addressed University Avenue not user friendly or safe for cars, pedestrians, bicyclists, or bus riders. Notes to Benefit-Cost Analysis Change
Analyzing Gainesville s Bicycle Infrastructure
 Mateo Van Thienen 1 DCP 2002: Intro to GIS II Final Project Paper Abstract: Analyzing Gainesville s Bicycle Infrastructure The main purpose of this project is to determine which areas within Gainesville
IDOT Suspends Non-Emergency Road Work for Memorial Day Holiday Weekend Lanes Opened to Improve Traffic Flow
 State of Illinois Bruce Rauner, Governor Illinois Department of Transportation Randall S. Blankenhorn, Acting Secretary FOR IMMEDIATE RELEASE: CONTACT: May 21, 2015 Brian Williamsen 309.671.4854 Carson
EVAN GLASS. Montgomery County Council District 5
 EVAN GLASS 1. Do you support funding and advancing the Purple Line to groundbreaking as described in the Locally Yes. As a member of the recently convened Purple Line Implementation Advisory Group, I will