STATE OF WASHINGTON Game Status and Trend Report
|
|
|
- Irma Stafford
- 5 years ago
- Views:
Transcription

1 STATE OF WASHINGTON 2006 Game Status and Trend Report
2 AN OFFICIAL PUBLICATION OF THE STATE OF WASHINGTON 2006 GAME STATUS AND TREND REPORT July 1, 2005 June 30, 2006 Jeff P. Koenings, Ph.D. Director Washington Department of Fish and Wildlife 600 Capitol Way North Olympia, WA STATE OF WASHINGTON Chris Gregoire Governor WASHINGTON DEPARTMENT OF FISH AND WILDLIFE Jeff P. Koenings Director WILDLIFE PROGRAM Dave Brittell Assistant Director GAME DIVISON Dave Ware Game Division Manager This Program Receives Federal Aid in Wildlife Restoration, Project W-96-R, Game Surveys. This report should be cited as: Washington Department of Fish and Wildlife Game status and trend report. Wildlife Program, Washington Department of Fish and Wildlife, Olympia, Washington, USA
3 TABLE OF CONTENTS Deer Page Statewide... 6 Region 1, PMUs 11, 13, GMUs Region 1, PMUs 14-15, GMUs Region 1, PMUs 16-17, GMUs Region 2, PMUs 21-22, GMUs Region 2, PMUs 21, 23, 26, GMUs , Region 2, PMUs 24-25, GMUs 272, 278, 284, 290, PLWMA Region 3, PMUs 31, GMU Region 3, PMUs 32-36, GMUs Region 4, PMUs 41-45, GMUs 407, 410, 418, 426, Region 4, PMUs 44, 47, 48, GMUs 454, 466, 485, Region 4, PMU 46, GMUs 448 and Region 5, PMUs 51-57, GMUs 382 and Region 6, PMUs 61-77, GMUs Elk Statewide Region 1, GMUs Region 1, PMUs 11, 13, GMUs Region 1, PMUs 13, 14, GMUs Region 3, PMUs 32-36, GMUs Region 4, PMUs 44, 47, 48, GMUs 454, 460, 485, Region 4, PMUs 45-46, GMUs 418, 437, Region 5, PMUs All, GMUs All Region 6, PMUs 61-67, GMUs Mountain Goat Statewide Region 1, Linton Mountain Region 2, Methow Region 2, Chelan County Region 3, Naches Pass, Bumping River, Tieton River, Blazed Ridge, Kachess Pass Region 5, Goat Rocks, Smith Creek, and Tatoosh Bighorn Sheep Region 1, Blue Mountains Region 1, Hall Mountain Region 1, Lincoln Cliffs Region 1, Vulcan Mountain Region 2, Swakane Canyon and Lake Chelan Region 2, Mt. Hull Moose Region 1, GMUs 101, 105, 109, 113, 117, Region 1, GMUs 124, 127,
4 Black Bear Statewide Coastal Black Bear Management Unit (BBMU 1) North Cascades Black Bear Management Unit (BBMU 3) South Cascades Black Bear Management Unit (BBMU 4) Okanogan Black Bear Management Unit (BBMU 5) East Cascades Black Bear Management Unit (BBMU 6) Northeastern Black Bear Management Unit (BBMU 7) Blue Mountains Black Bear Management Unit (BBMU 8) Cougar Statewide Coastal Cougar Management Unit (CMU 1) South Cascades Cougar Management Unit (CMU 4) East Cascades North and Columbia Basin Cougar Management Units (CMUs 5 & 9) East Cascades South Cougar Management Unit (CMU 6) Northeastern Cougar Management Unit (CMU 7) Blue Mountains Cougar Management Unit (CMU 8) Mourning Dove and Band-Tailed Pigeon Statewide Summary Waterfowl Waterfowl Breeding Populations and Production Winter Waterfowl Populations and Harvest Wild Turkey Statewide Pheasant Region 1, Snake River Basin Region 2, Columbia Basin Region 3, Yakima and Lower Mid-Columbia River Basins Chukar Region 1, Snake River Basin Region 2, Upper Columbia River Basin Region 3, Yakima and Lower Mid-Columbia River Basins Quail Region 1, Snake River Basin Region 2, Upper Columbia River Basin Region 3, Yakima and Lower Mid-Columbia River Basins Forest Grouse Statewide
5 Deer 5
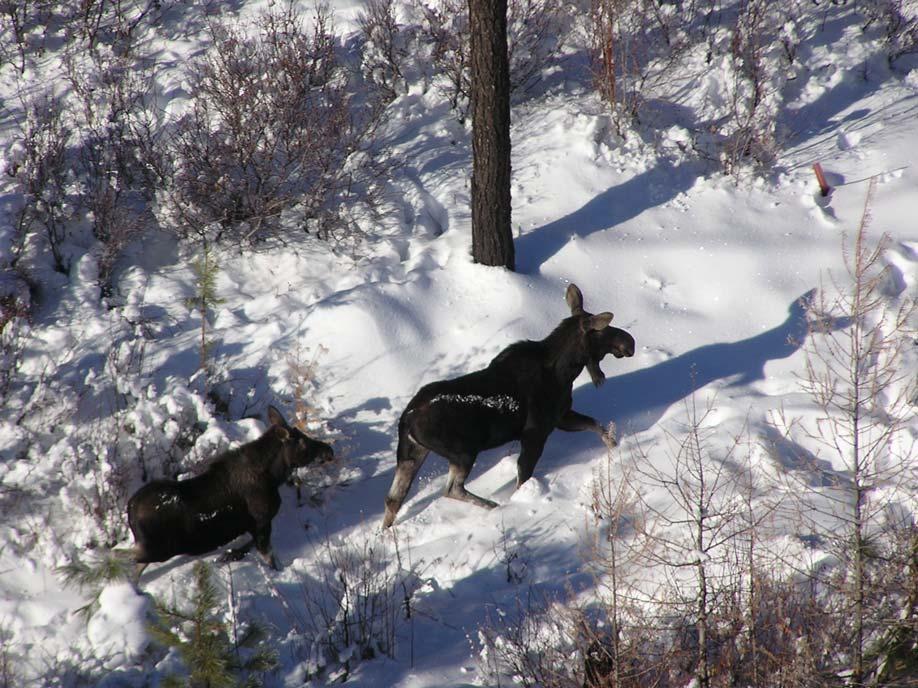
6 Deer Status and Trend Report Nelson DEER STATUS AND TREND REPORT: STATEWIDE Jerry Nelson, Deer and Elk Section Manager Population Objectives and Guidelines This report covers the time period July 2005 to June The goal set by Washington Department of Fish and Wildlife (WDFW) for the management of black-tailed deer (Odocoileus hemionus columbianus), mule deer (O. h. hemionus), and white-tailed deer (O. virginianus) populations in Washington is to maintain numbers within habitat limitations. Landowner tolerance, a sustained harvest, and non-consumptive deer opportunities are considered within the land base framework. Specific population objectives call for a post-hunt buck:doe ratio of 15:100 (WDFW 2003). Some Game Management Units (GMUs) are managed for limited entry buck only harvest, providing higher quality animals for harvest on a limited basis. Limited entry GMU objectives for post-hunt buck ratios vary but can range as high as 20 to 25 bucks:100 does. The desired post-hunt fawn:doe ratio is approximately 40 to 45:100 depending on the overall mortality of the population in question and the desire to have a particular population grow or remain stable. In the case of extreme deer damage situations, a reduced local sub-population may be the goal. Hunting Seasons and Harvest Trends General season harvest by deer type ignoring special permits was 34,101 (Figure 1). Total deer harvest for 2005 for the general season and special permit hunts combined was estimated at 39,791 (Table 1, Figure 2). The estimated statewide deer harvest has consistently fluctuated around 40,000 animals for the last six years. Blacktailed deer, mule deer, and white-tailed deer generally make up a third of the statewide harvest with some variation between years. Black-tailed deer have accounted for as much as 41 % of the statewide harvest in recent years. The estimated number of mule deer in the harvest has been fairly strong the last six years (~ 12,000) and is substantially higher than the mid to late 1990s. The estimated number of white-tailed deer in the total harvest has remained relatively stable for the last six years with the average annual harvest approaching 14,000 (Figure 1). From a statewide perspective, antlered white-tailed deer harvest has been increasing over the last six years (Table 2). Historically, Washington deer hunting was managed under any legal buck, hunting seasons with licenses sold over the counter with no quotas. As hunting pressure became more intense over the years, the harvest, crowding, and hunter pressure were managed in a variety of new ways. Currently deer licenses are sold over the counter and there is no quota on licenses sold. Deer hunters are required to choose a weapon type and hunt only during that hunting season. General season modern firearm, archery, and muzzleloader success rates have all varied depending on the year. For the 2005 general hunting season, modern firearm hunter success was 29.7 %. Muzzleloader hunter success was 31.3 % and archery hunter success was 26.1 % for the general hunting season. Table 1. Statewide deer harvest for general season and special permit season by weapon type and deer class for General Season Antlered Antlerless Total Modern Firearm 25,156 2,265 27,421 Muzzleloader 1, ,354 Archery 2,122 2,204 4,326 Sub-Total 28,684 5,417 34,101 Special Permits Modern Firearm 1,399 3,672 5,071 Muzzleloader Archery Grand Total 30,292 9,499 39,791 Table 2. Estimates of statewide deer harvest by deer type and class for Year 2001 Antlered Antlerless Total Black-tailed deer 14,277 2,381 16,658 Mule deer 9,211 2,704 11,915 White-tailed deer 8,589 3,777 12,366 Year 2002 Antlered Antlerless Total Black-tailed deer 11,103 1,865 12,968 Mule deer 10,363 3,276 13,639 White-tailed deer 8,783 3,304 12,087 Year 2003 Antlered Antlerless Total Black-tailed deer 11,761 2,172 13,933 Mule deer 9,825 3,455 13,280 White-tailed deer 9,252 4,301 13,553 Year 2004 Antlered Antlerless Total Black-tailed deer 13,842 2,017 15,859 Mule deer 11,137 2,827 13,964 White-tailed deer 10,272 4,412 14,684 Year 2005* Antlered Antlerless Total Black-tailed deer 10,628 1,673 12,301 Mule deer 10,721 1,917 12,638 White-tailed deer 11,445 3,407 14,852 Surveys WDFW conducts composition surveys from the air and the ground to index buck, doe, and fawn ratios. Depending on the species, location and terrain involved, deer composition surveys are conducted in the spring, the summer, pre-hunt in the early fall and post-hunt in the early winter prior to deer shedding their antlers. Population estimates are also conducted for mule deer using the visibility bias model initially developed in Idaho for elk (Samuel et al. 1987). Variants of the model have been developed for a variety of other species including mule deer. In western Washington, black-tailed deer surveys are coupled with hunter check station information and harvest data to model populations. Pre-hunt and post-hunt surveys are conducted in eastern Washington for both white-tailed deer and mule deer. Deer populations in selected areas are surveyed again in March and 6
7 Deer Status and Trend Report Nelson April to assess winter survival and recruitment. White-tailed deer are surveyed in summer to determine pre-hunting season fawn and buck ratios and again in spring to determine recruitment. Hunter check stations and mandatory report data are used to monitor age distribution of whitetail bucks in the harvest. Population Status and Trend Analysis White-tailed deer and mule deer populations are influenced significantly by winter severity in central and eastern Washington. Populations tend to build during mild winters and experience major declines in severe winters or protracted winters with below normal temperatures and above normal snow depths. Deer populations in central and eastern Washington have recovered from the most recent severe winter of Mule deer and white-tailed deer populations have been increasing. Mule deer populations are doing well along the Snake River breaks and the foothills of the Blue Mountains. Mule deer in the Blue Mountains also seem to be increasing but at a slower rate. White-tailed deer in eastern Washington did experience some localized declines due to outbreaks of epizootic hemorrhagic disease (EHD) but for the most part seem to be doing well and are probably increasing slightly. Mule deer in Okanogan County continued to do well during the time period of this report. Mule deer numbers in Chelan and Douglas Counties also improved during this time period. However, post-hunt buck ratio objectives are just barely being met in Okanogan and Douglas counties. Mule deer winter loss seemed to be much higher than expected for the winter of in Region 3. This may have been a function of a long drawn out winter with cold rainy weather taking place during the time period when spring green-up would normally occur. This wet cold weather at the end of the winter would have been an additional thermal burden that some mule deer may not have been able to withstand. In addition, WDFW has collected samples of exotic lice from mule deer in Region 3 and reports of mule deer exhibiting hair loss, similar to Westside black-tailed deer have increased. Mule deer suffering from hair loss syndrome would have a much more difficult time surviving the winter. Black-tailed deer in western Washington are negatively influenced by loss of habitat to human development, the reduction in timber harvest, and habitat progressing in successional age and becoming less able to provide high quality forage. Black-tailed deer experience some winter loss during a normal winter even though extreme cold temperatures or snow depth may not be an issue. Deer on low quality forage and constantly exposed to cold, rainy conditions can become hypothermic and die. Black-tailed deer continue to suffer mortalities due to hair loss syndrome. Research conducted in Oregon suggests that there may be a link to hair loss syndrome and non-native, Old World lice that have been found on afflicted black-tailed deer. Deer groom excessively in response to the lice, which causes the hair loss. Deer suffering from hair loss typically weaken and lose weight dramatically. Some deer survive but many die from hypothermia or from pneumonia caused by internal parasites that deer also commonly carry. Fawns seem to be the first age class impacted by the syndrome. The next most susceptible age/sex class is adult does, and lastly adult bucks may exhibit hair loss. Because young of the year and adult does seem to be the first to be impacted by hair loss syndrome, there is a potential that mortalities caused by this syndrome may be having an impact on population growth or decline. Recruitment of young and survival of reproductive age females are two of the most important rates that influence ungulate population dynamics. The total black-tailed deer harvest was down for 2005 (Figure 1, Table 2). Augmentations No augmentation efforts for deer were conducted by WDFW during the time period covered by this report. Habitat Condition and Trend In general deer benefit from habitat in early to midsuccessional stages. Deer herds in western Washington benefited from new growth after timber harvest in the 1960s, 70s, and early 80s. Much of the U. S. Forest Service land in western Washington is now shifting toward late successional reserves (LSR) and mature growth forest. This change will greatly diminish the carrying capacity of these habitats for deer. The long-term trend in deer carrying capacity is down on public lands managed by state and federal agencies. Timber management on industry-owned forest is generally shifting toward smaller scale cuts and selective cuts. While this may be beneficial to deer, restrictive understory management and other silvicultural practices may be having a negative impact on deer forage and it s availability. One of the major benefits to mule deer and white-tailed deer has been the Conservation Reserve program (CRP). The benefits to deer from CRP include taking agricultural land out of production, planting sites with native vegetation, and allowing vegetation on sites to grow taller and thicker providing both forage and sometimes security cover for fawning. Excessive road density limits habitat suitability for deer on most managed public and private forests. High road densities increase disturbance during fawning and breeding. High road densities also make deer more vulnerable during the hunting season as well as to poaching. In general, when all other necessary habitat components are in place, active road management programs that limit road density to approximately one linear mile of road per square mile or less create conditions more favorable for deer. WDFW is conducting a cooperative mule deer research project in central and eastern Washington, partnering with other agencies, public utilities, and universities. One aspect of this multi-faceted project is to investigate the influence of habitat quality as it relates to deer body condition, fawn production, and recruitment. Other aspects of the study include assessments of seasonal habitat use, deer movements, herd delineations, home ranges, and survival across the varied landscapes of eastern Washington. This project is scheduled to be completed in December Wildlife Damage WDFW is mandated by law to address agricultural damage caused by deer. In response to landowner complaints, WDFW tries to alleviate damage problems without reducing deer populations. One of the biggest challenges the Department faces is managing deer populations in balance with landowner tolerance. Regardless of deer densities, wherever deer and 7
8 Deer Status and Trend Report Nelson agriculture overlap there are going to be some damage complaints. The level of deer damage is usually a function of local deer densities all year and the intensity of winter when snow and cold temperatures force deer to use agricultural lands at a higher rate. White-tailed deer and mule deer have been increasing in numbers in several locations in central and eastern Washington and as a result agricultural damage complaints due to deer have been increasing slightly. New vineyards are being established in southeastern Washington and have the potential to host new conflicts between deer and agriculture. Mule deer activity in Whitman and Garfield Counties seems to be increasing and damage complaints may increase in those areas in the near future. In northeastern Washington, damage to alfalfa fields by white-tailed deer is the most prominent problem. Damage by black-tailed deer in western Washington also occurs but is less of a problem. Management Conclusions Black-tailed deer management by WDFW in western Washington generally tries to achieve a sustained yield of 2- point or better bucks or any bucks where appropriate without negatively impacting the population s health and viability. Limited antlerless tags are issued through the special permit process to keep those populations in check that may be causing some local damage concerns. Deer management in eastern and central Washington, which deals with both mule deer and white-tailed deer, is more dependent on climate. Mule deer and white-tailed deer populations tend to do well in central and eastern Washington when average and below average winter severity allows. Severe climatic events are somewhat cyclic, happening every 5 to 8 years. Severe winter effects are sometimes localized but often times more broad in scale. Severe winters result in high winter die-offs. Several years are then required for deer populations to rebound from those depressed levels. Currently the mule deer and white-tailed deer populations in eastern and central Washington have rebounded from recent weather events. Both species will probably continue to do well until the next climatic event that depresses populations to some lower level. In many locations in the state, Indian Tribes exercise their hunting rights as spelled out in various treaties on open and unclaimed lands as defined by the state Supreme Court. These lands are for the most part public lands managed by the U. S. Forest Service, Bureau of Land Management, the Department of Natural Resources and WDFW. Some of that Tribal hunting effort involves deer. When possible, the State attempts to obtain harvest records each year for deer harvested by Tribal members. State and Tribal wildlife managers are continually working toward improved co-management agreements that ensure conservation of deer populations, a sustainable harvest, and habitat improvements. Management Plan. Washington Dept. of Fish and Wildlife, Olympia, WA, USA Literature Cited Samuel M. D., E. O. Garton, M. W. Schlegel, and R. G. Carson Visibility bias during aerial surveys of elk in north-central Idaho. J. Wildl. Manage. 51: Washington Department of Fish and Wildlife Game 8
9 Deer Status and Trend Report Nelson Deer Harvest 50,000 45,000 40,000 35,000 30,000 25,000 20,000 15,000 10,000 5, ,964 11,883 11,915 10,917 13,034 13,280 9,232 13,639 12,638 6,566 7,327 9,800 11,600 9,700 11,007 15,161 12,366 8,960 12,087 13,553 14,684 14,852 17,048 14,808 15,875 13,966 15,268 13,932 16,658 12,968 13,933 15,859 12, Year Black-tailed Deer White-tailed Deer Mule Deer Figure 1. Estimated statewide deer harvest by species for 1995 to 2005 based on hunter report card percentages ( ) or mandatory reporting ( ). Total Deer Harvest ,765 39,442 32,141 30,253 35,507 40,976 40,939 38,694 40,766 44,507 39, Year Figure 2. Estimated total deer harvest from 1995 to
10 Deer Status and Trend Report Zender and Base DEER STATUS AND TREND REPORT: REGION 1 PMU 11 GMU 101 PMU 13 - GMUs 105, 108, 111, 113, 117, 121, 124 STEVE ZENDER, District Wildlife Biologist DANA L. BASE, Associate Wildlife Biologist Population objectives and guidelines White-tailed deer (Odocoileus virginianus) are the most abundant deer in northeast Washington. Mule deer (O. hemionus) are present, especially in the higher elevations and predominantly in Ferry County, but their overall numbers are low compared to white-tailed deer. The white-tailed deer harvest management objective is to provide antlered and antlerless hunting opportunity for all user groups whenever possible. The buck escapement goal is to maintain a ratio of at least 15 bucks per 100 does in the post-hunting season population. Antlerless hunting opportunity is managed to maintain healthy white-tailed deer populations within landowner tolerance. The management goals for mule deer are to provide conservative hunting opportunity, maintain at least 15 bucks per 100 does in the post-hunting season population, and increase productivity and population levels. Hunting seasons and harvest trends Figure 1 depicts the trend in total estimated deer harvested by hunters within the Colville District, Game Management Units (GMUs) from 2001 through The total harvest changed little from 2004 to While modern firearm hunter harvest dropped 6%, archery hunters increased their harvest by 10%, and muzzleloader hunters took 14% more deer. There does not appear to have been a shift of hunters from modern firearm to the other user groups as the hunter numbers followed similar trends (Figure 2). Harvest Number of hunters Modern Firearm Muzzleloader Archery Figure 2. Trend in the number of deer hunters for GMUs from The opportunity to harvest deer (or hunter success) in northeast Washington continues to improve as the number of deer harvested per hunter day increased again in 2005 (Figure 3). Figure 3. Trend in deer harvest per hunter day for GMUs from Kill Per Hunter Day HARVEST PER UNIT EFFORT Year Mule deer bucks legal for harvest have been limited to a three-point minimum since The most significant mule deer harvest in the Colville District occurs in GMU 101, which is primarily northern Ferry County. The mule deer buck harvest increased considerably from 2001 through 2004, however, it Modern Firearm Muzzleloader Archery Figure 1. Trend in total deer harvest for GMUs from
11 Deer Status and Trend Report Zender and Base seems to have leveled off in The percentage of quality bucks with 4 or more points remains near the average of 54% (Table 1). The 72% increase in the mule deer buck kill for muzzleloaders appears to be a result of much improved success rather than more hunters (205 muzzleloader hunters for GMU 101 in 2005 vs. 245 in 2004). Table 1. Mule deer buck harvest trend from hunter reports by user group within GMU 101 (A = Archery ; MZL = Muzzleloader ; MF = Modern Firearm hunter harvest). Year A MZL MF Total %4pt N/A % N/A % % % % Table 2 presents the hunter harvest of antlered and antlerless white-tailed deer by Population Management Unit (PMU) for The antlered whitetail buck harvest increased 17% in 2005 compared to A total of 7,208 whitetail bucks were taken in GMUs during the 2005 season. Youth, Senior, and Hunters with Disabilities (Y/S/D) hunts were offered for whitetails of either sex in GMUs again during the early general modern firearm hunt. The estimated harvest of antlerless whitetails by Y/S/D dropped 15% in Archers increased their antlerless whitetail take by 18% and muzzleloaders increased by 9%. Archery and muzzleloader hunters accounted for about 24% of the total antlerless whitetail harvest in 2005, a small increase from the 21% of the share taken in 2001 when mandatory reporting first began. There were 2,600 antlerless white-tailed deer permits issued for modern firearm hunters within GMUs in 2005, an increase of 12% from These permits included Second Deer Tags issued for two units, GMU 121 (300 tags, up from 100 in 2004), and GMU 124 (400 tags). These Second Deer Tags allowed the permittee to take a whitetail antlerless deer in addition to their regular deer tag. These tags provide a supplemental management tool as well as a useful means for increasing hunter opportunity. The harvest of antlerless whitetails from permits increased 20% compared to Surveys Age, antler and sex ratio data are collected from harvested deer for monitoring deer populations and developing season recommendations. The ratio of mature white-tailed bucks in the population is monitored by determining the percentage of adult bucks (yearlings excluded) that are 4 years or greater. In 2005 the percentage increased from 16% to 30%, which is well above the previous 5-year average of 19% (Figure 4). Buck antler data are also collected from check stations and mandatory hunter reports, including a measure of mature bucks; those with 5 points or more on the high side of their antlers. Field checks and hunter harvest reports yielded 17% and 19% respectively of all bucks harvested as having 5 points or more for the overall whitetail harvest within GMUs (PMUs 11 & 13). These data continue to support the apparent increasing trend of mature bucks represented in the harvest since a low of 10% in 1999 (Table 3 and Figures 4&5). %Ad Bucks 4 Years Figure 4. Percent of adult whitetail bucks 4 years and older from hunter check stations. for Table 2. Hunter harvest of antlered and antlerless white-tailed deer by Population Management Unit in A n t l e r l e s s Antlerless per PMU GMU Archery Permit Y/S/D Muzzleloader Total Antlered 100 Antlered Total: , ,911 7,
12 Deer Status and Trend Report Zender and Base Table 3. Whitetail yearling buck and 5+ antler point harvest trends from field checks and hunter reports for GMUs October Checks November Checks All Field Checks Hunter Reports Year Bucks %Yrlg Bucks %Yrlg %Yrlg %5pt+ %5pt % 63 30% 39% 22% 12% % 92 47% 58% 9% 13% % 77 42% 53% 16% 10% % 88 40% 42% 17% 11% % 63 44% 45% 13% 12% % 37 11% 36% 16% 14% % 73 42% 47% 15% 15% % 85 36% 41% 17% 17% % 87 31% 46% 17% 19% There was little change in the percentage of yearling bucks for the opening Sunday Check Station in 2005 (Table 3). The late field checks were relatively low at 31% yearlings, which suggests there were plenty of mature bucks available once they became vulnerable during the rut. Our total checks included 46% (n=73) yearling white-tailed bucks and 24% (n=9) yearling white-tailed does. Fawns made up 37% of the total antlerless harvest checked in 2005, no change from 38% in The mean age of the adult whitetail bucks only (yearlings excluded) was 3.3 years in 2005, up from 2.8 years in 2004, and similar to 3.5 in Late summer mule deer surveys are conducted primarily in GMU 101, northern Ferry County. A sample of 470 classified deer yielded a buck ratio of 31 bucks per 100 does, similar to 30:100 in 2004 and 34:100 in The fawn ratio improved to 67:100 does as compared to 61:100 in 2004 and 66:100 in 2003 (Table 5). These strong mule deer fawn ratios are encouraging after the relatively low ratios experienced from Table 4. White-tailed deer late summer composition surveys by Population Management Unit (PMU). % of bucks 5 pt Figure 5. Percent of PMU 13 whitetail bucks 5 point or better from hunter reports, PMU Year Sample Size August Bucks per 100 Does September Sample Size Fawns per 100 Does Whitetail buck:doe ratios for summer 2005 were down moderately for PMU 13 (Table 4) and down considerably for PMU 11 (i.e. GMU 101). The fawn ratio for PMU 13 improved from 51 fawns per 100 does in 2003 to 68:100 in 2004 and maintained the improved ratio in 2005 at 64:100. The ratio of yearling bucks observed in the August surveys continued to hold steady at 60%. 12
13 Deer Status and Trend Report Zender and Base Table 5. Mule deer buck and fawn ratios per 100 does from summer composition surveys within the Colville District from 1998 through Year Buck:Doe Fawn:Doe Total Classified :100 68: :100 47: :100 43: :100 46: :100 53: :100 66: :100 61: :100 67: Population status and trend analysis There was little change in the number of deer harvested or the number of deer hunters for the Colville District from 2004 to 2005 (Figures 1 & 2). The kill was slightly lower and the hunter numbers were down 7 percent. The harvest per unit effort was up slightly, suggesting that plenty of bucks were available. The mule deer harvest leveled off after increasing for several years from a discouraging low. Given the relatively healthy fawn ratios continuing into 2005 we should expect mule deer to maintain good harvest numbers (Tables 1 & 5). In the late 1990 s we saw unprecedented low representation of mature whitetail bucks in the harvest. This concern was addressed by maintaining conservative late buck seasons that did not extend beyond the middle of the rut. Since 1999 there has been a consistent improvement in the percentage of older bucks based on monitoring antlers, and a general trend toward more bucks 4 years or older based on tooth age analysis. At this time we appear to be at a level that has reasonably good representation of mature bucks in the whitetail population. The total antlerless white-tailed deer harvest increased slightly but it did not keep pace with the increased buck harvest, so the ratio of antlerless taken per 100 bucks declined from 47:100 in 2004 to 40:100 in GMU 117 had an especially low ratio at 28:100 (Table 2). The late summer whitetail fawn ratio of 64 fawns per 100 does in our major whitetail units (PMU 13) was once again high enough to promote a growing deer population. With two consecutive years of reasonably strong fawn production, the over-all health of the whitetail population is good. The whitetail buck to doe ratio dropped in This was a surprise as the fawn crop from 2004 was good and the percentage of yearlings in the 2005 harvest was high (Tables 3 & 4). Disease and Predators WDFW continues to test harvested deer statewide for Chronic Wasting Disease (CWD), and many deer have been included in the sample from throughout northeast Washington. No deer have tested positive for CWD through Cougar populations in northeast Washington were exceptionally high in the middle to late 1990 s but hunter harvests and special hound hunting opportunity to reduce populations for protection of property and human safety have significantly reduced cougar numbers in recent years. Cougar are still a common predator of deer in northeast Washington but their impact on deer populations is likely at a relatively normal level at this time. Habitat condition and trend The winter of produced exceptionally heavy snow in the middle to upper elevations of northeast Washington. Fortunately the temperatures were mild so the lower elevations did not accumulate deep snow, which is usually the primary cause of winter deer loss. The additional moisture from higher elevation snow contributed to a better growing season for 2006, with little apparent negative impact to the deer population. In northeastern Washington the impacts of drought tend to not be as obvious as a severe winter. We speculate that the hot, dry summers resulting in drought-stressed forage vegetation may be a significant factor contributing to the slow white-tailed deer population recovery after the winter losses. The improved snow-pack and spring rains over the winter and spring may contribute to improved forage quality and herd health. Land prices in northeast Washington have increased dramatically in the last few years and sales have been brisk. As a consequence, deer habitat is being converted from forest and farm to suburban developments and dispersed small acreage residences. White-tailed deer tend to acclimate to people so the general perception seems to be: The deer are still here and often times are a nuisance; Therefore they must be doing well. However, in many cases those are only resident deer, the migratory mountain forest populations have declined and the low elevation habitat losses are likely responsible or contributing to this problem. Wildlife damage Deer foraging in alfalfa and damage to automobiles by highway collisions are the primary economic losses reported. Antlerless permits and either-sex hunting opportunity by youth, senior, and hunters with disabilities are part of the management 13
14 Deer Status and Trend Report Zender and Base strategy to stabilize deer populations, and control excessive damage. While deer continue to be a problem for farmers, the population and the damage complaints are presently at a reasonably tolerable level. White-tailed Deer Control (Landowner Access) Permits are issued to some farmers with a history of chronic damage. These permits allow licensed hunters to take antlerless whitetails on specific farms outside of general hunting seasons. This small-scale program has proven popular and effective, especially in providing landowner satisfaction. Landowner Preference and Depredation Permits are also tools Wildlife Officers may use to deal with specific complaints regarding deer. Management conclusions The Colville District deer harvest continued at a relatively high level in 2005, exceeding 10,000 deer taken. All user groups are well represented in the harvest now with major improvements in opportunities, especially for muzzleloaders in recent years. Hunting opportunities for any method a hunter chooses are well dispersed over time and space within the district. Even more opportunity is provided in the new 3-year hunting package that begins with fall hunts in Given the productivity of the whitetail population in recent years we should have maintained a higher antlerless harvest relative to the buck harvest in We may see improvements in this ratio in 2006 as greater Y/S/D opportunity has been provided in the late season, and permits have increased in a few GMU s. The ratio of mature white-tailed bucks in the harvest is at a reasonable level now. It will be important to maintain adequate hunter field checks (check stations) or implement other means to monitor the age structure as well as the antler classes of the buck population. While the deer population appears healthy at this time, and hunter success at acceptable levels, the approaching storm of human development and associated restrictions in access may compromise further gains for deer and hunters. Improving hunter access to the most productive deer populations on low elevation, private agricultural and timberland may be the key to maintaining the highest level of deer hunting and harvest success. 14
15 Deer Status and Trend Report 2006 Ferguson and Volsen DEER STATUS AND TREND REPORT 2006: REGION 1 PMU 14 GMUs 127, 130, 133, PMU 15 GMUs 136, 139, 142 HOWARD FERGUSON, District Wildlife Biologist DAVID P. VOLSEN, Wildlife Biologist Population objectives and guidelines Our deer management goals are to maintain both white-tailed deer (Odocoileus virginianus) and mule deer (O. hemionus) numbers at levels compatible with landowner tolerance and urban expansion and provide as much recreational use of the resource for hunting and aesthetic appreciation as possible. Further objectives are to meet the state guidelines for buck escapement (at least 15 bucks per 100 does postseason) and to maintain healthy buck:doe:fawn ratios while minimizing agricultural damage from deer. Hunting Seasons The Game Management Units (GMUs) 127 through 142 make up Population Management Units (PMUs) 14 and 15. These PMUs provide quality recreation in relatively open shrub-steppe and agricultural habitats. Species distribution between PMUs is approximately equal, with slightly more white-tailed deer harvested annually in PMU 14 and slightly more mule deer harvested annually in PMU 15. A 3-point minimum regulation on antlered whitetailed and mule deer applies to modern firearm, archery and muzzleloader hunters in PMUs 14 and 15. Antlerless opportunities are offered to all user groups across varied GMUs. WDFW offered a nine-day modern firearm season (October 15-23) for mule deer and white-tailed deer, and a thirteen-day late white-tailed buck hunt (November 7-19), as well as antlerless permit opportunities. Archers are offered both early and late hunting seasons. Archery hunts for mule deer run September 1-30 in GMU 127 with a 3-point minimum, in GMU 142 with 3-point minimum or antlerless. GMUs have a 3-point minimum September 1-15, and a 3- point minimum or antlerless from September For white-tailed deer, the season extends from September 1st to the 30th under a 3- point minimum or antlerless regulation. A late archery season is open in GMU 127, and hunters can take mule deer, white-tailed 3-point minimum or antlerless deer. Muzzleloader hunts are offered in GMUs 133 and 142 in the early season (Oct. 1 7), and GMUs 130 and 139 in the late season (Nov. 20-Dec. 8). Harvest trends From 2001 to 2003 the total deer harvest has been slightly higher in PMU 15 than PMU 14. In 2004 and 2005 the total harvest in PMU 15 decreased to levels matching PMU 14 (Table 2). In general, more whitetailed deer are harvested in PMU14 and more mule deer are harvested in PMU15. In most years hunters harvest slightly more mule deer than white-tailed deer, however, in 2001, 2003 and 2005 more white-tailed deer were taken than mule deer. In PMU 14 the mule deer harvest averages 73 percent of the white-tailed deer harvest. In PMU 15 the white-tailed deer harvest averages 81 percent of the mule deer harvest. In 2005 the percent of the harvest attributed to mule deer in PMU 14 dropped to 56 percent. In PMU 15 the percent of the harvest attributed to white-tailed deer increased to 99 percent in Since 2002 the number of mule deer harvested in PMU 15 has been declining, while the white-tailed deer harvest has remained relatively constant. General season hunter success rates for each GMU vary over time (Table 3), however they show an increasing trend from 1998 to From 2002 through 2005 success rates vary around a relatively flat trend. In 2005 hunter success increased as much as 8 percent, with success increasing in all GMUs except GMU 136, which stayed the same at 30 percent. Surveys Deer in PMU 14 and 15 have been surveyed by both ground and aerial methods. Recently, available resources have impacted WDFW s ability to conduct some surveys. The post-season ratios more accurately reflect composition and harvest of these herds than the pre-season survey data; however, pre-season surveys are accurate reflections of doe to fawn ratios and thus, productivity for the year. Bucks are often difficult to survey because of their nocturnal behavior and the hunting pressure of the late buck seasons. As a result, the post-season buck:doe ratio figure is probably a conservative measure of composition when available. 15
16 Deer Status and Trend Report 2006 Ferguson and Volsen Pre-season white-tailed deer ratios in 2005 averaged 33 bucks: 100 does: 43 fawns, an increase for bucks and a decrease for fawns compared to 2004 (Table 4). Pre-season mule deer ratios in 2004 increased from 2004 to 32 bucks:100 does, and, fawns numbers decreased slightly from 58 to 55 fawns:100 does. Post-season aerial surveys were not conducted during 2005 due to budget constraints. Pre-season surveys were conducted during August and September Population status and trend analysis Populations of both species are stable under our current management strategies. Although whitetail post-season buck ratios are probably underestimated by surveys, ratios for both whitetail and mule deer exceed guidelines (15 bucks per 100 does) for post-season herd composition (Tables 4). Doe:fawn ratios are reduced from 1999 values in most units and indicate a need for continued monitoring. These PMUs are largely private lands, and although WDFW has little control of management practices on private lands, the recent mild winters and general fertile nature of these soils have helped produce healthy populations of both deer species in past years. Populations of mule deer in GMUs 139 and 142 responded to heavy snow depths during winter 2003 with a seasonal migration towards the Snake River and central Adams County. The cumulative effects of several years of drought may also be contributing to seasonal impacts by reducing habitat quality. Habitat quality and quantity remain relatively constant throughout PMUs 14 and 15. Conversion of natural habitats to agriculture occurred in past decades, but represent minor changes today. Gains have been made in deer habitat with enrollment of agricultural acres into the Conservation Reserve Programs. Habitat loss do to development continues to occur in GMU 127 with the redistribution of urban populations outward into rural settings. Current habitat conditions support existing populations, however, an extended drought in these PMUs has increased stress, reduced productivity and possibly, increased mortality across sex and age classes. EHD/Bluetongue mortalities in PMUs 14 and 15 were almost nonexistent in 2005, allowing local white-tailed deer populations to recover from previous years of high mortality. Drought conditions are coincident with white-tailed deer mortality and outbreaks of the EHD/Bluetongue in District 2. There are some indications that mule deer are moving into areas that were formerly occupied by white-tailed deer, and had high white-tailed EHD mortalities. A more formal delineation of the range of white-tailed and mule deer in PMUs 14 and 15 is needed. Management conclusions Deer populations in PMU 14 and 15 are stable and productive and current season structures are addressing management issues. White-tailed deer are frequently a social problem in some urban centers. It has been necessary to increase the harvest of the antlerless component of both deer species in the certain GMUs to control herd levels. It appears that with 3-point regulations, WDFW can continue to emphasize white-tailed deer harvest in the Central District, however, due to the vulnerability of bucks to harvest in the open habitat of GMUs , close monitoring of sex and ages classes is imperative. Recreational opportunities to harvest older age class bucks may be enhanced by switching to a permit only opportunity during the late season. Those units near urban centers continue to receive high hunting pressure and will need to be closely watched to avoid overharvest. Thus far, we have not experienced excessive urban deer problems in Spokane. The public perceives high numbers of vehicle collisions with white-tailed deer as a problem in parts of GMUs 124 and 127. Currently, crop damage is reported annually in portions of GMUs 124 through 142. Intensive recreational harvest with a wide range of seasons and opportunities has helped mitigate some damage claims. When a damage problem arises, a concerted effort is made by WDFW personnel to coordinate hunters with the landowner. This seems to be the most successful tool to help control damage and to provide recreational opportunity. Because of the EHD impacts in 1998, 1999, 2003 and 2004 in both PMU 14 and 15, it will be necessary to monitor the white-tailed deer populations in this area carefully. Because of landowner requests and the productivity of these herds, WDFW will continue to offer antlerless hunts by modern firearm permit, and general whitetail antlerless opportunity for archery, muzzleloader, youth, senior, and persons of disability seasons in units near the urban area of Spokane for white-tailed deer. 16
17 Deer Status and Trend Report 2006 Ferguson and Volsen Table 1. Antlered and antlerless harvest in PMU 14 and 15. PMU 14 PMU 15 Year Antlered Antlerless Antlered Antlerless Table 2. Comparison of hunter numbers by year by GMU. Game Management Unit Year
18 Deer Status and Trend Report 2006 Ferguson and Volsen Table 3. General season percent hunter success by GMU. Game Management Unit Table 4. Deer sex and age composition ratios for 1999, 2002, 2003, 2004 and (Buck:Doe:Fawn) Species Year Pre-season Post-season :100:83 37:100: :100:64 20:100:67 Mule Deer :100:54 * :100:58 * White-tailed Deer :100:55 * :100:87 16:100: :100:50 * :100:87 * :100:82 * :100:43 * * No post-season surveys. 18
19 Deer Status and Trend Report Fowler and Wik DEER STATUS AND TREND REPORT: REGION 1 PMU 16 - GMUs 145, 149, 154, 178, 181 PMU 17 - GMUs 162, 163, 166, 169, 172, 175, 186 PAT FOWLER, District Wildlife Biologist PAUL WIK, Wildlife Biologist Population Objectives and Guidelines The mule deer (Odocoileus hemionus) population has declined along the breaks of the Snake River, due to low fawn production/survival over three of the last four years. Mule deer populations in the mountains are still depressed. White-tailed deer populations have also declined due to EHD outbreaks and antlerless harvest, but are still near objectives. Hunting seasons and harvest trends The general buck season in the Blue Mountains district has been under a three-point regulation since 1990 for mule deer and 1991 for white-tailed deer. The objective of this regulation was to improve buck survival and increase the post-season buck /doe ratio, which was extremely low (2-5 bucks/100 does) prior to the regulation. The accuracy of harvest data has been improved since implementation of the Mandatory Hunter Report From the District-3 buck harvest averaged 2,305 bucks/year, and compares favorably with the (pre three-point) average of 2,340 bucks/year. In 2005, hunters harvested 1929 bucks, which is 16% below the average (Table1). Three user groups have general seasons in the Blue Mtns.: archery, muzzleloader, and modern rifle. General season modern firearm hunter numbers have gradually declined over the last 5 years. The number of modern firearm hunters averaged 10,406 from , but declined to 7,134 in Modern firearm (MF) hunters harvested 2,386 deer in 2005; 1,719 bucks and 667 antlerless deer. Over the last 3 years, 50% of the MF mule deer buck harvest was four point or larger. The general season MF hunter success rate was 27% in Muzzleloader (ML) hunter numbers have increased significantly since introduction of a general muzzleloader season in The first year, only 117 ML hunters participated, but by 2004 that number increased to 684 hunters. The number of ML hunters appears to have stabilized with 541 participating in The ML deer harvest increased from 41 deer in 2000, to 229 deer in 2005; 129 bucks and 100 antlerless deer. Muzzleloaders enjoyed a 42% success rate in 2005, which is the highest of all user groups. Archery hunter numbers are fairly stable, averaging 993 hunters over the last five years, and 912 participating in From , archers harvested an average of 224 deer per year in the Blue Mtns, with an average success rate of 23%. In 2005, archery hunters harvested 218 deer, 81 bucks and 137antlerless deer for a success rate of 24%. Species composition of the buck harvest changes little from year to year, with the 2005 harvest comprised of 56% mule deer and 44% white-tailed deer, which is comparable to the long-term trend (60% mule deer, 40% w-t deer). The antlerless harvest consisted of 34% mule deer, a significant decrease from previous years as a greater portion of the antlerless harvest is focused on white-tailed deer through special permit seasons. From , the antlerless harvest averaged 931 per year. A total of 790 general antlerless permits along with 760 permits for white-tailed deer were issued in The permit controlled and general season antlerless harvests totaled 904 antlerless deer (Gen. Seas. 499, permit seas. 405), which is comparable to the average of 931 deer. The general season antlerless harvest consists of archery, muzzleloader, and an antlerless white-tailed deer general season for Senior, disabled, youth hunters. Antlerless deer were harvested at a rate of 47 antlerless per 100 bucks; mule deer 31 does/100 bucks and white-tailed deer at 68 does/100 bucks. Although whitetail antlerless permits were increased, the harvest actually declined slightly in The overall success rate for antlerless permits was 56%, with any antlerless deer permits averaging 60%, and whitetailed antlerless permit success averaging 50%. Approximately 29% of the antlerless special permit holders did not hunt. Surveys Both aerial and ground surveys are used to 19
20 Deer Status and Trend Report Fowler and Wik determine pre- and post-season herd composition. Prehunt surveys were conducted from the ground, and resulted in 638 mule deer classified. Post-hunt surveys were conducted from the ground and air, with 2,872 mule deer classified (Table 3). December fawn/doe ratios ranged from fawns/100 does and averaged 37 fawns/100 does. High fawn ratios in GMU-172 were impacted by severe winter conditions that resulted in heavy mortality for fawns and older deer. The mule deer buck/doe ratio increased slightly to 17 bucks/100 does, which is the first time in three years it has been above the minimum management objective. Late summer/fall drought and localized winter conditions over the last few years have had a negative impact on fawn production and survival. Drought conditions prevailed again in the fall of 2004, and definitely had an impact on the mule deer fawn production/survival in the lowland areas in Population Status and Trend Mule deer populations in the lowlands and along the Snake River have declined, but are still at good levels. The white-tailed deer population is doing well in the foothills, but an EHD outbreak in 2004 reduced the population in localized areas along the Tucannon and Walla Walla rivers. Lower mule deer fawn survival over the last few years, combined with increased hunting opportunity has resulted in lower post-season buck/doe ratios. Lower fawn production and survival over several years is a significant factor contributing to low post-season buck ratios, because a high percentage (approx. 70%) of the bucks surviving the hunting season are yearlings. However, increased hunting opportunity also has a negative impact on buck survival. Post-hunt mule deer buck ratios in 2005 increased slightly (Table 3) to 17 bucks/100 does. However, low fawn ratios in 2005 will probably result in buck ratios falling below management objective in 2006 and Although data on post-hunt herd composition for white-tailed deer is limited, buck ratios have averaged 22 bucks/100 does since 1995 and appear to be stable. Habitat Condition And Trend Summer-fall drought has occurred four out of the last five years ( , 2005), and has had a negative impact on fawn production and survival. Fall green-up is extremely important for mule deer along the breaks of the Snake River and in the lowland areas. Green-up provides the nutrition necessary for deer to increase the fat reserves needed for winter survival and good productivity. A drought during the fall can have a negative impact on both the physical condition of deer and productivity the following spring. The Conservation Reserve Program (CRP) dramatically improved habitat conditions for deer in the lowland agricultural areas, providing approximately 250,000 acres of additional habitat. These large areas of continuous habitat provide good forage and fawning areas where little existed prior to this program. Yellow star-thistle is a major problem in the foothills and along the breaks of the Snake River south of Asotin. Yellow star-thistle has inundated thousands of acres of deer habitat in GMU-181 along the Snake River breaks, and this problem surely contributes to a lack of improvement in the mule deer population in this unit. Habitat conditions on National Forest land have declined due to road densities, logging, and fire suppression. The new Access Management and Fire Management Plans will improve habitat conditions over time, and prescribed burns are being implemented throughout the forest to reduce fuel loads and improve stand conditions. Roads are being closed to increase habitat effectiveness. Augmentation/Habitat Enhancement The Conservation Reserve Program has significantly increased habitat for deer populations in southeast Washington. Continuing the CRP program and acreage enrolled will be very important factor in maintaining deer populations in the farmland into the future. Wildlife Damage Damage complaints attributed to deer have been minimal in southeast Washington, compared to deer densities. Development of vineyard acreage continues in southeast Washington. Over the last year, the WDFW has received several complaints of deer damage to vineyards. This problem will continue to increase as the acreage of vineyards expands in southeast Washington. Management Conclusions Mule deer populations along the breaks of the Snake River and in the lowlands have declined. Mule deer populations in the mountains are considerably below management objective, but are improving slowly. Fall drought along with localized winter conditions over the last five years ( , 2005) have resulted in lower fawn production and survival for mule deer in the arid lowlands and along the breaks of the Snake River. Fawn production/survival improved in 2004, but declined again in The quality of bucks harvested under the threepoint program has improved, compared to the era when 20
21 Deer Status and Trend Report Fowler and Wik hunters could harvest any buck. Since 1992, the percentage of mule deer bucks harvested with four or more antler points averaged 50%. The white-tailed buck harvest has averaged 20% five point or better. Public support for the three-point regulation is excellent, due to the quality of the bucks harvested, and good hunter success rates. A combination of conditions, such as lower fawn production/survival caused by drought and winter conditions, and increased hunting opportunity since 2000 has likely resulted in reduced overall buck survival and lower post-season buck/doe ratios for mule deer. Improving fawn production and survival in 2004 resulted in a boost in the post-season buck/doe ratio in 2005, but low fawn production in 2005 should result in a decline in the buck ratio again in If the post-season mule deer buck ratio remains below the minimum management objective in , adjustments in hunting seasons may be necessary to increase buck survival and bring post-season buck/doe ratios into compliance with the management objectives listed in the Game Management Plan. 21
22 Deer Status and Trend Report Fowler and Wik Table 1. Deer harvest summary, , Blue Mtns. Mule deer Antlerless Year Antlered Antlerless Total % > 4 point* deer:100 Antlered % % % % % % % % % % % % % % % % 47 Note: % > 4 point calculated from harvest under 3 point regulation. Table 2. Late Whitetail Permit Hunt Summary, Modern Firearm & Muzzleloader, Blue Mtns. WA. Year No. Permits Hunter Bucks Does Total Succ. %Harvest > 5 pt.* % 24% % 18% % 22% % 18% % 16% % 21% % 24% % 20% % 20% % 17% % 18% % 17% % 17% % 22% % 37% Table 3. Post-hunt mule deer surveys , Blue Mtns., Washington Bucks Per 100 Does Year Ad. Yearl. Doe Fawn Total F:100:B :100: :100: :100: :100: :100: :100: :100: :100: :100: :100: :100: :100: :100: :100: :100: :100: :100:17 22
23 Deer Status and Trend Report Fowler and Wik Figure 2. Post-hunt Mule Deer Buck/Doe Ratio. POST-HUNT MULE DEER BUCK RATIO TREND Yrl Ad 23
24 Deer Status and Trend Report Fitkin DEER STATUS AND TREND REPORT: REGION 2 PMU 21 GMUs 203, 209, 215, 218, 224, 231, 233, 239, 242, 243, PMU 22 GMU 204 SCOTT FITKIN, District Wildlife Biologist Population objectives and guidelines In general, the Okanogan District is managed for maximum productivity and sustainable harvest of mule deer (Odocoileus hemionus) and white-tailed deer (O. virginianus). The post-season sex ratio target is a minimum of 15 bucks per 100 does. In addition to harvest information, data on buck:doe ratios, fawn production, and fawn recruitment are collected during field surveys to assess success in achieving management objectives. Hunting seasons and harvest trends The 14-day general modern firearm season continued for a third year in 2005, closing on October 28. Youth, disabled, and senior permits increased and changed from any deer to antlerless only for 2005, in an effort to boost doe harvest and stimulate fawn production. Hunter numbers decreased somewhat in the Okanogan District in 2005, but generally they appear to be leveling off at about half of what they were years ago (Figure 1). Number of hunters Year PMU 21 PMU 22 Figure 1. Trend in number of hunters, PMUs 21-22, Hunters contended with unseasonably warm and dry weather conditions, although access remained good. The mild weather may have discouraged migratory behavior in deer, particularly during the early part of the general rifle season, potentially reducing hunter prospects. Even so, hunter success remained stable. Total harvest declined slightly in accordance with hunter numbers (Figure 2 & 3). Antlerless harvest increased to 711 animals with the change to antlerless only for youth/disabled/senior permits. WDFW check station personnel surveyed 1114 hunters and examined 66 deer in 2004 (Table 1). No chronic wasting disease monitoring occurred in this district due to limited resources being allocated to higher risk areas. Success (%) PMU 21 Success Year PMU 22 Success Figure 2. Success in PMUs 21 & 22, Tribal input Data from the Colville Confederated Tribes (CCT) for the last three seasons had not been received at the time of this report. Tribal harvest is no longer being monitored at the GMU level, so it will likely not be possible to document the tribal contribution to harvest in PMU 22 (GMU 204). Surveys Post-hunt surveys are conducted to collect mule deer herd composition data and monitor progress toward population objectives. Surveys are conducted by helicopter in late November or early December when most hunting seasons have ended, when most bucks are still with does and have not dropped antlers, and when deer are concentrated on winter ranges. Deer are counted, identified to species, and classified as > 3- pt buck, < 3-pt buck, doe, or fawn. Hiking surveys are conducted in early spring just as winter ranges begin to green-up, and before mule 24
25 Deer Status and Trend Report Fitkin deer begin to migrate to summer range. As with the post-season surveys, this effort is restricted largely to mule deer in PMU 21, due to limited resources and sample size shortcomings in PMU 22. Biologists classified over 6,800 mule deer during helicopter surveys in PMU 21 in early December 2004 (Table 2). The counts yielded overall buck:doe and fawn:doe ratios of 18:100 and 84:100 respectively. Ratios show a small rebound in productivity (Table 3), likely attributable to improved summer forage as drought conditions eased. Buck ratios also climbed. Part of the increase is attributable to the shift of the youth/disabled/senior permits from any deer to antlerless only. Very mild weather conditions and reduced hunter numbers also eased pressure on bucks. Deer Harvested PMU 21 PMU Year During hiking surveys in late March and early April 2006, biologists classified 1,923 mule deer in PMU 21 (Table 4) and observed a fawn:adult ratio of 18:100. This is the second lowest fawn recruitment observed since records were first kept in 1981 (Table 5). Much of the reduction is the result of deep, persistent snow in the Methow Watershed portion of the district. Estimates suggest winter killed more than 90% of the fawn crop in this area. Table 1. Chewuch Check Station Results Figure 3. Harvest in PMUs 21 & 22, Deer Type Year Bucks Antlerless Total Hunters %Success , , , , , , , , ,114 6 Population status and trend analysis Helicopter quadrant censuses conducted during a research project in PMU 21 in the mid 1980's produced a mule deer population estimate of approximately 25,000 animals. The resources needed to duplicate this intensive survey effort are not longer available. Instead, biologist developed a population model for PMU 21 based on survey and harvest data. The model produced a five-year average estimate of about 26,000 animals in the PMU. This corresponds nicely to the census estimate of 20 years ago. Table 2. Post-season population composition counts from 2005, by area. F:100:B is fawns and bucks per 100 does. Bucks Area >3 pt <3 pt Doe Fawn Total F:100:B Methow :100:17 Okanogan :100:24 Total :100:18 Throughout much of this century, the mule deer population in Okanogan County has fluctuated widely, largely in response to long-term shifts in habitat quality and quantity, and short-term changes in winter weather patterns. Even so, an overall long-term, gradual decline in mule deer numbers is evident. For roughly the last 35 years, harvest data indicates that even during periods of mild winter weather, the population is not rebounding to the historic highs of the 1950s and 60s, suggesting a reduction in landscape carrying capacity for deer. Historically, heavy doe harvest in response to damage complaints caused significant short-term declines in deer numbers. Also, traditional season setting based on the assumption that hunting mortality is compensatory, also contributed to population swings. Current research in other states, suggests that hunting mortality may be more additive for mule deer. Ongoing research in Washington is addressing the effects of hunting mortality. In the interim, more conservative hunting regulations have been adopted, and guidelines for antlerless harvest have been developed using an additive mortality model. Several years ago, qualitative observations from land managers, biologists, and long time residents, as well as harvest figures, suggested that by 1997 the population had likely fallen to half or less of what it was in the mid 1980s and early 1990s. Severe winter weather contributed most to this short-term decline. Fortunately, eight successive mild winters allowed deer populations to rebound strongly. Production has generally been high, and has been aided by greater buck:doe ratios and conservative antlerless harvest. 25
26 Deer Status and Trend Report Fitkin Table 3. Post-season mule deer population composition counts for PMU 21 from F:100:B is fawns and bucks per 100 does. Buck Antler Class Year >3 pt <3 pt Subt Doe Fawn Total F:100:B :100: :100: :100: :100: :100: :100: :100: :100: :100: :100: :100: :100:18 Survey and harvest data from the last few years indicates fawn production and recruitment may have plateaued, suggesting the herd may be at or near carrying capacity. Last year s winter mortality should stall herd growth. Unlike mule deer, whitetail deer have increased in the district over the long-term. Development patterns and agricultural practices, may have promoted the expansion of whitetail. Whitetail are widespread in the eastern part of the district, and now inhabit most of the major drainages and valley bottoms in the western half of the county, including many places where they had not been seen historically. Relatively flat harvest figures suggest the whitetail population may be stabilizing. Whitetail also sustained significant winter losses in the 90 s, but in general, they have been more resilient than mule deer. In general, populations of resident deer on the Methow Valley floor have increased significantly to problematic levels. Nuisance/damage complaints have risen sharply and population levels have surpassed social tolerance. Reduced harvest pressure associated with increasing development and housing density is the major contributing factor. In contrast to population size, herd composition is tied to harvest rather than habitat. Heavy hunting pressure on antlered mule deer in the past caused the Table 4. Spring population composition counts from 2006, by area for PMU 21. F:100A is fawns per 100 adults. Area Adult Fawn Total F:100A Methow :100 Oka :100 Total :100 buck:doe ratio to hover below the historical minimum threshold of 10:100. Implementation of more restrictive seasons and a minimum management objective of 15 bucks per 100 does, have improved post-season sex ratios for the last several years; however, recently ratios have again declined and are hovering around the management minimum, likely in response to the lengthened general season. Habitat condition and trend Habitat quality and quantity have likely suffered from decades of fire suppression. The resulting tree encroachment and loss of early to mid-successional forage conditions diminish forage quality and quantity in the long-term. Historically, heavy and widespread livestock grazing pressure also negatively affected habitat, particularly during drought years when forage is limited and stock consume important deer browse in the late summer and fall when forbs and grass are dried and exhausted. Intensive grazing also fosters the establishment and spread of noxious weeds. Grazing impacts are partially offset by the availability of irrigated pasture and crops, depending on landowner tolerance of deer herbivory. In addition, loss of winter range, due to increased human population and associated development is likely also a significant contributor to reduced herd size. This has been true district-wide, but is most pronounced in PMU 21, particularly in the Methow Valley, where development pressure is extreme. In recent years, wild fires burned over 360,000 acres (about 210,000 acres this year alone) of deer habitat within the district, primarily at mid to higher elevations. This should improve summer forage quality and availability. Similarly, public agencies are pursuing a more aggressive prescribed burning policy near the forest/development interface. This could potentially revitalize winter forage over a significant Table 5. Spring mule deer population composition counts from PMU 21. F:100A is fawns per 100 adults. Year Adults Fawns Total F:100A : : : : : : : : : : : :100 26
27 Deer Status and Trend Report Fitkin area. Currently, grazing pressure is much reduced from a few decades ago, and better herd management has improved habitat conditions. On the other hand, a declining farm economy and associated loss of irrigated acreage, coupled with reduced tolerance for deer damage could in turn reduce available deer forage at lower elevations, and negatively affect deer production. Even more importantly, noxious weeds are an epidemic problem in Okanogan County. As fast as one pest species is brought under control, a new one appears to take its place. Landscape-wide habitat degradation is likely without a coordinated and aggressive weed control program. Local, State and Federal agencies are doing all they can to address this issue. Success will hinge on the availability of financial resources and successful biological controls. Like weeds, the threat from development pressure remains is intense and still accelerating, constantly consuming and fragmenting existing tracts of winter range. Traditionally, this problem has been most acute in the in the Methow Valley, but it is quickly becoming a District-wide issue. This is being mitigated somewhat by land acquisition and conservation easement purchases by WDFW and local land trusts, but this is not a complete solution, particularly as land prices escalate. More aggressive growth management planning is needed if critical private lands are going to continue to play an important role in deer conservation. After years of more aggressive road management that benefited deer and other wildlife, new developments may reverse this positive trend. The USFS is receiving considerable pressure to expand offhighway vehicle opportunities, which could potentially increase the amount and distribution of motorized use on the Forest. In addition, the status of existing USFS roadless areas is being revisited nationally, which could potentially result in reduced roadless acreage locally. Increases in motorized use and roaded forest land would result in some habitat loss and degradation, and would likely increase illegal harvest and disturbance of deer. It is hoped the combination of habitat protection, fire reintroduction, improved grazing management, and aggressive weed control, will slow, and perhaps even halt, population decline over the long-term. Management conclusions Mule deer populations had bottomed out several years ago after a series of severe winters, but have now rebounded nicely, fueled initially by high productivity and recruitment, and aided by conservative antlerless hunting seasons. Most recently, herd growth and harvest have reached a plateau, suggesting the herd may be reaching carrying capacity. More aggressive antlerless harvest may be needed to maximize productivity and minimize overuse of seasonal ranges. Even so, a gradual long-term population decline will likely continue if chronic reductions in habitat quantity and quality are not stopped. Whitetail deer numbers have also dipped during harsh winters, but also rebounded strongly in recent years. In the face of increasing human development, the long-term prognosis for expanding whitetail distribution and abundance is more favorable than for mule deer expansion. This is a function of the whitetail s ability to better handle habitat changes associated with human development, and the barriers to harvest on private lands, where white-tail tend to concentrate. In the short term, minimal recruitment in 2006 will mean reduced buck harvest in 2007 and possibly The recent shortening of the general hunting season and corresponding earlier closing date should improve buck escapement and raise the post-season buck:doe ratio. Recently, the percentage of bucks that are > 3-point in post-season surveys is also declining. The shorter general rifle season should also improve this parameter. Significant improvement in buck:doe ratios would open the possibility for lengthening the general season during the current 3-year cycle. Intensive management is needed to alleviate nuisance/damage problems associated with resident, valley-bottom deer. Local staff are developing an aggressive antlerless harvest strategy for low-elevation private lands slated for implementation during the 2007 season. Success will hinge on community participation and landowner cooperation. 27
28 Deer Status and Trend Report Patterson and McCall DEER STATUS AND TREND REPORT: REGION 2 PMU 21 GMU 243 PMU 23 GMUs 248, 254, 260, 262, 266, 269 PMU 26 GMUs 244, 245, 246, 247, 249, 250, 251 Beau Patterson, District Wildlife Biologist Tom McCall, Wildlife Biologist Population objectives and guidelines The vast majority of deer in the Wenatchee District are mule deer, although there are a few whitetails. Management objectives for Population Management Unit (PMU) 23, Douglas, are to maintain the mule deer population within landowner social tolerances and the post-hunting season minimum objective of 15 bucks:100 does. Management objectives for PMU 26, Chelan, are to maintain deer populations in balance with winter forage, limit conflicts with agriculture, and maintain the post-season buck:doe ratio above the minimum objective of 15 bucks:100 does. Composition surveys, harvest estimates, population modeling, and end of winter browse observations are used to monitor population progress toward objectives. One GMU in the district, 243, is a part of the Methow PMU. This GMU lost most winter-range shrub habitat to wildfire in 2001 and 2002; deer numbers are expected to remain low until habitat recovers. Hunting seasons and harvest trends The 2005 deer hunting seasons were comparable to 2004, and are very conservative compared to seasons prior to All general seasons are restricted to the harvest of 3-point minimum mule deer bucks. In addition, there were any deer permit harvest opportunities in several GMUs for youth, senior and disabled hunters. Deer season began with September early archery general deer season. The modern firearm and muzzleloader high buck season ran from September in a portion of GMU 243 (Lake Chelan National recreation Area), and in GMUs 244 (Glacier Peak Wilderness) and 249 (Alpine Lakes Wilderness). Early muzzleloader general deer season was open in six GMUs for seven days in early October. The early modern firearm general deer season was open 9 days in October in the Douglas GMUs, and 14 days in Chelan County GMUs. Early archery general deer season hunting was open in September for 30 days in most GMUs, and late archery general season deer hunting was open in 2 GMUs in late November and early December. There were no general late muzzleloader or modern firearms seasons. Limited-entry, special permit hunting was offered for all user groups. One hundred forty-five November modern firearms any deer permits were offered in six GMUs, thirty-five December muzzleloader any deer permits in two GMUs, and 300 November-December archery any deer permits in three GMUs; modern firearms and archery permits were reduced by 40 and 30, respectively, from 2004, however permits relaxed harvest limitations, as they were changed from any buck to any deer for One hundred twenty-five antlerless permits were issued in GMU 251, in addition to 115 any deer permits for youth, senior and disabled hunters, during the general season timeframe, representing no change from Three hundred seventy-five antlerless modern firearms permits and 200 muzzleloader antlerless permits were offered in Douglas County, representing no change from In addition, 230 any deer permits were issued in Douglas County GMUs for youth, senior and disabled hunters, representing no change from District-wide, buck harvest reached at least a 7- year low in 1997, with 644 bucks harvested, and had increased each season since through 2004, when 2,028 bucks were harvested (Fig. 1). In 2005, buck harvest declined to 1,747. In the Chelan PMU, the 1997 harvest of 247 bucks was the lowest on record. The reduction in harvest by 1997 was primarily influenced by the following factors: severe winter of , Tyee and Dinkelman fires (affected PMU 26), short modernfirearm hunting season, and 3-point minimum regulation. Conservative hunting seasons have been maintained since Douglas PMU harvest decreased dramatically from 1996 to 1997, but increased through Total increased every year from 486 in 1997, to 1,348 in 2002, and has declined since. Total Douglas PMU harvest in 2005 was 962 deer, comprised of 681 bucks and 281 antlerless deer. Total harvest decreased 1% in 2005; buck harvest declined 6%, while antlerless harvest increased 14%. While some of this decrease is 28
29 Deer Status and Trend Report Patterson and McCall likely due to reduced participation and changing from general to permit only youth, senior and disabled hunting in 2005, it appears deer numbers have also decreased, as have landowner complaints. Antlerless harvest opportunities were therefore reduced for 2004, and held at those levels in All Chelan PMU data support an increasing trend toward habitat carrying capacity , and reaching winter habitat limitations in Chelan s buck harvest in 2004 increased 26% from 2003, but is still only 55% of the 1992 harvest of 2,206 bucks (Figure 1). The 1992 buck harvest level may not be attained with the 3-point restriction for general seasons, even as winter ranges mature post-fire and when populations reach the 1992 level. The number of deer hunters in the Wenatchee District declined dramatically from 21,082 in 1992, to 6,438 in General season hunter numbers in 2005 were 8,232, a 7% decrease from 2004 (Figure 2). Hunter numbers declined in the Douglas PMU, and increased in the Chelan PMU. These trends are expected to continue in Vehicles kill a large number of deer each year in the Wenatchee District, based on data collected by the Department of Transportation. More deer are killed in Chelan County than Douglas County because the mountainous terrain forces migratory deer to lower elevations in the winter to avoid deep snow. Deer kill peaks in winters with deep snow accumulation at lower elevations. Surveys Both helicopter and ground surveys are used to monitor population composition. December surveys are done after deer have begun concentrating on winter range but before most antlers are dropped. These surveys are used to monitor post-hunt buck and fawn ratios relative to does. Ground surveys are conducted in late winter and early spring, after most winter weather but before dispersal, to monitor fawn:adult ratios as an index to survival. In the Douglas PMU, observed postseason ratios were 23 bucks and 57 fawns per 100 does (n=784). In the Chelan PMU, observed postseason ratios were 26 bucks and 57 fawns per 100 does (n=1,614). Adult (age 2+) bucks comprised 39% of Douglas bucks and 59% of Chelan bucks, while yearling (age 1+) bucks comprised 61% and 41% of observed bucks in Douglas and Chelan respectively. Fawn survival was extremely variable between the two herds; observed fawn:adult ratios declined 36% in the Chelan PMU, while no differential fawn:adult mortality was observed in the Douglas PMU. Population status and trend analysis Deer population status is quite different between the two PMUs that make up the Wenatchee District. The deer population in the Douglas PMU was reduced by the severe winter of However, winter conditions for these deer have been mild since this time, and the population quickly recovered. In addition, there have been significant habitat enhancements associated with the Conservation Reserve Program that have been beneficial for deer. Seasons from were designed to reduce deer, and this objective was met. As a result, 2004 and 2005 seasons were more conservative, with reduced harvest opportunities for antlerless deer. In the Chelan PMU, conservative seasons since 1997 allowed this population to steadily increase to postseason In Douglas and Chelan PMUs, there was little harvest of antlerless animals from 1997 to 2000 (range 0-40). The average yearly antlerless harvest from 1992 to 1996 was 233 in Douglas and 441 in Chelan. The 2002 antlerless harvest in Douglas, 426, is the highest in at least 11 years; the 2005 antlerless harvest was slightly above average. Antlerless harvest was reduced in 2004 and 2005 in the Douglas PMU, through reduction of antlerless opportunity permits. Antlerless deer harvest in Chelan is still extremely restricted; 149 antlerless deer were harvested in The Chelan PMU was severely impacted by the 1994 Tyee fire, which severely burned a large portion of the winter range, greatly reducing browse. In addition, the winter of was severe. As a result of lost habitat and winter weather, the deer population within the Chelan PMU declined, but has now recovered, based on the increase in the number of bucks harvested, high postseason buck:doe ratios, and high mature buck representation postseason despite increasing harvest. The deer population in Chelan County is predominantly migratory (89% based on a radio-collared sample of does), and is typically widely dispersed during the modern firearm season in mid- October. Forty percent of the bucks observed in Chelan County during post-hunt surveys in 2005 were legal (3 point +) bucks, below the 43% legal bucks observed in 2003 and 2004, and the 52% legal bucks observed in 2002; and total bucks per 100 does has declined from 31 in 2003, to 26 in While it appears harvest rates on legal bucks are increasing, this 29
30 Deer Status and Trend Report Patterson and McCall is still a high rate of legal buck escapement, suggesting relatively low harvest rates. Forty-nine percent of the bucks harvested in the Chelan PMU in 2005 were 4 point or bigger, further suggesting relatively low harvest rates. It appears the herd reached carrying capacity of the winter forage base postseason 2005, based on elevated fawn mortality and heavy browse utilization. Informal observations of winter range shrub conditions suggest deer use of available forage rapidly increased , and population growth rate has slowed slow as winter habitat carrying capacity is approached. The drop in harvest in 2005, in combination with observed increased use of winter range browse and reduced fawn:doe ratios in 2005, suggest the herd has reached the biological carrying capacity of the winter range in this PMU. As a result, near-term future management will be directed toward maintaining a stable, to slowly increasing, mule deer population. Antlerless deer harvest will be significantly increased in 2006, to slow population growth, protect winter range, and provide more harvest opportunity. The Chelan PMU has a deserved reputation for producing large numbers of mature bucks, and many hunters express interest in maintaining the high quality of bucks in this PMU. Buck post-season composition data suggest hunting pressure truncates the buck age structure in the Douglas PMU. Although hunting pressure is reduced in some locations due to the predominance of private lands, low numbers of 3+ aged bucks post-season suggest hunters are able to kill the majority of larger bucks in the PMU due to high visibility and ease of physical access to most areas. By contrast, the high proportion of older-aged bucks in the Chelan PMU support perceptions that many deer are unavailable for harvest under the current, early modern firearms general season structure. POP-II (Fossil Creek Software, v ) models have been created for both the Chelan and Douglas PMUs. The Chelan model simulation aligns well with observed data and is considered a reliable indicator of trend. Model simulations indicate this herd nearly quadrupled between spring 1998 and spring Historically, the Chelan PMU has supported much higher hunter numbers and harvest, and there is potential for some additional future herd growth without negatively impacting habitat, as winter range forage production increases. The Douglas model aligns less precisely, indicating further modeling and/or data needs, and is interpreted cautiously; however, the simulation supports harvest trends and field observations that suggest rapid recovery following 1997, a slight decrease from 2001 to 2003, and stabilization 2004 and Habitat condition and trend Wildfires caused short-term negative impacts to deer winter range in Chelan County for several years following 1994, but in some areas deer are now benefiting due to increased quantity and quality of forage. However, shrub recovery has been slow in some winter ranges, particularly at the lowest elevations, where deer are concentrated by snow accumulations at higher elevations. The Manson GMU in particular has been severely impacted by the 2000 Rex Creek fire and 2001 Deer Point fire, which collectively consumed 100,000 acres and have severely reduced winter browse. This herd segment is likely to be depressed for several years until shrub browse recovers. The Douglas population is more dependent upon agricultural crops (especially alfalfa and wheat) during winter than the Chelan population. The human population is increasing by nearly 2 % per year within the Wenatchee District. Residential and orchard development associated with this population growth continue to reduce winter range throughout the district. In 1967, Chelan County supported a harvest of 5,180 deer; it is unlikely the deer population will ever again sustain this level of harvest. Management conclusions Buck age structure in the Chelan PMU will require close monitoring in the future to avoid dramatically reducing buck numbers and age structure. We can probably meet buck escapement goals under the current season structure in Chelan without the 3-point regulation, because in most years many of the bucks do not move down to lower elevations where they are vulnerable to harvest until after the general modern firearms hunting season. However, the 3-point restriction is very popular with a large segment of the public, and is often credited for the large numbers of older, mature bucks seen on winter ranges. Consistent retention of this regulation for mule deer may also improve compliance with hunting regulations. It is necessary to phase in increased antlerless hunting opportunities as well. However, this population can be strongly regulated by winter conditions, and is susceptible to weather-related declines. For the general season, modern firearm hunting season length was reduced from 9 to 14 days in Chelan and 30
31 Deer Status and Trend Report Patterson and McCall Okanogan counties, in response to concerns about lowered buck escapement in Okanogan County, and hunter desires to maintain older aged, large bucks in the Chelan PMU. With the more open habitat conditions in Douglas, the 3-point regulation is working well and has increased total buck escapement. Prior to the implementation of the 3-point restriction in Douglas, buck escapement was low, estimated between 6-10 bucks:100 does. There are, however, concerns about the long-term ramifications of poor recruitment of older age bucks, as it appears most bucks are still being harvested by 3.5 years of age. Due to the open nature of this PMU, it is unlikely that age structure truncation can be avoided under general modern firearms season structure. Model simulations of the Douglas PMU have been hampered by insufficient, inconsistently collected postseason composition data. Additional helicopter composition survey resources would help address this shortcoming; currently, limited resources are prioritized in favor of the Chelan PMU, due to the majority of public land in this PMU and resulting unrestricted public access. Additionally, interchange between the Douglas population and the population to the south, PMU 25 (primarily in GMU 272), may be so extensive that PMU 23 does not function as a closed population. If additional, consistent efforts to classify deer in PMU 23 do not result in improved alignment of simulations with observed data, a marking study may be necessary to quantify interchange between these PMUs. 31
32 Deer Status and Trend Report Patterson and McCall No. of bucks Year Chelan (PMU 26) Douglas (PMU 23) Figure 1. Wenatchee District buck harvest No. of hunters Chelan (PMU 26) Douglas (PMU 23) Year Figure 2. Wenatchee District deer hunter numbers. 32
33 Deer Status and Trend Report Tabor DEER STATUS AND TREND REPORT: REGION 2 PMU 24 GMUs 272, 278, 290, and PLWMA 201 PMU 25 GMU 284 JIM TABOR, District Wildlife Biologist Population objectives and guidelines In Game Management Units (GMUs) 272 and 284, deer herds are managed to maintain herd size at a maximum level that can be tolerated in relation to deer damage claims/complaints and to maintain a post-hunt buck:doe ratio of at least 15:100. Part of GMU 272 contains the Buckrun Private Lands Hunting Program, which has special population objectives formulated by Buckrun management in conjunction with WDFW. In GMU 278, the goal is to maintain a herd size below habitat carrying capacity to minimize deer damage claims/complaints occurring on irrigated agricultural lands that make up a large percentage of this unit. Most deer in this unit occur in nonagricultural areas with a high percentage of public ownership. Herd management is intended to restrict most deer use to these public lands. In GMU 290, the management goal is to increase herd size to the long-term carrying capacity of habitat available on the Desert and Potholes Wildlife Areas without increasing damage claims/complaints from agricultural land adjacent to the wildlife areas. Additional objectives for this area are to maintain a buck:doe ratio of at least 30:100 post-hunt and maintain a high percentage of adult bucks ( 50 % of the total buck population). This GMU is managed primarily to provide a quality mule deer (Odocoileus hemionus) buck hunting opportunity through permit only deer hunting. Hunting seasons and harvest trends GMUs 272, 278, and 284 had a 30-day early archery season in 2005 split between Sept for 3- poin minimum bucks only and Sept for 3-point minimum bucks or antlerless for mule deer. Any white-tailed deer (O. virginianus) were legal for the entire 30 day archery season. In addition to the Sept. season, GMU 272 and 278 had a late archery season, Nov. 20-Dec. 8, for 3-point buck minimum or anterless mule deer or any white-tailed deer. GMU 290 had an any-deer, permit archery season with 21 permits for Nov All units except 290 had a nine-day general modern firearm buck season in 2005 (Oct ). In GMU 290, 15 permits were issued for a 15-day modern firearm any deer hunt (Nov. 1-15). In 2005, a legal mule deer buck in all GMUs except GMU 290 had to have a minimum of three antler points on one side. Exceptions also existed for the Buckrun Private Lands Program. Muzzleloader deer seasons in the Columbia Basin GMUs in 2005 included an early (Oct. 1-7) general season in GMUs 278 and 284 for bucks and 5 permit seasons that included both bucks and anterless deer. Antlerless permits were issued for all four GMUs in A total of 351 permits for anterless only and buck or anterless were available in Special seasons and regulations were in effect on Buckrun, contained in GMU 272. The deer hunting season for Buckrun in 2005 was Sept. 1-Oct. 14 and Oct. 24-Dec. 31. Hunting was by permit only. There were 182 permits available. In the 2005 season, 2,375 deer hunters hunted in the four Columbia Basin GMUs (Table 1). This represented 10% of Region 2 deer hunters. Hunting pressure, as measured by number of hunters in the four GMUs combined, decreased by 1% in 2005 compared to Hunting conditions during the 2005 general modern firearm season were not optimum. Weather was warm (60-70 F day and 40 s night) all 9 days of the season. Opening day was warm and windy in many parts of the district. Overall hunter success (all weapons) in the four GMUs combined was 26% and was 13% lower than that of 2004 and 9% higher than the 10-year mean of (Table 1). Highest hunter success (68 %) was in GMU 290, a limited-entry, permit-only area. Buck harvest in the four units combined was 529 in 2005 and decreased 17% from that of 2004 (637 bucks) and was less than the mean of 598 bucks (Table 1). Forty-six percent of the buck harvest in the four units was from GMU 272, 44 % from GMU 284, 6 % from GMU 278, and 4 % from GMU 290. In GMU 290, 13 of the 15 modern firearm any deer permittees reported harvesting 13 bucks. The four muzzleloader hunters harvested three bucks. Twelve of the 21 archery permittees hunted in the GMU and reported harvesting three bucks. Twelve of 50 anterless permittees hunted to harvest 13 deer. Antlerless harvest in the four units has fluctuated annually, primarily as a result of the number of permits 33
34 Deer Status and Trend Report Tabor issued. The mean 10-year ( ) harvest of antlerless deer in the four units combined was 151 (range, 42 to 256). Archers harvested 55 deer in the four GMUs in 2005 for 8% of the total harvest. In 2005, muzzleloader hunters accounted for 5 % of the deer harvest in the four GMUs. The four Columbia Basin GMUs produced 12 % of the buck harvest in Region 2 in Hunter success in the four Columbia Basin GMUs was 26 % compared to 19 % in the remainder of Region 2. Surveys Surveys to obtain data to estimate herd composition and size in the Columbia Basin GMUs have been limited in recent years to GMU 272, Buckrun (contained in GMU 272), GMU 290, and GMU 284. No surveys have been conducted in GMU 278. Post-hunt herd composition surveys have been done annually (except no survey in 1994) in GMU 272 including areas outside Buckrun. Surveys have been made from a helicopter, airplane, or from the ground from late Oct. through early Jan. In Buckrun (an intensively managed cooperative of approximately 44,000 acres), no counts were made in Post-hunt herd composition surveys were made in GMU 290 from a helicopter in December 1995 through In 1995, intensive counts from the ground supplemented data obtained from the helicopter and allowed an estimate of herd size to be made. In 1997, the helicopter survey (approx. 2 hours of survey time) failed to produce an adequate sample size to estimate the composition of the herd. From 1998 through 2004, the post-hunt survey for herd composition was made from the ground by volunteers and WDFW personnel. In 2005, the post-hunt survey was made by 30 volunteers. No post-hunt survey was made in GMU 284 in From late Oct through late Dec. 2005, 480 mule deer were classified in that part of GMU 272 outside Buckrun (Table 2). Post-hunt ratios were 23 bucks and 54 fawns per 100 does. Approximately 39 % of the bucks were judged to be adults. The buck:doe ratio increased considerably from that of The percent of adult bucks decreased slightly but the fawn:doe ratio increased from that of During the Dec. 17, 2005 post-hunt composition survey, 596 deer were classified in GMU 290 with 46 bucks and 45 fawns per 100 does (Table 3). There is no current estimate of herd size within the 250 square mile GMU 290. Population status and trend analysis Little data other than estimates of harvest are available for use to evaluate long term trends of deer herd size in the Columbia Basin GMUs. Based on annual buck harvest since 1980, it appears that deer numbers in GMU 272 increased substantially through 2000, but decreased steadily through The 1980 harvest was 112 bucks compared to the 2000 harvest of 416 bucks. In 2005, 244 bucks were harvested. In GMU 284, a trend similar to that of GMU 272 shows an increase in herd size since The 1980 harvest was 76 bucks compared to 235 in Buck harvest since 1980 in GMU 278 has been erratic and rather small but indicates that herd size has increased well above that of the early 1980's. The 1980 harvest was 10 bucks compared to 30 bucks in Post-hunt buck ratio in GMU 272 in 2005 was 23 bucks per 100 does and thus met the minimal objective of 15:100. Post-hunt buck ratio in GMU 290 in 2005 was 46 bucks per 100 does and was well above the management goal of 30 bucks per 100 does. Habitat condition and trend The winter of was moderate in terms of temperature and the amount and duration of snow cover in all GMUs. Winter conditions in all GMUs likely provided no major disadvantage for deer. Winter food for most deer in GMUs 272 and 284 is green winter wheat and fall/winter, new growth of non-cultivated plants. During the winter of , these short-stature foods were available to deer most of the winter. Although no formal surveys were made, winter mortality appeared to be very light in all GMUs. Three major changes in habitat have occurred in the Columbia Basin in the last 20+ years that appear to have affected deer significantly. Several thousand acres of primarily dryland wheat fields have been enrolled in the Conservation Reserve Program. Conversion of wheat to grass added permanent cover and some useful forage in the form of forbs primarily, but in some areas has removed a vital winter food resource (i.e., winter wheat). The spread of Russian olive trees in GMUs 278 and 290 has been rapid and dramatic in recent years. Distribution of deer in these units appears to be positively correlated to the occurrence of Russian olive. Wildlife damage Deer related damage claims/complaints in the Columbia Basin GMUs involve primarily orchards, alfalfa haystacks, alfalfa fields, and ornamental trees 34
35 Deer Status and Trend Report Tabor and shrubs. In recent years, some dryland wheat farmers in GMU 284 have complained that deer introduced weeds into their cropland. Orchard tree damage and damage to alfalfa haystacks are the most serious types of damage to private property in the Columbia Basin, and elicit the majority of claims/complaints. Orchard damage and the potential for it, is most prevalent in GMUs 272 and 278. Damage can occur at all times of the year, but is most serious in winter. Deer damage to alfalfa haystacks is confined to winter and is usually not a serious problem unless the winter is especially severe. Many deer feed in alfalfa fields and various row crops during the growing season in most GMUs but claims/complaints due to this use are minimal. During the winter of , no major claims/complaints were made for deer damage in the district. A small number of damage complaints were received from landowners in GMU 284. Management conclusions Acceptable buck:doe ratios, relatively high percent adult bucks, and near maximum sustainable buck harvests have been achieved in the Columbia Basin units in recent years. The post-hunt buck:doe ratio in GMU 284 has declined in the past few years to barely acceptable levels and adjustments to harvest may be needed. Population data for deer herds in the Columbia Basin GMUs are minimal at present. Post-hunt herd composition estimates have been made from sample sizes that are very likely too small to provide reliable estimates. Table 1. Mule deer harvest in GMUs 272, 278, 284, and 290 from Harvest Hunter Year Buck Doe Total Success Number , , , , , , , , , , , , , ,375 Table 2. Post-hunt mule deer herd composition in GMU 272 from Total Adult Per 100 Does Year Bucks Does Fawns deer Bucks (%) Bucks Fawns
36 Deer Status and Trend Report Tabor Table 3. Post-hunt mule deer surveys in GMU 290, Total Adult per 100 Does Year Bucks Does Fawns deer bucks (%) Bucks Fawns
37 Deer Status and Trend Report Livingston DEER STATUS AND TREND REPORT: REGION 3 PMU 31 GMU 381 Mike Livingston, District Wildlife Biologist Population objectives and guidelines The deer herd in PMU 31 is primarily comprised of mule deer, but a few white-tailed deer are harvested each year. Deer are managed to maximize population levels under a stable harvest regime while maintaining socially acceptable densities. Prior to 2000, PMU 31 was in Region 2 and was part of PMUs 24 and 25. Likewise, the western 1/3 of GMU 381 was formerly GMU 278 and the eastern 2/3 was formerly part of GMU 284. Post-hunt buck:doe ratio objectives are a minimum of 15 bucks per 100 does. Hunting seasons and harvest trends Since the unit s incorporation into Region 3 in 2000, an early Archery season has included all of September with any mule deer permitted. An Archery season for any white-tailed deer was added September Muzzleloader seasons were first established in the unit in To begin, an early 5-day Muzzleloader season was established in early October for any whitetailed buck or 3 point minimum mule deer. In 2002, any deer was permitted during the early season in the portion of GMU 381 west of Hwy 395 and SR 17 (Deer Area 3081). In 2003 the early season was lengthened to 7 days and the restrictions were changed to 3-point minimum or antlerless for white-tailed or mule deer. In 2004, the season was lengthened to 8 days. A late Muzzleloader season was established in late October/early December for 3-point minimum or antlerless mule deer in In 2003, the restriction was changed to 3-point minimum mule deer buck except in Deer Area 3081 where 3-point minimum or antlerless was permitted. Since 2001 the late muzzleloader season has varied between 12 and 19 days. Since 2003, 100 any deer muzzleloader special permits have been issued for late November/early December. Beginning in 2000, the Modern Firearm season has been 9 days long starting in mid-october with a 3-point minimum mule and white-tailed deer restriction except in Deer Area 3081 where any mule deer and any whitetailed buck was permitted. In 2004, the restrictions in Deer Area 3081 were liberalized to include any whitetailed deer. Several youth, senior and disabled special modern firearm permits have been issued each year. Total harvest has averaged 273 (range ; SE = 26.9) since The 2005 season was the second highest in total harvest (Table 1). Modern firearm hunters harvest more deer than other user groups, however, the early and late muzzleloader seasons have demonstrated this user group can be effective in open country. Combining muzzleloader general with muzzleloader special permits this group has taken between 32% and 45% of the harvest each year since Archery harvest remains minimal despite a lengthy season. In 2005, success was highest for special permit hunters (58%), second for general modern firearm (34%), third for archers (25%), and lowest for muzzleloaders (23%). Surveys Surveys to estimate population size have not been conducted in PMU 31. Post-hunt composition surveys were initiated in 2004 to estimate buck:doe:fawn ratios. These roadside surveys are conducted from a vehicle in eastern Franklin County near the Snake and Palouse Rivers in December/January prior to antler drop. Mule deer concentrate in winter on this landscape of dryland wheat, Conservation Reserve Program (CRP) lands and shrub steppe. During the 2004 postseason, ratios observed were 15 bucks and 60 fawns per 100 does (n = 264). The 2005 observations were 22 bucks and 77 fawns per 100 does (n = 238). In both years, only a couple of 3 point or greater bucks were observed. It is expected that the majority of legal bucks would be harvested each year in this open country unit. Roadside surveys, however, may be biased against observing older aged bucks since they may be less likely to occupy areas adjacent to roads. Population status and trend analysis In the absence of population survey data it is difficult to assess the status of the deer herd. Harvest and post-hunt composition data must be used as an index to status and trends. Further complicating analysis is harvest data are limited to six years and composition data to two years. Assuming these data are adequate indices, it appears that harvest has remained at a sustainable rate (Table 1). Total harvest has varied some while the trend in hunter numbers and success has gradually increased since 2000 (Fig. 1). A severe early winter could change this trend by making 37
38 Deer Status and Trend Report Livingston deer more vulnerable to hunters and to natural mortality. During the monitoring period, winters have been relatively mild. Also, the Columbia and Snake Rivers tend to moderate winter conditions, which frequently reduces the impact of severe winters. Composition surveys indicated that buck escapement was at the objective in 2004 and exceeded the objective in Mule deer buck harvest data indicated that a few older age class animals do survive each year. For example, in 2005, 73 bucks with 4 points, 25 bucks with 5 points, 6 bucks with 6 points and 5 bucks >6 points were taken. These older animals are likely being harvested from either the Hanford area or private land with very limited access. Estimated fawn ratios from the past two years ( x = 68.5 fawns per 100 does) indicate a healthy fawn survival rate through fall and into early winter. Habitat condition and trend A wildfire on the Hanford Reach National Monument in 2005 reduced the amount of Russian olives and other woody riparian vegetation surrounding the WB-10 ponds. Also, the USFWS is actively removing Russian olive and replacing with native like vegetation. This loss of cover may in the short term make deer more vulnerable to hunters and predators. In the long term, restoration of native vegetation including bunchgrasses, antelope bitterbrush and sagebrush may improve conditions for deer. Intense irrigated agriculture in the Columbia Basin irrigation project has severely reduced deer habitat in Deer Area However, irregular terrain and shallow soils in the northern portion of Deer Area 3081 resulted in some habitat escaping intense cultivation. Most of these lands receive various levels of livestock grazing. Numerous irrigation waterways traverse this landscape providing some cover and habitat. The eastern 2/3 of the PMU is a mixture of dryland wheat, CRP and shrub steppe. Minimal perennial water is available away from the Snake and Palouse Rivers. This landscape appears suitable to support relatively large numbers of deer in late fall and winter, but their numbers appear to decline in the drier areas as spring approaches. CRP acreage increased significantly with the 1998 signup. These contracts are up for renewal in If large numbers of contracts are not renewed important habitat will be lost. Management conclusions Data for PMU 31 are still preliminary given its relative recent establishment. Conclusions related to the affects of harvest strategies on population status and trends should be viewed with caution. Available data suggests that harvest rates have not negatively impacted deer numbers. Aerial surveys are needed to provide estimates of population size and a less biased estimate of buck:doe:fawn ratios than what road-based surveys may be providing. Table 1. Deer harvest in PMU 31 (GMU 381) by weapon type during the period Year MF MZ Archery Permits Total (2%) a -- 2 (0%) (2%) (5%) 94 (63%) 8 (50%) (26%) (3%) 136 (63%) 13 (62%) (29%) (2%) 93 (27%) 11 (36%) 43 (65%) 280 (21%) (7%) 57 (26%) 18 (50%) 44 (70%) 281 (24%) (4%) 73 (44%) 17 (24%) 42 (45%) 313 (20%) a Percentage of total comprised of antlerless harvest. Hunters Hunters Success Year 60% 50% 40% 30% 20% 10% Figure 1. Deer hunter numbers and success (weapons, seasons, & permits combined) in PMU 31 (GMU381) during the period % Success 38
39 Deer Status and Trend Report Bernatowicz DEER STATUS AND TREND REPORT: REGION 3 PMU 32 GMUs 328, 329, 334, 335 PMU 33 GMUs 336, 340, 342, 346 PMU 34 GMUs 371, 372 PMU 35 GMUs 352, 356, 360 PMU 36 GMUs 364, 368 JEFFERY A. BERNATOWICZ, District Wildlife Biologist Population objectives and guidelines The population goals for mule deer (Odocoileus hemionus) in these Population Management Units (PMUs) are to maintain maximum population levels compatible with available habitat base, provide recreational opportunity, and minimize damage complaints. The buck escapement objective is >15 bucks per 100 does post-hunting season. Hunting seasons and harvest trends Game Management Units (GMUs) 329, and 371 are restricted to permit only. All other units are open during the general modern firearm season for 3-point minimum bucks. The late archery season is open in GMUs 346, 352, 364, and 368. Archers were allowed to take antlerless deer in GMUs 328, , , and 368 are open for muzzleloader. The number of units open to muzzleloader increased from 3 to 10 units in Antlerless harvest for modern and muzzleloader hunters is by permit only. Deer hunter numbers decreased slightly in 2005, were below the 10-year average and about 50% below the highs in the early 1990 s (Table 1). A severe winter in reduced deer numbers and a 3-point restriction was implemented. Deer populations started to rebound, but hunters have been slow to return. Success rates in other parts of eastern Washington have been much higher than in Region 3. The increase in hunter numbers since 2002 was probably due to increased opportunity for all user groups. Harvest has steadily increased since 1997 and was above the 10-year average, but below the harvest from (Table 2). Buck harvest decreased for the first time in 4 years in 2005, but was offset by an increase in antlerless harvest. Hunter success has been above average the last 5 years. Surveys In December of 2005, attempts to ground survey portions of PMU 32 and 33 were made. The purpose of the December surveys was to estimate fawn and buck ratios (Table 3). Low deer numbers and poor weather Table 1. Number of deer hunters and success rate PMU s 32-36, Modern Muzzle- Success Year Firearm loader Archery Total Rate (%) , ,794 28, ,873 1,104 6,736 36, ,159 1,546 7,602 39, ,190 1,038 7,070 32, , ,343 30, , ,025 25, , ,705 25, , ,086 17, , ,455 13, , ,445 14, , ,599 15, , ,648 12, , ,577 12, , ,772 14, ,677 1,069 4,024 16, , ,836 16, avg 12, ,534 16,881 9 resulted in sample sizes too small to adequately estimate ratios. An aerial population survey of PMU 33 was conducted in April Population status and trend analysis Estimates of total population surveyed in spring are given in Table 4. The population estimate in PMU 33 decreased 48% from surveys in 2003 and The decline probably started during , despite one of the mildest winters in history. Ground surveys of winter range in December 2005 indicated a reduced population. The winter of did not appear to be severe in terms of temperature and snow depth, but started early and continued as cold rainy weather well into spring. Mortality was obvious on most ranges. 39
40 Deer Status and Trend Report Bernatowicz The expansion of an exotic louse Bovicola tibialis, which was first documented in the area in 2005, may be one factor in the population decline. Deer with signs of hair loss were observed in 2004 and observations have increased dramatically since then. Bovicola tibialis is separate from the exotic louse Bovicola cervicola, which has caused hair loss in the black tailed deer in western Washington and Oregon. PMU s 32 and 33 have been the hardest hit, but deer with clinical signs have been seen in PMU 35 and the lice are likely spreading into PMU s 34 and 36. The nearly 50% decline seen in PMU 33 may not be due just to lice infestations. Drought and winter conditions may also be involved. However, observations of deer with hair loss in PMU s 32 and 33 correspond with a decline in the 2005 buck harvest, despite a mild winter in Harvest did not decline much in the PMU s without significant reports of deer with hair loss. Harvest is not the best indicator of population, but is the only long-term index available. The change in harvest management from any buck to 3-point minimum regulation in 1997 also makes comparisons difficult. The mean buck harvest for was 28% higher than the mean buck harvest for the 1970s and 18% higher than the mean buck harvest for the 1980s. The average doe harvest in all 3 decades has been below 500 animals annually. The current deer populations are below the long-term average. Harvest peaked in the early 1990s after 7 relatively mild winters. Severe winters in and caused the population to fall dramatically. The lack of harvest and mild winters since resulted in a rebound in deer numbers until , when lice were first documented in Region 3. Harvest and surveys indicate the population is now declining. All PMU s have had buck ratios at or above the goal of 15 bucks per 100 does when surveys have been completed. It has been difficult getting large sample sizes in PMU s Bucks tend to be somewhat isolated from doe/fawn groups in December. Surveys have often concentrated on high-density ranges and probably underestimated buck ratios. Private lands also tend to have more mature bucks. Previous surveys were weighted toward public lands with good access. Habitat condition and trend There is little data on the historic or current condition of the deer range. Fires probably negatively impacted woody browse during the 1980s. Cheat grass has increased the frequency of fire and reduced woody browse on low elevation winter range. Over much of the range, grasses and dried forbs are the only available forage. A drought the last few years has likely impacted forage production. Houses are also being built in prime winter range. Management conclusions It is unknown how the lice will affect deer long-term, but the short-term outlook is bleak. It appears that populations have declined 50% in areas impacted by lice. The lice are spreading and a population decline in PMU 36 is expected. PMU 34 is more separated from infected populations, especially the southern end, and hopefully won t be affected in the near future. Management of PMU s 32, 33, 35 and 36 will be difficult if the impacts of lice and hair loss persist. One option is to provide hunting opportunity now and harvest antlerless deer at a Table 2. Deer harvest for PMU s PMU 32 PMU 33 PMU 34 PMU 35 PMU 36 Total Total Year Buck Doe Buck Doe Buck Doe Buck Doe Buck Doe Buck Doe , , , , , , , , , , , , , , , , , , , yr avg ,
41 Deer Status and Trend Report Bernatowicz high rate before they die during winter. This option may help slow the spread of lice. A second option would be to be very conservative with antlerless harvest in hopes that surviving deer might have some natural immunity and population will recover quickly. More discussions are needed with people knowledgeable about lice and deer before a management direction is chosen. Managing the populations will also require good survey data. The current spring surveys provide a good index to the populations, but funding is lacking for adequate coverage. PMU s 32, 33, 35 and 36 can only be surveyed every 3 years with current budgets. There is no funding for surveys in PMU 34. The current hunting season structure has helped increase buck ratios to the objective, but decreased harvest and the number of deer hunters participating. The hunters that have stayed in Region 3 are enjoying higher success rates than in recent years. Additional opportunity is being provided in the November after deer have migrated toward winter range. Post-season buck:fawn:doe ratios need to be further refined to adequately measure buck escapement and impacts of late season permit levels. Table 4. April mule deer population estimates. Year PMU NA NA NA NA NA NA NA Table 3. Deer composition survey data by PMU. Total Fawns: Bucks: Year PMU Sample 100 does 100 does NA NA
42 Deer Status and Trend Report DeBruyn DEER STATUS AND TREND REPORT: REGION 4 PMU 41- GMU 410 PMU 43- GMU 407 PMU 45- GMUs 418, 426, 437 PAUL M. DeBRUYN, Wildlife Biologist Population objectives and guidelines Our population goals for black-tailed deer (Odocoileus hemionus columbianus) in these Population Management Units (PMUs) are to maintain maximum population levels compatible with available habitat base, provide recreational opportunity, and minimize damage complaints. The population objective is to maintain a post-hunt buck:doe ratio of at least 15 bucks:100 does. Hunting seasons and harvest trends Hunting season formats differ between individual Game Management Units (GMUs) based upon geographic variation. GMUs 407 and 410 are island and coastal areas with a high human population distributed throughout the habitat base. Hunting season strategies in these units generally emphasize more conservative seasons and hunting methods (permit hunts, archery, muzzleloader, or shotgun). Either-sex hunts are more common in island and coastal units because deer populations are generally higher with less public access to private lands. GMUs 418 and 437 are characterized as mainland areas of mid elevation with lower human population densities than the more urbanized island and coastal regions. Historical harvest data indicates that deer harvest success increases substantially as GMUs move south from the Canadian border. It has been speculated that lower temperatures resulting from cold air intrusion from the Fraser River basin lower carrying capacity for deer in affected units. GMU 426 is a high elevation area situated well into the Cascade Mountain range. Features of this unit include low human population, limited road access, and severe geography. This eastern-most unit differs from other areas in that the deer populations in high elevation habitats support predominately mule deer or mule/black-tail hybrid populations, as opposed to black-tailed deer only in lower elevation units. Harvest and recreational opportunity profiles for GMUs The statewide total for deer hunters during the 2005 season was 135,653. This is a decrease from the 146,411 hunters documented for the 2004 season in Washington State. The number of deer hunters in Region Four also decreased slightly from 2004 to 2005, but has declined more than 50 percent over the last 6 years from 15,962 hunters in 1999 to 7,011 hunters in Region Four deer harvest for the 2005 was 1,642 animals (Table 1), a decrease from the 2004 total of 1,833 deer harvested. Table 1. Deer harvest for 2005 by hunting method in Region 4. Harvest Modern Firearm Archery MZL Total Antlerless Antlered Total Black-tailed deer harvest in GMUs during the 2005 season totaled 1,227 animals. Antlerless harvest for the 2005 season totaled 237 animals (19 percent) with antlered harvest totaling 990 animals (81 percent). While the number of hunters in GMUs 407 and 410 has fluctuated since 1999, the number of deer harvested has remained fairly stable from (Figures 1 and 2). In GMUs 418, 426 and 437, hunter success has increased from 6% in 1999 to 17% in 2005 (figure 3). The proportion of deer harvested in 2005 within GMUs (1,227 animals) as compared to the statewide harvest for the 2005 season (32,492 animals) indicates that these northern Region Four GMUs represent 3.7 % of the statewide total harvest. This number is consistent with the 2.9% of the statewide total harvest that came from GMUs in 2003 and 2004 Reported tribal harvest in GMUs for the 2005 season totaled 83 animals (55 bucks and 28 does). GMU 418 (Nooksack) accounted for approximately 54% of the total tribal deer harvest reported in GMUs during the 2005 season. Surveys In the past, herd composition surveys were not conducted in GMUs due to low deer densities and equally low hunter distribution and numbers. However, islands in GMUs 410 and 407 support higher densities of deer, which can be viewed foraging in fields at dawn and dusk. A survey effort was continued in 2005 to gather data on deer density trends and herd 42
43 Deer Status and Trend Report DeBruynn Table 2. July 2005 deer densities. Island Miles Driven Total Deer Deer/Mile Guemes Island San Juan Island Total Table 3. Deer herd composition July Buck Antler Class Island Spike 2 pt 3+ pt Total Doe Fawn Buck:Doe:Fawn Guemes Island :100:12 San Juan Island :100:47 composition on San Juan Island in San Juan County and on Guemes Island in Skagit County. The survey was conducted by driving standardized routes on the islands in the evenings during mid-july. A total of 118 deer were observed during the counts: 36 bucks, 59 does and 19 fawns. Chronic Wasting Disease (CWD) sampling efforts in 2005 were increased due to mailings sent to previously successful hunters and a rifle drawing for hunters that promptly notified WDFW after harvesting a deer so that a sample could be taken. Some samples from GMUs were tested and all were negative for CWD. CWD remains undocumented in GMUs Population status and trend analysis Surveys have been done for the last two years to assess deer density on San Juan and Guemes Islands. (GMUs 410 and 407). (see above). Given the short duration of the study the data gathered are less than conclusive but seem to indicate stability of the population. The only evidence of population status and/or trends in the mainland GMUs is the subjective observations of WDFW field employees (enforcement officers, fish and wildlife biologists) and the field observations of other natural resource agencies (DNR, State Parks, National Parks, and U.S. Forest Service) that consistently report fewer animals observed in traditional work areas over the last five to ten years. Wildlife damage Deer related damage to private property has remained a chronic problem throughout all of the mainland portions of north Region Four. No damage payments were made in this general area in San Juan County (GMU 410) continues to experience high deer damage problems associated with agricultural lands and residential properties. Deer/vehicle collisions remain high and are anticipated to increase as the human population in San Juan County continues to increase. Widespread posting of land and a county ordinance restricting hunting access to private property limit WDFW options for managing the deer populations in these areas of Region Four. A pilot hunter access program is being developed in association with landowners on Shaw Island to try to address damage issues as well as provide more hunting opportunity and thus population control. Habitat condition and trend No recent habitat analysis has been conducted to quantitatively define current habitat condition or trends. Road closures continue to increase and may buffer the influences of increased human disturbance throughout deer ranges in Whatcom and Skagit counties. Increased use of herbicides on private timberlands has been observed over the last three to five years. This practice had declined on state and federally owned lands over the last ten years and was considered to be of minimal concern when compared to historical herbicide use levels. It will be necessary to monitor this activity in order to evaluate actual impacts on local deer habitats. Management conclusions Recommendations for effective management of north Region Four deer populations include: 1. Implement a comprehensive habitat analysis of all deer range in Whatcom, Skagit, and San Juan counties. 2. Conduct herd composition surveys (age and sex class) in all GMUs in Whatcom, Skagit, and San Juan counties. Define population status in individual game management units using current population modeling techniques. 3. Finalize survey methodology for assessing deer density trends in San Juan County. 4. Increase hunter access to private land in San Juan County to alleviate deer damage. Provide incentive to landowners to create land pool available for hunting. 5. Confirm the absence of Chronic Wasting Disease in Whatcom, Skagit, and San Juan counties deer populations. Collect tissue samples for laboratory analysis through targeted surveillance of sick or emaciated adult deer. 6. Continue monitoring local deer populations for presence/absence, distribution and severity of hair loss syndrome. 7. Increase biological sampling for diseases and parasites in the San Juan Island Portion of GMU
44 Deer Status and Trend Report DeBruynn PMU 43 - GMU Total Harvest Total # Hunters Year Figure 1. Deer harvest and number of hunters in PMU 43, PMU 41 - GMU Year Total Harvest Total # Hunters Figure 2. Deer harvest and number of hunters in PMU 41,
45 Deer Status and Trend Report DeBruynn PMU 45 - GMUs 418, 426, Year Total Harvest Total # Hunters Figure 3. Deer harvest and number of hunters in PMU 45,
46 Deer Status and Trend Report Link DEER STATUS AND TREND REPORT: REGION 4 PMU 44 GMU 454 PMU 47 GMU 460 PMU 48 GMU 466, 485 RUSSELL LINK, District Wildlife Biologist Population Objectives Population objectives for Game Management Units (GMUs) 454, 466, and 485 are to maintain healthy population levels of black-tailed deer (Odocoileus hemionus columbianus) within habitat limitations, to provide recreational opportunity, and to ensure long-term population persistence. Population objectives for GMU 460 are to maximize harvest opportunity and maintain the posthunt buck composition ratio at a minimum 15:100 does. Past post-hunt composition ratios fell below the desired 15:100 ratio. This coupled with high yearling mortality based on check station data prompted closure of this unit to late buck hunting. Data collected from 1984 to 1996 showed an average of 46% (range 35-57%) of the yearling harvest occurring during the four-day November late season. Hunting Seasons and Harvest Trends Management strategies are similar for GMUs 454 and 466. Both have a modern firearm season from mid-october to the end of October with annual calendar date adjustments. Each has a four-day late buck season in mid-november, also with annual calendar date adjustments. Both have an early archery season, and GMU 466 has an any-deer late archery season. GMU 454 has an early muzzleloader season for any deer. GMU 454's more liberal seasons are designed to maintain the population at a level that helps prevents road kills and keeps damage complaints at an acceptable level. However, habituated, small deer groups do occur in suburban and rural areas of GMU 454, and because of private property and safety concerns, they do not receive comparable hunting pressure. GMU 454 exhibited a substantial increase in total modern firearm buck harvest beginning in 1999 (Fig. 1). Total buck harvest post 1998 showed an approximate 75% increase in harvest compared to previous harvests. While the number of modern firearm hunters reached their peak in 1999 and 2000 at 758 and 750 hunters respectively, the following years show a decrease in modern firearm hunters by roughly 300 hunters, yet buck harvest remained high. It is unclear why modern firearm hunters have had such an increased success over the last 5 years. While increased habitat modification continues with widespread new home and lot development, modern firearm hunters remain able to find accessible lands with ample opportunity to harvest a buck. Buck harvest in GMU 466 has moved back and forth indicating possible extrinsic factors in harvest rather than population changes (Fig. 2). GMU 466 antlerless harvest has shown some variation with yearly fluctuations most likely affected by dry early fall weather and early winter snowfall, both influencing hunter success. In GMU 466, the Northwest Indian Fisheries Commission Big Game Harvest Reports show tribal harvest levels that add an average 10.7 deer per year to the total harvest over the last 6 years (prior to ). This is an additional mortality source to the total deer harvest for GMU 466. Tribal harvest numbers are considered when evaluating future hunting seasons and population trends for GMU 466. GMU 485 has had a limited entry special permit hunt since Concerns over population declines and hunter pressure have reduced permit numbers with accompanying reduced harvest (Fig. 3). In 2000, the special permit hunt was designated as buck only. Beginning in 2003, a limited number of permits for persons with disabilities allowed the take of any deer. Deer that winter in the low elevations of GMU 485 may range into GMU 466 during other times of the year and be legally harvested (Raedeke 1995). Population guidelines for GMUs 466 and 485 are considered together, along with tribal harvest data, in order to make the best assessment of population trends. GMU 460 has been managed under an any buck legal strategy for more than 30 years. Harvest has varied over this period, averaging about 460 deer per year from 1984 to However, since 1998 the total deer harvest per year has remained well below the average. The late buck season closure in 1998 certainly contributed to the 41% decline in total buck 46
47 Deer Status and Trend Report Link harvest compared to Total deer harvest during the late season over the period averaged about 41% (range 24-52%) of the total harvest in GMU 460. Harvest declined from with buck take declining by more than 50% (Fig. 4). While archers and modern firearm buck take has declined in this time period, 2004 showed a resurgence in the modern firearm harvest, but in 2005 it went back down. Data collected from check stations in GMU 460 showed >71% and >85% of deer checked to be yearling (1.5 years) in 1997 and 1998 respectively. Similarly, during 1999 about 72% of deer checked were yearlings. This exceeds harvest guidelines and likely contributed to the low buck:doe ratios observed during post season composition counts in 1996 and 1997 (Table 2). Hunter check station results for 2000 recorded only 46% yearling deer. The post-hunt buck:doe ratios for these years are below the recommended level of 15:100 (WDFW 2003). The 1998 post-hunt count (18:100 buck:doe ratio) reflects the first post-hunting season count since implementing the closure of the 4-day late buck season. Post-hunt composition in 1999 was similar at 16.3 bucks per 100 does. However, the decline in the fawn: doe ratio (49 to 100) is a concern. In 2000 pre and post-hunt ratios continued to decline (Tables 1 and 2). Higher branched buck ratios may be confounded by the small sample of does classified, (n=21). Access fees have increased over time and may contribute to lower number of hunters in GMU 460. In addition, many long-time hunters of this unit have expressed their belief in a precipitous decline in deer numbers. Table 1. Preseason Deer Composition Survey Results from Helicopter in GMU 460 Branch Total Year Fawn Spike Buck Buck Total (N) No Data Surveys Currently no surveys are conducted in GMUs 454, 460 and 466. The Muckleshoot Tribe (MIT) has conducted population estimate surveys in GMU 485 since 2000 based on mark-resight/lincoln Peterson using radio-collared deer. Beginning in 2001, a new mandatory reporting requirement for deer was implemented to provide essential harvest information to game managers. In GMU 460, only a post-season survey was flown in More recent check station data provide little additional opportunity to gauge deer numbers due to low numbers of animals checked. In 2003, both pre and post season composition flights in GMU 460 resulted in classifying only 25 and 20 deer respectively. One buck was seen on the pre-season and only two bucks were seen on the postseason flight. The extremely low sample size does not allow us to calculate meaningful ratios from the data. In addition, the scarcity of deer seen on these flights carried out under the same historic protocols, raises concerns over a continued and apparent decline in deer numbers. Further restrictions on antlerless hunting were instituted for 2004, with archery season remaining buck only. A 3-year buck mortality study to determine mortality sources occurred in GMU 460. Yearly survival rates (Sept Sept. 2001) were with legal harvest the leading cause of mortality (Bender et al. 2003). Predation was the second leading cause, in addition to malnutrition, that may predispose animals to predation. Bender et al. (2003) further demonstrated that the late buck season accounted for substantial additive mortality. The closure of the late buck modern firearm season in 1998 appeared effective in increasing postseason buck escapement and increasing late buck season ratios. Other factors including parasitism, low fawn production, and habitat quality may all contribute to current population dynamics of GMU 460s deer herd and its apparent decline. Table 2. Postseason Deer Composition Survey Results from Helicopter in GMU 460 Branch Total Year Fawn Spike Buck Buck Total (N) a b a (flown ) b (flown thru 12-14, 98) Population Status and Trends Precise population estimates for GMUs 454, 460, and 466 are unavailable. Since 2002, only mandatory hunter reports have been used to monitor deer 47
48 Deer Status and Trend Report Link population trends and determine hunting regulations (Table 3). During the 2005 biological year survey in GMU 485 some bucks may have been classified as does. The buck:doe ratio was very low. Harvest, survival, and previous fawn crop do not justify such a low ratio. It is likely higher. A population increase was detected, although confidence intervals among years overlap. Radio-marked doe survival, previous fawn ratios, and low harvest do suggest that there should be a population increase (Vales unpubl. data 2006).). Table 3. Trend in Deer Population in GMU 485 Year # seen Fawn: Buck: Pop Est. Doe Doe Based on limited, primarily anecdotal information, deer in GMU 454 have exhibited little change. Based on MIT surveys, deer in GMUs 485 and 466 appear to be on the slight increase, however, confidence intervals are wide and therefore true changes in population may be dubious. Fluctuations in deer numbers in GMU 466 may be because of a reduction in habitat quality and/or predation. Limited empirical data beyond harvest trend assessment belies our ability to estimate population changes. In GMU 460 and beginning in 1996, black-tailed field surveys documented a hair loss syndrome that affects deer during the late winter and early spring surveys. It appears this has negatively influenced deer survival and recruitment, particularly fawns. Over a three-year period Bender and Hall (2001) reported rates of hair-slip syndrome in fawns as 55, 74, and 46% from The effects of hairloss syndrome on black-tailed deer throughout western Washington will likely never be completely understood. Habitat Condition and Trend In general, the long-term trend in GMU 454 deer habitat is for a continued decline. This is consistent with development of habitat currently used by deer. However, deer are taking advantage of 2-10 acre tracts that are cleared for homes. These tracts still provide and may even improve deer forage availability, particularly during winter months, thereby improving overall body condition. This alone can lead to higher productivity and increased survival. Further, because many of these private lands are not open to general public, hunting mortality may be reduced. This can lead to increasing deer densities and may prompt some deer dispersal to surrounding habitats that are available to hunting in GMU 454. The significant majority of GMU 460 is managed for timber production. Annual timber harvests create a mosaic of seral stages that can be beneficial to deer. Openings of 1 to 10 acres exist that provide a good forage base as well as riparian corridors protected by Forest and Fish rules. The forest stands in these corridors provide older age classes that diversify habitat and help intercept snow during harsh winters; this may provide deer access to forage in these sites and serve as travel corridors. Note: the spraying of herbicides on private industrial timberlands is of concern. In an apparent increase in timber harvesting in the Snoqualmie Forest portion of GMU 460 may provide an increased forage base for deer over time; however, note the above concern. In addition, in 2004 King County announced the purchase of development rights on the King County portion of the Snoqualmie Forest (app. 90,000 acres). This will protect a large area of commercial forest as open space and de facto deer habitat, yet without additional research into the relationship between current conditions, herbicide application, and deer populations, habitat quality will remain in question. Deer habitat trends in GMU 466 and 485 are most dependent on timber management and subsequent seral stage development that determines forage availability. There are several thousand acres of timberlands managed primarily for wood fiber production, with considerations for recreation, fish, and wildlife. Wildlife Damage and Nuisance Problems In GMU 454, deer damage to ornamental shrubs and gardens can be a problem and numerous complaints are received every year. These deer are supported by many citizens and equally condemned by others because of associated property damages. There are no damage complaints for deer in GMUs 460, 466 and 485. Management Conclusions Deer in GMU 454 should continue to be managed with liberal seasons designed to prevents road kills and keep damage issues at acceptable 48
49 Deer Status and Trend Report Link levels in developing areas. Isolated sub-herds, generally on the eastern boundary of the GMU, should continue to offer hunting and recreational viewing opportunity. In GMU 460, continue the late buck season closure for modern firearms and measure response by monitoring post-hunt buck:doe ratios. Additional research looking at productivity, herd age structure, forage availability, and forest management practices as well as new methods to evaluate herd composition and estimate population would provide vital information in understanding the future outlook of deer in North Puget Sound and implications of industrial forest management on herd dynamics. In cooperation with the Muckleshoot Tribe and Tacoma Water, surveys should continue in GMUs 485 and 466 to increase sample size for population estimation and gain a better assessment of herd composition. Literature Cited Bender, L.C. and P.B. Hall Hair-slip syndrome of Black-tailed deer: a description and population impacts. Final Report. Washington Department of Fish and Wildlife. Bender, L.C., G.A Schirato., R.D. Spencer., K.R. McAllister, and B.L. Murphie Survival, cause-specific mortality, and harvesting of buck black-tailed deer in Washington. Final Report. Washington Department of Fish and Wildlife. Washington Department of Fish and Wildlife Game Management Plan, July 2003-June Raedeke, K.J. and D.A. Milligan Raedeke Big game management plan for the Green River Watershed, Tacoma, Washington. Raedeke Associates, Inc., Report to Tacoma Public Utilities, Water Division. 86pp. Vales, D.J Personal communication. Muckleshoot Indian Tribe Biologist. Total Deer Harvest, GMU 454 Harvest Year Buck Doe Figure 1. Annual deer harvest in GMU 454, *2004 harvest reflects uncorrected raw data reported from hunter report 49
50 Deer Status and Trend Report Link Total Deer Harvest, GMU 466 Harvest Year Buck Doe Figure 2. Annual deer harvest in GMU 466, *2004 harvest reflects uncorrected raw data reported from hunter reports Total Deer Harvest, GMU 485 Harvest Year Buck Doe Figure 3. Annual deer harvest in GMU 485,
51 Deer Status and Trend Report Link Total Deer Harvest, GMU 460 Harvest Year Buck Doe Figure 4. Annual deer harvest, GMU 460, , general season and special permit combined. *1997 was last year of late buck hunt. * st year of buck only archery hunt Total Hunters, GMU 460 No. of Hunters Year Figure 5. Number of deer hunters, GMU 460, , general season and special permit combined. *1997 was last year of late buck hunt. *2002 increase in access fee-hancock Forest Management. 51
52 Deer Status and Trend 2006 Milner DEER STATUS AND TREND REPORT: REGION 4 PMU 46, GMU 448 and 450. RUTH L. MILNER, District Wildlife Biologist Population objectives and guidelines Population Management Unit (PMU) 46 is composed of Game Management Units (GMU) 450 and 448. GMU 450 is a relatively small, high elevation area. Most hunting within the PMU takes place in GMU 448, which is the larger and more accessible GMU. Objectives for black-tailed deer (Odocoileus hemionous columbianus) in PMU 46 are to provide healthy and stable deer populations for the long term and to maximize harvest opportunity and hunt quality despite an increasing human population, which is impacting the availability and quality of habitat for deer. Hunting seasons and harvest trends The 2005 hunting season in GMU 448 was similar to previous years, with the general modern firearm season open for any buck from Oct 16-31, the general archery season open for any deer from Sept. 1-30, and the general muzzleloader season open for any buck from Oct 1-7. Late buck seasons were closed for all weapons. A slight decrease in hunter numbers was seen in GMU 448 in Almost 700 hunters (Figure 1) reported hunting the unit in 2005, compared to 773 in 2004, 736 in 2003, and 770 in This continues a trend first seen in 2001 when hunter numbers declined by over 50%, compared to previous years (Figure 1). One hundred nineteen deer were harvested from the unit in 2005, with hunters marking a 17 % success rate. These numbers are relatively consistent with harvest numbers and success rates seen since Sixty hunters reported hunting in GMU 450, with 5 bucks harvested for an 8% hunter success rate. This is a slight decrease compared to 2004, when 81 hunters harvested 11 deer, with a 14% success rate. Eighty-six percent of hunters used modern firearms, and this group harvested 81% of the deer taken from GMU 448. Archery hunters comprised 13% of hunters in GMU 448 and took 18% of the deer. Muzzleloader hunters accounted for less than 1% of hunters, as only 9 people reported using that weapon type in GMU 448, with 2 deer harvested. All hunters in GMU 450 used modern firearms. All deer harvested with modern firearms and muzzleloaders were antlered. Archers harvested 9 antlerless animals. Game Management Unit 448 is hunted by the Swinomish, Sauk-Suiattle, Tulalip and Stillaguamish Tribes. Tribal members harvested 10 bucks and 3 antlerless deer from GMU 448 in Surveys Population surveys were not conducted in GMU 448 in Population status and trend analysis Insufficient data exist to model the deer population in PMU 46. However, hunter numbers and the number of deer harvested have remained relatively constant for the last 4 years, indicating that conditions are stable in this geographic area. Habitat condition and trend Much of the forest habitat available on USDA Forest Service lands is in a mid-rotation age class, with relatively tightly stocked stands that provide limited understory forage. These conditions provide limited forage for deer, with the nutritional quality of the forage available unknown. Clear-cutting continues on private and State owned timberlands in GMU 448. However, herbicidal sprays applied in many clear cuts to control brush may limit forage available to deer in parts of the area. Increasing human developments in Snohomish County affect the amount of habitat available for deer, as well as limiting hunter access in some areas. We expect this trend of shrinking habitat available to deer to continue, as the human population of the County continues to grow. Access to large tracts of land continues to be a challenge in many parts of the PMU, as many public landowners are gating or decommissioning their roads and prohibiting the use of motorized vehicles. Management conclusions Hunter numbers, total deer harvested and hunter success has remained relatively similar over the 52
53 Deer Status and Trend 2006 Milner last 4 hunting seasons. Hunter success remains higher than hunter success reported for a decade prior to 2001, even though the number of hunters who choose to hunt this PMU has declined by 50% since that period. For those hunters willing to hike or bicycle into areas where access is gated and for those who look for less crowded Game Management Units, GMU 448 continues to offer opportunity to all user groups. Figure 1. Total Deer Harvest and Total Number of Hunters in GMU 448: Total Harvest Total # Hunters Year 53
54 Deer Status and Trend 2006 Milner Figure 2. % Harvest Success in G M U 448: % 16% 16.0% 16.0% 15.0% 14% 12% % Successful Hunters 10% 8% 9.0% 9.0% % H a rv e s t S u c c e s s 6% 4% 4.0% 2% 0% Year 54
55 Deer Status and Trend Report Holman DEER STATUS AND TREND REPORT: REGION 5 PMU 51 - GMUs 578, 588 PMU 52 GMUs 564, 568, 574 PMU 53 GMUs 524, 554, 556, 558 PMU 54 GMUs 516, 560, 572 PMU 55 GMUs 510, 513 PMU 56 GMUs 503, 505, 520, 550 PMU 57 GMUs 501, 504, 506, 530 GMU 382 Eric W. Holman, Washington Department of Fish and Wildlife, 600 Capitol Way North, Olympia, WA Population objectives and guidelines Black-tailed deer (Odocoileus hemionus columbianus) populations in southwest Washington are managed under the Washington Department of Fish and Wildlife's (WDFW) mandate to maximize recreational opportunities within the framework of preserving the biological integrity of the species. Specific objectives are to maintain the existing population and a minimum buck escapement of 15 bucks per 100 does (WDFW 2003). Hunting seasons and harvest trends Information on black-tailed deer harvest and hunter effort during the 2005 hunting season was obtained from WDFW s mandatory reporting system. Estimates of total harvest, hunter effort and hunter success are based upon reports submitted by the hunters. All hunters are required to submit hunting activity reports regardless of success. Black-tailed deer are hunted under WDFW s resource allocation strategy. Hunters must select a weapon type (modern firearm, muzzleloader, or archery) with which to hunt. Each weapon type has distinct seasons of varying lengths designed to provide equal opportunity. The fundamental structure of each hunting season is grouped into 3-year packages. This report period is encompassed by the , 3-year package. During the 2005 general deer-hunting season, modern firearm hunters made up 77% of the hunters, archery accounted for 14%, and, those choosing to hunt with a muzzleloader made up 9%. Several harvest strategies are employed in Region 5. During the general modern firearm season, the majority of Game Management Units (GMUs) are managed under an any-buck strategy, where any buck with visible antlers is legal for harvest. Selected GMUs (558, 574, 578, and 588) are managed under a 2-point or greater harvest regime. Finally, GMU 382 is managed as a mule deer unit, with a 3-point minimum. Muzzleloader harvest is primarily restricted to any buck, except for those seasons that occur in the branched antler GMUs above. Similarly, archery hunters are subject to the same branch-antlered buck restrictions as modern firearm and muzzleloader hunters. Harvest of antlerless deer during archery season is legal in the majority of GMUs. However, those archery hunters electing to hunt in GMUs 506, 530, 550 and 568 are restricted to bucks only. Apart from the archery harvest, antlerless permits are allocated based on the estimated population of deer in selected GMUs. Additionally, the damage history and record of nuisance complaints (social carrying capacity) within GMUs is considered. In 2005, an estimated 28,628 hunters spent a total of 169,910 days deer hunting in Region 5 (Table 1). Total general-season deer harvest in 2005 was 5,576 with a hunter success rate of 19% (Table 1). The percentage of hunters that harvested a deer in 2005 was slightly above the 10-year mean of 17%. However, the total deer harvest was slightly below the mean harvest of 6,366 recorded during the period from Table 1. Deer Hunter Numbers and Harvest Statistics for Region 5, Year Hunters Days Harvest Success (%) , ,288 6, , ,458 7, , ,517 7, , ,082 6, , ,550 6, , ,908 7, , ,360 5, , ,850 5, , ,370 6, , ,910 5, Hunter success rates and deer harvest were not evenly distributed throughout the Region. Those PMUs (53, 54 and 55), located in the Cascade 55
56 Deer Status and Trend Report Holman Mountains, contributed relatively less to the overall deer harvest than their lower elevation counterparts. In turn, those hunters electing to hunt in Cascade Mountain GMUs reported a lower level of success relative to other areas of Region 5 (Table 2). Table 2. Region 5, 2005 Deer Hunters, Harvest per Square Mile and Hunter Success by PMU. PMU Hunters Kill/SQ Mile Success (%) GMU In addition to the deer hunting effort and harvest discussed above, 807 hunters participated in special hunts open only to permit holders in These hunters enjoyed a combined success rate of just over 45%. Table 3 details the hunter effort, harvest and success rate of special deer permit holders in Region 5 during Table 3. Region 5, 2005 Special Deer Permit Hunter Activity and Harvest Summary. Permit Antlered Antlerless Total Success Hunters Type Kill Kill Kill (%) Modern Muzzldr Archery Senior Disabled Youth Total Surveys Region 5 black-tailed deer demographics are collected from several types of annual surveys and data collection efforts. These surveys include; (1) annual biological sampling stations, (2) annual summer productivity surveys, (3) annual spring counts of the Klickitat deer herd, (4) evaluation of female deer age structure from tooth analysis, and (5) post-hunting season surveys. Data from the sampling stations, productivity surveys, and tooth analysis are used as inputs into the Sex-Age-Kill (SAK) population reconstruction model. Sampling stations designed to collect deer biological data were established in Two voluntary deer sampling stations were staffed by a combination of Regional Staff and volunteers during the opening weekend of the general firearm deer season, October Biological sampling stations were located near Yacolt and Kelso, primarily sampling deer from GMUs 568 and 550 respectively. Stations were strategically placed near routes of travel from popular hunting areas to maximize the number of deer checked. Additionally, deer were spot-checked at hunting camps in GMU 382. Deer encountered during these efforts were examined by WDFW personnel and/or qualified volunteers. Age, sex, number of antler points, and GMU of harvest were taken from each deer. Age was determined by tooth irruption and deer were grouped into one of three discrete categories (fawn, yearling, adult) at the discretion of the examiner. Brain-stem samples were also collected from some deer and submitted to WDFW s veterinary Staff for Chronic Wasting Disease testing. Data retained at the Regional level are used to determine the percentage of yearling bucks in the total buck harvest (=1.5 years old). In an age stable population, this percentage is assumed to be equal to the overall buck mortality rate i.e. yearlings are replacement animals filling voids left by the previous year s mortalities. Central to this relationship is the assumption that adults are as vulnerable to harvest as yearlings. A total of 39 male deer were aged at the biological sampling stations during October The annual yearling buck percentage (AYBP) from any-buck GMUs was The trend in the annual buck mortality rate has been upward (R²=.38) since initiation of this data collection effort in Annual buck mortality rates in the range of 40%-50% are indicative of a lightly exploited population. The increase in estimated buck mortality rates from may be indicative of increases in non-hunting related mortality. However, small sample size and potential bias related to opening weekend deer hunting are problematic in this data set. Additionally, operation of the check stations is difficult logistically and requires far more staff than those available. For these reasons, the 2005 AYBP used for calculation of the SAK model in Region 5 was generated from harvest data. Through this means, the buck mortality rate may be calculated from a sample of all reported deer harvested in the Region. Buck age is correlated to antler size in a consistent manner but varies throughout the Region. An appropriate buck mortality rate based on this correlation was applied to broad portions of the Region (Willapa, Cascades and Klickitat). This method of calculation results in buck mortality rates of approximately 40% across the Region. This rate is considerably lower than those generated from check station data. See Figure 1 for a graphic display of the AYBP and number of deer sampled at check stations from
57 Deer Status and Trend Report Holman The long-term estimate of annual doe mortality rates in the Region is A large-scale effort to characterize doe mortality rates was undertaken in Tooth envelopes and an explanatory letter were sent to all hunters possessing an antlerless permit in Region 5. Additionally, incisors were taken from any female deer checked at the check stations or recovered from meat lockers. In 2001 a sample of 96 harvested female deer from the western portions of Region 5 resulted in an annual doe mortality rate of A sample of 68 females from PMU 51 (GMUs 578 and 588) resulted in an annual doe mortality rate of Efforts to collect female deer teeth for ageing in subsequent years have relied on less expensive and less effective methods. These have included collection of doe teeth at check stations and meat lockers as well as from road-killed animals. These efforts ( ) have not resulted in the collection of a useful data set for adequate evaluation of the annual female mortality rate. Updated data on the female mortality rate of deer in the Region would facilitate improved population estimation and improve the ability to appropriately establish antlerless deer seasons. # of M ale Deer Checked from "Any- GMUs Figure 1: Region 5 Annual Yearling Buck Percentage Deer Checked AYBP Summer deer productivity surveys were first established in In 2005, deer observations were conducted throughout the Region from August 15 th to September 30 th. Personnel from WDFW s Wildlife Management Program along with a variety of volunteers from within WDFW, the U.S. Forest Service, private timber companies, tribal nations and interested individuals recorded observation data for all deer encountered during field activities or recreational outings. In addition to these incidental deer observations, multiple night deer surveys (spotlighting) were conducted by a combination of Wildlife Management Staff and volunteers. Deer group sizes and composition were determined. All deer were classified as bucks, does, fawns, or unknowns. However, only those groups of deer in which all individuals were classified were included in statistical analysis to help eliminate observer bias. During the 2005 productivity surveys, a total of 585 deer were classified. The mean value of.55 fawns/doe is the highest rate recorded since 1999, but still well below Annual Yearling Buck Percen historical productivity data (.75) for the Region (Figure 2). The surveys are conducted after the peak of neo-natal mortality, so these values are likely closer representatives of ultimate recruitment than fecundity. For the purpose of calculating the SAK model, more specific productivity rates are assigned to aggregations of GMUs. # of Deer Classif Figure 2: Region 5 Deer Productivity Survey Results Number of Deer Classified Fawn to Doe Ratio For spring counts, four permanent survey routes centered on the Klickitat Wildlife Area, near Goldendale were censused on 7-8 March Transects were driven on the evening of the 7th and morning of the 8 th. Deer group sizes and composition were determined. All deer were classified as fawn, adult, or unknown. The fawn:adult ratio was determined. A total of 450 deer were classified during the March 2006 Klickitat deer survey (Table 4). The resulting fawn:adult ratio of 0.66 is indicative of excellent over-winter survival. The longterm mean ( ) ratio for this area is Long-term correlations ( ) between the spring fawn:adult ratio and the overall buck harvest in GMU 588 the following fall are significant (r = 0.59). These analyses indicate that spring surveys are a good predictor of hunting success in GMU 588. The biological significance of this relationship is straightforward. First, since fawns are generally more vulnerable to resource shortages and other environmental stress, low fawn:adult Table 4. Historic Fawn:Adult Ratios for the Klickitat Spring Deer Survey, Year Total Deer Classified Fawn:Adult # of Fawns per D 57
58 Deer Status and Trend Report Holman ratios indicate tougher over-wintering conditions and likely lower overall survival of deer. High winter mortality across all age classes will result in lower fall harvests. Secondly, biological sampling station data indicate that many yearling bucks (approximately 56% in GMU in 588) develop two points on at least one antler and are therefore legal for harvest at age 1.5. Depressed fawn:adult ratios in the spring mean fewer yearling bucks will be available in the fall; hence, a lower total buck harvest. The long-term mean fawn:adult ratio is 0.47, and is an indicator of average conditions. Using the long-term mean ratio as a benchmark, ratios above 0.52 are indicative of better-than-average hunting conditions, whereas ratios below 0.42 predict relatively poor fall hunting in Klickitat County. Limited post-season deer herd composition surveys were initiated in Region 5 in The surveys are intended to evaluate the effectiveness of current management strategies in meeting the goal of 15 bucks per 100 does following hunting season. Secondarily, the surveys provide an additional opportunity to evaluate the annual fawn to doe ratio. The more open habitats of Klickitat County offer suitable survey conditions during daylight hours in winter. The surveys were conducted by Regional Wildlife Program Staff during December. The timing of postseason surveys was selected to fall after the conclusion of the year s final hunting season (late archery) and prior to the initiation of antler casting (approximately January 1). Ground surveys were conducted in GMU 588 and 382. The results of these post-season deer surveys are listed in Table 5. Table 5. Post-Season Deer Composition Survey Summary, GMUs 588 and 382, GMU Year Total Deer Classified Bucks:Does:Fawns :100: :100:56 2:100:59 GMU Year Total Deer Classified Bucks:Does:Fawns :100: :100:68 15:100:57 The results from these survey efforts indicate that current management regimes are just meeting objectives in GMU 382, but are failing to do so in GMU 588. A continuation of these survey efforts will be required to adequately assess ongoing management efforts. Ideally, this would include the availability of funding for aerial surveys. Population status and trend Information compiled from hunting activity suggests stability of the deer population in the Region. Hunter success rates over the past 14 years have remained very consistent (R²=.01). Similarly, hunter days per kill has not changed (R²=.01). In contrast, total deer harvest has slowly declined (R²=.62). However, the reduced harvest in recent years can be explained by a reduction in the number of hunters choosing to pursue deer in Region 5. Biological data also indicate stability in the Regional deer population. See Figure 3 for a graphic illustration of the estimated deer population in Region 5, generated from the Sex Age Kill Model Figure 3: Region 5 Estimated Pre-Season Deer Population Bucks Fawns Habitat condition and trend Increasing urbanization in several GMUs (504, western portion of 550, 554, and 564) is resulting in a loss of quality deer habitat, an increase in deer/human conflicts and loss of hunting opportunity. Additionally, the increase in residential development along the Lewis River drainage may be negatively impacting the quality of black-tailed deer range. A portion of this habitat loss is being addressed in mitigation agreements concerning the three major hydroelectric projects (Merwin, Yale, and Swift reservoirs) on the North Fork Lewis River. Additional negative impacts to deer habitat are the result of forest management activities. While forest canopy removal (natural or otherwise) generally increases forage production, certain aspects of forestry are detrimental to black-tailed deer. Specifically, herbicides are extensively used by both private and public forest managers to kill, suppress and preclude the establishment of competing vegetation (WADNR 2005; WADNR 1997). The broadleaf shrubs, trees and forbs eliminated by these efforts are the very plants that comprise the black-tailed deer diet (Crouch 1981; Brown 1961). Also, the stocking rates for seedlings in forest plantations are high, further reducing the competitive advantage that many forage species would normally have in earlysuccessional forests. Once the densely stocked conifer seedlings reach approximately age 12, very little light is able to reach the ground, further reducing forage production. This removal of deciduous tree species along Does 58
59 Deer Status and Trend Report Holman with shrubs and forbs comes at the detriment of deer and other early successional species in the forested environment. Furthermore, these dense conifer stands are harvested at approximately age 40. Harvest of such monocultural stands at a time prior to differentiation among the trees within the stand or generation of forest openings, helps assure that a significant growth of understory shrubs does not occur. Lastly, timber harvest requires the construction and maintenance of a vast system of forest roads to facilitate the removal of forest products. Studies have demonstrated the negative effects of roads on ungulates (Powell and Lindzey 2004; Rowland, et. al. 2000). These impacts primarily include the loss of security associated with increased human access to remote areas. Additional negative impacts from roads are likely associated with weed dispersal, direct loss of habitat due to hardened surfaces, soil erosion and a loss of thermal cover. In aggregate, these forest management activities cause reductions in forage production, community complexity and early successional vigor. These impacts are detrimental to deer and atypical of young forests following natural disturbances. In the Cascades (GMUs 513, 516, 558, 560, 572 and 574), the downward trend in the deer population is longterm and likely the result of habitat condition. Large amounts of forested habitat were clearcut in the 1980s prior to (or in anticipation of) the listing of the northern spotted owl. Those forest stands harvested in the 1980s are now largely at an age (16-26 years), where forage production is minimal. In the Cascades, largely held in Federal ownership, subsequent timber harvest has been tremendously reduced. Additionally, the level of timber harvest anticipated under the Northwest Forest Plan has not been realized (USFS 1998). Furthermore, stocking rates for domestic livestock (cattle), have not been appropriately changed to reflect reduced forage availability. A review of the literature lends strong evidence to suggest that cattle may cause elk to shift their diet away from grasses and towards the browse plants favored by deer (Stewart, et. a.l. 2002; Coe, et. al. 2001). Thus, the lack of forage offered by current forest management practices comes at the further detriment of deer. No specific habitat enhancements for black-tailed deer are planned outside of WDFW managed lands in Region 5. Both the Klickitat (Klickitat County) and Cowlitz (Lewis County) Wildlife Areas have on-going, long-term management practices designed to benefit black-tailed deer habitat. Hairloss Syndrome The habitat conditions discussed in the previous section have caused an apparent decline in portions of the Region 5 deer population. One potential additional cause of the decline in deer numbers is hairloss syndrome. Reports of the problem began in PMUs 56 and 57 during Since that time, numerous reports of affected deer have been received from throughout the Region. Hairloss syndrome was observed in Klickitat County for the first time in Approximately 3% of the deer observed during the March 2003 Klickitat deer survey had noticeable signs of the syndrome. Hairloss was first documented in the East Klickitat GMU (382) in the spring of Late 1990 s declines in harvest, increases in buck mortality rates and reduced productivity in the western portions of Region 5 all roughly coincide with the onset of the hairloss syndrome. Anecdotal reports from hunters, homeowners and citizens indicate that deer are now absent from areas where they were present in high numbers during the mid 1990s. An effort to quantify some aspects of the hairloss syndrome was conducted by WDFW from In this study, 30-39% of fawns were found to exhibit the syndrome. However, the establishment of an association between mortality and hair loss syndrome was inconclusive (Woodin 2004). Furthermore, neither the hunter generated, nor the biological data discussed earlier in this document suggest a large-scale decline in the Regional deer population. However, it is likely that the impact of the Hairloss Syndrome has been offset by significant restrictions on antlerless deer harvest opportunities imposed in the late 1990s. Recent efforts indicate that the species of louse associated with black-tailed deer hairloss syndrome is not indigenous to North America (Bildfell, et. al. 2004). Summary The cumulative effects of increased development, certain forest management activities, reduced federal timber harvest, hairloss syndrome and limited antlerless harvest opportunity combine to stabilize the Region s deer population in relatively recent years. As recently as the 1980s, habitat conditions in the Region were more favorable, i.e. less of the landscape was developed, reforestation efforts were much less intensive, the federally managed lands were subject to extensive timber harvest and hairloss Syndrome was yet to arrive. Anecdotal reports consistently state that there were many more deer in Region 5 during these years. Given the changes in habitat condition in the years that have followed it is likely that these sentiments are correct. Unfortunately, monitoring methodologies have evolved throughout this time span and therefore meaningful comparisons of current population size to those of the past are not possible. At this time, WDFW does not have the authority to implement landscape level programs or regulations that would change the habitat conditions that 59
60 Deer Status and Trend Report Holman fundamentally control the deer population. Very large scale changes that would benefit deer at the population level would include such things as a moratorium on the sub-division of private property, significant changes to the Forest Practices laws relating to the use of herbicide and the establishment (through cutting or burning) of tens of thousands of acres of early-successional forest on the federally-managed lands. Favorable habitat changes of these magnitudes are not realistic in the foreseeable future of western Washington State. Literature Cited Bildfell, R.J., L.W. Mertins, J.A. Mortenson, and D.F. Cottam Hair-loss Syndrome in Blacktailed Deer of the Pacific Northwest. Journal of Wildlife Diseases. 40 (4): Brown, E.R The Black-tailed Deer of Western Washington. Washington State Game Department, Olympia, WA. Coe, P.K., S.L. Findholt, B.K. Johnson, J.G. Kie, and J.W. Kern Responses of Elk and Mule Deer to Cattle in Summer. Journal of Range Management. 54 [205], A51-A76. Crouch, G.L Coniferous Forest Habitats Food Habits and Nutrition, in Mule and Black-tailed Deer of North America. Olof C. Wallmo, editor. Wildlife Management Institute, University of Nebraska Press, Lincoln NE, USA. United States Forest Service Monitoring and Evaluation Report, Gifford Pinchot National Forest. United States Department of Agriculture. Vancouver, Washington, USA. Woodin, R. S Black-tailed Deer Hairloss Syndrome: Affliction Rates and Sources of Mortality, in 2004 Game Status and Trend Report. Wildlife Program, Washington Department of Fish and Wildlife, Olympia, Washington, USA. Washington State Department of Fish and Wildlife Game Management Plan. Washington Department of Fish and Wildlife, Olympia, Washington, USA. Washington State Department of Natural Resources Yacolt District 2005 Aerial Herbicide Applications. State Environmental Policy Act Lead Agency and Mitigated Determination of Non-Significance, file # Olympia, Washington, USA. Washington State Department of Natural Resources Site Preparation, Regeneration, and Vegetation Management in Final Habitat Conservation Plan. Olympia, Washington, USA. Powell, J. H. and Lindzey, F.G Distribution, Habitat Use Patterns, and Elk Response to Human Disturbance in the Jack Morrow Hills, Wyoming, in Proceedings of the Fifth Western States Deer and Elk Workshop S. A. Tessmann, editor. Wyoming Chapter of the Wildlife Society, Wyoming, USA. Rowland, M. M., M.J. Wisdom, B.K. Johnson, and J.K. Kie Elk Distribution and Modeling in Relation to Roads. Journal of Wildlife Management. 64 (3): Stewart, K.M., N.J. Cimon, B.K. Johnson, K. Bruce, J.G. Kie,, and R.T. Bowyer Temporo-spatial Distributions of Elk, Mule Deer and Cattle: Resource Partitioning and Competitive Displacement. Journal of Mammalogy. 83,
61 Deer Status and Trend Report Schirato DEER STATUS AND TREND REPORT: REGION 6 PMU 61 GMUs 658, 660, 663, 672, 673, 681, 684 PMU 62 GMUs 652, 666, 667 PMU 63 GMUs 642, 648, 651 PMU 64 GMUs 621, 624, 627, 633 PMU 65 GMUs 607, 615, 618, 636, 638 PMU 66 GMUs 601, 602, 603, 612 PMU 67 GMUs 653, 654 GREG SCHIRATO, District Wildlife Biologist Population objectives and guidelines Objectives are to maintain deer numbers at their current numbers. Buck harvest is generally any antlered buck although Game Management Units (GMUs) 636, 654 and 681 are managed as 2 point or better units. Hunting seasons and harvest trends Based on the analysis of the Mandatory Reporting System, hunter success remained high (20%) in the general deer season. Actual success is even higher when permit hunting is incorporated. The permit hunter success overall exceeds 50 %. Estimates of total annual mortality rates (i.e. from all sources) vary depending on the data source. However, recent findings from the completed buck mortality study have shown that the percent yearlings in the harvest as measured by tooth eruption at check stations accurately estimates annual mortality rates. For GMUs without check stations, the analysis of harvest report card data looking at antler size (spike vs. branch antlered) adjusted for older spikes and yearling 2 points determined a regional buck mortality rate from 0.28 to 0.42 for various Population Management Units (PMUs). Work in 1998 showed that there is a small under estimation of buck mortality rate from report Table 1. Summary of four harvest parameters for Region 6, Year Hunters Hunter days Success Days/kill , , , , , , , , , , , , , , , , , , ,633 18, , , cards due to bias in under reporting harvest of spikes. Mandatory Reporting should reduce this bias. An analysis of 271 antlered deer at the Vail check station showed that 70 % were yearlings. This is higher than the mortality rate estimated from the total antler point summary from the mandatory reporting system. A sampling of adult (yearling and older) antlerless harvest in GMU 667 resulted in an estimate of an average annual mortality rate of 50% (n = 57). This mortality rate is higher than what is desired. Additional restrictions in antlerless permits have been initiated. In general, the hunting regulations continue to be conservative with doe harvest targeted at 20 % of buck harvest. Four GMUs, Satsop, Capitol Peak, Skookumchuck, and Wynochee, have had a special limited special November deer hunting season. This season overlapped with elk rifle season, but gave an opportunity to hunt deer through the rut. These hunts are extremely popular. They provide a new opportunity for deer enthusiasts. These hunts provide a higher quality buck hunt. These hunts have some of the highest success rates for the permits over 60%. Because of the nature of the hunt and the individuals seeking this opportunity success for these buck only permits often exceeds or doubles the success of the antlerless permit hunters. Little tribal input on deer management has been received. Tribal harvest and interest is focused more on elk. Surveys A pre-hunt helicopter survey was conducted in GMU 667 (Skookumchuck). In GMU 667, a total of 101 deer were classified. An additional 95 deer were classified in the GMU 653 by the Muckleshoot Tribe. Deer check stations were run at Vail on 4 weekends in 2005 with the help of the Eyes in the Woods volunteers making over 5,000 hunter contacts. 61
62 Deer Status and Trend Report Schirato Population status and trend analysis A Sex-Age-Kill Ratio (SAK) model was used to generate deer population estimates by PMU. Population parameters were estimated from Vail check station data, antler harvest reports, well as the aerial pre-season surveys. (Table 2). The fawn:doe ratio was 76:100. The doe mortality rate was.5 based on the Vail check staion but this undoubtedly incorrect. For PMU 67 the Muckleshoot mortality rate for radio collared animals was used (.22). The recovery rate was reduced to.75 to more closely reflect the data from the mortality study. The model is most sensitive to the female survival estimate the population is doubled between the two different doe mortality rates above. Table 2. SAK population estimate by PMU. PMU Estimated Population 67 4, , , , , , ,658 Management conclusions There are some general declines in deer numbers in some GMUs while others are expanding. This follows the patterns that would be expected from timber rotations, where large magnitude changes in population occur with stand age. Long-term declines are expected and are occurring on USFS lands where there is little timber harvest and a push for older stand age classes. In addition, declines are occurring were canopy closure is occurring over large expanses of even aged timber management, (GMU 627). Some of these past declines appear to be generally stabilizing at lower harvest levels. The current year had high harvests and success rates. The early November buck hunt provides a popular special opportunity. Due to the success of this hunt it has the ability to quickly shift the overall mortality rate in the buck portion of the population. If resistant is not met with the elk season overlap this opportunity could be expanded to other units. It is recommended that the permits not exceed 2-3 % of the total buck harvest to prevent substantial shifts in buck mortality and recruitment of bucks to the older age classes desired in these hunts. Additional antlerless permit reductions are needed in GMU
63 Elk 63
64 Elk Status and Trend Report Nelson ELK STATUS AND TREND REPORT: STATEWIDE Jerry Nelson, Deer and Elk Section Manager Population Objectives and Guidelines The goal set by Washington Department of Fish and Wildlife (WDFW) for the management of elk (Cervus elaphus) populations in Washington is to maintain numbers within habitat limitations. Landowner tolerance, a sustained harvest, and nonconsumptive elk opportunities are considered within the land base framework. Specific management objectives call for posthunt bull:cow ratios of 12 to 20 bulls:100 cows with a bull mortality rate from all sources of 50 % or less (Wash. Dept. of Fish and Wildlife 2003). Some limited-entry Game Management Units (GMUs) are being managed for 15 to 25 bulls per 100 cows in the post-hunt composition counts. There are 10 recognized elk herds in Washington: Blue Mountains, Selkirk, Colockum, Yakima, North Cascades, North Rainier, South Rainier, Mount St. Helens, Olympic, and the Willapa Hills. Population objectives for Washington elk herds allow for substantial population increases in the Blue Mountains, North Cascades, North Rainier, South Rainier, Willapa Hills, and the Olympic Peninsula. Although some herds may be below management objective, a re-distribution of current elk populations may still be required to alleviate elk damage complaints for the Blue Mountains, Willapa Hills, Colockum, Yakima, and potentially other herds. Some herds can be allowed to increase but only in specific areas of the herd s range. Additional range expansion by the Selkirk elk herd will be tolerated in some areas of northeastern Washington within the limits of landowner tolerance. The Yakima herd is at the targeted population objective, but site-specific damage complaints still need to be addressed. The Colockum herd is below current population objective but damage complaints are still received for that herd. The Mount St. Helens herd is above population objective and will be reduced over the course of the next three to five years. In western Washington areas of eastern King, eastern Pierce, northern Skagit, and Whatcom Counties could likely support additional elk. Hunting Seasons and Harvest Trends Washington elk were historically managed under fairly aggressive hunting regulations with any bull being legal, over-the-counter license sales, and no quotas. Post-hunt bull ratios of 5 bulls per 100 cows or lower were not uncommon in eastern Washington herds. Currently, WDFW manages the level of harvest and hunter distribution through a number of hunting season structures. These include, regulating the number of days hunted, requiring hunters to select an elk license for the eastern or western portion of the state, spike-only or 3 point minimum antler point restrictions, and requiring hunters to select a weapon type and hunt only during those seasons. Washington currently has no quota on elk licenses sold for the general season. Current population management objectives target between 12 to 20 bulls per 100 cows in post-hunt surveys and maintain total bull mortality from all sources at or below 50 %. Either one or both of these metrics may be used to assess bull subpopulation status for a given herd. Bull subpopulations in eastside elk herds are more likely to be assessed using the bull:cow ratios and bull subpopulations in westside elk herds are more likely to be assessed using the total bull mortality rate. Due to low productivity in the Blue Mountains elk herd, the Fish and Wildlife Commission adopted a spike-only elk regulation for the general season beginning in Branch-antlered bulls were legal only through limited entry special permits. The regulations for the Colockum and Yakima herds were switched from any bull to a spike-only general season with branch-antlered bulls legal by special permit only, in As a result of reduced recruitment and conservative seasons, the eastern Washington general season bull elk harvest declined in the early 1990s and has remained relatively stable for the past decade. The bull harvest for the 2005 general season and special permit season combined in eastern Washington was slightly over 1,700 antlered elk. Western bull harvest seems to have stabilized. The bull harvest for the combined 2005 general season and special permit season was over 3,200. Improvements in harvest levels since the 1990s are likely a function of improved habitat condition resulting from timber harvest on private timberlands and increased road management on both private and public lands. These estimates do not incorporate male calves killed under antlerless, special permit regulations. 64
65 Elk Status and Trend Report Nelson Table 1. General season bull elk harvest in Regions 1, 2, and 3 (eastern) and Regions 4, 5, and 6 (western). Year Eastern Bull Harvest ,342 2, ,788 2, ,711 2, ,937 2, ,477 2, ,688 2, ,471 1, ,659 1, ,956 2, ,033 2, ,581 2, ,603 2, ,431 3, ,452 2, ,307 3,115 Western Bull Harvest The special permit harvest of antlered bulls in eastern Washington was 421 and in western Washington was 160. The statewide elk harvest for both the general season and special permits combined in 2005 was 8,665 elk (Table 2). Table 2. Statewide elk harvest for general season and special permit combined by antlered and antlerless class. Year Antlered Antlerless Total ,092 3,554 8, ,583 3,292 8, ,804 2,563 6, ,606 5,360 9, ,522 2,907 6, ,801 3,152 6, ,992 1,929 4, ,352 2,506 5, ,416 2,693 7, ,960 3,318 8, ,422 3,283 7, ,767 3,349 8, ,141 3,564 8, ,822 2,539 7, ,001 3,664 8,665 The general season elk hunter success rate for all weapon types in 2005 was 9.3%. General season success rates by weapon type were 8.7 % for modern firearm, 10.3 % for archery, and 10.7 % for muzzleloader. Surveys WDFW conducts surveys on all 10 elk herds. On the westside the Department surveys % of the elk units. In the Colockum and Yakima areas we survey about 75 % of the elk winter range. In the Blue Mountains we survey about 80 % of the elk winter range. In northeast Washington, elk surveys include composition counts made from the ground in the spring, and composition counts made while conducting aerial surveys for moose. WDFW uses the visibility bias model developed in Idaho for elk (Samuel et al. 1987) to estimate elk populations or sub-herds for the Blue Mountains, Yakima, and Colockum herds. These surveys are conducted in sampling units stratified as high-, medium-, and lowdensity zones. Paint ball mark-resight estimators have been used to cross check the efficacy of the visibility bias model. Preliminary estimates suggest that survey methodology provides relatively precise and accurate estimates. Paint ball mark-resight estimators have also been used with success on sub-herds on the Olympic Peninsula, North Rainier and North Cascades. Because the technique requires all of the marking and re-sighting be done by helicopter at low altitude, WDFW has ruled out this method as impractical due to the cost and the dangerous nature of the work. Composition counts are conducted by WDFW and by Tribal biologists in the North Cascades and North Rainier. Most elk surveys conducted in western Washington are completed prior to the modern firearm hunting seasons. The rationale for mid- September surveys is there is a reduced level of segregation between age and sex classes during the rut. The assumption is that observations at this time tend to be less biased in terms of accurate bull:cow:calf ratios. Aerial and ground surveys, harvest data, and productivity data are used to model populations and provide estimates of herd components. Pre-hunt surveys typically range anywhere from 15 bulls:100 cows to 50+ bulls:100 cows in some southwest Washington GMUs. Calf:cow ratios also vary markedly in pre-hunt surveys from the mid 20s to the low 50s depending on the unit surveyed. Population Status and Trend Analysis Statewide elk populations are difficult to estimate but the statewide total is approximately 60,000. Elk populations in the Blue Mountains continue to show lower than average calf survival. Summer calf ratios seem to have improved over rates in the 1980s, but calf survival is still not up to desired levels. Late winter elk populations were estimated at approximately 4,700, about 900 below population objective. Bull harvest declined markedly in the Blue Mountains in the 1980s. The spike bull general season was initiated in the Blue Mountains in
66 Elk Status and Trend Report Nelson The post-hunt Blue Mountain bull ratio combining all GMUs as a population management unit (PMU) surveyed was within management guidelines of 12 to 20 bulls per 100 cows. Elk populations continue to grow slightly in numbers and expand their distribution in northeastern Washington. The Department s goal is to increase elk abundance in Pend Oreille County and eastern Stevens County. North of Kettle Falls there is some room for elk expansion east of the Columbia River. South of Kettle Falls there is room for elk expansion east of Highway 395. Range expansion of elk in northeast Washington will be allowed to continue in some locations within the limits of landowner tolerance. The Yakima elk population is at population objective after three years of relatively aggressive antlerless harvest initiated to reduce the total population by 10 %. The spike-only general season with branch-antlered bulls available by limited permit has been in place for the Yakima herd for eight years. Post-hunt bull ratios have met objective since Winter calf ratios were near or above the level required for population maintenance. Sitespecific damage problems exist for the Yakima herd and require special permit hunts as well as damage hunts to address those cases. The Colockum population still appears to be below objective. Post-hunt bull escapement objectives are not being met. The post-hunt bull ratio for the Colockum herd for all GMUs surveyed was below objective in The Colockum herd also creates localized damage problems. Most of these are being dealt with through extensive special permit hunts that apply hunting pressure through the fall and into the winter. The North and South Rainier elk herds are both likely below objective. Limited data available indicate that population declines may have slowed. These two herds may have stabilized at some lower level. Both populations are very difficult to survey. Rigorous inferences about population size or rates of growth or decline cannot be made based on the limited information at our disposal. Elk hunting regulations on the Olympic Peninsula were changed to a 3-point minimum antler restriction for legal bulls beginning in WDFW and Olympic Peninsula Tribes have been meeting regularly to evaluate elk population status and develop conservative hunting seasons. The Olympic elk herd is near management objective but the Olympic Peninsula can support more elk. The North Cascades population is below objective. An unexplained reduction in recruitment is one cause for the decline from historical higher levels. Increased vulnerability due to road access as well as undocumented harvest are also thought to be contributing factors in this population decline. The herd has grown slightly to approximately 450 animals but is still well below objective of 1,200. The core population was augmented with 41 cows and calves from the Mount St. Helens Wildlife area in October of Post-release survival for these elk was only 61 %. A second augmentation effort moved an additional 42 elk in October Survival of this group after release was markedly higher than the first year with no capture related mortalities. The Willapa Hills herd may be below population objective. In addition some refinement is necessary in terms of redistribution of elk to address damage complaints. This herd seems to have declined somewhat in recent years, probably as a result of increased hunting mortality, habitat loss, and declining habitat quality due to advancing successional age of timber stands and changes in forest management. The Mount St. Helens herd is above objective and plans to reduce elk densities will be facilitated through antlerless harvest increases starting in Both the Willapa Hills and Mount St. Helens populations are difficult to monitor due to the nature of the landscape. These two herds contribute significantly to the Westside bull harvest each year. Habitat Condition and Trend In general elk do well on habitat in early to midsuccessional stages. Elk herds in western Washington benefited from new growth after timber harvest in the 1960s, 70s, and early 80s. Much of the U. S. Forest Service land in western Washington is now shifting toward late successional reserves (LSR) and mature growth forest. This change is diminishing the carrying capacity of these habitats. The long-term trend in elk carrying capacity is down on public lands managed by other agencies. Timber management on industry-owned forest is generally shifting toward smaller clear cuts or selective cuts. While this may be beneficial to elk, understory management and other silvicultural practices may be having a negative impact on elk forage and it s availability. Excessive road density limits habitat suitability for elk on most managed forest. New road management programs are being implemented, resulting in less disturbance and more security for elk. WDFW is cooperating with other researchers investigating the influence of habitat quality as it 66
67 Elk Status and Trend Report Nelson relates to elk body condition, calf production, and recruitment. Preliminary information suggests many western Washington habitats are less productive than first believed in terms of elk production. Most of the habitat improvement projects statewide depend on partial funding from Rocky Mountain Elk Foundation (RMEF). Many habitat improvement projects sponsored by the Colville National Forest and the RMEF have improved habitat for elk. These projects have involved burning, fertilization and road management. Other cooperative projects involved RMEF and Olympic, Gifford Pinchot, Wenatchee, Umatilla, and Mount Baker-Snoqualmie National Forests. Elk forage enhancement projects are ongoing or planned for areas inhabited by the Willapa Hills, Olympic, Blue Mountains, Yakima, Colockum, North Cascades, North Rainier, Selkirk, and Mount St. Helens elk herds. Wildlife Damage WDFW is mandated by law to address agricultural damage caused by elk. In response to landowner complaints, WDFW tries to alleviate damage problems without reducing the elk population if possible. The Blue Mountains and Colockum elk herds are below management objective but agricultural damage complaints occur in these areas each year. Elk damage complaints also come from areas inhabited by the Willapa Hills, Mount St. Helens, Yakima, North Rainier, and South Rainier herds. Hunting seasons have been adopted to discourage elk from increasing in Benton, Ferry, and Stevens County (north of Kettle Falls discourage elk west of the Columbia River; south of Kettle Falls discourage elk west of Highway 395) and from dispersing into northern Chelan and Okanogan counties. WDFW is attempting to reduce elk in Snohomish and southern Skagit counties and is preventing dispersal of elk east of the Columbia River in Douglas and Grant counties. In all of these areas elk are in conflict with agricultural production. In many other areas, increasing urban sprawl and development are restricting elk range. Maintaining elk populations that are viable, provide a sustained harvest, and are still tolerated by landowners is a constant, often contentious challenge. Management Conclusions After many years of any legal bull hunting seasons, antler restrictions and reduced season lengths have been adopted to achieve post-hunt bull ratio and overall survival objectives. In eastern Washington most units have spike-only bull general seasons with limited permit branch-antlered bull and antlerless seasons. In western Washington, most GMUs have a 3-point minimum antler restriction for the general season and offer antlerless elk hunting opportunities by limited permit. Both spike-only and 3-point minimum hunt structures are attempts at maintaining adequate bull sub-populations through the hunting season to breed the following fall. Bull escapement goals are set at a range of 12 to 20 bulls per 100 cows in post-hunt surveys, and an annual bull mortality rate from all sources of 50 % or less. Elk in Washington are under intensive hunting pressure. Elk in Washington are hunted from early September until the middle of December. Washington is the smallest of the eleven western states and has the highest number of hunters per elk (1.6 hunters/elk). It also has the highest human population density of all the elk states. Threats to elk population persistence include loss of habitat, declining quality of habitat, conflicts with agriculture, and high hunting demands by both statelicensed and tribal hunters. Federal courts have ruled that members of federally recognized treaty tribes can hunt unrestricted by the state except for conservation closures. In 1998, the State Supreme Court ruled that members of federally recognized treaty tribes can legally hunt only within their ancestral hunting areas. State and tribal managers are working toward agreements that ensure conservation of wildlife resources including cooperative harvest management. Obtaining accurate, complete tribal harvest data is a constant point of negotiation with some tribes. For this report time period, elk management plans for six of the ten elk herds have been completed. Final elk herd management plans exist for Blue Mountains, North Rainier, South Rainier, North Cascades, Yakima, and Olympic. Draft plans that are in development include Selkirks, Colockum, Willapa Hills, and Mount St. Helens. Literature Cited Samuel M. D., E. O. Garton, M. W. Schlegel, and R. G. Carson Visibility bias during aerial surveys of elk in north-central Idaho. J. Wildl. Manage. 51: Washington Department of Fish and Wildlife Game Management Plan. Washington Dept. of Fish and Wildlife, Olympia, WA, USA 67
68 Elk Status and Trend Report Zender and Base ELK STATUS AND TREND REPORT: REGION 1 Selkirk Herd GMUs 101, 105, 108, 111, 113, 117, 121, 124 STEVE ZENDER, District Wildlife Biologist DANA L. BASE, Associate Wildlife Biologist Population objectives and guidelines Elk (Cervus elaphus) are managed in two zones within the Colville District as divided by Game Management Units (GMUs). Within GMUs 111, 113, and 117, the long-term goal is to increase both elk numbers and their distribution. The harvest objective is to maintain the annual overall bull mortality rate at less than 50% and a post hunting season bull-to-cow ratio of 12 to 20 bulls per 100 cows (WDFW 2003). Antlerless hunting opportunity within these GMUs is by permit only, except archery hunters may hunt any elk. Elk population growth is discouraged within the other elk management zone, which includes GMUs 101, 105, 108, 121, and 124. Consequently any elk seasons are generally offered within these GMUs. Hunting seasons and harvest trends Elk are widely scattered in small groups throughout the densely forested region of northeastern Washington. As a consequence, elk in northeastern Washington are exceptionally difficult for hunters to harvest. While we have limited population data, there is currently no indication that bull:cow ratios are a problem. Therefore, there are no antler point restrictions and any antlered bull is legal. A significant change was made in the 3-year ( ) season package shifting the archery season later to a standard opening of September 8 and thus running to September 21. New for muzzleloaders was the opportunity to hunt GMU 113, Selkirk. Muzzleloader hunter opportunity in the any elk units (GMUs 101, 105, 108, 121, and 124) was also shifted from running concurrent with the modern firearm hunt to the muzzleloader early October hunt. The only significant change in the modern firearm general hunt was the extension of the any elk hunt to all of GMU 124. In 2005 antlerless permits were issued for muzzleloaders and modern firearm hunts in GMUs 111, 113, and 117. The total number of elk hunters in 2005 dropped 14% from 2004, but was only 2% below the four-year average (Figure 1). Hunter numbers declined similarly for each hunt method. Number of Hunters Modern Firearm Muzzleloader Archery Figure 1. Trend in elk hunters by hunt method, GMUs The estimated bull elk harvest for 2005 dropped 9% from The harvest decline occurred solely within the modern firearm user group. Muzzleloaders and archers each took slightly more animals than in 2004 (Figure 2). Number harvested Year Modern Firearm Muzzleloader Archery Figure 2. Trend in elk harvested by hunt method, GMU's
69 Elk Status and Trend Report Zender and Base The antlerless harvest in the primary elk management units (GMUs 111, 113,117) is still conservative at a ratio of 15 antlerless per 100 antlered elk. However, the total antlerless kill ratio reported for GMUs is much higher at 61:100 (Table 1). This high total ratio is primarily due to the relatively high total kill (55) and ratio of antlerless killed (267:100) in the Mount Spokane GMU. Table 1. Five-year bull and antlerless elk harvest within the Colville District, GMUs Year Bulls Antlerless Harvest Total Harvest The antlerless permit hunts are designed to provide added opportunity and address landowner conflict where it occurs. A survey of permit holders (WDFW 2005) continues to confirm any elk permit holders kill few elk in northeastern Washington (Table 2). Of the 75 total permits issued, only 5 cows were reported taken by the 69 respondents who reported hunting (GMUs 111-1, 117-4). Permits for any elk appear to be providing enhanced recreational opportunity for hunters in these units, but the harvest is negligible. Muzzleloaders were issued 40 total permits in 2005 and harvested only 2 cows. Table 2. Special permit allocations for any elk and hunter take within the Colville District, GMUs Year Permits Issued Antlered Killed Antlerless Killed Kill vs. Permits Issued % % % % % Surveys Harvest rates have been relatively low for the northern Selkirk Herd compared with other regions of Washington State. Consequently, devoting substantial resources to surveying bull-to-cow ratios has not been a high priority. For management decisions we currently rely primarily on trends in bull mortality rates based upon implied age estimates from antler point data obtained by hunter harvest reports (Table 3). Table 3. Antler point distribution from hunter harvested elk within GMUs Year 1-2 points 3-5 points 6+ points Total (52%) 4 (19%) 6 (29%) (44%) 5 (31%) 4 (25%) (61%) 6 (21%) 5 (18%) (56%) 11 (27%) 7 (17%) (46%) 25 (42%) 7 (12%) (37%) 37 (42%) 18 (21%) (43%) 25 (23%) 38 (35%) (40%) 37 (33%) 31 (27%) (42%) 43 (37%) 26 (22%) 118 Our best opportunity to observe elk from ground-based surveys is in the early spring from mid-march the end of April. We have continued our program of involving volunteers to survey elk. Observations during early mornings or early evenings before dark are made of elk that concentrate on green-up fields or within forest openings. The calf:cow ratio and the trend in total numbers is the only reliable information gathered on early spring surveys in this area. The spring 2006 survey efforts yielded a ratio of 46 calves per 100 cows, which equals the previous five year average (Table 4). Table 4. Early spring elk composition surveys within the Colville District. Ratios Classified Year Bull:Cow Calf:Cow Sample :100 47: :100 48: :100 57: :100 36: :100 42: :100 46: Population status and trend analysis General observations and anecdotal information suggest that elk populations are as high as they have ever been in northeastern Washington. The healthy calf ratios in recent years along with the high harvest support these observations. 69
70 Elk Status and Trend Report Zender and Base Habitat condition and trend We believe that habitat conditions for elk in the Pend Oreille sub-herd appear to be favorable at least for the near future. Road closures by federal and private land managers have been aggressive in recent years. Logging continues on national forest lands and even more intensively on private lands. The high rate of logging during the 1980s in central Pend Oreille County has produced forest successional forage vegetation that elk prefer. Residual blocks of mature timber cover are getting smaller, however, and thus the quality of security cover may be more of a problem than we are aware of at this time. The winter snow-pack was above normal in the high elevations and combined with the abundant spring rain produced good forage and plenty of calving cover for the 2006 summer. Wildlife damage Elk damage to standing hay, baled hay, and stored hay continues in the Cottonwood Creek drainage (GMU 117) southeast of Chewelah. Antlerless permit opportunity has been increased and all user groups have a general season in the area now, which should put pressure on elk that frequent agricultural land. WDFW will issue Landowner Access permits when and where circumstances are appropriate as another means of addressing damage to lands open to hunting. Habitat enhancement In 2005 the Colville National Forest, with grant money from the Rocky Mountain Elk Foundation (RMEF) carried out the following projects: controlled burn on 250 acres of shrubland in East Branch LeClerc Creek, GMU 113; Weed eradication to encourage grass on 260 acres along the Bonneville Power Administration powerline near Cedar Creek in GMU 111; and Restoration of 6 acres of a quaking aspen grove near Tiger Meadows in GMU 117 (Borysewicz pers. com.). Management conclusions Hunter numbers (Figure 1) dropped moderately in We speculate that this reduction in hunter effort may have been due to higher fuel prices discouraging travel. Both the total elk harvest and hunter success rate were at the highest rates ever in local history in This should have encouraged even more hunters to participate in 2005, but apparently it did not (Figure 2). In recent years WDFW has provided increased opportunity or season timing to improve equity among the three user groups. Hunter participation and harvest is now well dispersed across the Colville District through all three hunting methods. In 2001 modern firearm hunters took 90% of the elk harvest and archery hunters took the other 10%. By 2005 the harvest was dispersed more equitably with 64% Modern Firearm, 15% Muzzleloader and 21% Archery. Substantial bull:cow classification data is currently too expensive to gather. The antler point data from harvested bulls in 2005 suggest that yearlings make up only about 41% of the bull harvest which is a reasonable indication that the mortality rate on bulls remains less than 50%. With 22% of the bulls being 6 point or better, there continues to be an acceptable percentage of mature bulls available in the population for breeding and quality hunting opportunity (Table 3). The any bull management in northeastern Washington continues to provide a diverse age structure in the bull segment of the population. Indeed, in the 2005 season hunters were able to take 69 bulls with 3 or more points, 26 of which had 6 points or better. The cow:bull kill ratio may appear high when considering all units combined, however, all but 3 GMUs are managed to suppress elk damage so are therefore open to any elk. About 1700 hunters applied for the 75 cow permits issued by WDFW for these units so interest is high. Success continued to be low, however, as only 5 cows were reported taken as a result of these permits. Increasing antlerless permits appears to be a conservative method of providing greater opportunity to the Modern Firearm and Muzzleloader groups. Literature cited Borysewicz, M. Colville National Forest. Personal communication Washington Department of Fish and Wildlife Game Management Plan. Washington Dept. of Fish and Wildlife, Olympia, WA, USA Washington Department of Fish and Wildlife Game Harvest Report. Wildl. Prog., Washington Dept. of Fish & Wildlife., Olympia. 70
71 Elk Status and Trend Report 2005 Ferguson and Volsen ELK STATUS AND TREND REPORT 2005: REGION 1 PMU 11 GMUs 127, 130, 133, 136, 139 PMU 13 GMU 142 HOWARD L. FERGUSON, District Wildlife Biologist DAVID P. VOLSEN, Wildlife Biologist Population objectives and guidelines The population goal for this elk (Cervus elaphus) herd is to manage the population for a sustained yield, at levels compatible with agriculture production and within tolerance levels of landowners occupying the rural-urban interface. Consequently any elk seasons are offered in these GMUs. Hunting seasons and harvest trends The 2005 general elk hunting seasons for Game Management Unit (GMU) were as follows: Modern Firearm - Oct. 29-Nov. 6, Any elk Archery - Sept. 8-21, Any elk Late Archery (GMU 127) - Nov. 20-Dec. 8, Any elk Muzzleloader - Oct. 1-7, Any elk Late Muzzleloader - Nov. 20-Dec. 8, Any elk Advanced Hunter Education (AHE) Master Hunters only - Dec. 9-31, Any elk Table 1. GMU elk harvest, hunters and hunter days Year Antlered Antlerless Hunter Hunter Total Hunters Days Success % % % % % % % % % % % % % % % Harvest strategies in place are directed to control populations where agricultural damage and nuisance problems have persisted or increased. Recently, however, many local landowners have recognized the economic benefits of providing fee access for elk hunting, thus increasing hunter access. This has resulted in increased harvest, and subsequently fewer damage complaints. Harvest numbers were very high in 1999 and 2000 and may be suspect due to the voluntary hunter harvest reporting at that time (Table 1). However, since 2001, when mandatory harvest reporting began, the harvest of elk has steadily increased (Table 1). Hunter numbers have varied but have shown a downward trend from 2001 with 1631 to a low of 1230 in 2005 (Figure 1). However, hunter success doubled or nearly doubled in 2005 compared to the previous 6 years, and was the highest since Number of Hunters Figure 1. Number of Elk Hunters by Weapon Type Modern Muzzle Archery Total kill was the same as last year, but the number of modern firearm hunters dropped from 1503 to 626. However, modern firearm hunters became the most successful group in 2005 and more than doubled the previous years success with a surprising 18.37% success rate. Muzzleloaders were not far behind with a 14.71% success rate a 70% increase from last year (Table 2). The success rate for archers dropped from 71
72 Elk Status and Trend Report 2005 Ferguson and Volsen last year but was still higher than the 5-year average. Table 2. Hunter Success By Weapon Archery Modern Muzzle All % 7.17% 8.40% 7.14% % 6.55% 9.31% 7.20% % 10.24% 9.13% 9.45% % 8.45% 8.68% 8.57% % 18.37% 14.71% 15.77% Average 6.33% 10.16% 10.05% 9.63% We speculate that in GMU 130 unusually cold October weather kept elk feeding outside Turnbull National Wildlife Refuge. The refuge is closed to hunting and this may have made elk in this GMU more vulnerable than in previous years. Total bulls taken this year jumped to a high of 79. Since 2001, mature bull (5 + antler points) numbers harvested have increased each year to a high of 30 taken this year, whereas 3-4 pt bulls taken decreased while spike numbers jumped to 40 comprising 51% of the total bulls harvested. Table 3. Elk antler point distribution from harvest for GMUs Year 1-2 Pt. 3-4 Pt. 5+ Pt. Totals (60%) 11 (20%) 11 (20%) (39%) 26 (44%) 10 (17%) (63%) 4 (9%) 12 (28%) (40%) 10 (20%) 20 (40%) (51%) 9 (11%) 30 (38%) 79 Antlerless harvest has been relatively conservative at a ratio below 15 antlerless per 100 mature antlered elk (Table 4), but jumped to 35 this past season. This change appears largely due to the harvest in GMU 127 where antlerless harvest increased from 15 to 37 and in GMU 130 where the increase was even greater - from 24 to 63. Table 4. Five-year bull and antlerless elk harvest within GMUs Antlerless Antlerless/100 Year 5+ Bulls Harvest 5+ Bulls Surveys Ground and aerial surveys have been very limited due to budget restrictions. In 1998, a mark-resight study was conducted in GMUs 127 and 130 resulting in a minimum estimate of 179 elk. Composition counts have been conducted only in 130 due to limited funds for aerial surveys and the lack of success at earlier attempts of aerial surveys in the more forested GMU 127. The 2004 survey in GMU 130 was made possible by funding from the Turnbull National Wildlife Refuge. A similar survey of GMU 130 is scheduled for Table 5 shows the limited number of elk composition counts conducted since For GMU 130 the bull:cow ratio has mainly been above the 15:100 bull:cow ratio guidelines given in WDFW Game Management Plan (WDFW 2003). Table 5. Elk Composition Counts in GMUs 124 & 130. Cumulative Numbers per 100 Cows Year GMU Cow Calves Bulls Calves Bulls Population status and trend analysis Harvest data from 1991 to 2000 indicate either a highly variable harvest, or else highly variable harvest reporting. As previously mentioned, few population estimates and actual surveys exist for this district to reference. However, data since mandatory reporting began in 2001 indicate a fairly consistent harvest report with an increasing trend. Up until this past year, antler point distribution indicated a decreasing trend of young (1-2pt) bulls being harvested from the population (Table 3). However this past year the number of young bulls in the havest doubled perhaps indicating a good production year. Our limited survey in GMU 130 did indicate a high cow:calf ratio in 2004 corresponding with this increase. Habitat condition and trend The greatest concern for habitat in the past had been related to agriculture crop damage in the area. Now, elk habitat degradation due to urban expansion, increased roads, and human disturbance is the highest concern. Some concern exists for habitat damage to aspen and other vegetation from high elk numbers on Turnbull National Wildlife Refuge. Elk Damage During the last few years, elk damage complaints 72
73 Elk Status and Trend Report 2005 Ferguson and Volsen have decreased. Hotspot and landowner antlerless permits have been effective tools for targeting offending elk. It is important that an adequate number of these permits continue to be made available to address landowner concerns. While the core herd area is in GMUs 127 and 130 there are indications of increasing elk numbers in GMUs 133, 139, and 142, and as a result a few complaints have been received in these more southern GMUs. Elk in these areas are in scattered groups, occupying habitats wherever they can find relative seclusion and safety, frequently being found in Conservation Reserve Program (CRP) plots. Management conclusions Data from the last four years indicates a fairly constant increase in population levels in the District. However, the harvest this past year removed nearly the highest number of antlerless animals recorded. This may put a check on this expanding population. To better manage this herd, the District needs more staff time and budget allotted to conduct more comprehensive herd composition counts. Literature Cited Zender, S., H. Ferguson, and J. Hickman Draft. Selkirk Elk Herd Plan. WDFW, Olympia, WA. Washington Department of Fish and Wildlife Game Management Plan. Washington Dept. of Fish and Wildlife, Olympia, WA, USA 73
74 Elk Status and Trend Report Fowler and Wik ELK STATUS AND TREND REPORT: REGION 1 PMU 13 GMUs 145, 149, 154, 162, 163, 166, 169, 172, 175, 178, 181, 186 PMU 14 GMU 157 Pat Fowler, District Wildlife Biologist Paul Wik, Wildlife Biologist Population objectives and guidelines Elk (Cervus elaphus) populations in five of seven major elk units are at or near management objective. Calf survival and agricultural damage complaints hinder our ability to reach population management objective in GMU s 166-Tucannon, 169-Wenaha. The elk population in the Blue Mountains is still below management objective by approximately 1,300 elk, mostly due to the population decline in the Wenaha Wilderness (GMU-169), which has declined from 2,000+ elk in the 1980 s to in Hunting seasons and harvest trends The general season bull harvest was restricted to spike-only in 1989 in order to increase bull survival, post-season bull:cow ratios, and improve breeding efficiency. This strategy has improved post-season bull:cow ratios in most units. Bull:cow ratios were very low prior to the regulation change; 2-5 bulls/100 cows. A high percentage of the bulls observed post-season were yearlings, with very few bulls older than 2.5 years of age. The bull harvest in the Blue Mountains has declined due to low calf recruitment throughout the range and a major decline in the Wenaha elk population. Hunters harvested an average of 752 bulls per year between 1984 and Between 1995 and 2004, the bull harvest averaged 231 bulls/year. Hunters harvested 191 bulls in 2005 (Table 1), which is 17% below the average. Adult bulls are harvested under permit control. In 2005, 41 permits were issued in six units for rifle, muzzleloader, and archery hunters. Permit holders harvested 28 bulls, for an overall success rate of 80% (Table 2). Six point or larger bulls comprised 78% of the harvest. Poaching of adult bulls appears to have returned to normal levels. Only a few were reported in 2005, compared to 50+ bulls between The Umatilla Tribe continues to work with the Department to control the harvest of adult bulls in the Dayton unit and on the Rainwater Wildlife Area. Tribal hunters will be required to call the Tribal Office to obtain a tag before hunting in GMU-162 Dayton, and report any harvest within 72 hours. Once the quota of 14 bulls is harvested (2006 hunting season), hunting for branched bulls by tribal members will be terminated. The Mill Creek Watershed (GMU 157) is a limited entry unit managed in cooperation with the City of Walla Walla (City water supply) and U.S. Forest Service. Forty permits were issued for the Watershed in Hunting conditions were good throughout most of the season. Hunters harvested 17 bulls and 2 cows, for a success rate of 51%. Six point or larger bulls comprised 89% of the bull harvest. Surveys Pre-season surveys are conducted to determine calf production when elk re-group after calving (July-Sept.). Surveys are conducted from the ground, or air when possible. Summer calf/cow ratios in 2005 ranged from calves/100 cows, with an average ratio of 53 calves/100 cows. Post-season surveys are conducted to determine population trend and herd composition in late winter. The annual survey was conducted March 15-18, 2006 in most GMU s, but GMU-169 was surveyed in early April due to delays. The 2006 survey was conducted with a Robinson-44 helicopter. Winter surveys in March-April of 2006 produced a count of 3,995 elk, compared to 3,483 elk in 2005 (Table 3). Population status and trend analysis Data from the 2006 survey was run through the sightability model using two versions, one for the Bell- 47 helicopter, and the other for the Hiller-12E helicopter. Both models produced similar results. The Bell-47 model produced a population estimate of 4,136 elk, while the Hiller-12E model produced an estimated population of 4,254, a difference of 118 elk. We feel the Bell-47 model is probably closer to the visibility we experience using the Robinson-44 helicopter. Elk population status varies between sub-herds. Past sightability estimates have placed the elk population at 4,500-4,700 elk. The antlerless harvest on private land was increased in GMU-162 to alleviate agricultural 74
75 Elk Status and Trend Report Fowler and Wik damage. As a result, the number of elk counted in surveys has declined from 887 in 2004 to 637 in 2006, which puts the population approximately 100 elk under management objective. Antlerless permits were reduced in this unit in 2006 in order to stabilize the population. The number of elk in GMU-154/157 remains near management objective, with 793 counted in The Wenaha herd is still far below management objective (1,400) at approximately elk. The Tucannon sub-herd (GMU-166) is approximately 270 elk below management objective, while the Mtn. View sub-herd has increased to management objective over the last several years at 695 elk. However, approximately elk that are wintering in GMU-172 may be Wenaha elk that have been forced off the winter range by shed antler hunting activity. Summer calf:cow ratios have improved to historical levels (Fig. 1). Winter calf:cow ratios continue to fall below historic levels, but have improved compared to the 1990 s. Average winter calf ratios from 1990 to 2001 ranged from calves/100 cows, and averaged 21 calves/100 cows. For 2006, the winter calf ratio ranged from calves/100 cows, and averaged 30 calves/100 cows, 43% above the average of 21 calves/100 cows. The number of yearling bulls counted posthunt varies from year to year, and is influenced by several factors: calf production and survival the previous year, and yearling bull mortality. The number of yearling bulls counted between ranged from 82 to 155, and averaged 105. The 2006 survey produced a count of 139 yearling bulls, which is consistent with the long-term average. Post-hunt bull ratios in 2006 ranged from a low of 8 bulls/100 cows in GMU s-175 and 154, to a high of 43 bulls/100 cows in GMU-169 Wenaha, and averaged 20 bulls/100 cows. The high bull ratio in GMU-169 can be attributed to a lack of cow/calf groups that were forced off the Wenaha winter range and into GMU-172. Spikeonly units averaged 18 bulls/100 cows. Research The Department concluded its third year of monitoring elk for the Blue Mountains mortality project. We are pursuing supplemental funding in order to monitor 59 collared elk. The project has several objectives; evaluate harvest vulnerability of bull and cow elk based on habitat conditions and land ownership, determine what percentage of yearling bulls are being harvested under the spike-only strategy, evaluate the level of tribal harvest, determine the level of poaching occurring within the project area, and ascertain the level of bull movement between habitats and ownerships. Elk are monitored weekly using fixed-wing aircraft. Habitat condition and trend The Pomeroy Ranger District has made progress in closing old roads and reducing road densities in GMU- 175, however more roads need to be closed in order reduce harassment and improve habitat conditions for elk. The road closure program on the Walla Walla Ranger District is complete. A major forest fire burned much of the Tucannon unit (GMU-166) and a portion of the Lick Creek unit. The School Fire covered 52,000 acres, and burned most of the Wooten Wildlife Area. It was estimated initially that over 200 elk perished in the fire, but surveys in March indicated losses were less than 100, and probably closer to 50 elk. Most of the forest was destroyed, greatly reducing both hiding and thermal cover on the Tucannon winter range. In 2006, another large fire burned approximately 66,000 acres of the Dayton, Blue Creek, and Tucannon GMU s, with a majority of the fire occurring in the Dayton GMU. Approximately 70% of Dayton GMU winter range was burnt. Augmentation and habitat enhancement As a result of the School Fire, habitat improvement projects have already been initiated on the Wooten Wildlife Area. Long term habitat improvement projects will be developed in conjunction with the BMEI and RMEF for both fire areas. Elk Damage Elk damage continues to be a problem in some units. The largest damage issues occur in the GMU-162 Dayton, where landowners in the Eckler Mtn. area normally experience some damage to crops. In 2006, damage complaints declined in GMU-154 Blue Creek. Landowners in GMU-181 have again been issued landowner preference permits for antlerless elk. The School Fire and loss of the elk drift fence has resulted in large numbers of elk moving into GMU-178 Peola. However, damage claims in 2006 appear be less than expected. Management conclusions The spike-only management program has been in place for 16 years. As a result, post-season bull/cow ratios have improved, as has the age structure of the adult bull population. The increased number of adult bulls in the population has improved breeding ecology and efficiency. Rutting activity is much more intense, and harem sizes are smaller. The increase in adult bulls in the population has 75
76 Elk Status and Trend Report Fowler and Wik allowed the WDFW to offer high quality permit controlled hunting opportunity for branched antlered bulls. The intense rutting activity and presence of large, adult bulls has also resulted in a tremendous increase in elk viewing activity during the September rut, and during the winter months. Summer calf ratios have improved and remain near historic levels; 50 ca./100 cows. Winter calf ratios have increased, but are still slightly below management objective. Low calf survival has a negative impact on several subherds, and overall hunting opportunity. Shed antler hunting activity continues to be a problem for elk on the winter range. Shed antler hunting activity in GMU-154 Blue Creek, GMU- 166 Tucannon, and GMU-169 Wenaha is extremely heavy during March and April. Elk use patterns in several units have changed over the last few years due to human disturbance caused by shed antler hunting activity. Bull groups are broken and scattered into the upper elevation timber and snow, while cow/calf groups are pushed onto agricultural lands. The Department will need to take a serious look at regulating human activity on public land winter ranges, because shed antler hunting and other activities are putting elk under increased stress at a critical time, and causing them to re-distribute into agricultural areas and less favorable habitat. Several factors are limiting the ability of three subherds to reach population management objectives. Agricultural damage often forces the department to increase the antlerless harvest, which results in a reduction in targeted elk populations. Damage hunts can impact local sub-herds and herds adjacent to the damage area, resulting in a decline in the overall population. Calf recruitment has improved in many sub-herds, including the Wenaha. Hopefully, calf recruitment will continue to improve. Habitat values have declined due to roads, logging, noxious weeds, and fire suppression. The School Fire will have a negative impact on the Tucannon elk herd for a few years, but in the long term, habitat conditions should improve significantly. The Department should continue to work with the Nez Perce Tribe to monitor tribal hunting on the east side of the Blue Mountains to determine its impact to bull management objectives for sub-herds in this area and control the level of harvest if necessary. The Blue Mtns. elk population is 1300 elk under management objective. The Wenaha sub-herd is approximately 900 elk under management objective and does not appear to be increasing in numbers. Until calf recruitment in the Wenaha herd improves, the Blue Mountains elk herd will not meet population management objectives. 76
77 Elk Status and Trend Report Fowler and Wik Table 1. Blue Mountains Elk Harvest (PMUs 13 &14), Antlerless Bulls Harvest Year Spikes Adult Total Antlerless Total Cows:100 Bulls Table 2. Permit Controlled Bull Elk Harvestr-All Weapons, Blue Mtns. WA. (excludes GMU-157 Watershed). Bull Year Permits Harvest Hunter Success Percent 6 Point % 64% % 66% % 66% % 72% % 68% % 79% % 73% % 85% % 83% % 90% % 87% % 100% % 95% % 78% Note: data does not incl. Auction/raffle/ tag harvest Figure 1. Summer and Winter Calf Ratio Trend, Blue Mountains Ca./100 Cows SUMMER-WINTER ELK CALF RATIO TREND Summer Winter Table 3. Annual Winter Elk Survey summary, Blue Mtns. Wa. Per Bulls 100 Cows Year Adult Yearling Total Cow Calves Total Bu. Ca a Aerial surveys conducted in mid March 77
78 Elk Status and Trend Report Bernatowicz ELK STATUS AND TREND REPORT: REGION 3 PMU 32 GMUs 328, 329, 335 PMU 33 GMUs 336, 340, 342, 346, PMU 34 GMUs 372, 382 PMU 35 GMUs 352, 356, 360 PMU 36 GMUs 364, 368 JEFFREY A. BERNATOWICZ, District Wildlife Biologist Population objectives and guidelines The post-season population objective for the Yakima and Colockum elk (Cervus elaphus) herds is 9,025-9,975 and 4,275-4,725, respectively. A goal of <350 animals has been set for the Rattlesnake Hills sub-herd. The postseason bull ratio goal is a range of 12 to 20 bulls per 100 cows for all herds. Hunting seasons and harvest trends Elk hunting seasons in Region 3 have changed frequently over the years. The major changes in recent years have been: 1994: All branched antler bull hunting became permit only in all PMU s except : Entire region came under one eastern elk tag by weapon. For example, instead of having to chose early or late and Colockum or Yakima; modern hunters could anywhere in the Region for the entire season. 2003: Early archery general season changed from September 1-15 to September The late Archery season was set at November 20-December 8. Damage hunts changed from muzzleloader to any Advanced Hunter. 2004: Antlerless elk were no longer legal for Archers in PMU 32. In 2005, the general seasons outside of PMU 34 were: Archery: Early season September 8-21, late November 20- December 8. Spike only in PMU 32, spike or antlerless in PMU s 33,35,36. Muzzleloader: October 1-7, spike-only. Modern Firearm: October 29- November 6, spikeonly. PMU 34 has always been managed separately from the remainder of the region with array of liberal seasons allowing the harvest of antlerless and any bull. In 2005, the reported number of elk hunters in all user groups in Region 3 decreased slightly (Table 1). Archers were the only group above the 10-year average. Historically, hunter numbers may have been overestimated. Since mandatory reporting was implemented in 2001, estimates should be more accurate. Overall hunter success was near average, but muzzleloader and archery success rates were well below average. Bull harvest for both the Colockum and Yakima herds was below average. The high modern firearm success rates were largely due to antlerless harvest in damage and permit hunts. Three storms moved through the Cascades during the season, pushing elk to hunters in low elevations. Surveys Post-hunt aerial surveys were conducted in February and March Survey units were stratified and randomly selected. Approximately 90% of the Colockum and 70% Yakima units were surveyed. Feedlots for the Yakima herd were ground surveyed. PMU 34 was surveyed as a separate area in January. Observed calf recruitment in both the Yakima and Colockum herds increased dramatically (Tables 2 and 3). However, historical harvest data has not always followed trends seen on surveys. When dramatic shifts in calf ratio were observed in the 1990 s, harvest often showed the opposite trend. Since surveys have become more standardized, there is a closer correlation between calves seen on surveys in February and spike harvest in the following fall. However, discrepancies in the data remain. There was some mortality in 2006 after surveys were flown, so actual recruitment was probably lower. Observed bull ratios throughout the Region increased (Tables 2 and 3). Adult bulls typically occupy smaller portions of the winter range and are in a clumped distribution, making year-to-year comparisons difficult. Light snow pack in 2005 made bull estimates particularly questionable, moderate winter conditions in 2006 made it easier to find bulls. Ratios can also be misleading. The long-term trend indicates harvest of adult bulls is exceeding recruitment and the adult bull population is decreasing. However, antlerless harvest has also been high, reducing the denominator. Branch-antlered bull harvest is being reduced to maintain ratios. The Yakima herd is within objectives while the Colockum herd is below object. 78
79 Elk Status and Trend Report Bernatowicz Table 1. Elk harvest, hunter numbers, and success in Region 3. Colockum harvest Yakima harvest Regional hunter numbers Regional hunter success Year Bull Cow Bull Cow Modern Muzz Archery Total Modern Muzz Archery Mean ,265 1,346 3,440 29, ,505 2,163 4,173 27, ,492 1,152 23,054 2,530 4,473 30, , ,785 3,323 3,992 33, ,595 1,016 NO DATA NO DATA ,348 1,246 26,928 4,086 5,865 36, ,513 1,020 26,513 4,618 5,989 37, ,328 5,503 6,114 37, ,418 21,341 5,517 5,622 32, ,288 6,190 4,819 31, ,069 21,237 5,490 5,558 32, ,253 3,918 3,701 25, ,128 4,705 4,362 29, ,140 1,058 25,383 4,554 5,549 35, ,450 1,549 23,278 4,305 5,363 32, ,184 1,442 22,204 4,791 6,177 33, ,017 1,157 21,926 6,119 5,914 33, ,083 1,373 20,888 3,342 6,521 30, , ,291 3,789 6,760 33, ,093 20,654 3,497 5,972 30, Mean a ,012 1,063 21,689 4,720 5,472 31, a 10 Year Mean Ending 2004 Population status and trend analysis In February/March 2006, the Colockum and Yakima herds were estimated at 3, and 9, (Tables 2 and 3). Estimated populations have been decreasing over the last 5 years. The Colockum herd is below objective and the Yakima herd at objective. The high antlerless harvest in both herds over the last 3-5 years is being reduced to increase the elk numbers in the Colockum herd and stabilize the Yakima herd. If bull harvest is used as an index of population, the Colockum herd has decreased the last 15 years while the Yakima herd is near the historic average. Harvest comparisons must be viewed with caution as regulations have changed dramatically the last 15 years. Recruitment of calves will also have a major influence on bull harvest, which is weighted heavily toward yearlings. However, to maintain the high bull harvest seen in the Colockum from , there were likely more adult cows than surveyed, or a higher number of calves per cows surveyed, or a combination of the two factors. The Yakima herd survey matches the harvest data fairly closely and the observed decrease in overall population. A high antlerless harvest since 1999 has probably reduced the population. Historic harvest indicates the Yakima population has gone through cycles. Relatively low cow harvest in the mid-1980 s resulted in an increasing population that was reduced in the early 1990 s. The population likely peaked and decreased in recent years. The PMU 34 population grew from less than 100 elk in the early 1980 s to almost 1,000 (~840 in the Rattlesnake Hills) in An aggressive hunting program and a trapping effort had reduced the herd to about 600 (~520 in the Rattlesnake Hills). A fire in 2000 displaced elk from the Arid Lands Ecology Reserve (ALE), which contributed to increased harvest. A low antlerless harvest has resulted in an increasing population. Surveys in January 2005 estimated elk; in January 2006 surveys estimated elk. The substantially lower population estimate in 2006 was not expected since calf recruitment exceeded harvest by over 140 elk. A possible explanation for the missing elk is that some moved outside of the survey area. Habitat condition and trend The overall summer range forage for the Colockum herd is improving due to timber harvest. However, large areas may lack hiding cover. When human activity increases, a large portion of the herd concentrates around 79
80 Elk Status and Trend Report Bernatowicz the Coffin Reserve. The area in and around the reserve is heavily impacted by both elk and domestic stock and appears to be in poor condition. When cattle were not present in 2003, photo records show forage availability increased. Colockum winter range forage quality is likely decreasing. Nearly all 2000 acres of winter wheat has been converted to CRP. The older CRP is in crested wheat grass, which is undesirable elk forage in this area. The remaining grasses are typically dry during the winter and have low digestibility. The U.S. Forest Service (USFS), Washington Department of Natural Resources (DNR), and industrial timber companies manage the majority of summer range for the Yakima herd. Habitat suitability for elk varies across these ownerships depending on management emphasis. The USFS is shifting toward a late seral stage emphasis. This change in forest management is likely to reduce forage production on a portion of summer range. The reduction in forage production along with an increased awareness of watershed impacts is beginning to generate concern about cumulative ungulate grazing. In the range of both Colockum and Yakima elk, human use is becoming a concern. Activity on winter and spring range has increased drastically with increased bull numbers and dropped antlers. Stories and observation of individuals chasing elk across the range have become common. In PMU 34, the major change to habitat was a fire that consumed 95% of the winter range for elk in June The short-term effect of the fire was to reduce herd productivity and push elk onto private ranches. The longterm effect is unknown. Wildlife damage Elk damage to agricultural crops is a concern throughout Region 3. Most of the serious problem areas within the Yakima elk area have been fenced. However, in some areas the fence is deteriorating and needs to be rebuilt. Extended seasons below the fence were enacted in 2003 in an attempt to reduce damage. Most of the Colockum herd is not fenced. Damage is being managed by hunting. The boundaries of the hunts are drawn depending on where damage is occurring. In 2004, the damage season was extended to August 1 February 28 th. The program has been successful in some areas. Additional problem elk are being managed through landowner preference hunts. The goal is to eliminate/displace the elk that have developed a preference for agricultural crops. The program would be more successful is disturbance could be reduced in areas where elk are wanted. Historically, elk in PMU 34 cause the most significant damage. The proximity of PMU 34 elk to valuable tree crops further increases the risk. Controlling the herd size is problematic as the core use area is on ALE, where hunting is prohibited. Aerial flights have recently been used to haze elk from wheat fields. This approach appears to be successful in the short term. Long term, the herd needs to be reduced. Reducing the herd is difficult as large reserve borders the agricultural land. When elk do come off, hunters have targeted adult bulls. Management conclusions Based on the available information, the Yakima herd appears to be near the management goals. The Colockum herd is below population and bull ratio objectives. The high antlerless harvest is a concern in both herds. In the Colockum, cow nutrition is likely driving calf recruitment and not bull ratios. The overall summer range may be improving on the Colockum, but animals are concentrated in a small area for an extended period in late summer and Table 2. Colockum elk winter composition Ratios Antlerless Bulls Total (per 100 cows) Year Cow Calves Spike Branched Elk Calves Bulls , , , , , NO DATA , , , , , , , , a 3,871 1, , ,048 b a 2, , b a 3, , b a 2, , b a 3, , b a 2, , b a 3, , b a 2, , b 39 8 a data based on visibilty model b 90% Population Estimate + 90% Confidence Interval 80
81 Elk Status and Trend Report Bernatowicz fall. Winter range quality may have deteriorated. The Yakima herd appears healthy. Hunter opportunity and harvest had been high as the herd was being reduced. Antlerless harvest is now being reduced to stabilize the herd. The PMU 34 herd is above the goal of <350 elk, and is expected to continue to grow. Damage payments emphasize the need to reduce the PMU 34 elk population. Hunting is not expected to control herd growth under the current harvest strategies available to WDFW. Direct management access to elk on ALE is required to effectively manage the number of elk in this sub-herd. Table 3. Yakima elk winter composition Ratios Antlerless Bulls Total (per 100 cows) Year Cow Calves Spike Branched Elk Calves Bulls , , , NO DATA , , , ,085 1, , a 10,399 3, , ,334 b a 8,125 2, , ,242 b a 6,896 2, , b a 6,611 2, , b a 6,815 2, , b a 6,217 2, , b a 6,242 2, , b a 5,717 2, , a data based on visibilty model b Population estimate + 90% C.I. 81
82 Elk Status and Trend Report Link ELK STATUS AND TREND REPORT: REGION 4 PMU 44 GMU 454 PMU 47 GMU 460 PMU 48 GMU 485, 466 RUSSELL LINK, District Wildlife Biologist, District Wildlife Biologist Population Objectives and Guidelines Precise population estimates for elk (Cervus elaphus) in Game Management Units (GMUs) 454 and 460 are unavailable. Estimates for elk numbers in these areas are based on limited surveys and knowledge of herd and sub-herd sizes. Past numbers have been reported as elk in GMU 454 and elk in GMU 460 (WDFW 2001). Elk occurring in GMU 454 are generally restricted to the eastern portions, adjacent to core elk herds and away from the suburban growth and sprawl. However, habituated, small satellite herds do occur in suburban and rural areas. Elk in GMU 460 are scattered throughout the potential range in small, somewhat isolated groups that normally range in size from 8-12, but occasionally approach >50 elk. The North Bend-Snoqualmie herd has grown to an estimated >100 animals. Occurrence varies on the extremes, with elk found from isolated wilderness areas and managed timberlands to suburban/urban populations. Population objectives for GMU 460 are to increase the herd to 500 elk (WDFW 2002). The Green River elk herd in GMU 485 is a subpopulation of the North Rainier Elk Herd that has exhibited a decline during the 1990 s. Elk historically occurred in the Green River, but numbers were limited. In the early 1960s with increased timber harvest, elk populations expanded. There are no historical population estimates, but late winter, early spring numbers likely peaked at about elk between 1988 and Elk population estimates for GMU 485 indicate a continuing increase since 2000 (Table 1) (Spencer unpubl. data 2001, Vales unpubl. data 2006). In 1984 GMU 485 became a unique management unit where access is strictly limited by the City of Tacoma to protect water quality and eliminate unauthorized access. In 1984 GMU 485 became established as a quality bull area with additional high success antlerless hunts. GMU 466, also part of the Green River Watershed, consists of multiple ownerships including US Forest Service lands. GMU 466 retains public access and hunting opportunities for bull elk with a 3-point minimum. In 2002 the North Rainier Elk Herd Plan was written (WDFW 2002). This plan presents information on distribution, herd and habitat management, associated social and economic values, and research on elk that range north of Mt. Rainier on the western slope of the Cascades. GMUs 485 and 466 are considered a sub-herd within the greater North Rainier Elk Herd. Objectives for this herd as written in the above plan include: increasing population numbers to 500 elk, maintaining minimum post-season bull to cow ratio of 12:100, and increasing and improving forage on winter/spring and summer range. Hunting Seasons and Harvest Trends Management strategies vary for the different GMUs. GMU 454 has liberal seasons set for all weapons. This is designed to keep vehicle-elk collisions to a minimum and maintain the population at a level that keeps damage complaints at an acceptable level. Harvest for years in GMU 454 are presented in Fig. 1. Hunting seasons in GMU 460 include a 3-point minimum for all weapon types. This is designed to allow the population to grow at a slow rate and for elk to expand their range. Antlerless harvest was eliminated since the 2000 season to enhance herd growth. Harvest for years in GMU 460 are presented in Fig. 2. GMU 466 continues to be included in the general season with 1998 being the last year an antlerless elk could be taken. Elk intermix with GMU 485 elk, and instrumented elk have been shown to move to winter range down the east side of the Cascades on Manastash Ridge to the L.T. Murray Wildlife Area (D. Vales, pers. comm. 2003). Harvest regulations for adjacent GMUs should be assessed to determine associated impacts to this sub-herd. In part due to the bull only hunt, total elk harvest in GMU 466 dropped substantially from a high of 30 (8 bull, 22 cow) to 5 (3 pt. minimum bulls) in 2002 with an average of 6 elk killed (range 3-8/season) between 1999 and 2004 (Fig. 3). Tribal harvest as reported by the Northwest Indian Fisheries Commission in GMU 466 has also added to the total elk harvest for this GMU. Tribal harvest continues to include cows in this unit and cooperative efforts between the tribes and state are vital to increasing the 82
83 Elk Status and Trend Report Link future productivity of this sub-herd. State late seasons have harvested relatively few elk possibly due to restricted access in this unit during the late season because of snow combined with elk moving to lower elevations. In GMU 485, beginning in 1984, 50 either-sex elk permits were allocated each year for the five-day all citizen season. Hunters focused on the branched bulls and subsequent composition surveys revealed a decline in this herd component. Subsequently, permit allocation was changed beginning in 1986 to reduce bull harvest and increase antlerless harvest. In 1996, 35 antlerless and 15 branch-antlered bull permits were issued. Beginning in 1992 the Muckleshoot Tribe began exercising treaty-hunting rights in the Green River Watershed. Subsequently, permit allocation changed to include the Tribe as follows: 1992 and elk (6 spike, 9 antlerless); elk (6 spike, 19 antlerless, 6 branch-antlered bulls); 1995 and elk (6 spike, 35 antlerless, 2 branch-antlered bulls). Permit numbers totaled 93 for both hunts combined. No permits were issued from Total elk harvest remained fairly consistent for the years , averaging 46 elk. Between 1992 and 1994 average harvest increased to 57 elk, dropping notably to 44 and 25 elk respectively in 1995 and 1996 despite the same permit level allocation. Prior to 1992 these regulations met our management objectives. The increase in harvest from may have adversely affected the population. The hunter success rate was initially high, averaging 91% (range %) between 1984 and Between 1992 and 1995 the success rate declined, averaging 67 % (range 44-83%). The 1996 success rate of 27% was a notable exception to the past and the lowest recorded since Currently, the Muckleshoot Tribe collects age and reproductive data as part of continuing research efforts. The tribe and Tacoma Water also contributes flight dollars for composition flights. Management decisions, permit levels, and allocation result from yearly meetings between the Tribe, State, and Tacoma Water. Since 2000 herd composition surveys have shown an average bull:cow ratio of 23:100. In consultation with the Muckleshoot Tribe a 1 permit any bull hunt for all citizens and 1 any bull tag for the tribe was instituted for the 2004 season by special permit. This was a successful hunt with the tribe and the state each taking one bull. Subsequent survey flights indicated no change in the bull:cow ratio and the permit allocation of 1 elk each for the tribe and the state was instituted for the 2005 season. Surveys Currently no surveys conducted in GMU 454 and 460 because of limited funds and difficulty in surveying elk in the suburban/rural interface. Prior to 1986 elk composition surveys for GMU 485 was primarily from the ground by foot or vehicle; standardized helicopter surveys are now the primary method. Pre-hunt (September) bull:cow:calf ratios from in GMU 485 are presented in Table 1. The pre-hunt composition shows a general decline in calf:cow ratios since The low calf survival rates are below the average for other western Washington herds. Beginning in 1996, flights in June, July, and August were conducted to better assess calf production and to document and compare recruitment with traditional September composition surveys. Calf:cow ratios averaged 40:100 for June-August and declined to 26:100 by September. The pre-hunt, branch-antlered bull ratios have generally increased since 1984 and stabilized at about 29:100 cows. Pre-hunt, branch-antlered bull survey data remained stable for the period. Inadequate funding caused this survey to be scaled back in In no pre-hunt flights were conducted because of population declines. Post-hunt (March) composition counts from have shown a general increase in calf recruitment over the last four years (Table 2). Population Status and Trend Analysis Based on limited, primarily anecdotal information, the elk population in GMU 454 is stable or declining Table 1. GMU 485 Pre-hunt elk herd composition (all ratios per 100 cows) no flights since Year Spikes Br. Bulls Total Bulls Calf a a Includes data from July 97 flight- elk not mixing at this time. No surveys were conducted in 1998, 1999, or 2000 because of low population levels. 83
84 Elk Status and Trend Report Link slightly. Elk from adjacent GMU 490 may use portions of GMU 454 as well as portions of GMU 460. The elk population in GMU 460 is increasing slowly. In GMUs 485 and 466 there are no historic Table 2. GMU 485 Post-hunt elk herd composition, (ratios per 100 cows). Year Total Bull Calves a a a a a 30.3 b a Flight and data provided by D. Vales, Muckleshoot Indian Tribe Biologist. Ratios include bulls not classified. population estimates for comparison, but the long history and experience with this elk herd from field observations and sub-herd location suggests this herd declined from about 1992 to Also, the total number of elk counted during post-hunt helicopter composition flights in March has shown a decline from 1992 thru However, the population has increased since In March and April 1997, a paintball mark-recapture estimate was conducted. This was the first opportunity to assess population changes since It was suspected the 1997 population estimate would show a decline from the 1994 estimate of 612 elk. The 1997 estimate was 227 elk (range ). The paintball mark-recapture estimate was repeated in March and April of 2001 with an estimate of 170 elk (range ) (Spencer unpubl. data 2001). The last post-hunt flight in 2004 gave an estimate of 193 elk (D.Vales unpublished data). Factors that may be affecting this herd are 1) a density dependent decline associated with changes in seral forest stages which reduces winter range carrying capacity and elk numbers exceeding carrying capacity; this can have a negative effect on recruitment and there are some data to support this hypothesis; 2) predation may be affecting recruitment; predation mortality may be additive and not compensatory. GMU 485 was closed to bear and mountain lion harvest until 2000; these predators are likely at maximum densities relative to prey availability. Analysis of mountain lion elk kills (n=28) found that selection for elk < 1 year old was statistically significant. Certainly a combination of these variables should be considered. Calf Mortality Study The WDFW initiated a calf mortality study in May of 1998 to determine the sources of elk calf mortality in GMUs 485 and 466. In 1999 the Muckleshoot Tribe continued with this in cooperation with WDFW. This cooperative study included the Muckleshoot Indian Tribe, Tacoma Water, Weyerhaeuser and Plum Creek Timber Companies, and the Army Corp of Engineers. Results suggested that predation, predominantly mountain lion, is the primary source of death to radio equipped calves. It has been noted that the nutritional condition of elk herds on the westside of the Cascade Mts. tend to be poor in general. Further research to distill differences in calf survival and both proximate and ultimate causes is necessary to understand these relationships (WDFW 2002, D.Vales, pers. comm. 2003). Habitat Condition and Trend In general, quality and quantity of elk habitat in GMU 454 is declining, primarily as a result of habitat conversion. Habitat trends in GMU 460 are more favorable to elk, where several thousand acres of timberlands managed for wood fiber, fish, recreation, and wildlife can support an increasing elk population. There is strong community support for elk sub-herds occupying farmland, open space, parks, and conservation areas in the rural and suburban fringes of GMU 460. The Green River Watershed (GMU 485) has interspersed ownership of private, state, and federal timberlands. Most of the timberlands are intensively managed and create a mosaic of seral stages. Average rotation between successive harvests is about 60 years on private and state lands. These managed lands also contain remnant old growth forest, primarily in federal ownership, at higher elevations (> 2500 feet). There is preliminary information to indicate that overall elk winter range carrying capacity in GMU 485 has declined from about 1955 to This was determined from a forage based model called HABSIM (Raedeke and Lehmkuhl 1984, Raedeke 1995) that tracks forest seral stages and quantifies the change in the amount determined as forage and change in elk numbers for each seral stage over time. 84
85 Elk Status and Trend Report Link Wildlife Damage and Nuisance Problems In GMU 454, elk damage to ornamental shrubs, gardens, and pastures is a problem and numerous complaints are received every year. In GMU 460, elk damage and nuisance are limited in scope, yet can be a notable problem. Elk damage has been a problem primarily to some golf courses and Christmas tree farms. Vehicle-elk collisions have caused loss of human life as well as damage to personal property. Expansion of the elk herd in the North Bend area has potential ramifications for vehicular collisions. GMU 460 has good elk habitat, primarily on managed forestlands and the potential to support about elk without damage concerns. However damage complaints on Christmas tree and blueberry farms, and vehicle-elk collisions on I-90 are raising concerns in the North Bend area. Elk in these GMUs 485, 466 and 460 are not a problem to private property and there are no nuisance problems. Habitat Enhancement Activities Past and present work in GMU 485 has included cooperative projects with the U.S. Army Corp of Engineers, Tacoma Water, and the Muckleshoot Tribe to create open meadow grass habitat plots for elk. These mitigation measures were enacted to compensate for the anticipated loss of habitat from raising the Howard Hansen Dam and subsequent loss of habitat due to additional water storage. In August 2000 a 250 acre forage enhancement project with the RMEF, Tacoma Water, and the Bonneville Power Administration was completed. The project was highly successful and involved spraying and mowing of scotch broom along powerline corridors to stimulate elk forage. The work and collaboration has continued with consecutive projects occurring through In summer of 2005, $30,000 from the combined sources of the Rocky Mountain Elk Foundation, the Muckleshoot Indian Tribe, BPA, and Tacoma Water was used to continue efforts on reducing Scotch Broom cover and improve forage quality. Over 550 acres have been treated mechanically and/or chemically to improve forage conditions on the range. In addition Tacoma Water implemented habitat improvement work and elk pasture creation to mitigate the effects of raising the water level of the Howard Hansen Reservoir. These projects in the form of seeded fields and timber thinning cover over 300 acres and will provide valuable winter and summer forage for elk. Management Conclusions Elk in GMU 454 should continue to be managed with liberal seasons designed to keep damage issues at acceptable levels in developing areas. Isolated sub-herds, generally on the eastern boundary of the GMU should continue to offer hunting and recreational viewing opportunity. Currently the most important concern in GMU 460 is to get an accurate assessment of the population size and distribution of elk. Survey information would facilitate management, habitat protection and population enhancement. Several small sub-herds occur within and immediately adjacent to the urban boundaries of the cities of North Bend and Snoqualmie. Strong community interest suggests these elk represent a quality of life indicator consistent with a rural lifestyle and characterized by open space consisting of greenbelts, local parks, and conservation areas. Efforts should be initiated to identify the scope of habitats used by these elk sub-herds and incorporate new data into city planning efforts to direct development, protect open space, establish parks, and other conservation efforts. Encounters of elk and humans along the urban interface present an opportunity for building and expanding public interest in wildlife conservation. In GMU 485 low calf recruitment rates are a concern for this elk herd. Continued low recruitment and the antlerless harvest rate up to 1996 were incompatible. Management goals for the Green River sub-herd include increasing the population to a minimum 500 elk, maintaining high bull to cow ratios and ensuring a majority of bulls reach the prime age class (5-10 years). The GMU 485 permit hunt is one of Washington s most popular because of the opportunity to harvest and view quality bulls coupled with the high success rates. Elk permits were not issued for the 1997 to 2003 hunting seasons because of the continued population decline. In 2004 a limited entry 1 bull permit each for the state and the Muckleshoot Tribe occurred. The Muckleshoot Tribe and WDFW cooperatively agreed to institute this hunt after 3 consecutive years of high bull:cow ratios. It was further agreed that the limited hunt would be biologically acceptable and not affect the future growth of the herd, while at the same time allowing hunter opportunity; the first since In 2005 a limited entry 3 bull permit each for the state and the Muckleshoot Tribe occurred. Cooperative efforts between Tacoma Water, the Muckleshoot Tribe, and WDFW will continue to assess herd composition and population numbers while enhancing habitat in order to achieve population objectives and improve forage conditions. 85
86 Elk Status and Trend Report Link Literature Cited Raedeke, K. J Big game management plan for the Green River Watershed, Tacoma, Washington. Raedeke Associates, Inc. Seattle. 86pp. Raedeke, K. J. and J. F. Lehmkuhl Elk populations Mount Rainier National Park: status of range outside the park. Final Report, Cooperative Park Unit, Univ. of Wash., Seattle. 69pp. Spencer, R.D Unpublished data and information, GMU 485. Spencer, R.D WDFW unpublished data. Vales, D.J Personal communication. Muckleshoot Indian Tribe Biologist. Washington Dept. of Fish and Wildlife 2002.Washington State Elk Herd Plan, North Rainier Elk Herd. WDFW Game Harvest Reports.. Total Elk Harvest, GMU 454 Harvest Bull Cow Year Figure 1. Annual elk harvest, GMU 454, all weapons combined. Total Elk Harvest, GMU 460 Harvest Bull Cow Year Figure 2. Annual elk harvest, GMU 460, all weapons combined. 86
87 Elk Status and Trend Report Link Total Elk Harvest, GMU Harvest Bull Cow Year Figure 3. Annual elk harvest, GMU 466, *2004 harvest reflects uncorrected raw data reported from hunter reports 87
88 Elk Status and Trend DeBruyn ELK STATUS AND TREND REPORT: REGION 4 PMU 45 GMUs 418, 437 PMU 46 GMU 450 Paul DeBruyn, Wildlife Biologist Population objectives and guidelines Management objectives are outlined in the North Cascade (Nooksack) Elk Herd Plan (Washington Department of Fish and Wildlife 2002) and include the following: 1) Manage the North Cascade elk herd using the best available science. 2) Increase elk population numbers in the North Cascade elk herd to or above the late 1980 s estimated level of 1700 animals. 3) Promote expanding the North cascade elk herd into potential ranges south of the Skagit River in the Sauk unit. 4) Re-establish tribal/state authorized hunting seasons. 5) Manage hunted elk units for spring bull ratios consistent with the statewide plan (currently 12 to 20 bulls per 100 cows) combined with overall bull mortality rates less than or equal to 50 percent. 6) Minimize elk damage to private lands. 7) Work cooperatively with Indian tribes to implement the North Cascade Elk Herd Plan. 8) Increase public awareness of elk and promote recreational uses of elk, including viewing and photographic opportunities. 9) Maintain elk habitat capability on U.S.D.A. Forest Service, WA. Department of Natural Resources, and private lands. Hunting season and harvest trends Conservation closures were established in both GMUs 418 and 437 in Tribal hunting has continued in areas outside the primary range of the Nooksack elk herd (damage areas in both the Skagit and Nooksack river drainages, and other portions of GMUs 407 & 437). Reported tribal harvest during 2005 was 1 bull and 2 cows in GMU 407 and 4 bulls in GMU 437. This is comparable to the 7 bulls harvested by tribal members in Non-tribal harvest during the 2005 season was 6 bulls and 2 cows which was comparable to 6 bulls and 3 cows taken in There were 4 confirmed poaching violations in 2005, all were animals that were shot and left. Other reported sources of human-related mortality include 3 elkvehicle collisions on Highway 20 and 1 mortality due to fence entanglement. Overall known human caused mortality of 19 elk was down from 26 in Surveys A proposal for developing population estimation tools for the Nooksack elk herd was completed in April 2005 as part of a cooperative effort between WDFW and the NW Indian Fisheries Commission (McCorquodale et al 2005). Developing a sight-bias corrected model requires a known number of radio-marked elk of both sexes. Radio-marked cows in the Nooksack population came from previous research efforts and also from translocated animals moved from the Mount St. Helens herd. Resident adult bulls were darted from a helicopter and fitted with radio collars in preparation for population analysis work to begin in More elk will be collared in 2006 to facilitate development of the population estimation model. The North Cascade Elk Herd Plan (WDFW 2002) identifies the development of a statistically valid population model as the highest research priority for this herd. Population status and trends The North Cascade elk herd resulted from successful augmentations in 1946 and 1948 of eastern and western Washington elk stocks. The estimated peak population of 1700 elk occurred in It declined to a low of around 300 animals in 2002 (WDFW 2002). Current population estimates for the Nooksack Herd based upon field observations, are between 400 and 500 animals. Preliminary estimated ratios of calves and bulls to cows based on sightability surveys done in the spring of 2006 are: 34 calves and 36 bulls per 100 cows. Habitat condition and trends Habitat analysis has not been updated from earlier Landsat/GIS work completed in Upgrade of this earlier habitat work is considered a high priority. Problems limiting the current effectiveness of the Nooksack elk range continue to include high road densities on both summer and winter range areas, cumulative disturbance impacts from multiple recreational and management uses on the land, and increased development of trails (hiking, horse, and ORV). Housing development and conversion of forestlands to agricultural and/or industrial use is 88
89 Elk Status and Trend DeBruyn accelerating and poses the greatest threat to elk habitat in the future. The primary winter and summer range of the North Cascade herd on the south fork of the Nooksack River has gone through a series of ownership changes. In 2005, much of it was purchased by the Sierra Pacific Corporation. Access policies of the new owner are unknown at this time. Any increase in public access would probably have a negative effect on the herd. Wildlife damage Estimates of elk numbers occupying agricultural damage areas has increased moderately and was estimated to be between animals in The majority of damage occurs in the Acme area (Whatcom County) and along the Highway 20 corridor between Sedro-Woolley and Concrete in Skagit County. Increased cooperation between the Pt. Elliot Treaty Tribes and the Washington Department of Fish and Wildlife to try to abate and mitigate damage was an encouraging development in 2005 but elk damage complaints in the traditional problem areas persist. It is inevitable that there will be continuing conflict between increasing populations of humans and elk in low altitude agricultural areas. Tribal personnel, in coordination with WDFW, will trap and relocate some problem animals in Recreational Use Efforts are underway in cooperation with The Skagit Land Trust and Skagit County to establish a public viewing area along Highway 20. There is recreational hunt on the agricultural damage hunt unit along the Skagit River Augmentation A total of 98 elk have been transplanted from the Mount St. Helens Wildlife Area (MSHWA) since Projected population responses to augmentation of the North Cascade Elk Herd based upon multiple variables indicated that the transplanting of up to 100 animals was the most practical management option for accelerated recovery of the herd (WDFW 2002). In March 2005 the tribes moved 16 elk into GMU 418 from MSHW. In September and October of 2005, 42 elk were relocated into GMU 418 to complete the planned augmentation from MSHWA. There were no capture related injuries or mortality during the 2005 moves. Although they had a low level of body fat they were all healthy and most survived into Currently there are 64 female elk with active radio collars and 13 without that have been moved from MSHWA. The poor condition of the 2003 transplanted animals was responsible for most of the 21% mortality associated with the augmentation. Management conclusions Management recommendations for the Nooksack elk herd and associated habitat include the following: Continue efforts to establish a statistically valid population estimator. Continue road closure agreements with DNR and Sierra Pacific Corp. in primary winter and summer range areas. Establish public viewing areas. Evaluate potential habitat in the Skagit River drainage. Maintain and/or upgrade existing habitat enhancement projects. Establish new habitat (forage enhancement and road closure) projects in key summer range areas. Maintain elk population numbers in agricultural damage areas at or below current estimated levels ( animals). Continue to collect genetic samples from the North Cascade elk herd. Complete a Habitat Landscape Evaluation for GMU 437 (Sauk). References McCorquodale, S.M., M.A. Davison, and C. Madsen Population Monitoring Tools for the North Cascades elk herd: A Proposal. Washington Department of Fish and Wildlife, Olympia. 23pp. Washington Department of Fish and Wildlife North Cascade (Nooksack) Elk Herd Plan. Wildlife Program, Washington Department of Fish and Wildlife, Olympia. 54pp. 89
90 Elk Status and Trend Report Miller and Woodin ELK STATUS AND TREND REPORT: REGION 5 PMUs All, GMUs All ROBIN S. WOODIN, Wildlife Biologist PATRICK J. MILLER, District Wildlife Biologist Population Objectives/Guidelines The Washington Department of Fish and Wildlife s (WDFW) population management goals for elk (Cervus elaphus) in all Game Management Units (GMUs) of Region 5 are to manage for viable and productive elk populations with desirable population characteristics and to provide recreational opportunity and sustainable annual harvests (WDFW 2003). Specific Region 5 objectives include, (1) manage general hunting GMUs to achieve post season bull elk escapement objectives of 12 to 20 bulls per 100 cows, (2) manage limited entry GMUs for bulls per 100 cows, and, (3) discourage the proliferation of elk in several units by using liberal regulations to reduce damage. In general, herd productivity is managed to maintain the population objective within 5% and is re-evaluated every six years (WDFW 2003). Hunting Seasons and Harvest Trends Historically, data on elk harvest, hunter success, and hunter effort were obtained annually through the WDFW hunter questionnaire and mandatory hunter report cards issued with each elk permit. Beginning in 2001, all hunters were required to report their hunting activity via the phone or Internet prior to obtaining their next years license. This new mandatory harvest reporting structure increases the precision of harvest data. Elk are hunted under WDFW s resource allocation strategy. Hunters must choose a weapon type (modern firearm, muzzleloader, or archery), each of which has distinct seasons of varying length designed to minimize the chance of over-exploitation and to provide equal opportunity. Season length and timing are determined by 3-year hunting packages. The current hunting package operated from 2003 to As previously mentioned, in 2005 elk were managed under four principal harvest strategies in Region 5. During the modern firearm season these were: Any-elk (where any elk is legal) GMUs 564, 568, 574, 578, and pt minimum (any bull with 3 or more antler points is legal) GMUs 503, 504, 505, 506, 510, 513, 516, 520, 530, 550, 558, 560, and pt or antlerless GMU 501. Permit only (limited entry, hunting by permit draw only) GMUs 524, 556 and 522. Beginning in 2003, antlerless harvest in GMUs 506, 520, and 530 was reduced in modern firearm antlerless permits and a restriction of late archery season cow harvest. This harvest strategy was modified in 2005 with an increased antlerless harvest in all 3 units. Antlerless harvest has been curtailed for all user groups entirely in GMUs 510, 513, and 516. In all other units, apart from the permit only GMUs, antlerless harvest was allowed during archery seasons. Antlerless harvest was also allowed during late muzzleloader in GMUs 503 and 505, and by permit during general firearms and muzzleloader seasons. Post-hunt bull escapement ratios in the Region s 3- point and permit only units fell within WDFW s objectives of bulls per 100 cows with one exception. In GMU 506, the bull escapement fell to 10%. Post-season bull escapement ranged between 10%-35% with an average of 14% in the 3-pt GMU s surveyed (see Table 1). Permit entry GMU 556 had a bull escapement of 35%. The Cascade PMU 54 yielded a 12% postseason bull escapement while the pooled lowlands PMUs 56 and 57 were at 14%. The permit hunt on the Mount Saint Helens Wildlife area continued in Ten permits for antlerless elk were offered to disabled hunters and six antlerless elk were taken. The objective of this hunt coincides with the same goals as the transfer of elk to the North Cascades Herd, primarily to reduce elk densities on the valley floor in winter. Hunting conditions were average at the beginning of the 2005 elk season and maintained a typical cool and wet mid-season until early November. In mid December, temperatures ran well below average for approximately 2 weeks. Southwest Washington also saw an extended cold winter with snow into March at relatively low elevations. In Region 5, a total of 28,944 elk hunters spent 148,166 days afield in Region 5 harvest was 3,408 elk. Overall hunter success during the general season was 12%. The estimated 2005 elk harvest of 3,408 was up 19% from the 2000 harvest of 2,865, and 28% higher than last year s harvest of 2,670 (Table 7). Overall, harvest numbers were higher compared to
91 Elk Status and Trend Report Miller and Woodin Most units in Southwest Washington saw similar or increased numbers of elk taken in 2005 compared to Fairly cold and wet weather and early snows prevailed during the general seasons. These conditions did seem to favor an increase in harvest success. Extremely high numbers of antlerless elk were taken in the 574 and 578 GMU s this year. Antlerless harvest in 574 went from 38 elk in 2004 to 144 in 2005, and in 578 the harvest of antlerless went from 70 to 315 for the same time (Table 8). Units that saw harvest increases were GMU s 503, 504, 505, 506, 513, 520, 558, and 588. The other units saw fairly similar harvest rates to 2004, and one unit, GMU 572, had a decline from 194 elk in 2004 to 141 elk in Surveys Since 1996, fall composition counts have been conducted. Data from these counts are used to evaluate; (1) whether elk herds are meeting productivity and escapement goals, (2) the effect of alternative harvest strategies on bull elk population structure, and (3) as input into the elk reconstruction model (Bender and Spencer 1999). Fall composition counts are used to generate calf:cow, bull:cow, and bull age structure ratios. Fall calf:cow ratios are an index of population productivity. Since bulls, cows, and calves freely intermix during and immediately after the rut, fall composition counts may provide better indices of bull:cow ratios, however dominant bulls tending harems may be more likely to be surveyed than subordinate bulls of the periphery. Bull:cow ratios are used to assess bull escapement, which provides information on the number of bulls available for breeding and harvest. Bull age structure is used to estimate annual bull elk mortality rates and, in conjunction with population reconstruction, post-season escapement. Counts were conducted from a helicopter. All elk encountered were recorded. All sample units (SUs) were sampled only once and SUs were widely spaced (>5 miles between SUs). Since sampling was accomplished within a short time period, the possibility of double count bias was minimized. In 2005, fall surveys were conducted on 23 and 24 August, 22, 23, 27, 28, and 29 September. Observed elk were classified as calf, cow, or bull. Bull elk were further classified by number of antler points to determine the percentage of spike, raghorn (2 to 4 antler points) and mature (heavily beamed, five or more antler points) bulls present in the herds. Data were used to generate calf:cow and bull:cow ratios, expressed as the number of bulls or calves per 100 cows. Ninety percent confidence intervals were constructed about the ratios following Czaplewski et al. (1983). A total of 1,572 elk were classified during the 2005 surveys (Table 1). Survey coverage in 2005 was slightly down from last year. Sample sizes were very low for Yale (GMU 554) and Washougal (GMU 568). Also, Lewis River (GMU 560) had a lower than desired sample size combined with so few bull observed as to render the ratios highly skewed and of little value. Strong wind was a factor during most flights. Additional effort was applied to surveying the South Rainier (GMU 513) and Packwood (GMU 516) units. These Cascade Mountain units have been very difficult to survey and obtain adequate sample sizes due to the predominantly closed canopy cover type on National Forest lands. Also, climate conditions at higher elevation west Cascades tend to follow a pattern of low morning clouds with strong east winds by afternoon and evening making survey flights impossible. This year we attempted 2 flights of the 513 and 516 units in late August. Temperatures were in the low 70 s and very few elk were seen in the 513. The next flight in the 516 again saw warm weather, which created poor maneuverability and unsafe conditions and the flight was aborted. These experiences again confirm the challenges we face with climatic and habitat cover factors as obstacles to observing elk in Cascade Mountains forestland. At present we are evaluating the option of post-season flights, which may give us greater opportunity to observe elk. However, sample sizes will need to be much larger to offset the known lack of bull observation due to sexual segregation. Demographic parameters are presented in Tables 1 and 2. Confidence intervals continue to be 18-35% of the given parameter. Survey sample sizes greater than 200 elk tend to yield tighter estimates. It will likely require more effort than current funding allows to reduce these confidence intervals to desirable levels. One approach would be to sample fewer units more thoroughly on a bior tri-yearly basis. Permit Units A survey was not conducted in GMU 524 (Margaret) in 2005 due to limited funding. The bull mortality rate in Toutle was 35% (Table 3). This years survey took place after the early archery season where 12 bulls were harvested. However, both the bull:cow and calf:cow rations were within acceptable range. The age distribution of bulls in the Toutle unit continues to show a decrease in the 2005 survey (Table 3). The mature bull component of the population in Toutle has gone from 17% to 5% since 2001 to the present. Since 2004, permit levels remained the same for modern firearm and muzzleloader (both bull and antlerless) permits, and only slight changes were made for archery bull tags. Permits in the Toutle unit decreased 91
92 Elk Status and Trend Report Miller and Woodin from 58 in 2004 to 55 in 2005, and increased one permit in the Margaret from 9 to 10 permits. Given the fairly constant rag horn bull percentages in these two units, and with better control over harvest now, the mature bull component should increase over the next couple of years. Both the Margaret and Toutle seem to have recoved from several years of higher than average mortality, that affected all age and sex classes, albeit some harder than others (i.e. calves). We are meeting our escapement objectives in these 2 units. Because of the lack of public tolerance to winter mortality, especially in highly visible areas like the Toutle River valley near Mount Saint Helens, additional harvest will be considered with increased permit levels in both Margaret and Toutle units in the near future. Open Entry Units Productivity ratios were good throughout the Region falling between 44 and 59 calves to 100 cows (Tables 1, 2, 4, and 5). Bull ratios were adequate. Spikes made up the majority of bulls at 49% on average with raghorns comprising 43%. The presence of mature bulls declined from 2004 throughout the open-entry units. Mature bulls comprised 8% of the sampled bull population, which was just below the average of 9% in these units prior to 3-pt minimum regulations. Surveys indicate that the 3-pt minimum regulation has mostly resulted in achievement of bull mortality rate objectives. In the 558, 572, 520 and 550 units, bull mortality rates were between 35% and 50%. However, the 506 and 530 units exceeded the mortality rate objective of 50% at 63% and 60 % respectively. Post-season bull escapement of 12% to 20% has been met in all but one unit. The 506 unit bull escapement fell to 10%. When combined with the 530 unit (the second hunt unit in the Willapa Hills west of I- 5), the escapement is 13%. One obvious clue is the harvest in the 506, which went up from 220 bulls in 2004 to 268 in Bull mortality and escapement in the 530 has been of concern (Table 5), and both the 530 and 506 units shall continue to be closely monitored. Productivity in the 530 and 506 is good with the calf to 100 cow ratios at 47 and 46 respectively. This indicator of recruitment is good for overall elk numbers but will not be enough to address the low proportion of older bulls in a timely fashion. Productivity ranged from a low of 44 calves per 100 cows in the 520 GMU to a high of 59 calves per 100 cows in the 558 GMU. This range is well within desirable objectives. The 2005 survey results from PMU s 56 and 57 underscore the importance of comprehensive annual surveys. Increased effort in sampling Cascade elk units (PMU s 54 and 55) has begun to help in the evaluation of the 3-pt minimum regulation (see Table 2). However, the increased emphasis here has reduced survey efforts in other lowland and permit-entry units. Conditions of closed canopy persist, still making adequate sample sizes difficult to obtain, as in this year s surveys of GMU 560, 516, and 513. Differences exist in habitat, climate, and access between the Cascades and the lowland areas. Survey effort must continue in both to insure the 3-pt minimum regulations allow our elk populations to meet escapement goals (Table 6). Survey data and modeling indicate that the lowland units continue to fall within objectives for escapement. However, the long-term trend for bull mortality in the Willapa units, both the 530 and 506, must be closely monitored. Bull Mortality rates for the two lowland PMU s (56 and 57) were 42% and 62% this year (Table 2). Population Status and Trend Population modeling, in conjunction with other indices, shows a stabilization of the general decline in elk populations in most areas of Region 5. Estimates using population reconstruction are very responsive to harvest levels. Therefore, in a year where many units had increased harvest, the population estimate also showed an increase. We are cautious to interpret this estimate in isolation, and look to multi-year trends in survey ratio s, harvest figures, and population estimates for a more robust interpretation. In addition, applying these numerical indicators to a larger geographic scale will help to reduce errors in interpretation. Again, larger survey sample sizes and accurate harvest reporting are the means to better population modeling and estimation. Habitat Condition and Trend In most years, climate tends to have a negligible effect on regional elk populations west of the Cascade Crest. Localized effects, however, can be drastic. Although snowfall at higher elevations may be heavy, subsequent freezing conditions seldom occur. Elk summering at higher elevations tend to be migratory in response to snow, whereas elk at lower elevations exhibit year-round fidelity to those areas. The primary effect of climate on elk west of the Cascade Crest is the influence it exerts on hunting pressure. The severe winter kill of in the Toutle River valley was more likely due to poor quality wintering ground and high elk numbers, than to a catastrophic winter event. However, this past winter was climatically severe, and the number of winter mortalities observed on the Mount Saint Helen s Wildlife Area was slightly less (63) than in Public tolerance of winter mortalities is very low, especially in an area of high public use and visibility. 92
93 Elk Status and Trend Report Miller and Woodin Degradation of wintering habitat had occurred along the North Fork of the Toutle River, specifically along the mudflow within the St. Helens Wildlife Area. The inadequacy of the habitat was evident in the winter of Declines in habitat quality have been a result of (1) shifts in plant composition away from nutritious forages, (2) invasion of exotic plants such as Scotch broom, (3) continued erosion of stream side vegetation, and (4) erosion of land acreage. Although regular habitat improvements such as seeding and fertilizing as well as woody plantings for erosion control have been ongoing, other factors influence winter habitat. As the surrounding forested slopes of the Toutle Valley re-grow from an open seral stage to a closed canopy, forage has declined. Consequently, both a shrinking overall forage base and early spring severe cold and snow combined with habitual wintering use of the mudflow portion of the valley floor by elk resulted in significant die-offs. Anecdotal information suggests that winter mortality was an issue in other areas of SW Washington. Consequently, the elk winter kill was not isolated to just the North Fork Toutle Commercial forest owners in the two Willapa Hills units (530 and 506) have increased timber harvest activity in the past 4 years. Much more acreage is now in early successional stages and harvest rates of elk were up in Complaints of damage to both replanted forest areas and agricultural crops is increasing, especially in the 530 unit. The bull mortality rate was up again at 60% in the 530 and up to 63% in the 506. Also, bull escapement in the 506 at 10 % failed to meet goals. These units will be closely monitored with plans to reduce damage in specific sites while safeguarding an adequate bull proportion. Region 5 continues to face loss of elk habitat through: (1) establishment of extensive Late Successional Reserve (LSR) on US Forest Service (USFS) lands that reduce forage habitat, (2) increased residential development along the three hydroelectric reservoirs (Merwin, Swift, and Yale Reservoirs) that had inundated historical winter range, decreases in winter range acreage along the Lewis River watershed, and (3) general increases in development and human encroachment throughout the lowlands of Region 5 which results in a lower tolerance by landowners to the presence of elk. Mitigation for the loss of winter range along the Lewis River watershed has been addressed in the Merwin Wildlife Management Plan. The Plan is a cooperative management agreement for Merwin Reservoir between Pacificorp (Portland OR), the utility company managing Merwin, Swift, and Yale Reservoirs, and the WDFW. Similar efforts have recently been initiated on company lands surrounding Yale and Swift Reservoirs. Augmentation / Habitat Enhancement The WDFW continues to take steps to enhance forage quality on the Toutle mudflow through plantings and fertilization. Enhancement activities in the past year include planting 15 acres of trees and grass clover mix for riverbank stabilization. Fertilizing was accomplished on 125 acres of forage, with lime applied to 40 of those acres. Another 258 acres were managed by removal of scotch broom and other weeds. In October 2005, 50 elk were relocated from the St. Helens herd to the North Cascades. This was the second year of a two-year augmentation project to move up to 50 elk per year from the Mount Saint Helen s Wildlife Area to the Nooksack Region in Northwest Washington. A total of 41 cows and calves were transported in October While transferring elk from the Mount Saint Helen s Wildlife Area to the North Cascade Herd may alleviate some pressure on the Toutle River valley wintering grounds, it is not viewed as a long-term strategy for herd management. It was rather an effort to take advantage of an opportunity to use surplus animals to supplement an elk population in another area that was struggling. As a result of this winter s mortality event on the mudflow, the herd plan for the Mount Saint Helen s elk herd has been updated. Many factors, which include increased human population, damage complaints, and declining habitat on USFS and other timberlands, when combined, suggest a proposed herd reduction from approximately 13,500 to 10,000 elk. Other objectives specified in the Mount Saint Helen s Elk Herd Plan are to continue post-season bull ratio and mortality rate goals for open-entry, three-point, and permit-entry units as stated at the beginning of this report. The plan also outlines objectives to continue efforts to monitor and improve winter habitat and wintering elk populations in the Toutle River valley. In addition, plan goals address minimizing damage conflicts, increasing public appreciation of the elk resource, and using the best available science. This plan has been submitted for public review and three public meetings have been held to gather input from citizens. Management Conclusions Bull escapement is meeting objectives in the permit and 3-point units east of I-5. However, the Willapa Hills 3-point units are not meeting some goals and changes in management may be needed. Better means to assess and survey 3-point units on National Forest land in the Cascades will continue to be tested. We will continue to monitor the efficacy of these strategies. Prior to 2000, the level of population survey in Region 5 was inadequate to determine the effects of both winter severity on calf survival and various harvest 93
94 Elk Status and Trend Report Miller and Woodin regimes on our elk. The utility of spring surveys to determine over-winter calf survival was illustrated in the early 1999 survey. Although not suitable for adult sex ratios due to biased samples, spring surveys do provide good indications of calf survival and ultimate recruitment to the population. Spring surveys may also be the best means to survey National Forest lands in the Cascade Mountains. The current intensity and coverage of Region 5 fall surveys should be continued. Recent survey coverage has been inadequate to provide representative sampling of most parts of the Region. The increased effort in the Cascade units, where historically survey sample sizes have been low, should continue. Population modeling is dependent on good data input. Due to the variability in our elk units, representative survey data must be collected annually. Pre-season survey intensity needs to remain high, in order to increase sample sizes, reduce confidence intervals, and provide the best model inputs. Literature cited Bender, L. C., and R. D. Spencer Estimating elk population size by reconstruction from harvest data and herd ratios. Wildl. Soc. Bull. 27: Czaplewski, R. L., D. M. Crowe, and L. L. McDonald Sample sizes and confidence intervals for wildlife population ratios. Wildl. Soc. Bull. 11: WDFW Mount Saint Helens Elk Herd Plan. Wildlife Management Program, WDFW, Olympia. 38pp. WDFW Game Management Plan. Washington Department of Fish and Wildlife. Olympia, WA. USA. 136p. Table 1. Helicopter Survey Data and Ratios, Sept PMU GMU Spike Rag Mature Bull Cow Calf Unk Total BU:CO CA:CO Bull mort Bull Escapement P NA NA NA NA P NA NA NA NA P ±7 59±11 47% 18% P NA NA NA NA P ±12 48±16 35% 12% P ±10 44±10 35% 15% P ±8 49±10 50% 14% P ±11 47±12 60% 16% P ±7 46±10 63% 10% ±13 47±12 35% 35% NA Sample size too small for meaningful analysis Table 2. Demographic Parameters Combined by PMU, Sept PMU SAMPLE SIZE BULL:COW CALF:COW BULL MORTALITY BULL ESCAPMENT P ±7 59±11 47% 18% P ±12 48±16 35% 12% P ±6 46±7 42% 14% P ±6 46±7 62% 13% Table 3. Historic Survey and Demographic Data from GMU s 524** and 556, GMU YEAR SPIKE RAG MATURE BULL COW CALF TOTAL B:CO CA:CO BULL MORT ±5 28±3 24% ±* 43±* 24% ±5 58±9 26% ±8 62±8 41% ±5 45±4 36% ±8 31±6 21% ±6 36±5 40% ±5 48±5 35% ±6 45±5 38% ±9 55±9 34% 94
95 Elk Status and Trend Report Miller and Woodin ±13 44±12 35% ±4 40±5 24% ±10 53±12 20% ±4 37±3 25% ±7 45±9 23% ±7 52±10 35% ±10 35±11 18% ±7 33±7 52% ±7 49±10 39% ±9 49±9 37% ±11 51±13 45% * Anomaly in population model estimate prohibited confidence interval calculation. ** 524 not flown in 2005 due to budget constraints. Table 4. Historic Pooled Demographic Parameters from GMU s 520 and 550, YEAR BULL:COW CALF:COW BULL MORTALITY SAMPLE SIZE ±6 46±7 42% ±8 38±9 52% ±14 44±11 57% ±4 50±4 52% ±7 48±8 61% ±9 49±10 62% ±10 51±15 38% ±8 33±7 68% ±5 42±7 74% ±9 42±12 70% ±6 54±11 82% 293 Table 5. Historic Demographic Parameters for GMU 530, YEAR BULL:COW CALF:COW BULL MORTALITY SAMPLE SIZE ±11 47±12 60% ±14 32±11 46% ±7 54±11 58% ±6 60±6 62% ±18 46±21 64% ±11 54±15 71% ±12 56±17 67% ±10 47±16 50% ±11 39±13 64% ±8 39±12 56% ±12 47±14 50% 134 Table 6. Pooled Survey Data by Geographic Area, LOCALE PMU SPIKE RAG MATURE BULL COW CALF TOTAL CASCADES LOWLANDS Table 7. Southwest Washington (Region Five) Elk Harvest for the 2005 General Hunting Season. WEAPON TYPE BULL HARVEST COW HARVEST TOTAL HARVEST # HUNTERS HUNTER SUCCESS HUNTER DAYS DAYS/ KILL M. FIREARM 1, ,031 17, , ARCHERY , , MUZZLELOADER , ,
96 Elk Status and Trend Report Miller and Woodin TOTAL 2,292 1,116 3,408 28, , Table 8. Southwest Washington (Region Five) Elk Harvest for the 2005 General Hunting Season by Population Management Unit (PMU) and Game Management Unit (GMU). PMU GMU BULL HARVEST COW HARVEST TOTAL HARVEST # HUNTERS HUNTER SUCCESS HUNTER DAYS DAYS/ KILL P , , , SUM , P , , , , SUM , , P , , , SUM , , P , , , , , , SUM , , P , SUM , P , , , , , , , SUM , , P , , , , , , , SUM , ,
97 Elk Status and Trend Report Zahn ELK STATUS AND TREND REPORT: REGION 6 PMUs 61-67, GMUs H. M. ZAHN, District Wildlife Biologist Population objectives and guidelines The year 2005 hunting season was the third of the three-year season package. Overall management goals are to increase or maintain elk (Cervus elaphus) populations in suitable habitat while addressing localized elk damage complaints. On the Olympic Peninsula long-term management strategies will need to be cooperatively developed and implemented with Olympic Peninsula Treaty Tribes. Hunting seasons and harvest trends For the year 2005 hunting season the three-point minimum antler restriction for bull elk was retained region-wide. In addition to general elk seasons a total of 612 either sex or antlerless-only permits were issued to all user groups including Advanced Hunter Education graduates and Persons of Disability. Only 89 of these permits were issued on the Olympia Peninsula mostly to address elk damage issues in the Dungeness Area and in portions of the Satsop Unit. Harvest estimates, based on mandatory reporting adjusted for non-response bias, project a total regionwide elk harvest of 949 during general elk seasons, up 9 percent over the previous year. The estimate of the number of elk hunters in Region 6 decreased by about 8 percent for the same period. The percentage breakdown of the total elk harvest by user group was 53, 29, + and 17 percent for modern firearm, archery and muzzleloader users respectively. Permit holders took an additional 163 elk during permit seasons. General seasons harvest estimates of antlered elk by Population Management Units (PMU) are listed in Table 1. Hunting conditions were typical for the area and season with no unusual dry or inclement weather recorded. All harvest estimates are for state hunting seasons only and do not include harvest by treaty tribes. Region-wide the general season harvest of antlered elk was estimated as 756 in This is a 6 percent increase over the previous year. An additional 28 antlered elk were taken during special permit seasons. Consistent with recent years the PMU with the largest harvest was PMU 61. In fact the 3 Game Management Units (GMU) with the greatest harvest are all in PMU 61. Over the recent 5-year period ( ) GMU 673 (Williams Creek) has supported an average annual general elk season antlered harvest of 124 bulls. The Table 1. Antlered elk harvest for the 2005 general elk seasons by PMU. PMU Antlered harvest % Change from GMUs comprising PMU 65 include some of the historically best elk areas in Region 6. Antlered elk harvest in this PMU was estimated at 97 bulls, a decline of 10 percent over the previous year. During the reporting period, meetings between regional personnel and representatives of Olympic Peninsula Tribes continued for the purpose of managing the elk resource of the Olympic Peninsula cooperatively. Periodic technical and policy meetings have taken place with representatives of the Point No Point Treaty Council (Skokomish, Port Gamble S Klallam, Jamestown S Klallam, Lower Elwha Klallam), Quinault, Hoh, Quileute and Makah Tribes. Surveys During the first week of October 2005 a total of 25 antlered elk were captured and radioed in GMU 673 (Williams Creek). The 23 branched - antlered and 2 spike (yearling) bulls were marked with internal transmitters that change their signal upon the death of the animal. This marked the beginning of what hopefully will be a multiple year investigation of antlered elk mortality rates and factors in this unit. On April 5 and 14, 2006, post-season helicopter elk composition counts were conducted in 2 GMUs. During these surveys elk are classified as cows, calves, yearling bulls (spikes) and branch-antlered bulls (2.5 years old and older). Table 2 summarizes the results of this survey. Post-season surveys have value in estimating over-winter calf survival and hence recruitment into the yearling class. Post-season surveys are not, however, good indicators of adult bull (older than yearling) escapement since adult males do not mix freely with other elk at this time of year. This pertains 97
98 Elk Status and Trend Report Zahn Table2. Results of post-season elk surveys by GMU (Spring 2006) Antlerless Antlered Ratios per 100 cows GMU n Cows Calves Spikes Branch Calves Spikes Branch particularly to the forested areas of coastal Washington. One method of estimating annual bull mortality from all sources is to look at the proportion of yearling males among antlered elk seen during preseason (fall) surveys. Because of bull elk behavior during the rut it is felt that this results in a conservative estimator of overall annual bull elk mortality rates from all sources. Population status and trend analysis Harvest figures of legal bulls taken during the 2005 state elk seasons confirm trends observed in recent years. Thus the bull harvest on the Olympic Peninsula is now above the very low levels observed during the early to mid 1990 s although still below the 1980 s levels. At the same time the bull elk harvest in PMU 61,which is mostly in Pacific County, leads the Region. All indications are that this trend is likely to continue into at least the near future. Factors contributing to this positive trend likely include the increased availability of cover as well as road closure programs practiced by the private and public landowners in the area. Habitat condition and trend Habitat conditions on managed forestlands continue to be generally favorable for elk, although high road densities are detrimental if roads are open to vehicular traffic. Units that sustained large-scale timber harvest during the 1970s (portions of Pacific County) now have large stands of second growth that now serve as cover. Timber harvests continue in the area and we have not documented nutritional stress (due to lack of forage) at the population level. Indeed, there are no indications of unusual winter mortality. Current forest management practices, which favor smaller clear-cuts, will benefit elk. Management conclusions The guiding principles of the previous 3-year season package were carried over into the year 2005 elk season. These include a 3-point minimum antler restriction for legal bulls, conservative cow harvest, where possible, and no cow harvest on the Olympic Peninsula during state seasons. We continue to try to address elk damage problems through special permit seasons. Elk calf survival and hence recruitment rates are in line with long-term averages. Unusual winter mortality has not been documented. 98
99 Mountain Goat 99
100 Mountain Goat Status and Trend Report Martorello MOUNTAIN GOAT STATUS AND TREND REPORT Statewide DONALD A. MARTORELLO, Carnivore, Furbearer, and Special Species Section Manager Population objectives and guidelines The population monitoring objective for mountain goats is to monitor population demographics of mountain goats at a level where a 20% decline in population size can be detected within 3-years or less. The corresponding harvest objective is to provide recreational hunting opportunities in individual mountain goat herds where harvest success averages >50% over a 3-year period, while at the same time goat population size remains stable or increasing. Specific guidelines for managing harvest within sustainable limits are discussed WDFWs Game Management Plan (2002). Key guidelines are to maintain a herd productivity goal of 25 kids:100 adults, only allow harvest in goat population meeting or exceeding 50 total animals, and limit harvest opportunity to 4% of the total population. Hunting seasons and harvest trends Mountain goat hunting opportunity in Washington is limited by permit. Permit availability (and therefore hunter opportunity) has decreased dramatically over the last 10 years (Figure 1). Nineteen permits were available in 10 goat management units in The 2005 mountain goat season provided 47 days of mountain goat hunting (September 15 to October 31). Hunters were able to use any legal weapon and may Permits and harvest Harvest 1997 Year Permits 2003 Figure 1. Mountain goat recreational hunting opportunity in Washington harvest any adult goat with horns greater than 4 inches. Of the 19 permits available in 2005, 16 individuals actually reported that they hunted goats. A total of 19 goats were killed for a hunter success rate of 84%. Given the marginal status of mountain goats (see Population status section), only goat populations that are surveyed annually, and meet or exceed population guidelines described in the Game Management Plan are considered for recreational hunting. Surveys For many years, funding limitations greatly reduced the Departments ability to conduct thorough and consistent surveys. However, during the last six years, funding from cooperative grant sources allowed volunteers and Department staff to survey nearly all goat units during 2004 that were open to hunting. All surveys were conducted using a helicopter and generally occurred between July and September. Because the funding level wasn t enough to survey all goat units, (regardless if they re hunted or not) priority was given to hunted units. As such, no complete survey effort has been accomplished during the last 6 years for most of the goat units closed to hunting. Surveys that have been done in closed units were funded and conducted via collaboration research project headed by WDFW. Population status and trend analysis Mountain goat populations have been on the decline in Washington for many years. Historically, goat populations may have been as high as 10,000 animals. Today goats likely number fewer than 4,000. Hunting opportunity has decreased accordingly, and current permit levels are conservative and represent 4% on the known population in herds that are stable to increasing. Despite continued reductions in hunting opportunity many local goat populations continue to decline. However, despite the overall declining trend in goat numbers and range, a few populations are doing well. Goat populations around Mt. Baker, alone the lower Cascade crest, and the north shore of Lake Chelan appear to be stable to slightly increasing. Habitat condition and trend Fire suppression policies and natural forest succession continues to degrade critical mountain goat foraging habitat. Fire suppression allows conifers to invade these natural openings and decreases their 100
101 Mountain Goat Status and Trend Report Martorello foraging value for goats. The degradation and loss of alpine meadows, coupled with increasing recreational human use and disturbance of alpine habitat are likely the two greatest negative impacts to mountain goats. Management conclusions In terms of goat management, the two biggest obstacles are the lack of biological information on individual goat herds and a consistent funding base to assess the status of goats. To address the need biological data need, a new goat research project was initiated during the summer of The objectives of the project are to identify the cause of the goat decline in Washington, provide recommendations for reversing that decline, and develop a robust survey method for assessing goat populations in the future. 101
102 Mountain Goat Status and Trend Report Base and Zender MOUNTAIN GOAT STATUS AND TREND REPORT: REGION 1 Linton Mountain DANA L. BASE, Associate Wildlife Biologist STEVE ZENDER, District Wildlife Biologist Population Objectives/Guidelines The current population objective for the Linton Mountain Goat Herd is to maintain a viable population for public viewing. The Linton Mountain area received national recognition when the U.S. Forest Service recognized the Sullivan Lake District of the Colville National Forest with an award for developing a public mountain goat viewing area. The area was developed in partnership with the Washington Department of Fish and Wildlife, local industry, and the Inland Northwest Wildlife Council. Population Surveys, Status and Trends As far as we know, mountain goats did not occupy Linton Mountain since Euro-American settlement until 7 animals were released there by the Washington Department of Game in The original herd came from Nason Ridge in Chelan County and consisted of 2 billies, 4 nannies, and 1 female kid. Other transplants of mountain goats into Pend Oreille County were also made by the Department of Game in the early 1960s. These included 5 nannies along with 2 billies to Dry Canyon in 1962 and 4 nannies along with 2 billies to Monumental and Molybdinite Mountains in Only the Linton Mountain introduction, however, resulted in a significant goat population. In the 40+ years since the original transplants, various observations of mountain goats have been documented in small, rocky cliff areas in a few places outside of Linton Mountain. The most recent of these included the following reports to the U.S. Forest Service: One mountain goat observed in the North Fork Harvey Creek area in spring of 2005 ; A group of 3 mountain goats observed and photographed near Cato Creek in the fall of 2004 ; and 1 mountain goat seen at Dry Canyon on August 12, 2004 (M. Borysewicz, pers. comm and 2005). There is no evidence, however, of any reproducing mountain goat population anywhere in northeastern Washington outside of Linton Mountain. In 1981, 11 mountain goats from the Olympic Mountains were trans-located to Hooknose Mountain, which is roughly 5 miles north of Linton Mountain. At least 3 of these 11 including 2 billies and 1 nanny, were subsequently found at Linton Mountain. Surveys of the Linton Mountain Goat Herd are generally accomplished by ground-based counts. Excellent views of nearly the entire goat range are afforded by vantage points along Boundary Road near the town of Metaline Falls. Additional vantage points are on a primitive road that services a high voltage power line with a wide right-of-way clearing parallel to the goat cliffs. Surveys seem to be most productive when conducted either early or late in the day. In recent years the counts have been so low that multiple visits have become necessary to improve the likelihood of seeing any goats. Mountain goats have been observed only intermittently at Linton Mountain since the year The most recent observation of mountain goats by agency personnel at Linton Mountain was of 1 unclassified adult mountain goat on September 25, Since the mid 1990s the mountain goat population at Linton Mountain has become perilously low and unproductive (Table 1). Reasons may include poor habitat conditions, the severe winters of as well as , and predation. Hunting Seasons And Harvest Trends Mountain goats at Linton Mountain were hunted from The number of permits authorized annually ranged from 5 to 15 and animals harvested ranged from 4 to 11. Hunters took a total of 34 mountain goats over the 5-year period, with mostly nannies harvested. Hunting has not resumed at Linton Mountain since 1976, as the goat population has not consistently met Department guidelines for recreational hunting. Habitat Condition And Trend No recent comprehensive surveys of mountain goat habitat have been made at Linton Mountain. Both quantity and quality of forage along with predator escape terrain may be limiting factors to goat population growth. Controlled burns may be a strategy to enhance goat habitats in the area. The Sullivan Lake Ranger District has developed a controlled burn plan for the area but has thus far not implemented it. The long-term goal continues to be to improve foraging habitat on Linton Mountain, but the few goats 102
103 Mountain Goat Status and Trend Report Base and Zender remaining there now are likely not limited by forage quantity. Table 1. Survey history of the Linton Mtn. mountain goat herd, Population Kids per Kids Adults Year Estimate 100 adults 1965 a b b 7 b 1967 b b 9 b 1968 b b 11 b 1969 b b 14 b 1970 b b 18 b 1971 b b 23 b 1972 c b b 32 b 1973 c b b 32 b 1974 c b b 35 b 1975 c b b 33 b 1976 c B b 34 b 1977 B b b b 1978 B b b b 1979 B b b b 1980 B b b b 1981 B b b b 1982 d ? ? 0 a Year that seven Mountain Goats were translocated from Chelan County to Linton Mountain. b No survey data available. c Years that herd was hunted by special permit. d Year that 3 marked Mountain Goats were identified at Linton Mountain that came from failed release of 11 animals at Hooknose Mountain in Augmentation There is currently no source of mountain goats available for augmenting the Linton Mountain population. As the pool of breeding animals is apparently dying out since the population peak around 1989, a new introduction is likely necessary to keep the herd viable. Management Conclusions At present, there are too few goats remaining in the Linton Mountain Goat Herd to provide a reliable viewing opportunity. The population appears to be perilously near extirpation. While opportunities for augmentation are not on the immediate horizon, augmentation will likely be needed to re-establish this goat-viewing site. Personnel will continue occasional ground-based surveys to document any animals that are present. Since surveys are labor intensive, qualified survey volunteers who possess necessary optical equipment will be enlisted whenever possible. 103
104 Mountain Goat Status and Trend Report Fitkin MOUNTAIN GOAT STATUS AND TREND REPORT: REGION 2 Methow Unit 2-2 SCOTT FITKIN, District Wildlife Biologist JEFF HEINLEN, Wildlife Biologist Population Objectives/guidelines Currently, the Methow unit is being managed for conservative, sustainable yield, with the goal of increasing herd size and distribution where possible. In addition to hunting recreation, watchable wildlife opportunities, such as the salt lick along the Hart s Pass Road, are encouraged. Hunting Seasons And Harvest Trends Hunters enjoyed good conditions in 2005 with the high country remaining accessible throughout the season. The two issued permits yielded one harvested goat in 2005 (Table 1), and hunters saw an average of 48 goats, including several kids. For 2006, WDFW again issued two permits in the Methow Unit. Surveys Annual surveys are conducted to determine minimum population size and herd productivity. This data is used to generate hunting permit allocations in accordance with statewide management guidelines. This year s more intensive surveys again involved ground observers as part of statewide goat sightability index project. Surveys during the summer of 2006 yielded a count of 43 animals. This is the lowest recorded count since High seasonal temperatures during the survey were thought to have moved the animals into the shade significantly reducing the ability to observe the animals. Productivity remained low, possibly also a function of poor survey conditions (Table 2). In 2002, WDFW extended an ongoing goat research project to the Methow Unit. Data collection is Table 1. Summary of harvest information for mountain goats in the Methow Unit. Year Permits Hunters Goats Harvest Success Seen/Hunter % % % % % % % % % % % % complete on the two mountain goats that were radiomarked in Goat Unit 2-2. Valuable information on seasonal movements and habitat was obtained and is now being analyzed. These animals were part of a larger effort to assess population parameters and habitat relationships. Also, a sightability model is being developed to improve survey data accuracy and consistency. Population Status And Trend Analysis Consistent funding has allowed for a consistent survey effort in the Methow Unit for several years. The population appears to be relatively stable. Marginal productivity in recent years may be the result of advancing successional change since the last major fire in the Mt Gardner portion of the unit. Incidental observations outside of traditional hunting units suggest small numbers of goats are persisting in pockets scattered throughout suitable habitat in the Okanogan District. Little survey work has been done in these areas due to lack of resources. Population size or trend is unknown for these animals; however, anecdotal information from outfitters and others suggests no major changes in abundance or distribution. Habitat Condition And Trend All goats in the Okanogan District had to contend with a harder than normal winter this past year, consisting of deep snow over a longer than normal duration. Winter mortality is anticipated to be higher than normal. Goat habitat is almost entirely within secured areas and habitat availability remains stable. Habitat quality varies noticeably throughout goat range in the Okanogan District. For instance, in areas of recent fire activity, goats benefit from favorable foraging conditions. On the other hand, range quality in heavily forested areas suffers from fire suppression, and could benefit from some pro-active fire management. Much of the district s goat habitat is in wilderness areas. Thus, changes in habitat quality will occur primarily through natural stochastic events such as wildfires and avalanches, rather than human intervention. Wildfires burned over 20,000 acres of goat habitat in the Methow Unit in This should stimulate early successional forage, which may in turn improve goat productivity.
105 Mountain Goat Status and Trend Report Fitkin Management Conclusions The management objective of harvesting no more than four percent of a herd hinges on reliable survey data. As a result, emphasis should remain on providing the resources necessary for a consistent survey effort. Sightability of the animals can be quite variable in portions of the unit. Current research to develop a sightability index will produce more accurate and dependable survey results. Goat populations in the Methow Unit are the most robust in the district, but require diligent scrutiny, due to continued low productivity. Suitable goat habitat adjacent to this unit is sparsely populated and could likely support many more animals than exist currently. In light of these conditions, a conservative harvest strategy in the Methow Unit should continue. Hopefully, the recent fires will reverse these trends. If in practice, the Methow herd grows but exhibits little dispersal, animals could be actively relocated to other suitable areas in the county. Table 2. Population composition counts from the Methow Unit. K:100 A is kids per 100 adults. Minimum Year Kids Yearling Adults Population K:100 A : : : : : : : : *25: *28: *23:100 *Starting in 2004 adults and yearlings were classified separately. Prior to 2004 yearlings were classified as adults. Therefore, the ratio K:100 has changed to exclude yearlings starting in
106 Mountain Goat Status and Trend Report Patterson and McCall MOUNTAIN GOAT STATUS AND TREND REPORT: REGION 2 Chelan County TOM MCCALL, Wildlife Biologist BEAU PATTERSON, District Wildlife Biologist Population objectives and guidelines The management objective for Chelan County mountain goats is to maintain self-sustaining goat populations in historic ranges and recreational hunting opportunities. The herd productivity goal is 25 kids: 100 adults, and harvest opportunity is only considered for stable or increasing populations exceeding 50 adults and meeting the productivity goal. For goat populations meeting or exceeding these guidelines, harvest is limited to no more than 4% of the observed adult population. Hunting Seasons and Harvest Trends Until 2001, no goat harvest had occurred in Chelan County in over 20 years. In 2001, 2 permits were authorized for the north shore of Lake Chelan, and 2 male goats were harvested (Table 1). One permit was authorized for each of the 2002, 2003, and 2005 seasons, but no goats were harvested. One permit was awarded in 2004, and a male goat was taken. Surveys Two survey methods have been used to monitor mountain goat populations in Chelan County, in addition to incidental observations. As part of a hydropower license agreement, the Chelan Public Utility District (PUD) annually completes 12 winter wildlife surveys by boat on Lake Chelan (Chelan County s largest contiguous mountain goat habitat). For Lake Chelan, the total number of known goats is the result of comparing all surveys completed during each winter. This is the only consistently collected, long-term data for Chelan County goats. In other areas of Chelan County, helicopter surveys have been used in recent years in selected mountain goat areas. Because of difficult terrain and low population densities, mountain goats are expensive to monitor. Population objectives have been established for each geographic mountain goat area within the Wenatchee District, but are rarely attained (Table 2). Population Status And Trend Analysis Mountain goat populations in Chelan County appear to be below historic levels of the 1960s to 1980s. Except for the Lake Chelan population, mountain goats are not monitored closely enough in the Chelan County to document population trends. Based on limited surveys since 1996, the Chelan County goat population appears stable to declining (Table 2). In July 2004, two adult nannies were collared in the District and one in January 2004, as part of a statewide goat research project. One nanny was collared on Nason Ridge, one in the headwaters of Graham Harbor Creek on the south shore of Lake Chelan, and one along Point-No-Point Creek on the north shore. In the last year all goats have concentrated their activity in 4-5 mi 2 areas near their capture locations. The Nason Ridge nanny spent all of her time on the Ridge during the last year. The Graham Harbor nanny has ranged between Graham Harbor, Graham Mountain, and Pyramid Mountain. The Point-No-Point nanny has been in the vicinity of Point-No-Point Creek, Little Goat Mountain, and Safety Harbor Creek. Two other nannies that were collared on Gamma Ridge on Glacier Peak have since traveled miles east to the south shore of Lake Chelan. During last winter, one was near Pinnacle Peak and the other near Bonanza Peak. This is the first time we have documented that the Wenatchee District and Region 4 share goats between areas. In fall 2006, 3 goats that were collared on Gamma Ridge were found east in Chelan County. The current Lake Chelan goat population is considerably less than the estimated 500 goats in the area in the 1960s. The Lake Chelan populations have been closely monitored by the Chelan PUD for the past 20 years. There is no apparent trend in this population since 1994 (Table 3). Kid:adult ratios are below productivity goals of 25 kids:100 adults, averaging 22:100 since The kid:adult ratio in 2005 was 24:100, compared to the average of 21 kids observed per year between During the Chelan PUD estimated the north shore population at 94 goats (range:72-118), with 19 kids:100 adults (range: 16-23). The south shore population was estimated at an average of 54 goats (range: 49-57), with 28 kids:100 adults (range:27-29). The north and south shores of Lake Chelan were flown two times (Jun, Jul) during summer 2005, as part of the development of a sightability model for mountain goats. Based on the average of June and July counts in survey blocks done during both months in 2005, an estimated 76 goats were on the north shore 106
107 Mountain Goat Status and Trend Report Patterson and McCall and 66 goats on the south shore using a preliminary model. Statewide mountain goat strategies recommend that before a population is hunted that the population be at least 50 goats with at least 25 kids:100 adults over a 3-year period. During the south shore Lake Chelan population was estimated at an average of 54 goats (range: 49-57) with 28 kids:100 adults (range:27-29) using Chelan PUD s data. Based on these criteria, a permit could be issued for the South Shore. An estimated 66 goats were found on the south shore in 2005 using the sightability model. Because the south shore population is small, it is vulnerable to stochastic weather events that could cause it to decline. This population should continue to be surveyed annually to ensure population and production objectives are met. The North Shore Lake Chelan, currently hunted under a single permit, wintered at least 91 goats based on Chelan PUD winter surveys. However, observed kid: non-kid ratios have only averaged 19:100, below the 25:100 threshold for hunting harvest; and the three year success rate of 33% is also below the minimum 50% threshold. Only one goat has been harvested the past 5 seasons, for 20% five year success rate. Including the first season when 2 hunters harvested two goats, the six-year success rate has been 50%. Despite this low kid ratio, and harvest success below management objective, goat counts have been relatively high, and harvest of 3 billies in six years from a population of at least 90 goats is extremely unlikely to be detrimental. During summer 2001, the Rex Creek fire on the north shore of Lake Chelan burned over 40,000 acres, including approximately 50% of the goat winter range. This fire profoundly changed nearly all goat winter range on the north shore, and may impact this population; whether positively or negatively remains to be seen. Habitat Condition And Trend Fire suppression during the last 50 years has probably decreased habitat for mountain goats in Chelan County. Most mountain goat habitat is within wilderness areas and is managed by Wenatchee National Forest. Wilderness designation precludes most forms of habitat management. A let-burn policy is currently in place for wilderness areas on the Wenatchee National Forest, except where it threatens homes, so habitat changes will probably occur slowly. Goat habitat conditions are expected to gradually improve as a result of this policy. Management Conclusions Mountain goat populations in Chelan County are below historic and objective levels. Population trends in areas besides Lake Chelan, which are surveyed by Chelan PUD, cannot be effectively monitored without additional survey resources. Based on the PUD data set, kid production is below objectives on the north shore and at objectives on the south shore. Table. 1. Summary of harvest information for mountain goats for north Lake Chelan, Year Permits Hunters Harvest Success Goats seen/hunter Days hunted Average days/kill Table 2. Mountain goat surveys in Chelan County, Area a Population objective N. Lake Chelan S. Lake Chelan Stehiekin Chiwawa N. Wenatchee River E. Stevens Total a Chiwawa = Chelan County north of Little Wenatchee River, east of Cascade Crest; East Stevens = North of highway 2, south of Little Wenatchee River (Nason Ridge); North Wenatchee River = West of highway 97, north Chelan/Kittitas county line, east of Cascade Crest, south of highway
108 Mountain Goat Status and Trend Report Patterson and McCall Table 3. Chelan PUD's mountain goat population composition for Lake Chelan, Chelan County, Year No. kids No. adults Unk. Total Count Kids:100 adults Average
109 Mountain Goat Status and Trend Report Bernatowicz MOUNTAIN GOAT STATUS AND TREND REPORT: REGION 2 Goat Units: 3-6/4-38, 3-7, 3-10, 3-11 JEFFREY A. BERNATOWICZ, District Wildlife Biologist Population Objectives/guidelines The statewide goals for Mountain Goats are: 1. Preserve, protect, perpetuate, and manage mountain goats and their habitats to ensure healthy, productive populations. 2. Manage mountain goats for a variety of recreational, educational and aesthetic purposes including hunting, scientific study, cultural and ceremonial uses by Native Americans, wildlife viewing and photography. 3. Enhance mountain goat populations and manage for sustained yield. 4. For populations to be hunted, a minimum of 50 goats and 25 kids:100 non-kids over a 3-year period. 5. Harvest should not exceed 4% of a stable population. Hunting Seasons And Harvest Trends Mountain Goat season is open only to hunters drawing a special permit. In 2005, there were 6 permits spread over 3 units open to hunting (Tables 1-4). The raffle permit holder also hunted the region. Al1 permit holders who reported were successful. Surveys Tables 1-4 show annual survey results for Goat units. Kachess is not open to hunting and was not surveyed in Historically goat surveys were conducted in June and/or September. September surveys tended to yield the higher counts, but conflict with other surveys and hunting seasons. Years with the lowest counts were typically June surveys. In 2005, all surveys were flown in late June.. Population Status And Trend Analysis The status of mountain goat populations is difficult to determine. Surveys techniques have not been tested for accuracy or precision. Survey timing, area and technique within the region haven t been consistent enough to allow for meaningful trend analysis. The visibility of goats is an unknown. The data suggests individual groups are often missed on some surveys. The best we can do is guess at trends from the available data and interviews with hunters, guides, and others people knowledgeable on goats. All goat populations in the Region appear to have declined from historic levels due to over harvest. An extremely light snow pack during the winter of may have increased kid production in The kids seemed to have carried over into 2006 with 2 of 3 units having 10-year high counts for adults. Research suggests harvesting no more than 4% of the adult population. Harvest in the Bumping from average over 6 goats annually. A similar harvest was evident in the 1980 s. The high count for adults was 66, for an estimated harvest of 10%. Since 1997, harvest has been more conservative and the population maybe recovering. The unit is large with extensive habitat and cover. It is easy to miss entire groups of animals on a survey has happened in 2004 and The total population in the survey area is estimated at approximately 100 goats. Historically, the Naches and Corral Pass areas were managed as different units even though large numbers of goats were observed near the boundary. Corral Pass was rarely surveyed as a unit and Naches Pass surveys frequently included goats on the Corral Pass side. A sustainable harvest in Naches/Corral Pass during the 1990 s would have required an adult population of at least 200; the current estimate is less than 70. Harvest has likely impacted the population and only recently been reduced. The high kid production in 2004 seemed to help the adult population rebound. Blazed ridge was historically included with Naches Pass as a unit. In 1996, permits were used for the new Blazed Ridge unit. Over-harvested was likely in the unit until Historic records indicate it was not unusual to issue 40 permits for the area. The high count in 1997 was due to a large group of goats that was possibly passing through the unit, as they have not been seen since. Weather prohibited surveys in 2005, but 2006 counts indicate high recruitment. Unfortunately, there was confusion on groups in 2006 and a double count was expected, so an actual estimate is not it available. Kachess Ridge was historically surveyed with Davis and Goat peak units. Thirty-two goats were taken from the area from , which is more adults than have been seen in the last 10 years. Surveys in 2004 and 2005 excluded Davis and Goat Peaks, which have few animals. The current population for the entire area is probably less than 50 animals. Habitat Condition And Trend The majority of goats in the Bumping, Tieton and Naches Pass summer in Wilderness Areas where short- 109
110 Mountain Goat Status and Trend Report Bernatowicz term habitat is mostly influenced by weather cycles. However, the fire suppression has probably reduced open meadow habitat in wilderness areas. Recent insect outbreaks have killed timber, making the area prime for a large fire. Recreational use could also be influencing use of available habitat. There is no comprehensive documentation of where the Wilderness goats winter. Outside the wilderness, timber harvest and road building could impact habitat. The Blazed Ridge and Kachess Units are mostly outside of wilderness areas. Timber harvest has/is occurring in both units. The north portion of the Blazed ridge unit has been particularly heavily harvested. The timber cutting has probably improved summer habitat, but may have removed winter cover. Roads densities have also increased. There are often roads at the top and bottom of every ridge. ORV and general recreation is heavy in the Blazed Ridge Unit. It is unknown how goats react to roads and human activity, which have increased with Washington s population. Major highways like I-90 have probably limited movements between herds over time. Smaller highways and development like ski areas could also limit movement and use of areas. This may limit recolonization and recovery of some areas. Management Conclusions Goat populations in Region 3 have probably declined over historical levels. Over-harvest appears to be a major factor. Harvest has only recently reduced. Recovery may take decades. Determining if the current population level and if it is stable and healthy is difficult. Future harvest should be conservative with no permits unless the unit is surveyed. Ideally, goats should be radioed to determine movements, population size, and critical habitat such as winter range. Boundaries of existing herds need to be reviewed to determine realistic populations. Current resources for surveys are limited. Options for collecting better quality data need to be explored. 110
111 Mountain Goat Status and Trend Report Bernatowicz Table 1. Harvest and surveys for goat Unit 3-7 Bumping River Harvest Information Survey Data Year Permits Hunters Harvest Kids Adults Total K: Table 2. Harvest and surveysfor goat Unit 3-6,4-38 Naches/Corral Pass Harvest Information *Survey Data Year Permits Hunters Harvest Kids Adults Total K: >7 > (18) 22 (62) 36 (80) 55 (29) * Mostly Naches Pass Data ( ) September survey 111
112 Mountain Goat Status and Trend Report Bernatowicz Table 3. Harvest and surveys for goat Unit 3-10 Blazed Ridge Harvest Information Survey Data Year Permits Hunters Harvest Kids Adults Total K: NO DATA *3 * *2 * *3 * NO DATA a 30 a 83 a * Includes auction/raffle permit hunter a Probable double count of ~15 animals Table 4. Harvest and surveys for goat Unit 3-11 Kachess Ridge Harvest Information Survey Data Year Permits Hunters Harvest Kids Adults Total K: NO DATA No Survey
113 Mountain Goat Status and Trend Report Miller and Woodin MOUNTAIN GOAT STATUS AND TREND REPORT: REGION 5 Goat Rocks, Smith Creek, Tatoosh PATRICK J. MILLER, District Wildlife Biologist ROBIN S. WOODIN, Wildlife Biologist Population Objectives/guidelines Mountain goats (Oreamnos americanus) are prized in Washington as both a game animal and for viewing purposes. Region 5 of the Washington Department of Fish and Wildlife (WDFW) has three mountain goat population management units; Tatoosh (Goat Unit 5-2), Smith Creek (Goat Unit 5-3), and Goat Rocks (Goat Unit 5-4). In 2003 the management of the Goat Unit Tieton River 3-9 was combined with the Goat Rocks unit. The Goat Rocks-Tieton River unit probably has the highest goat population in the state of Washington. Hunting in all three units is allowed by permit only. Current population goals for these three areas are to maintain or expand current population levels. A productivity goal of kids per 100 adults is applied to these populations. Legal harvest levels are designed to remove 4% or less of the population. Hunting Seasons And Harvest Trends Since 1997, all three units in Region 5 have been open to any legal weapon. Prior to 1997, Smith Creek Unit was an archery-only unit. Harvest quotas were conservative in 2005: Smith Creek, 1; Tatoosh, 1; and Goat Rocks-Tieton River, 6. Hunting seasons in all three units have traditionally been the last two weeks of September and the entire month of October. In 2005 the season opened on 1 September for archery-only hunting. Firearm hunting was allowed from 15 September-31 October. The bag limit was one goat per permit, of either sex, with horns longer than 4 inches. Hunting pressure in each unit is limited by the conservative nature of the permit allocations. Harvest trends, hunter success rates, and hunter survey returns indicate stable mountain goat populations in the three units. Aerial surveys conducted by WDFW indicate that mountain goat populations in the Tatoosh and Smith units may be declining (See Surveys below). Most of the goats observed in the Tatoosh unit are actually in the nearby Mt Rainier National Park. Visibility of goats in the Smith creek unit has long been a concern as the habitat is narrow strips of alpine vegetation with heavy forest nearby. Prior concern over low recruitment or increasing adult mortality in the Goat Rocks Unit led to a reduction in permits from 10 to 7 in The permit levels for Goat Rocks were combined with Tieton River in Permit levels were reduced by 1 in 2003 to allow for potential raffle or auction hunter harvest outside the permit process. Concerns over lower hunter success combined with habitat loss in the Smith Creek Unit supported the decision to reduce the permits in this unit from 3 to 1 in Weather conditions in 2005 were moderate for goat hunting. Periods of warm dry weather during the early weeks of September made hunting difficult, particularly for those hunters in the Tatoosh Unit. The majority of animals in Tatoosh available for harvest migrate out of Mount Rainier National Park with the onset of snow at the higher elevations. Warm weather tends to delay this movement. Weather conditions moderated as September progressed, and cooler weather prevailed during most of October. Harvest in Goat Rocks was distributed throughout the first month of the >any weapon= season. Overall, hunter success in 2005 was slightly up from the previous two years (Table 1). Historically, success rates in the Goat Rocks Unit approach 100% and this was the case in This unit contains extensive, high quality habitat, has the highest goat numbers, and is comprised of resident animals. Success rates in Goat Rocks since 1993 appear stable. The number of goats seen by hunters is also stable. Since 1993 success rates in Tatoosh have also been stable. The single hunter in the unit in 2005 did not harvest a goat. Goat sightings per hunter are mixed, though many sightings are from areas north of the hunt unit boundary, in Mount Rainier National Park. Goat hunting was initiated in the Smith Creek Unit in 1993, following augmentation and recovery of the population. The endemic goat population was nearly extirpated due to over-exploitation facilitated by easy hunter access and the patchy distribution and lower quality of goat habitat in the unit. In 1993 hunting was archery-only. Permit allocation was conservative (n=3) for the first few of years of hunting. Overall harvest was acceptably low and population response was favorable. Subsequently, permits were increased to 5 in The change in 1997 to any weapon resulted in a return to 3 permits. The number of goats seen, however, has been declining. As a result, in 2001 the permit number was decreased to one. The single permit holder in 2005 reported killing a goat. Surveys Recently survey coverage has expanded to include all three Mt Goat Units in Region V. Part of this expanded coverage is a portion of a Mt Goat study that is being conducted by WDFW. Funding for these surveys is coming from a variety of sources and may fall to a lower level when the present study is complete. One of the study objectives is to estimate sightabilty of goats during aerial surveys. Concern has long been expressed over the portion of the goat population that is observed during a flight and hopefully this study will begin to answer that question. In 2005, all areas of goat habitat in the Goat Rocks- Tieton River unit were surveyed on the same day. The goal was to provide more thorough coverage of the combined units. 113
114 Mountain Goat Status and Trend Report Miller and Woodin Population Status And Trend Analysis Goat populations in Tatoosh seem to be low. In the surveys during all the goats observed were in the National Park. Permit levels will be maintained at 1 to continue survey funding. Populations in Smith Creek are also low and becoming a concern to managers. This population may require greater scrutiny in the future with continued sightability flight methodologies to estimate population size. The number of kids seen by hunters increased this year as reported by the hunter questionnaire. Aerial survey results from 2005 were higher than recent observations, but that may be due to the increased survey effort associated with the goat study and sightabilty estimate work. Population status in the Goat Rocks is hopefully on the increase. Survey data from 2004 and 2005 indicate an increased number of goats, even when the Tieton River unit influence is incorporated. The 2004 and 2005 survey numbers were much higher than the past few years. Knowledge of the movement between the Goat Rocks unit and Tieton still must be factored in. Based upon studies conducted in other mountain goat habitats, we are observing between 59% and 75% of the total population in the July or August aerial surveys. Results of the cooperative Cispus AMA study with the USFS indicate that goat populations are expanding in several areas of the Region. Sightings of goats are becoming common around the Mt. St. Helens area, and the north-south ridge systems south of the Cispus River contain good numbers of goats (see Management Conclusions below). Sightings of ear-tagged Smith Creek transplants in the Mt. Adams Wilderness indicate that goats are likely expanding their range. Informal surveys are also observing goats in areas to the south and west of Smith Creek. Long-term changes in habitat (see Habitat Condition below), particularly in the Smith Creek Unit, may limit certain goat populations in the future. Habitat Condition And Trend High elevation openings characteristic of goat habitat are being lost in the Smith Creek Unit due to conifer encroachment. Alpine meadows are critical mountain goat foraging areas. Given the limited extent of suitable goat habitat in the Smith Creek Unit, their decline represents a serious threat to the sustained viability of this goat population. Results of the cooperative Cispus AMA project indicate that in the four study areas (Stonewall ridge, South Point ridge, Smith ridge, and Castle Butte), a total of 404 acres of alpine meadow have been lost in the period (Kogut 1996). The documented loss of alpine meadow in the study area equals a 20.8% decrease. Of the 1540 acres of alpine meadow present now in the study area, only 311 acres (20.2%)have low conifer intrusion. The remaining alpine meadows have moderate (53.8%) and high (26.0%) levels of conifer intrusion. Meadows with high to moderate conifer intrusion can be expected to become unsuitable for goats within 35 years. Avalanche chutes comprise an additional 1047 acres of marginal goat habitat (Kogut 1996). High alpine meadows are thought to be primarily created through disturbance such as avalanche, disease, wind-throw, and fire (Hemstrom 1979). Periodic fire is considered to be one of the most important factors in the creation and maintenance of alpine meadow (Olmsted 1979). United States Forest Service policy currently dictates the suppression of both man-made and naturally occurring fires. This policy has probably resulted in the losses of alpine meadow documented in the above study. In the 10 years since the completion of this study, the loss of meadow has likely increased. Increasing use of high elevation meadows by elk is another concern. Elk are typically observed using high elevation meadows adjacent to goats. Elk use will further degrade these habitats for goats, and may even preclude goat use. Any inter-specific competition that occurs in the alpine meadows will favor elk. Thus, the need for restoration and preservation of these areas is paramount to continued healthy goat populations. Habitat Enhancement Continued budget cuts and other constraints in both the USFS and WDFW make the possibility of a prescribed burn program in the foreseeable future unlikely. Presently, it does not appear that habitat is limiting goats, however, enhancement will have to be pursued in the next decade, as more and more habitat in the Smith Creek Unit is lost to conifer encroachment. Another possible avenue to address conifer encroachment is through the use of girdling and snag creation. Informal discussions concerning snag creation have occurred, and hopefully more formal discussions will transpire in the near future. Management Conclusions All three mountain goat units in Region 5 are valued for both viewing and hunting opportunities. Consequently, harvest quotas are kept conservative to maximize both the consumptive and non-consumptive recreational attributes of these populations. Permit levels for the Tatoosh have been reduced to a minimum level to encourage expansion of the goat population. Research is needed to develop population estimates and models for the goat populations in Region 5. A study initiated in 2002 is beginning to address these needs in Smith Creek and Goat Rocks/Tieton River. The continuation of annual aerial surveys is needed to document trends in population and productivity Without a population estimate, attainment of a harvest rate of <4% of the population is difficult to measure. Due to low inherent productivity and high mortality rates among 1 and 2 year olds, mountain goats (Festa-Bianchet and Urquhart 1994) are highly susceptible to over-harvest. Presently, our information about goat population dynamics is limited. Although hunter report cards provide information on demographic parameters, these data are highly variable. This is likely due to hunters observing and counting the same groups of goats repeatedly, variability of days spent hunting, some mis-classification, and lack of sampling independence. Aerial surveys provide the least biased data and the most efficient method of census, particularly considering the large expanse of area involved. 114
115 Mountain Goat Status and Trend Report Miller and Woodin Additionally, resource managers should identify important habitat linkages between Smith Creek and Goat Rocks and suitable isolated habitats such as Mt. Adams and Mt. St. Helens National Volcanic Monument. Geographic Information Systems (GIS) coverages could be used to identify suitable goat habitat within unsuitable matrix lands. Potential corridors between such areas could then be managed for goats. Based upon the results of the cooperative Cispus AMA study, alpine meadow restoration in the Smith Creek Unit is recommended. This will require USFS funding and environmental approvals. Augmentation/translocation Recommendations None are needed nor recommended. Literature Cited Adams, L. G., and J. A. Bailey Population dynamics of mountain goats in the Sawatch Range, Colorado. Journal of Wildlife Management 46: Brent, H Helicopter goat counts. Unpublished report, Washington Department of Game. Caughley, G Analysis of vertebrate populations. John Wiley & Sons, New York, N.Y. 234pp. Czaplewski, R. L., D. M. Crowe, and L. L. McDonald Sample sizes and confidence intervals for wildlife population ratios. Wildlife Society Bulletin 11:121_128. Festa-Bianchet, M, and M. Urquhart Mountain goat recruitment: kid production and survival to breeding age. Can. J. Zool. 72: Hemstrom, M. A A recent disturbance history of the forest ecosystems of Mount Rainier National Park. Ph. D. Thesis, Oregon State University, Corvallis, OR. 67 pp. Houston, D. B., B. B. Moorhead, and R. W. Olson An aerial census of mountain goats in the Olympic Mountain Range, Washington. Northwest Sci. 60: Kogut, T Trends in Natural Meadows within Mountain Goat Habitat, Cispus Adaptive Management Area. USFS Gifford Pinchot Nat. For. Unpublished Report. 9pp. Olmsted, J Mountain goat winter habitat study. Job completion report, W_88 R_3. Wash. Dept. Of Game, Olympia WA. 50 pp. McCullough, D. R., and D. H. Hirth Evaluation of the Petersen-Lincoln estimator for a white-tailed deer population. Journal of Wildlife Management 52:
116 Table 1. Hunter survey summary statistics for Region 5 mountain goat harvests, Unit Year Permits Harvest* Success(%) Avg goats Kid:Adult Avg days to issued seen seen harvest a goat Smith Creek (2) (2) (4) Goat Rocks ** 6** (6) (9) (9) Tatoosh (2) (2) (3) (4) (3) (4) * Numbers in ( )=s indicate number of hunters, if less than permits issued. ** Permits for both Goat Rocks and Tieton River were combined. 116
117 Table 2. Survey results of Mountain Goat flights, Goat Unit Adult Yearling Kid Unknown Total Kid:Adult 5-2 Tatoosh : : : : : : Smith Creek : : : : * : : : Goat Rocks 2005** : ** : ** : ** : : : : :100 * No survey in 2001 due to poor weather conditions. ** Survey combined Goat Rocks and Tieton River units 117
118 Bighorn Sheep 118
119 Bighorn Sheep Status and Trend Report Fowler and Wik BIGHORN SHEEP STATUS AND TREND REPORT: REGION 1 Blue Mountains PAT FOWLER, District Wildlife Biologist PAUK WIK, Wildlife Biologist Population objectives and guidelines The first bighorn sheep (Ovis canadensis) population was established on the W.T. Wooten Wildlife Area (Tucannon River) during the early 1960 s, and consisted of California bighorns transplanted from the Sinlahekin Wildlife Area. Since that re-introduction, four additional herds of bighorn sheep have been established in the Blue Mountains; Mountain View, Wenaha, Black Butte, and Asotin Creek herds. The first two herds consisted of California bighorn sheep (Tucannon, Mtn View), but subsequent transplants have consisted of Rocky Mtn bighorn sheep from Hall Mountain in Washington, herds in Montana, Wyoming, and from the Wallowa Mountains in Oregon. Very few California bighorns still exist in the Blue Mtns, because the spread of scabies (Psoroptes ovis) into the Mountain View and Tucannon herds during the late 1980 s and 1990 s resulted in a massive die-off of California bighorns. Currently, herds in the Blue Mtns consist primarily of Rocky Mountain bighorn sheep. Population management objectives for each herd are based on habitat conditions within the herd range of each population. The overall population objective for the Blue Mountains is bighorn sheep; Tucannon herd-60, Mountain View herd-60-70, Asotin Creek herd , Black Butte herd , Wenaha herd >90. The Hells Canyon Initiative (HCI) was established in 1996, and participants include the Washington Department of Fish & Wildlife, Idaho Department of Fish and Game, Oregon Department of Fish and Wildlife, U.S. Forest Service, Bureau of Land Management, Nez Perce Tribe (NPT), and Foundation for North American Wild Sheep (FNAWS). HCI conducts disease research, develops population survey methodology, conducts transplants, and implements projects designed to improve bighorn sheep habitat. Four of Washington s bighorn sheep populations are included in HCI; Black Butte, Mtn. View, Wenaha, and Asotin Creek.. Hunting seasons and harvest trends Permit controlled hunting was terminated in the Blue Mountains after the Pasturella die-off in 1996, with the exception of the Tucannon herd. Permits were terminated in the Tucannon in 1999, after this herd suffered a major population decline. One raffle permit per year was authorized by the Fish & Wildlife Commission in 2005 to fund bighorn sheep programs and research in southeast Washington. Table 1. Bighorn Sheep Population Trend and Herd Composition, Blue Mountains [( ) indicates number of Class-4 rams in > 3\4 segment]. Rams Count Population Per 100 Ewes Year Lambs Ewes Y1 < 3\4 > 3\4 Total Total Estimate R:100:L (14) :100: (8) :100: (3) (7) :100: (7) :100: (5) :100: (5) :100: (5) :100: (7) :100: (7) :100: (6) :100: (17) :100: (3) 53* :100:39 *Rams were not classified within the Wenaha herd, only total number seen is given. Survey was conducted by ODFW in Wenaha. 119
120 Bighorn Sheep Status and Trend Report Fowler and Wik Biologists decide each year which units will be open for hunting by the permit holder. In 2005, the Tucannon, Black Butte, and Wenaha were available. The raffle permit holder harvested a mature ram from the Tucannon herd that scored 187 BC points. In 2006, Black Butte, Mountain View, and Wenaha units opened to the raffle permit holder. Also in 2006, WDFW will issue the first permit to a licensed hunter in the Wenaha herd since This permit will be good for 1 ram in the Crooked Creek drainage of the Wenaha GMU (169). General hunt permits will not be implemented in other herds until each bighorn sheep population meets criteria established in the Bighorn Sheep Management Plan. Treaty hunting by the Nez Perce tribe has been unregulated and resulted in the loss of three Class-4 rams from the Asotin herd in 2002, and 6 rams total over the last 4 years. Permit controlled hunting has never been authorized in the Asotin herd, because it has not met the criteria necessary to establish a hunting season. Information gathered while investigating the treaty kills revealed that some tribal members had been harvesting bighorn sheep from the Asotin herd for several years, both ewes and rams. Since the NPT does not regulate or monitor harvest, these losses should be considered the minimum number taken by tribal members. In 2003, the NPT Wildlife Committee recommended closing the Washington portion of their treaty area to bighorn sheep hunting by tribal members, which is a major step forward in tribal cooperation. Only one unregulated harvest was documented since 2004, an ewe in Asotin Creek. Surveys Aerial surveys are conducted in March using a sightability model currently being developed through the Hells Canyon Initiative. These surveys are conducted in conjunction with annual post-season elk surveys in order to determine population trend and herd composition at the low point of the annual population cycle. Radio telemetry locations are obtained frequently throughout the year by foot and/or aircraft, supplementing the March helicopter surveys. Surveys conducted for the five herds in early 2006 resulted in a count of 198 bighorn sheep, 104 ewes, 41 lambs, 53 rams for a ratio of 51 rams and 39 lambs per 100 ewes (Table 1.). A population estimate from modeling has not been developed for 2006 at this time, but biologists estimate that there are approximately bighorns in the 5 herds.. Population status and trend analysis Lamb survival has been a major problem since the Pasturella die-off in 1996, with lamb survival varying greatly between years lamb productivity in the Black Butte, Mountain View, Wenaha, and Asotin herds increased with lamb ratios of 16, 63, 43, and 38 lambs/100 ewes, respectively. The School Fire burned all of the bighorn sheep range in the Tucannon, and there were 7 confirmed mortalities directly resulting from the fire (1 ram, 6 ewes). During March surveys, only 5 bighorn sheep were observed in the Tucannon (5 ewes, 1 lamb). Although the rams have not been observed, it is estimated the Tucannon herd holds 3-4 rams. Individual herds should be able to increase in numbers if lamb production and survival stays above 30 lambs/100 ewes for several years. The ram population suffered very high mortality during the Pasturella die-off in , which resulted in few adult rams in the population for several years. Low lamb survival resulted in poor recruitment of rams into the population. The number of Class-4 rams in the population is increasing slowly, but still remains substantially below the number that existed before the die-off (Table 1). During the summer of 2006, Pasturella pneumonia again resulted in high mortality of lambs in the Black Butte herd. Mountain View, Wenaha, and Asotin Creek herds have shown no evidence of pneumonia occurring in the lambs this year. The Asotin Creek herd has never had a recorded case of Pasturella. The Tucannon herd is at an all time low since 1975 (beginning of data). This population will not rebound in the near future without a supplemental transplant. In August, 2005, the School Fire consumed 49,515 acres in the Tucannon drainage, including the entire range of this herd. With the loss of at least 7 adult sheep, a supplemental transplant will be scheduled to occur as soon as feasible. The rebuilding of the elk fence along the northern boundary of the L.T. Wooten Wildlife Area is necessary before additional sheep can be released. The elk fence keeps the sheep from moving north onto private land where they may come in contact with domestic sheep or goats. Habitat condition and trend Habitat conditions are moderate to good in most areas. However, the spread of noxious weeds, mostly yellow starthistle (Centaurea solstitialis) and rush skeleton weed (Chondrilla juncea) is threatening herds in the Snake River and Grande Ronde River drainages. It is too early to determine the impact of the School Fire on the Tucannon range, but it is expected to exacerbate the noxious weed problem over the next 2 3 years without intervention. It will be necessary to implement an aggressive weed control program on the Wooten WA in order to prevent the expansion of noxious weeds. 120
121 Bighorn Sheep Status and Trend Report Fowler and Wik Disease and parasites Pasturella continues to plague three bighorn populations; Black Butte, Wenaha, Mtn. View. The Asotin and Tucannon herds have escaped Pasturella pneumonia, but do suffer from scabies (Psoroptes ovis). Bighorn populations in the Blue Mtns. have not recovered from the Pasturella die-off as quickly as most herds, possibly from the constant re-infection from domestic sheep that exist within the range of the Black Butte herd. The presence of domestic sheep and goats within and adjacent to bighorn sheep range presents a constant and substantial risk of another major Pasturella epizootic. Fortunately, in July 2006, FNAWS reached an agreement with one landowner and 200+ domestic sheep were removed from Joseph Creek. Other government agencies have encouraged landowners to use domestic goats for weed control. This type of weed control program presents a substantial risk to bighorn sheep populations in southeast Washington. Scabies continues to be a problem in all five herds. The Tucannon herd was decimated by a major die-off caused by scabies when it was infected in Management conclusions Three of the five bighorn sheep herds in the Blue Mountains are having difficulty recovering from the Pasturella die-off that occurred in The Black Butte, Wenaha, and Mtn. View herds are still plagued by periodic pneumonia outbreaks, which result in high lamb mortality. The Tucannon herd escaped the Pasturella out-break, but suffered a major die-off after being infected with scabies in This herd will not recover without a supplemental transplant. The Asotin Creek herd was not infected by the Pasturella outbreak, but has suffered adult mortality due to unregulated tribal hunting. Each herd suffers from various problems that result in mortality of adults and lambs. These mortality factors limit the ability of individual herds to reach the population management objective. Domestic sheep and goats continue to be a major problem for bighorn sheep populations in the Blue Mtns. Some rural landowners are using domestic sheep and goats to control weeds. This practice poses a severe threat to the Black Butte and Asotin bighorn populations, which are closest to rural populations. Two young rams were lethally removed from the Black Butte herd during the summer of 2005, because they came in contact with domestic sheep at a rural residence. Once wandering bighorns have come in contact with domestic sheep/goats, they cannot be allowed to return to the main herd, because the risk of a major Pasturella outbreak is too high. The Hells Canyon Initiative has updated an informational pamphlet for landowners in 2006, which spells out the risks of contact between domestic sheep/goats and bighorn sheep. Unless rural residents can be discouraged from acquiring domestic sheep and goats, or provide pens that prevent contact between domestics and bighorn sheep, the risk of another Pasturella outbreak in the bighorn population is very high. Four of the five bighorn sheep herds do not meet the criteria listed in the Bighorn Sheep Management Plan for establishing hunting opportunity on a herd by herd basis. The Wenaha herd meets the criteria for a hunting season, and one public permit was issued in One raffle permit is also issued in the Blue Mtns. and the funds are used for bighorn sheep management. 121
122 Bighorn Sheep Status and Trend Report Fowler and Wik Table 2. Asotin herd population trend and composition counts, , Blue Mtns., Washington. Rams Count Population Year Lambs Ewes Yr. < 3/4 > 3/4 Total Total Estimate Per 100 Ewes :100: :100: (1) :100: (1) :100: (1) :100: (2) :100: (1) :100: (2) :100: (1) :100: (1) :100: (0) :100: (0) :100: (1) :100:38 ( ) number of class-4 rams in > ¾ group. Table 3. Black Butte herd population trend and composition counts, , Blue Mtns., Washington. Rams Count Population Year Lambs Ewes Yr. < 3/4 > 3/4 Total Total Estimate Per 100 Ewes :100: :100: :100: :100: :100: :100: :100: :100: :100: :100: :100: :100: (8) :100: (9) :100: (2) :100: (7) :100: (7) :100: (8) :100: (1) :100: :100: (2) :100: (2) :100: (1) :100: (2) :100: (2) :100: (1) :100: (1) :100: (1) :100: (2) :100: (1) :100:16 122
123 Bighorn Sheep Status and Trend Report Fowler and Wik Table 4. Mountain View herd population trend and composition counts, , Blue Mtns., Washington. Rams Count Population Year Lambs Ewes Yr. < 3/4 > 3/4 Total Total Estimate Per 100 Ewes :100: :100: :100: :100: :100: :100: :100: :100: :100: :100: :100: :100: :100: :100: (2) :100: (1) :100: (4) :100: (4) :100: (4) :100: (4) :100: (2) :100: :100: (1) :100: (1) :100: :100: :100: :100: :100: (1) :100: (1) :100: (1) :100: (1) :100:63 123
124 Bighorn Sheep Status and Trend Report Fowler and Wik Table 5. Tucannon herd population trend and composition counts, , Blue Mtns., Washington. Rams Count Population Year Lambs Ewes Yr. < 3/4 > 3/4 Total Total Estimate Per 100 Ewes :100: :100: :100: :100: :100: :100: :100: :100: :100: :100: :100: :100: :100: :100: (5) :100: (5) :100: (4) :100: (2) :100: (2) :100: (1) :100: (2) :100: (3) :100: (2) :100: (2) :100: (1) :100: (1) :100: (2) :100: (1) :100: (2) :100: (2) :100: :---:-- 124
125 Bighorn Sheep Status and Trend Report Fowler and Wik Table 6. Wenaha herd population trend and composition counts, , Blue Mtns., Washington. Rams Count Population Year Lambs Ewes Yr. < 3/4 > 3/4 Total Total Estimate Per 100 Ewes :100: :100: :100: :100: :100: :100: :100: (7) :100: :100: :100: :100: :100: (4) :100: :100: :100: (1) :100: :100: (1) :100: :100: (3) :100: (3) :100: (2) :100: (12) :100: :100:43 125
126 Bighorn Sheep Status and Trend Report Zender and Base BIGHORN SHEEP STATUS AND TREND REPORT: REGION 1 Hall Mountain STEVE ZENDER, District Wildlife Biologist DANA L. BASE, Associate Wildlife Biologist Population objectives and guidelines Rocky Mountain Bighorn Sheep were introduced to Hall Mountain from Alberta, Canada in 1972 (Johnson 1983). The objective is to maintain a population of Rocky Mountain Bighorn Sheep within the Hall Mountain Herd. Herd composition objectives stipulate a lamb to ewe and ram to ewe ratio each of at least 50:100. The Hall Mountain Herd is not currently hunted; however, it appears some form of limited-entry hunting could be evaluated and considered in the near future. In the past this population has been used as a primary source for transplants of Rocky Mountain Bighorn Sheep to other parts of the state. Surveys From the early 1970s through the year 2002, ground surveys at the Noisy Creek winter-feeding station were carried out to estimate the total number of sheep, sex ratio, and lamb production (Table 1). During the summer of 2003 the winter-feeding station was dismantled and no feeding occurred from then on. Reconnaissance of the feeding site vicinity was made the first winter, , to assess reaction of the sheep to the loss of the feed source. Few sheep were observed. A reconnaissance survey accomplished the following year on January 6, 2005 documented 27 bighorn sheep at the old feeder site. As these sheep are replaced by their progeny, however, we expect the herd to lose its corporate memory of winter-feeding, and become less likely to virtually camp out at the old feeder site. Indeed sheep were not observed at the old feeder site last winter, A population of bighorn sheep pioneered by the Hall Mountain Population has existed in British Columbia since about In the summer the Canadian sheep occasionally mix with the Hall Mountain Herd. The Canadian bighorn sheep have also been surveyed by citizens there each year since at least 1998 at a winterfeeding station near Canada Highway 3. Count totals at this feeder on January 13, 2006 included 10 lambs, 20 ewes, and 9 rams for a lamb/ewe/ram ratio of 50 L : 100 E : 45 R (DeGroot, pers. comm. 2006). The U.S. Forest Service (USFS: Sullivan Lake Ranger District, Colville National Forest) regularly monitored survival and movements of a number of Bighorn Sheep from the Hall Mountain Herd by radio telemetry from 1995 through 1999 (Baldwin 1999, Aluzas 1997, and Bertram 1996). Since the year 2000 radio-tracking has been accomplished only intermittently by USFS and WDFW personnel. The latest radiotracking was accomplished from the Sullivan Lake Road at the south end of Sullivan Lake on March 20, A radio signal was received from only 1 ewe (Table 2). All of the radio collars have been deployed for well over 5 years. Consequently, we suspect that batteries on the other radio-collared sheep are now too old and depleted to transmit signals. Of the 21 total bighorn sheep that were fitted with radio transmitters beginning in December of 1995, there have been 13 confirmed mortalities to date. These mortalities included 7 rams and 6 ewes. Three other radio-collared sheep are of unknown status as radio contact has been lost since the year 2000 and 2 of the 3 had no ear tags. Of the remaining 5 radio-collared sheep, 2 were observed at the Canada Highway 3 Feeder as recently as March of The other 3 have been monitored by radio telemetry as recently as January and April of 2005 for 2, and March of 2006 for the third (Table 2). On April 15, 2005 we accomplished a helicopter survey of Hall Mountain and observed 21 bighorn sheep including 4 rams, 10 ewes and 7 lambs. We hope to intensify helicopter survey efforts of this population in the next few years as the herd numbers appear to be near a level that would afford limited hunting. Population status and trend analysis In the winter of , we were only able to formulate a composite classification count of these bighorn sheep by two ground-based surveys along with incidental sheep sightings. There were 19 sheep observed including 7 rams, 7 ewes, and 5 lambs. Given the 27 total sheep counted post-winter 2005, including 7 lambs; and the minimum of 5 lambs noted from groundbased observations during the winter, the population likely has grown beyond 30 total sheep. In recent winters the survival of lambs at Hall Mountain and the split-off herd near Canada Highway 3 has been excellent. This meta-population has apparently recruited about 13 lambs from 2004 to 2005 and another 15 lambs from 2005 to This is in contrast to the peak mortality crisis year of 2002 when zero lambs survived 126
127 Bighorn Sheep Status and Trend Report Zender and Base predation by cougar at the Noisy Creek feeder and only 5 symptomatic of such a bottleneck for the sheep herd. Table 1. Population composition counts of Hall Mountain Bighorn Sheep since herd establishment in 1972 to (Note that the last year of winter feeding was in Also, subsequent to the original release of 18 sheep in 1972, there has been only one additional introduction, which was of two adult ewes in There have been 85 sheep trans-located out of this population over 9 separate years. In addition, some sheep from this population broke off from the Hall Mountain Herd and established a new population in the Kootenay Pass area of British Columbia, Canada in about 1982). Count Number Trans-located Ratio YEAR Lambs Ewes Rams Total Lambs Ewes Rams Lambs:100 Ewes:Rams : 100 : No Data No Data No Data No Data No Data No Data No Data 19 No Data No Data No Data 22 No Data : 100 : No Data No Data No Data No Data No Data : 100 : No Data No Data 27 No Data : 100 : : 100 : : 100 : : 100 : : 100 : : 100 : : 100 : : 100 : : 100 : : 100 : : 100 : : 100 : : 100 : : 100 : : 100 : : 100 : : 100 : : 100 : : 100 : : 100 : : 100 : : 100 : : 100 : No Data No Data No Data No Data No Data 2004 No Data No Data No Data No Data No Data : 100 : : 100 : 71 lambs were counted early in the winter along Canada Highway 3. The status of the population is much improved at this time. Habitat condition and trend This part of the state is heavily forested and bighorn sheep depend upon the steep terrain and open grasslands on Hall Mountain and other scattered sub-alpine openings for forage and predator avoidance. Between Hall Mountain, Sullivan Mountain, Crowell Ridge, and Gypsy Ridge, non-forested escape terrain is limited and fragmented. Sheep migrating between these and other peaks and ridges have to go through dense forest where they may be highly vulnerable to predators including cougars and bears. A dead radio-collared ram recovered from the slopes of Sullivan Mountain in 2003 may be The U.S. Forest Service owns virtually all the bighorn sheep habitat. Consequently, there are no immediate threats to habitat quality and quantity. The U.S. Forest Service plans to continue to actively manage winter range habitat with controlled burns as the need and opportunity, including funding, arises. There are no domestic animals grazing on the portion of the national forest frequented by the bighorn sheep. Augmentation and translocation The last year that bighorn sheep were trans-located from Hall Mountain was in 1993 (Table 1). The feeder site at Noisy Creek afforded the ability to easily capture sheep for studies or trans-location. With the closure of the 127
128 Bighorn Sheep Status and Trend Report Zender and Base feeder site in 2003 the annual trapping activities ended. WDFW has no further plans to trap sheep at Hall Mountain at this time. Management conclusions Last winter was the third season since winter feeding operations were terminated. The bighorn sheep still largely winter at the south end of Sullivan Lake and on the lower slopes to Hall Mountain, but seem to spend less time now within the immediate vicinity of the old Noisy Creek Feeder Site. With the loss of our ability to reliably survey sheep at the feeder site each winter, we have had to develop new survey techniques and protocol. Ground-based surveys are time intensive and generally require several visits to obtain an accurate composite count. As the sheep disperse over a wider range for forage we are less likely to observe a high percentage of the herd. Expensive helicopter surveys will likely be necessary in the future. As the population has increased to a level near the parameters required to hunt, we plan to monitor the herd more closely. If the total count and Ram:Ewe:Lamb ratios are appropriate, we may consider a recommendation for some level of limited hunting opportunity. References Aluzas, K Bighorn Sheep radio-telemetry monitoring progress report # 2. Sullivan Lake Ranger District, Colville National Forest. Unpublished report. 10 p. Baldwin, T Bighorn Sheep radio-telemetry monitoring progress report # 4. Sullivan Lake Ranger District, Colville National Forest. Unpublished report. 5 p. Bertram, T.M Bighorn Sheep radio-telemetry Monitoring progress report # 1. Sullivan Lake Ranger District, Colville National Forest. Unpublished report. 4 p. DeGroot, L BC Environment, Fish and Wildlife Section. British Columbia, Canada. Personal communication. Johnson, R.L Mountain Goats and Mountain Sheep of Washington. Biol. Bull. No. 18. Wash. State Game Dept., Olympia. 196 p. Suarez, R.V Lake Basin Prescribed Burn. Sullivan Lake Ranger District, Colville National Forest. Rocky Mountain Elk Foundation Project Completion Report - Unpublished. 2 p. Washington Department of Fish and Wildlife Game Management Plan. Wash. Dept. Fish and Wildlife, Olympia, Wash. 136 p. 128
129 Bighorn Sheep Status and Trend Report Zender and Base Table 2. Radio-telemetry tracking of 21 bighorn sheep from Hall Mountain and their status as of the year Five of these bighorn sheep (see in italic font) are confirmed alive as recently as Ear Tag # Mo/Yr Sex Capture Radio-Tagged Age Status as of 2002 Orange 12 12/1995 M 10+ Mortality in July Yellow 28 12/1995 F 2.5 Last observed at Canada Hwy. 3 Feeder on 3/6/2006. Yellow 30 12/1995 F 2.5 Mortality in July Scarlet 12 (formerly Red 11) 02/1996 M 4+ Mortality in fall of Red 14 02/1996 F 4+ Mortality by Cougar in January 2001 at Noisy Creek Feeder. Red 39 12/1996 F 4+ Mortality in August Scarlet 13 12/1996 & 01/2000 M 6+ Mortality discovered in August Yellow 29 12/1996 M 8.5 Mortality in August Scarlet 4 12/1996 F 2.5 Radio signal received near Sullivan Lake on 3/20/2006. None 12/1996 F 4+ Mortality in September None 12/1996 M 4+ Unknown - latest signal at Hall Mountain in early Red 16 12/1996 M 2.5 Unknown - last detected at Hall Mtn. on 10/10/1997. None 12/1996 M 4+ Unknown - last detected at Hall Mountain in early Green 8 12/1996 F 2.5 Last observed at Canada Hwy. 3 Feeder on 3/6/2006. Lavender 51 01/1999 F 4+ Mortality in March Lavender 52 01/1999 F 4+ Radio signal received near Sullivan Lake on 4/27/2005. Lavender 54 01/1999 F 6.5 Radio signal received near Sullivan Lake on 1/5/2005 and last observed on the northwest side of Sullivan Lake in July Lavender 58 01/1999 M 4+ Mortality in June Green 18 01/1999 M 4.5 Mortality in September 2000 on Sullivan Mountain. Scarlet 10 01/2000 F Adult Mortality on lower Hall Mountain in September Scarlet 11 01/2000 M Subadult Mortality at the Canada Hwy. 3 Feeder on 12/7/
130 Bighorn Sheep Status and Trend Report 2006 Ferguson and Volsen BIGHORN SHEEP STATUS AND TREND REPORT: REGION 1 Lincoln Cliffs HOWARD L. FERGUSON, District Wildlife Biologist DAVID P. VOLSEN, Wildlife Biologist Population objectives and guidelines The management objective for the Lincoln Cliffs (Sheep Unit 12) herd is to increase bighorn sheep numbers to a self-sustaining population capable of supporting both consumptive and non-consumptive recreation. The population objective is to reach a selfsustaining population size of 70 or more bighorn sheep, with a maximum of (WDFW 2003). The bighorn distribution was historically centered on the original release site on the Lincoln Cliffs area just south of the town of Lincoln. Observations of bighorn sheep have been reported as far east as Porcupine Bay on the Spokane Arm of Lake Roosevelt and to the east side of Banks Lake in Grant County, and as far west as Neal Canyon. The sheep now occupy two main areas throughout the year the original Lincoln Cliffs area and the cliffs around Whitestone Rock, about 7 miles downriver from Lincoln. Bighorns have not yet been observed north of the Lake on the Colville Indian Reservation. Hunting seasons and harvest trends The first hunting permit for this herd was issued for the 1997-hunting season. Since then, one permit has been issued each year and harvest success has remained at 100%. Applications for permits increased to a new high of 1,375 this past year (Table 1). Interest in the Lincoln Cliffs herd may be evidenced by the fact that the statewide 2003 and 2004 auction winners and the 2005 raffle winner all selected Lincoln Cliffs to harvest their rams. Table 1. Bighorn Sheep Harvest Data. Applications Sheep Lambs 3/4+ Curl Year Received Seen Seen Seen , , , , , , From 1997 to 2000, hunters spent an average of 6 days hunting; from 2001 to 2005 hunters have spent an average of 5.0 days hunting before being successful (Table 2). However, the days/kill for the past 2 years for regular permit hunters rose to 7.0 and 11.0 and the 3-year average has increased to 9 days/kill. Table 2. Average Days per kill and 3 year running average Average Last 3 yrs Yr Days/Kill Avg Avg. 5.6 Surveys Aerial surveys have been conducted in conjunction with deer surveys whenever possible. In the past, aerial surveys have been inconsistent over the years due to funding and personnel. However, since 2002 an effort is being made to conduct two aerial surveys annually one in the spring and one in early winter (Table 3). These surveys were facilitated by radio collaring thirteen of the 15 sheep translocated in 2003, however only 4 animals remain with functioning radio collars. Table 3 is not a reflection of the population number since sheep may be recounted. These compositions surveys count as many sheep as possible in order to get the best age and sex ratios as possible. Ground surveys have also been used; however, there are limitations in this methodology due to the terrain of Lincoln Cliffs and the access to private property. We will continue to conduct ground counts whenever possible to supplement the aerial surveys. 130
131 Bighorn Sheep Status and Trend Report 2006 Ferguson and Volsen Table 3. Lincoln Cliffs Bighorn Sheep Composition Count Totals Cumulative Count Totals R:100E:L Year Sheep Rams Ewes Lambs ratio :100: :100: :100: :100: :100: :100: :100: :100: No Survey Conducted :100: :100: :100: :100:38 Population status and trend analysis The Lincoln Cliffs population was started with an introduction of eleven California bighorns from Northwest Trek in December Three additional sheep from Vulcan Mountain were released in March 1991 and 5 from Kamloops, British Columbia in Following this release, the population showed a steady increase and eventually tripled in numbers after 4 years. By 1996 the population objective level of 60 to 70 bighorns was reached with 65 animals observed during the fall ground survey. The population reportedly peaked at around 100 animals in June 1998 (ground survey, pers. comm. G.J.Hickman). This peak in population was further evidenced by hunter reports of animals seen (Table 1). Hunter observed animals peaked at 60 in 1998 and high numbers continued through 1999 or 2000, and then in 2001 hunter observerved animals decreased to 13 (Table 1). In March 1999, 10 ewes and 1 ram lamb were captured and translocated to the Lake Chelan release site. In February 2000, 6 additional ewes were captured and translocated to the Lake Chelan release site. In February 2001, 11 more ewes were captured and released on the Cleman Mountain area. From 1999 to 2001, 27 ewes and 1 ram were removed from this population. In addition, there have been 20 known mortalities since rams and 3 ewes. As a result, from 1996 to 2005, approximately 48 sheep have been removed from the population 18 rams and 30 ewes. With this high number being removed, and the subsequent low number of sheep observed by the permit hunter in 2001, along with the low numbers recorded from both the aerial survey and the ground surveys in 2002, it became obvious that the population may not have recovered from the removal of ewes for translocation to other areas. The ewe population had declined to an estimated low of around 20-25, with an estimated 19 rams. As a result, 15 sheep were translocated from Nevada to the Lincoln Cliffs and Whitestone areas in January ewes, 1 ram, and 2 lambs. Two of the translocated ewes were found dead in the spring of The 1 translocated ram was found dead in May 2004 and another dead ewe was found in November From May 2003 to June 2006, 17 known sheep mortalities have occurred -- 6 from hunting, 1 from a car, 3 from cougar, 2 natural, and 5 unknowns -- a total of 12 rams and 5 ewes. The population in early 2003 was estimated to be around 60 animals, the 2004 population around animals, and the 2005 (as of May) around Lamb production appeared to be low in 2004 with a ratio of 30 lambs to 100 ewes and 2005 with 38. However no trend is apparent since 2001 with lamb ratios varying from Mortality rates for the 15 sheep released in 2003 has been approximately 10% each year, with a total of 6 mortalities since release 1 ram and 5 ewes. Cougar predation has been the source of 3 of those deaths. Six mature rams have been removed in the past 3 years with both the regular permittees and either the auction or raffle winners being successful. The number of mature rams seen by hunters has steadily decreased from a high of 17 in 2002 to 4 seen in 2005 (Table 1). Taking the highest value from all observations this past year results in the following ram classes: Yearling 2; ¼ curl 4; ½ curl 8; ¾ curl 6; and full curl 3. Habitat condition and trend A continuing threat to the sheep at Lincoln Cliffs is the increasing development of recreational and permanent housing in the Lincoln Cliffs area, which in the past few years has accelerated and brought more people and more roads to this sheep site. Habitat within the range of the Lincoln Cliffs herd is in good condition. There is no competition with domestic livestock at the present time. However, it is important to remain vigilant, since three domestic sheep were discovered to have escaped in the area of Sterling Valley, but follow up observations indicate they did not survive. In the future, we will attempt to distribute big horn sheep information pamphlets to the many new residents around the Lincoln Cliffs area. 131
132 Bighorn Sheep Status and Trend Report 2006 Ferguson and Volsen WDFW and the Bureau of Land Management should attempt to secure and protect the habitat base for this herd by acquiring, either by outright purchase or easements, more land in the immediate area. Washington Department of Fish and Wildlife, Olympia, Washington, USA. Augmentation and habitat enhancement An initial introduction of eleven bighorns to the Lincoln Cliffs area occurred in December of Three additional sheep were released in March 1991 and five more in In January of 2003, 15 sheep from Nevada were released at two Lincoln Cliff sites. Disease and parasites During capture operations in 2000 and 2001 it was noted that these animals were in excellent physical condition. All of the animals captured were robust with excellent pelage and overall appearance. Disease testing showed low numbers of parasites and no harmful disease, however, the presence of domestic sheep and goat herds within the unit represent an ongoing disease threat. Wildlife damage We have not received damage complaints related to bighorns in the Lincoln Cliffs area. However, the local human population and associated construction of new housing, splitting of parcels all increase the future potential for sheep-human conflicts. Management conclusions The herd is now estimated to number around animals. This population level is at or just above the management objective (70 sheep) for the Lincoln Cliffs herd as stated in the Bighorn Sheep Herd Plan (WDFW 2003). With the increase in human population density in and around Lincoln Cliffs and the augmentation, extra effort will be taken to monitor herd numbers and sex ratios in the next few years. With the constant mortality of our collared animals and the difficulty of finding the sheep without collars, money and time needs to be allocated to allow the collaring of at least 10 more sheep in the near future. Permit controlled hunting for rams will be continued in the season. However, because of the low number of mature rams being observed and the number of known mature rams being removed during the past 3 years, no raffle or auction hunts will occur at Lincoln Cliffs. Literature Cited Washington Department of Fish and Wildlife (WDFW) Game Management Plan. Wildlife Program, 132
133 Bighorn Sheep Status and Trend Report Zender and Base BIGHORN SHEEP STATUS AND TREND REPORT: REGION 1 Vulcan Mountain STEVE ZENDER, District Wildlife Biologist DANA L. BASE, Associate Wildlife Biologist Population objectives and guidelines The population goal for the Vulcan Mountain Bighorn Sheep Herd is to maintain animals on the available range. These bighorn sheep make considerable use of private rangeland, which has been a contentious issue with ranchers in the past when the population was higher. The population declined dramatically from peak numbers in the early 1990 s to as few as about 20 bighorn sheep in Sport hunting has been a traditional consumptive use for this herd and an activity that is co-managed with the Colville Confederated Tribes (CCT). Due to the population drop, however, no permits were issued from 2000 through By 2003 the population was recovering and hunting resumed as of 2005 when objectives for managing bighorn sheep harvest as described in the WDFW Game Management Plan (WDFW, 2003) were attained. Surveys Since introduction of the Vulcan Mountain Bighorn Sheep Herd, the population has been surveyed almost every year to determine composition and trend (Table 1). Since 1990 this survey effort has been standardized and carried out in the fall months usually coinciding with rams in rut. The survey is conducted along an automobile route on the Customs and Kettle River County Roads as well as from private, primitive roads into Moran and Cummings Creek Meadows. We attempt to classify every bighorn sheep on the range, but recognize that this effort likely never results in a complete population census. Bighorn sheep were counted and classified on October 20 and November 16, Table 1 provides the composite count for the fall of 2005 of 22 rams, 32 ewes, and 21 lambs. This high number of sheep had not been observed at Vulcan since the early 1990 s. Population status and trend analysis Originating with a founder herd of only 8 bighorn sheep in 1971, the Vulcan Mountain Herd peaked to 107 observed animals in Subsequent to 1990 the herd declined dramatically to a low of only 17 animals observed in 2001 (Table 1). In the late 1990 s adult mortality was exceptionally high due to poor health (internal parasites, possibly disease, and severe winter stress), several documented road-kills on ewes, and likely cougar predation. Lamb recruitment dropped from 10 in 1995 to 2 in 1996 and to 0 in 1998 and 1999 (Figure 1). By the year 2000 there were encouraging signs that the population was beginning to recover in that observed animals appeared to be healthy again and at least 2 lambs were recruited that year. Fall surveys in 2003 and 2004 documented at least 9 lambs recruited into the population for each year. In 2005 there were 21 lambs observed in the fall survey. We did not see all of the sheep comprising the herd in 2004 as the jump from 46 to 75 animals in 2005 was certainly not by lamb recruitment alone. Nevertheless with the healthy recruitment of lambs since 2001, we likely meet the population goal for this herd and now need to actively manage its level so that numbers do not exceed biological and social carrying capacity. Hunting seasons and harvest trends Both general public hunters (State) and members of the Colville Confederated Tribes (CCT) have hunted bighorn sheep within the Vulcan Mountain Unit. Biologists annually confer prior to developing their respective permit recommendations. Recreational permit-only hunting began in From 1981 through 1999 there were 49 bighorn sheep legally harvested from the Vulcan Unit including 48 rams and 1 ewe (Table 2). Due to low herd population and recruitment levels hunting was suspended by both the State and CCT from 1999 through In 2005 hunting was resumed with 1 permit each issued by the State and the CCT. Only one animal was harvested, a 4 year old ram by the State permittee (Table 2). Herd health and productivity We believe that this bighorn sheep population declined subsequent to about 1995 mainly as a result of complications from exceptionally high internal parasite loads. Mortalities appear to have been highest from 1996 through Surviving animals observed in 1998 and 1999 were generally in poor physical condition (thin, gaunt body mass, signs of chronic scours, and unusually poor horn growth). No lambs were observed at any time in 1998 or 1999 and only 2 lambs appear to have been produced in Efforts to determine the primary cause of the herd decline began in Numerous samples of fecal 133
134 Draft 2005 Bighorn Sheep Status and Trend Report Zender and Base pellets were collected in all seasons and sent for analysis of parasites to both the Washington State University Veterinary Sciences Laboratory as well as the Canadian Food Inspection Agency Laboratory in Saskatoon, Saskatchewan. In November of 2000 an adult ram was euthanized and necropsied by the Washington State University Diagnostic Laboratory (Foreyt 1999 and 2000). While this ram was in good health, it also carried a high density of nematode larvae judged to either be, or similar in appearance to Parelaphostrongylus, a muscle worm (Murphy, 2000). Additional fecal samples were collected. Further analyses accomplished by Dr. Alvin Gajadhar identified Muellarius capillaris, the lungworm of domestic goats rather than Parelaphostrongylus (Gajadhar 2002). Domestic goats were known to share part of the Vulcan Bighorn Sheep range. The parasite Muellarius capillaris using slugs and snails as intermediate hosts, was able to jump from domestic goats to the bighorn sheep. Native bighorn sheep having less natural resistance than domestic goats to Muellaris capillaris, likely succumbed to pneumonia that this parasite causes (Hall 2002). Parasite levels in the Vulcan Mountain Herd were again monitored in October of 2004 as well as in March of Fecal samples were collected and submitted to the Washington State University Veterinary Sciences Laboratory for analysis. In the October collection, 4 of 16 samples contained low to moderate levels of dorsal-spined larvae, and 1 sample contained low levels of Protostrongylus larvae. The 9 samples from March of 2005 contained no lungworm larvae (Foreyt, 2005). These results indicate relatively low parasite levels (Mansfield, 2005). That these bighorn sheep now appear healthy and are producing lambs annually suggests that the overall health of the herd is acceptable. Range use and habitat enhancement Between April of 2002 and March of 2004, six of the Vulcan Bighorn Sheep including 3 rams and 3 ewes were captured by helicopter net-gun and fitted with radio collars. Five bighorn sheep from Nevada were radio-collared and released at Vulcan in January of The purpose of this radio telemetry application was to document range use, especially use of timbered versus open habitats for the U. S. Bureau of Land Management (BLM) and U. S. Forest Service (USFS) habitat managers. Monitoring since that time has shown little movement from the traditionally known range amongst these sheep (Doloughan, 2004). Table 1. Annual population composite counts of the Vulcan Mountain Bighorn Sheep Herd from 1980 through R a m s Ratio Year Lambs Ewes Yearling <3/4 curl >3/4 curl Total Rams Total Sheep Lambs : 100 Ewes : Rams : 100 : : 100 : : 100 : : 100 : : 100 : No survey in : 100 : : 100 : : 100 : : 100 : * : 100 : : 100 : : 100 : : 100 : : 100 : : 100 : : 100 : : 100 : : 100 : : 100 : : 100 : : 100 : : 100 : : 100 : : 100 : : 100 : 69 * f f 134
135 Draft 2005 Bighorn Sheep Status and Trend Report Zender and Base In the past seven years several projects to enhance habitat for the Vulcan Mountain Bighorn Sheep have been completed. These include broad range weed control, selective logging, forage plant seeding, water source development, and temporary fencing at Moran Meadow to better control cattle grazing. Partners accomplishing these projects include several local private landowners, the Foundation for North America Wild Sheep (FNAWS), the Safari Club International (SCI), the Inland Northwest Wildlife Council (INWC), the USFS, the BLM, and the WDFW. As an example, one of the private property forage range seeding projects accomplished in 2002 was followed up in 2004 with weed treatment. The most recent large-scale project was the completion of a BLM timber sale within the core sheep range in This helicopter-logging project was partially designed to improve predator avoidance for bighorn sheep by elevating sight distances within the most heavily forested portions of their range, as well as to increase forage production (Doloughan, 2004). Management conclusions The Vulcan Mountain Herd of bighorn sheep has recovered in health and in population. Lamb ratios for Table 2. Summary of State and Colville Confederated Tribes (CCT) hunter harvest of bighorn sheep from the Vulcan Mountain Unit from 1981 through Year Org. # Tags Harvest Avg. Age Horn Length* 1981 State 3 3 rams 6.3 years 38, 37, State 3 3 rams , 37, State 3 3 rams , 36, State 2 2 rams , State 2 1 ram State 3 3 rams , 36, State 3 3 rams , 32, State 3 3 rams No data 30, 31, State 2 2 rams , State 3 3 rams , 33, State 2 2 rams , State 3 3 rams ,33, State 4 4 rams ,27,35, State 4 4 rams ,33,33, State 2 2 rams , CCT 2 1 ram 1.5 No data 1996 State 2 2 rams , CCT 2 ram, ewe Ram = 1.5 No data 1997 State 1 1 ram CCT 1 None State 1 1 ram CCT 1 None State 1 1 ram CCT 1 None No tags allocated No tags allocated No tags allocated No tags allocated No tags allocated State 1 1 ram 4.5????? 2005 CCT None * * Total horn length in inches the last 3 years combined have averaged over 50 lambs per 100 ewes. With healthy lamb recruitment, the Vulcan Mountain Herd has likely returned to the population goal of animals. The 2004 fall census results indicated that the Vulcan Herd could sustain limited-entry hunting again. The population parameters for establishing a permit were met (WDFW 2003), as the population was stable or increasing; had more than 30 adult sheep; and had 8 or more ½ + curl rams of which 2 or more were greater than ¾ curl (Table 1). One permit for any ram was authorized and filled in the 2005 fall season. The CCT permit for any bighorn sheep was not filled and reportedly not hunted (Demers 2006). WDFW will issue one ram permit again in Since the auction and raffle permit holders are only allowed to hunt units with 2 or more permits we were reluctant to recommend 2 permits for Vulcan. Generally the CCT have matched the hunt permit levels set by WDFW so once we increase to 2 permits there is the potential for 4-6 sheep hunters. If the rapid growth rate in this herd continues we should be more comfortable with increased ram permits, but some means of removing ewes to stabilize herd growth may be more critical, and problematic. References Demers, D. Colville Confederated Tribes. Personal communication in Foreyt, W. J., Ph.D. Washington State University. Personal communications in 1999 through Gajadhar, A. A., Ph.D. Canadian Food Inspection Agency Saskatoon, Saskatchewan Laboratory. Personal communication in Hall, P. B., DVM. Washington Department of Fish and Wildlife. Personal communications from 1999 through Judd, S. Colville Confederated Tribes. Personal communications from 1994 through Mansfield, K. DVM. Washington Department of Fish and Wildlife. Personal communication in Murphy, B., PhD Washington Animal Disease Diagnostic Laboratory, Report No Doloughan, K., U.S. Dept. of Interior: Bureau of Land Management. Personal communication in Washington Department of Fish and Wildlife Game Management Plan. Wash. Dept. Fish and Wildlife, Olympia, Wash. 136 p. 135
136 Draft 2005 Bighorn Sheep Status and Trend Report Zender and Base Herd Composition Year Ewes Lambs Figure 1. Vulcan Mtn. Bighorn sheep ewe and lamb composition,
137 Bighorn Sheep Status and Trend Report Patterson and McCall BIGHORN SHEEP STATUS AND TREND REPORT: REGION 2 Swakane Canyon, Chelan Butte and Lake Chelan BEAU PATTERSON, District Wildlife Biologist TOM McCALL, Wildlife Biologist Population objectives and guidelines Within the Wenatchee District, California bighorn sheep are found west of the Columbia River. They have been reintroduced to Swakane Canyon, the north shore of Lake Chelan and Chelan Butte. There are also bighorns from the Quilomene herd that use the south part of the District in the Tarpiscan Creek, Colockum Creek and Stemilt Creek watersheds. Management objectives for the Wenatchee District are: (1) increase the size and range of existing populations; (2) ensure genetic strength by augmenting existing populations with bighorns from other areas; (3) minimize risk of disease by eliminating overlap with domestic sheep grazing allotments on public land, and provide information to the public about the importance of keeping these species apart; (4) reintroduce bighorn to suitable historic but unoccupied habitat within the District; and (5) provide public viewing opportunities. There were an estimated bighorns in the Swakane herd in June The population objective for Swakane is adult sheep. The north shore of Lake Chelan population was estimated at animals in June 2006, and the current population objective for the herd is 200 adult sheep. On January 23, 2004, 35 bighorn sheep from the Clemans Mountain herd were released on Chelan Butte, south of Lake Chelan. Composition of the release was 20 ewes, 12 lambs (7 female, 5 male) and 3 rams (2.5, 2.5 and 3.5 years old). All released bighorns were marked with a white eartag in the right ear, and 8 adult and 4 yearling ewes were radio-collared. A population objective has not been established, however habitat analysis (Musser and Dauer 2003) suggests sufficient habitat exists for a population of sheep. Hunting seasons and harvest trends In 1999, the first ram permit was offered for the Swakane herd, followed by one permit per year for The hunting season runs September 15- October 10. All of the hunters have been successful at killing a trophy ram (>3/4 curl). For 2002, one permit was offered for the Swakane and the auction hunter also hunted the area. Both hunters took large >3/4 curl rams. Only one permit was offered for Swakane in , to ensure a sufficient number of older rams for public viewing. At least 7 non-hunting bighorn mortalities occurred in and 6 in , all caused by vehicle collisions on highway 97-A. On the north shore of Lake Chelan, 2 permits were offered in 2005 and 2 ¾-curl rams were taken. For 2006, there will be one permit in Swakane, and two permits on the north shore of Lake Chelan. No hunting will occur in the Chelan Butte herd until at least 5 years postintroduction, per management guidelines. Surveys The Swakane area has considerable tree and shrub cover limiting aerial survey effectiveness. In June 2002, one hour was spent searching for sheep by helicopter, but no sheep were located. For the Swakane, we rely primarily on incidental reports from Washington Department of Fish and Wildlife personnel, permit hunters, and the public, and from ground surveys during the rut and winter period (Table 1). Radio transmitters would help locate groups of sheep and improve survey data. A minimum of 69 individual bighorns was observed during the reporting period, comprised of 43 ewes, 11 lambs and 15 rams; however, we believe there are at least bighorns in this population. On July 5, 2005, the Lake Chelan herd was surveyed by helicopter, using radio-telemetry (n = 8 collared sheep) to locate collared sheep. Telemetry proves invaluable for finding sheep hiding in timber or rocky habitat. Thirty-nine sheep were found on the north shore of Lake Chelan. Composition consisted of 1 rams (< 3/4 curl), 28 ewes, and 10 lambs (Table 2). One adult ram mortality (7 y.o., ¾ curl) was observed on this survey. In addition, a group of 17 rams (at least 5 > ¾ curl) were reported by an experienced volunteer July 3, 2005, for a minimum observed population of 55 (Table 2). No helicopter survey was conducted during 2006 because of funding constraints. However, several boat surveys were conducted by WDFW and included 28 ewes, 5 lambs, and 15 rams. We estimate this population at sheep. The Chelan PUD observed bighorns on 11 of 12 wildlife boat surveys on 137
138 Bighorn Sheep Status and Trend Report Patterson and McCall Lake Chelan during Their highest count of sheep was 79 on March 14, On November 6, 2004, 2 rams, 23 ewes and 9 lambs were observed at Chelan Butte, for a minimum of 34 sheep. In September 2005, a dove hunter reported counting 45 total sheep on Chelan Butte. Population status and trend analysis From 1992 to 2000, the Swakane bighorn population increased slowly (Table 1). In 2001 the population was estimated at 51 sheep, representing a 46 percent increase compared to the average. The increased numbers in 2001 resulted from a new alfalfa field in the Swakane, which attracted ewes and lambs, facilitating detection. This trend continued in 2002 and It is likely increased sightability, rather than population growth, accounts for some of the increase. Additionally, each succeeding permit hunter has used the knowledge of the previous hunters to help locate rams, which has enhanced our counts of rams; and a valuable survey by advanced hunter education graduates in June 2003 boosted the ram count. A minimum of 13 lambs was produced in 2003, and 10 in 2004, compared to the observed average of 4.4 lambs for Bighorn observations decreased in 2004, due to a combination of hazing efforts along Highway 97-A and very mild, open winter conditions, which reduced sightings. Proliferation of residential developments and associated ornamental plantings along the west shore of the Rocky Reach pool may be enticing bighorns to cross Highway 97-A with increasing frequency and annual duration. Other possibilities include attraction to chemical deicers, and displacement by public activity or predators (evidence that a female cougar with kittens occupied a traditional lambing area in Swakane Canyon was observed in September 2003). For over 30 years, no bighorn mortalities attributable to vehicle collisions were documented. Since 2002, at least 13 Swakane bighorns have been killed by vehicles on Highway 97-A (7 male, 6 female), and the Washington Department of Transportation, State Patrol and Burlington-Northern Railroad have contacted the Wenatchee field office due to concerns with increased frequency of bighorns on this highway. It is likely these mortalities have either slowed or eliminated herd growth. In Spring 2004, the Wenatchee Sportsmen Association convened a multiagency working group to address deer and bighorn sheep vehicle collisions on Highway 97-A, and are seeking means to reduce both deer and sheep collisions on this highway. This group is seeking funding to build a game proof fence west of Highway 97-A to reduce wildlife vehicle collisions. Over half ($590,000) of the funding to completed the fence has been acquired, and construction is proposed to being in A capitol improvements request of $412,000 was submitted to the legislature to complete the funding of this project. The Chelan herd exhibited rapid population growth typical of a founder population in excellent quality, unoccupied habitat. Disease and wildfire concerns have not to date resulted in observed impacts to the population. Lamb survival has been high. Ninety-four sheep were observed during the June 2003 survey. In late June 2003, the National Park Service at Stehekin reported 3 ewes at Rainbow Falls, 3 miles above the mouth of the Stehekin River; this is over 20 air miles from the next highest uplake observation. Based on high lamb and ewe survival, it is likely that ram survival is also high; however, few rams were observed prior to In 2004, June survey data were used to calculate population trends, based on a 2001 population of 50; trends in ewe counts, which are likely the most reliable trend due to the banding behavior of ewes and presence of radioed ewes annually prior to 2005, indicated a 3 year average annual population growth rate of 38%. Total count trends indicate a three-year average annual population growth rate of 25%. Based on these trend estimates, the population was in 2002, in 2003, and in However, winters were extremely mild, and it is believed that this herd was either stable, or increased. As a result, the 2004 population estimate of is retained for 2006, as a conservative estimate. At the other extreme, applying the 38% population growth rate figure to the 2004 estimate indicates the population could be as high as in In the Chelan herd, only one radioed ewe has died, hit by a train in February A total of 45 sheep were observed in 2006, and the population is estimated at (Table 3). It was believed that less than 20 bighorns used the Colockum and Stemilt watersheds within the Wenatchee District. These sheep are part of the Quilomene herd. In July 2005, a wildlife officer observed 12 ¾-curl or larger rams in a field near Alcoa. If these are resident rams, this observation suggests this subpopulation may be larger than previously thought. Habitat condition and trend Habitat conditions for Swakane, Lake Chelan and Chelan Butte bighorns are excellent, in part due to the high frequency of fires. Fires reduce tree and shrub 138
139 Bighorn Sheep Status and Trend Report Patterson and McCall cover and increase the abundance of grasses and forbs, which in turn benefit bighorns. During summer 2001, the Rex Creek fire on the north shore of Lake Chelan burned over 53,000 acres. However, only a small portion of this burn was known occupied bighorn habitat. During summer 2002, the Deer Point fire on the north shore of Lake Chelan, and down-lake from the Rex Creek fire, burned over 43,000 acres, including most of the occupied bighorn habitat of grass, bitterbrush, mixed shrubs, and ponderosa and lodgepole pine. In October 2002, at least 25 bighorns moved up-lake to the Point-No-Point area of the Rex Creek burn, apparently to take advantage of the new forage. Supplemental feeding of airlifted alfalfa hay was done in November 2002, to ensure survival of the transplanted herd of bighorns. Winter conditions were extremely mild, and the alfalfa was not utilized to a large degree. Weed surveys were conducted in July and August 2003, to ensure this effort did not introduce new weed species to the Lake Chelan basin. Forage quantity and quality appear to be excellent, following the release of nutrients from both the fires. The Dinkelman fire in the Swakane area, which burned in 1988, proved beneficial to the bighorns in this area. In Swakane Canyon, several fields have been planted in alfalfa and oats, which enhanced bighorn habitat, and were used by ewe/lamb bands. There are further opportunities to enhance bighorn, mule deer and other wildlife habitats in Swakane and on Chelan Butte, but these have been limited due to funding constraints. One spring was developed for bighorn sheep on the Spotted Ass Ranch along Highway 97-A in Another water development project is proposed on Greg Anderson s property, ½ mile to the north, for spring Construction of a transmission line over Burch Mountain began in This transmission line bisects critical bighorn habitat of the Swakane herd and may influence sheep behavior. Construction of the line will likely continue to disturb sheep until it is completed in The long-term impacts of the transmission line on sheep are unknown. Due to the dependence of California bighorns on low elevation habitats that are also desirable for human developments, there is long-term habitat loss occurring due to conversion and development of native habitat. Maintenance of habitat connectivity at low elevations in Chelan County is vital to the long-term health of all 4 herds. Wildlife damage No reports of agricultural damage attributed to bighorns were received in In previous years, Ohme Gardens, an irrigated horticultural development in cliff habitat at the edge of the Swakane bighorn range, has complained of bighorn use of these ornamental plantings. An orchardist in southern Chelan County complained about Quilomene herd bighorns use of his cherry orchard. No complaints have resulted in a claim for compensation. Augmentation and habitat enhancement The Chelan herd is likely continuing to grow, and presumably has good genetic diversity due to the variety of founder sources. For Swakane, augmentation is desirable for the long-term health of this population, given the historic stagnant nature of the population and small founder population. However, because Swakane bighorns have a documented history of intermixing with domestic sheep from nearby grazing allotments, the risk of Pasteurella pneumonia for bighorns would likely increase as the herd expands in size. Augmentation will be postponed until conflicts with domestic sheep are resolved. The Moses Coulee area in Douglas County offers potential habitat for bighorn reintroduction. Much of the area is privately owned, but the proportion in public ownership has increased in recent years. In 2005, several landowners were contacted regarding the possibility of introducing bighorns. Response was negative, however it appears concerns centered more on lack of interest in working with WDFW and concerns about endangered species, rather than opposition to bighorns. The Foundation for North American Wild Sheep may be able to secure agreements for bighorn reintroduction, if landowner concerns can be addressed. A long-term agreement with landowners to eliminate potential for contact with domestic sheep would be required before reintroducing bighorns in Douglas County. Management conclusions The threat of disease from domestic sheep is significant for Swakane bighorns. Domestic sheep were documented 3 times within the core habitat of Swakane bighorns in Domestics were twice reported and once confirmed in the core area in 2003, and one domestic sheep in the core area was euthanized by WDFW with prior permission from the presumptive owner in Bighorn rams were documented in domestic sheep allotments twice during Wenatchee National Forest is currently evaluating 139
140 Bighorn Sheep Status and Trend Report Patterson and McCall sheep allotments in the area. The WDFW and Wenatchee National Forest worked on a Memorandum of Understanding concerning bighorn management, but no progress occurred in These efforts were expected to reduce overlap and conflicts between domestic sheep and bighorn. The Swakane herd would benefit from augmentation, but such efforts will be postponed until domestic sheep conflict issues are resolved. The Swakane bighorn population is somewhat unique in being highly accessible to the viewing public during the winter months. Viewing opportunities, in particular large adult rams, are highly valued by the viewing public. Harvest management should be conservative to maintain this viewing opportunity. Further investigations of strategies to reduce highway mortalities are warranted and ongoing. The population objective of 200 for the Lake Chelan herd is extremely conservative, based on the low potential for conflicts, US Forest Service management emphasis for bighorn sheep habitat, and the increase in habitat resulting from wildfires. Conservative estimates of available habitat, based solely on the extent of the 2001 and 2002 fires, suggests there may be habitat to support bighorns. Consideration should be given to significantly increasing this population objective. Aerial surveys of bands located with radiotelemetry presents the best opportunity to monitor the status of Swakane, Chelan Butte and Lake Chelan herds. There are no active transmitters in the Swakane, and many of the collars in Chelan have died or are reaching the end of battery life. At least 6-10 radio transmitter collars should be attached to primarily adult ewes in each herd to facilitate accurate monitoring of herd size, productivity and composition. Optimum monitoring would involve 2 helicopter surveys per year, during June following lambing to monitor production, and during the November rut to monitor rams. Chelan Butte bighorns should be adequately radioed at least through The observation of 12 mature rams near Alcoa is higher than previously documented in this area. As a result, the Quilomene sheep hunting area was expanded north to Colockum Creek. Future consideration will be given to further expansion to encompass bighorn observations in southern Chelan County. Literature Cited Musser, J., and P. Dauer Bighorn reintroduction site evaluation. USDI-BLM Wenatchee Resource Area. 14p. Table 1. Observed population composition of the Swakane bighorn sheep herd, Chelan County, Rams Total Total Populatio Lambs: Rams: Year Lambs Ewes Yrl <3/4curl >3/4 curl rams sheep n estimate 100 ewes 100 ewes * 5* 8* 20* *20 rams observed on coordinated volunteer survey June 3, 2003, but only 12 classified; **post-season 2003 estimate (1 ram harvested 2003) 140
141 Bighorn Sheep Status and Trend Report Patterson and McCall Table 2. Observed population composition and minimum estimated population of the Lake Chelan bighorn sheep herd, Chelan County, Rams Year Lambs Ewes Yrl <3/4 curl >3/4 curl Total rams Total sheep Lambs: 100 ewes Rams: 100 ewes Population estimate * * *High count of sheep observed by Chelan PUD during their 12 boat surveys per year. Table 3. Observed population composition and minimum estimated population of the Chelan Butte Bighorn sheep herd, Chelan County, Rams Lambs: Rams: Population Year Lambs Ewes Yrl <3/4 curl >3/4 curl Total rams Total sheep 100 ewes 100 ewes estimate
142 Bighorn Sheep Status and Trend Report Fitkin BIGHORN SHEEP STATUS AND TREND REPORT: REGION 2 MT. Hull Unit 10 SCOTT FITKIN, District Wildlife Biologist JEFF HEINLEN, Wildlife Biologist Population objectives and guidelines The Mt. Hull herd is being managed for steady population growth for as long as available resources will support increased numbers. A conservative, any ram permit harvest also is allowed to the extent it is compatible with population growth objectives. Hunting seasons and harvest trends Improving herd demographics, particularly in the ram cohort, allowed for the issuance of one ram permit starting in 2003 after three years of no harvest following the fire of The permit holder harvested a nice mature ram in 2005; no harvest occurred under the tribal any sheep permit (Table 1). Good productivity and improved male demographics support the addition of another annually permitted WDFW any ram and CCT any sheep harvest starting in This will bring the total Mt. Hull harvest to four bighorn sheep annually if all permits are filled in The CCT has filled three permits in the last ten years. Surveys Biologists conducted a helicopter survey of the Mt. Hull Unit in early December 2005 and classified 90 sheep, including ten rams > ¾ curl (Table 2). Lamb production showed a marked increase from 2004 with a Table 1. Summary of harvest information for bighorn sheep in the Mt. Hull Unit. Year Permits Harvest CCT a Permits CCT Harvest ram 2 rams ram 1 ram ra 1 ram ram 0 1 ewe ram 1 ram 1 ewe ram 1 ram 1 ewe ram 1 ram 1 ewe 1 ewe ram 1 ram 1 any 1 ram any any any ram 1 ram 1 any 1 ram ram 1 ram 1 any ram 1 ram 1 any 0 a CCT=Colville Confederated Tribes ratio of 60 lambs:100 ewes. Survey and flight conditions were excellent resulting in an estimated % total count for this population. This herd is currently at its highest population to date with an estimated population size of animals (Table 2). Population status and trend analysis Observational data suggests that the Mt. Hull herd grew fairly steadily following reintroduction in Numbers peaked at animals around 1990 following several mild winters. The population declined somewhat in the early 1990s, particularly following the severe winter of Herd numbers have climbed gradually since then and are now at an all time high. The ram cohort fluxuated significantly in the early 2000s in response to fire activity in the US and Canada. In 2001 WDFW augmented the herd with 8 ewes and 3 rams from the Cleman Mountain area. This herd was again augmented in 2003 with 5 animals from Oregon. Augmentation efforts are primarily designed to maintain genetic diversity. Population growth is achieved largely through natural production. Given the limited range and insular characteristic of the sheep range on Mt. Hull, herd size may be nearing carrying capacity. Habitat condition and trend The Mt. Hull range has generally remained in good shape. Recent fires appeared to initially reinvigorate natural forage production, as sheep use became more concentrated in the portion of the range within the perimeter of the 2000 fire. Even so, noxious weed invasion is now a concern. Cheat grass has flourished in portions of the burn and other new invasives may be gaining a foothold in the area, including white-top and dalmation toadflax. In the past programs such as the Forest Service s aggressive weed control effort, funded by FNAWS have been helpful, and similar efforts will likely be needed into the future. In recent years the number of Bighorn sheep coming down to and crossing Highway 97 have been increasing. During the winter of three bighorn sheep were reported (one confirmed and two unconfirmed) killed due to vehicle collisions on Highway 97. This may be due to a reduction in winter 142
143 Bighorn Sheep Status and Trend Report Fitkin forage availability caused by an increase in cheat grass at the lower elevations since the 2000 fire. This reduction in forage, in conjunction with the large herd size, may be forcing the sheep across the highway in search of better forage conditions. Other possible explanations for highway crossing include attraction to water, attraction to chemical de-icers, or displacement by predators, including feral dogs. Currently the WDFW is working with the WA Department of Transportation, the Oroville Sportsmans Club, and the WA Chapter of the Federation of North American Wild Sheep to place Bighorn Sheep warning signs along this section of Highway 97. Continued population growth and an increase in movement down to and across Highway 97 is anticipated to continue. Management conclusions Generally, the Mt. Hull herd appears to be thriving, aided by improved post-fire forage conditions, genetic mixing through augmentation, and probable immigration from British Columbia. This herd is currently exceeding population management objectives of animals. Good productivity and improved male demographics support the addition of another annually permitted WDFW any ram and CCT any sheep harvest starting in This will bring the total Mt. Hull harvest to four bighorn sheep annually if all permits are filled in The CCT has filled three permits in the last ten years. The herd may be at or soon reach the carrying capacity of the habitat. If so, then more aggressive management such as ewe harvest and/or translocation of animals to other areas will be necessary. Range condition and herd productivity should be monitored for indications of overpopulation. Table 2. Population composition counts from the Mt Hull area. <3/4 = less than 3/4 curl rams, >3/4 = greater than 3/4 curl rams, and L: 100:R is lambs (L) and rams (R) per 100 ewes (100). Rams Count Population Year Lambs Ewes <3/4 >3/4 Total Total Estimate L: 100E:R :100: :100: :100: :100: :100: :100: :100: :100: :100: :100: :100: :100: :100:33 143
144 Moose 144
145 Moose Status and Trend Report Base and Zender MOOSE STATUS AND TREND REPORT: REGION 1 GMUs 101, 105, 108, 111, 113, 117, 121 DANA L. BASE, Associate Wildlife Biologist STEVE ZENDER, District Wildlife Biologist Population objectives and guidelines Statewide goals for managing moose include the following: (1) To preserve, protect, perpetuate, and manage moose and their habitats to ensure healthy, productive populations; (2) To manage moose for a variety of recreational, educational and aesthetic purposes including hunting, scientific study, cultural and ceremonial uses by Native Americans, wildlife viewing and photography; and (3) To manage statewide moose populations for a sustained yield by hunting. Hunting seasons and harvest trends Moose hunting opportunity in Washington is limited by permit. If drawn, it is a once in a lifetime opportunity. There is a mandatory hunter report to be returned to WDFW. Permit availability and therefore moose hunter opportunity in Washington has increased over the last 15+ years (Figure 1.) Fifty-seven permits were available in five moose management units within the Colville District for 2005 including the Kettle Range, Threeforks, Selkirk Mountains, 49 Degrees North, and Huckleberry Range Permit Hunts (Game Management Units # 101 / 105, # 108 / 111, # 113, # 117, and # 121 / 124 West respectively). One additional moose permit each was available by raffle and by auction, each offering hunters choice for any open moose unit. Once again in 2005 a drawing for three antlerless only permits specifically for persons with disabilities was offered in GMU # 117. General permit season dates remained October 1 st through November 30 th. All moose units were open for the use of any legal hunting method (archery, muzzleloader, or modern firearm) to provide eligibility to all hunters for all units and to maintain hunter choice. Except for the 3 antlerless moose tags under the 49 Degrees North B Permit Hunt, moose hunters in the Colville District units were allowed to take one moose of either sex. Moose Permits and Harvest Permits Year Harvest Figure 1. Statewide moose permit levels and harvest, A total of 51 moose were killed including 47 bulls and 4 cows within the Colville District units in the 2005 season (Table 1). The hunter success rate was 89% and hunters averaged 5.3 days hunting per moose harvested. The 49 Degrees North B Hunt for persons with disabilities had 2 antlerless moose harvested out of the 3 permits issued for a 67% success rate. Hunters there averaged 10 days hunted per antlerless moose harvested. 145
146 Moose Status and Trend Report Base and Zender Table 1. Colville District (GMUs # 101/105, 108/111, 113, 117, and 121/124 West) moose harvest and hunter effort, Year Permits Success Bull Cow Total Total Days Days / kill % % % % % % % % % % % % % % Surveys The primary emphasis of the winter helicopter survey was the Threeforks moose hunt area (GMUs 108, 111). Additional flight time afforded an opportunity to monitor the 49 Degrees North (GMU 117) and Huckleberry Range (GMUs 121, 124 west of Highway 395) hunt units (Table 2). The overall sighting rate was 13.6 moose per flight hour. The bull and calf to cow ratio was 71 bulls and 42 calves per 100 cows respectively. Snow conditions were good to excellent for the survey in the Threeforks hunt area and a complete survey was accomplished. A total of 27 bulls were observed, including 13 (48%) of which were mature animals. The resulting ratio was 123 bulls per 100 cows. Moose hunters provide their observations with the mandatory report. Hunters reported observing 335 moose within the Colville District during the 2005 season which yielded a bull : cow : calf ratio of 55 bulls and 33 calves per 100 cows (Table 3). These ratios were lower for both bulls and calves than our observed ratios from the post-season (early winter) helicopter flights (Table 4 and Figure 2). Population status and trend analysis Early winter composition survey flights have been accomplished each year for the last 12 years (Table 4 and Figure 2). For the fourth year since an unprecedented high in 2002, the bull to cow moose ratio has declined. Nevertheless there were still 71 bulls observed per 100 cows this last winter. The twelve-year trend in the calf to cow ratio shows an overall increase in the calf ratio, but as with the bull ratio, a decline since 2002 (Figure 2). We monitor age and antler spread of harvested bull moose to detect trends in the age structure of the bull population, which in turn indicate the mortality rate on the bull population (Figure 3 and Table 5). For the Colville District in 2005, the mean antler spread of harvested bull moose was a little over 39 inches. The average age of bull moose taken in 2005 was 4.5 years. Mostly sub-adult bulls 2 to 4 years of age were harvested in 2005, which has been the case in 7 of the 14 years from 1992 through 2005 (Table 5). We believe that limited hunter harvest has not had a detrimental impact on the overall population composition of moose in northeastern Washington; however, the trend toward lower overall bull to cow ratios on our surveys, and younger mean bull ages in the harvest may suggest harvest is impacting the bull populations in certain areas. Habitat condition and trend Moose prefer year old clear-cuts or thinnings on mesic sites. Forest regeneration in these areas tends to produce dense thickets of willows and other hardwood shrubs that moose browse. Logging was intense in northeast Washington in the 1980s on public and private lands. More recently the rate of logging on national forest lands has decreased. Heavy logging has continued on private and Washington Department of Natural Resources lands. Generally, forest successional conditions appear to be excellent for moose production over the next few decades. Our observations during winters with relatively deep snow leads us to believe that mature forest stands that provide snow intercept cover and which are adjacent to forage areas may be essential to sustaining moose populations over the long term. Like the winter before, the winter was mild, especially within lower elevations which received more rain than snow. Consequently, moose losses due to winter severity should have been minimal. Human safety and nuisance problems Moose occasionally create a nuisance and potential safety problem within small towns or other human settlements within the Colville District. These conflicts are usually handled by either gently herding the moose out of the city limits or stopping traffic long enough for the animals to find their own way out. Possibly more serious in the rural areas of this district are the increasing motor vehicle collisions with moose. Moose have also been known to attack snowmobilers and hikers on foot. Management conclusions The survey effort in the Threeforks hunt unit yielded good numbers of bulls, including a high ratio of quality mature bulls. The ratio of bulls to cows exceeded 75 per 100, which is the suggested point to liberalize 146
147 Moose Status and Trend Report Base and Zender permits as per the Game Management Plan. This prompted a recommendation to increase permit levels from 6 to 8 for 2006 in the Threeforks hunt unit. Moose survey and harvest data continue to indicate a robust moose population, with excellent quality hunting opportunity, and reasonable numbers of mature bulls. We may be reaching the threshold in permit levels, however, for maintaining a higher quality hunt as slightly lower harvest success coupled with predominantly younger bull moose in the harvest are now becoming apparent Ratios Bull:Cow Linear (Bull:Cow) Year Calf:Cow Linear (Calf:Cow) Mean Spread Year 6 5 Mean Age Figure 2. Composition and trends of moose herds as determined by early winter helicopter surveys Areas surveyed vary annually. Mean Spread Mean Age Figure 3. Average age (years) and antler spread (inches) of bull moose harvested within the Colville District, Table 2. Composition counts of moose for helicopter-surveyed areas in the winter. Area GMU Date Bull Cow Calf Total Bull / Cow / Calf Ratio Bulls :100 Cows : Calves Hours Moose/hour Three Forks 01/05/ : 100 : degrees North 01/12/ : 100 : Huckleberry 01/12/ : 100 : Overall : : 100 :
148 Moose Status and Trend Report Base and Zender Table 3. Moose hunter observations and days per kill in the Colville District for the 2005 season. Area Average Number of Days per Kill Average Number of Moose Seen per Hunter Bulls/Cows/Calves Total Moose Bull / Cow / Calf Ratio Bulls : 100 Cows : Calves Kettle Range / 2 / : 100 : 50 Three forks / 9 / : 100 : 11 Selkirk Mtns / 39 / : 100 : Degrees N / 113 / : 100 : 35 Huckleberry Mtns / 15 / : 100 : 13 Overall : mean = 5.7 mean = / 178 / : 100 : 33 Table 4. Summary of early winter survey effort by helicopter on moose within the Colville District from 1994 through Year GMUs Surveyed Hours Flown Total Moose Classified Moose Observed per Hour Bulls/Cow/Calf Ratio Bulls : 100 Cows : Calves n/a : 100 : : 100 : : 100 : 33 Table 5. Tooth age and antler spread in inches for harvested bull moose in the Colville District from 1992 through Sample Size for Aging Mean Age (years) Sample Size for Antler Spread Mean Spread (inches) Yearling 2-4 years old > 5 years old Year % 80% 20% % 67% 33% % 75% 25% % 50% 50% % 29% 65% % 56% 31% % 55% 45% % 45% 45% % 37% 63% % 31% 69% % 61% 36% % 46% 54% % 41% 54% % 56% 39% 148
149 Moose Status and Trend Report 2006 Ferguson and Volsen MOOSE STATUS AND TREND REPORT 2006: REGION 1 GMUs 124, 127, and 130 HOWARD FERGUSON, District Wildlife Biologist DAVID P. VOLSEN, Wildlife Biologist Population objectives and guidelines Statewide moose management goals are to: 1. Preserve, protect, perpetuate and manage moose and their habitats to ensure healthy productive populations 2. Manage for a variety of recreational, educational and aesthetic purposes and 3. Manage statewide moose populations for a sustained yield. Harvest management emphasizes quality-hunting opportunities through a limited entry permit process. The proximity of an expanding moose population near the Spokane metropolitan area adds the challenge of balancing population objectives with community s tolerance of moose. Hunting seasons and harvest trends Moose hunting opportunities in Washington are limited by permit, and are a once in a lifetime opportunity if drawn (waived for antlerless-only, raffle and auction hunts). Permit season dates remain October 1 - November 30, Moose hunts are open to the use of any legal weapon in order to provide eligibility to all hunters for all units and to maintain hunter weapon choice. Thirty-eight permits were available in the units, 30 in Mt. Spokane and 8 in Hangman, with applications in 2005 increasing to 14,638, up from 12,990 applicants in The Hangman and Mt. Spokane units each had an either-sex moose hunt and an antlerless-only hunt. The Mt. Spokane unit also had a youth-only antlerless hunt consisting of 8 permits. Thirty-seven permittees hunted moose in 2005, with participation rates in all but one hunt at 100%. Thirty-five moose were killed (13 bulls, 22 cows) for an overall hunter success rate of 95%. The mean number of days hunted per hunter was 4.1 days, down from 6.6 days in 2004 (Table 1). The success rate for the youth hunt in GMU 124, Mount Spokane, remained at 87.5%. Surveys During the winter of , standardized aerial surveys were flown for moose in the Mt. Spokane Unit and adjacent units of Idaho. These surveys were conducted by WDFW s Wildlife Science Division, in cooperation with Idaho Fish and Game. Survey data were used in a sightability model to develop a population estimate. The total population estimate for the Mount Spokane unit on both sides of the Washington-Idaho border was 180 moose (Myers, pers. comm.). The estimate for the Mt. Spokane Unit in Washington was 84 moose. Aerial surveys were flown again during the winter (December/January) of , , and in some of the same surveys quadrats as Those units straddling the Washington-Idaho border were not flown in , or , but two Washington-Idaho units were flown in Two additional survey quadrats were established in the Hangman unit in and resurveyed in A comparison of moose observed and moose density by survey quadrat is presented in Table 2. Population status and trend analysis Several pieces of information support the observation that the moose population in District 2 has increased over time. Moose observed during aerial surveys varies somewhat from year to year depending on survey conditions; however, the trend is of an increasing population (Table 3). Hunting success has averaged over 93% since 1993 with many hunts returning 100% success. Moose observations continue to increase in outlying areas, including southern Spokane, Whitman, Lincoln and Adams counties and, reports of moose within the Spokane urban area are frequent. Results from the surveys of the Mt. Spokane and Hangman units showed a reduction of the number of moose observed, and numbers were again lower in the Mt. Spokane unit in (Table 3.). Numbers in the Hangman Unit in were comparable to Survey conditions during some winters are suboptimal and may result in reduced moose observations. Snow depths influence the distribution of moose across survey quadrats each year. Conditions during surveys of the Hangman unit were optimal in and resulted in observed high moose densities, while numbers were reduced in the Mt. Spokane Unit. The mean antler size for bulls harvested in 2004 in the Mt. Spokane unit is 36 inches, while the mean antler size for the Hangman unit increased to 34 inches (Figure 1). By contrast, mean antler size in the Colville District was 39 inches in Hunter density was at a functional maximum in the Mt. Spokane Unit in 2002 with hunters 149
150 Moose Status and Trend Report 2006 Ferguson and Volsen commenting that they are competing for hunting locations and opportunities. Given the once in a lifetime opportunity of a moose permit, any additional permits would likely decrease the quality of the hunt in the unit unless there is an significant increase in the number of moose and percentage of bulls in the population. Permit numbers in the Mt. Spokane unit were reduced to 30 in 2003 from a high of 40 to address this problem. However, permits at Hangman were increased from 5 to 8. While moose are apparently expanding their distribution in the district, and the number of nuisance complaints has increased, the greatest increases appear to occurring on private lands where hunter access is limited. Management in this district is compounded by the fact that the moose regularly move from Washington to Idaho and back. Numbers vary throughout the season likely depending on hunting pressure, weather and snow conditions. Habitat condition and trend Moose prefer year old clear-cuts or thinned stands on mesic sites. Generally, in both the Mt. Spokane and Hangman units, it appears conditions for moose production will be optimal for the next few decades. These units are made up of private timberlands and management practices from the past 15 years are providing excellent forage areas for moose. The Mt Spokane unit is largely composed of large landowner private timberlands in some stage of succession that is of benefit to moose, especially winter range. Lands owned by Washington State Parks provide ample security habitats in the Mt Spokane unit. The clearcut logged habitats with abundant high quality forage and good hiding cover are thought to be important to moose in all seasons. Forested cover is important during summer heat and deep winter snow (Costain 1989). The Hangman Unit is mostly agricultural land with moose range largely limited to the north end of the area. The limited forage areas for moose in the Hangman Unit tend to restrict the opportunity for moose to expand greatly in that unit. However, where moose do occur in the Hangman unit, habitat quality appears to be high and moose occur at the high observed density. Human safety and nuisance problems Individual moose can create human safety or nuisance concerns within the metropolitan area of Spokane. The procedure for addressing moose within the urban/suburban area is outlined in the WDFW Dangerous Wildlife Policy. WDFW s Enforcement Program takes the lead on moose incident reports in and near the city. Incidents range from single moose sightings with no associated WDFW response, to moose in dangerous situations requiring immobilization and translocation. The number of moose incidents per year has been as high as 87 and 82 in 2001 and 2005 respectively, and as low as 42 in Dealing with urban/suburban moose will continue to be a priority for WDFW in the Spokane area. Management conclusions There is tremendous interest in moose hunting in Washington and populations appear to be expanding their distribution. The results of recent surveys indicate that numbers may have stabilized in the Mt. Spokane Unit and that the reduction of any-moose permits was warranted. Permittee satisfaction with the quality of the hunt will continue to be monitored in the unit, and until hunter access to new areas increases, permit numbers should remain the same. Significant concentrations of moose in the Hangman unit are limited to the northern end of the units (GMUs 127 and 130); however, moose density in some of these areas is high. Though moose have been observed wandering in other areas of these GMUs, the population does not seem to be increasing as quickly as the herd in GMU 124 did during the 1990s. The number of moose on the Turnbull National Wildlife Refuge appears to be increasing. Future surveys of the refuge will help confirm a population increase. Literature cited Costain, B Habitat Use Patterns and Population Trends Among Shiras Moose, MS degree, U. of Montana Myers, W Personal communication. 150
151 Moose Status and Trend Report 2006 Ferguson and Volsen Table 1. Moose harvest and hunter success for GMUs 124, 127 and 130. Year Permits Reported Success Bulls Cows Total Days/Kill % % % % % % % % % % % % % Table 2. Moose numbers and density by survey quadrat for years Survey Number of Moose Observed Density (moose/km 2 ) Quadrat # * * * * ** * Survey quadrats primarily in Idaho. **Survey Unit 102 includes all of unit 100, and 40% of
152 Moose Status and Trend Report 2006 Ferguson and Volsen Table 3. Moose observations and herd composition during aerial surveys from 1990 to Survey Area Year Bull Cow Calf Total Bull:Cows:Calf Mt. Spokane Unit :100:61 Mt. Spokane Unit :100:25 Mt. Spokane Unit :100:50 Idaho-Unit* :100:52 Mt. Spokane Unit :100:35 Hangman Unit :100:48 Mt. Spokane Unit :100:55 Hangman Unit :100:44 Idaho-Unit* :100:46 Mt. Spokane Unit :100:73 Hangman Unit :100:95 Mt. Spokane Unit :100:50 Hangman Unit :100:37 * Survey unit primarily in Idaho 45 Antler Width (in Mt. Spokane Unit Hangman Unit Figure1. Average antler width (in.) for bulls harvested in the Mt. Spokane (GMU 124) and Hangman (GMU 127 and 130) units. 152
153 Black Bear 153
154 Black Bear Status and Trend Report Beausoleil and Martorello BLACK BEAR STATUS AND TREND REPORT Statewide RICH A. BEAUSOLEIL, Bear-Cougar Specialist DONALD A. MARTORELLO, Carnivore, Furbearer, and Special Species Section Manager Distribution and abundance In Washington, black bears (Ursus americanus) inhabit 31 of 37 counties, occupying all forested habitats within western Washington, the Cascade Mountain Range, the Okanogan Region, the Selkirk and Blue Mountains ranges. Only two island counties within the North Puget Sound area and the shrubsteppe habitat of the Columbia Basin do not support resident black bear populations. Although population surveys are not being conducted on a statewide basis, all indications are that Washington State has an abundant and healthy black bear population. Rough population estimates based on population reconstruction and computer modeling suggest the statewide black bear population is around 25,000-30,000 animals. Management guidelines and objectives The goals for black bear management in Washington are to: 1) preserve, protect, perpetuate, and manage black bear and their habitats to ensure healthy, productive populations; 2) minimize threats to public safety from black bears, while at the same time maintaining a sustainable and viable bear population; 3) manage black bear for a variety of recreational, educational and aesthetic purposes including hunting, scientific study, cultural and ceremonial uses by Native Americans, wildlife viewing and photography; and 4) manage populations statewide for a sustained yield (Washington Department of Fish and Wildlife, 2002). For management purposes, the state is divided into 9 black bear management units (BBMU s)(figure 1). Harvest levels vary between BBMU depending on local population dynamics and environmental conditions. To maintain stable bear populations, modifications to harvest levels are made on a threeyear rotation through the Fish and Wildlife Commission process. The Department uses the percentage of females in the total harvest and median ages of males and females as indicators of exploitation (Beecham and Rohlman 1994) (Table 1). However, sex and age structure data of harvested bears may provide misleading interpretations (Caughley 1974, Bunnell and Tait 1981, Garshelis 1991, Clark 1999). For example, the age structure of a declining bear Figure 1. Black bear distribution and black bear management units. Table 1. General black bear harvest guidelines used in Washington (Game Management Plan 2002). Harvest Parameter Liberalize Acceptable Restrict % Females in < 35% 35-39% > 39% harvest Median age of > 6 years 5-6 years < 5 years harvested females Median age of harvested males > 4 years 2-4 years < 2 years population can be the same as the age structure in an increasing population. In addition to this shortcoming, there is often a time lag between when a population begins to decline and when that decline is evident in sex and age structure data (Harris 1984). In some cases, by the time a decline is detected, bear numbers may have been reduced to a point where it could take longer than a decade to recover the population. However, detecting a decline early can enable managers to make a quicker recovery or retain stability. Sensitivity analyses of bear populations indicate that adult female and cub survival are the most influential parameters to population growth rates (Clark 1999). As such, WDFW has begun to develop survey efforts that aim to improve the estimates of these parameters, while at the same time evaluating harvest data to assess long-term trends. 154
155 Black Bear Status and Trend Report Beausoleil and Martorello Hunting seasons and harvest trends The use of bait and hounds for hunting black bear has been illegal in Washington since the 1996 season. Since that time, bear seasons were lengthened, bag limits increased from 1 to 2 in some areas, and spring seasons have been expanded to 9 of Washington s 136 Game Management Units (GMUs). Legislation also passed that provided authority to the Fish and Wildlife Commission to reduce costs for black bear transport tags. In the following years, , the result was an increased number of bear hunters, and therefore, bear harvest. Since 2001, the number of bear hunters has decreased slightly, with an average harvest of 1,440 bears per year (Table 2). Depending on location, black bear hunting season begin either August 1 st or September 6 th and continue through November 15 th. In GMUs where a spring hunt occurs, the dates are April 15 through May 31. While there is no physical mandatory sealing requirements for bear, successful hunters must report harvest statistics and the first upper premolar of their kill for aging via a tooth envelope provided by WDFW. Research Since bear populations appear to be healthy throughout Washington, formal population estimation studies have not been a high priority. However, the Department has conducted some important scientific research with regards to black bears. From 1963 to 1969, the Department studied black bear damage to coniferous forests and gathered basic demographic information that was used to establish management guidelines (Poelker and Hartwell 1973). The next study occurred from and documented habitat use, home range size, and survival in three ecoregions in Washington (Koehler and Pierce 2003). Finally, from , WDFW conducted bait station surveys as a measure of relative bear abundance. However, an analysis of statistical power indicated that at the level of survey intensity, the Department would not be able to detect a change in bear abundance using bait stations (Rice et al. 2001). For that reason, the survey technique was discontinued. Beginning in 2003, capture efforts have been initiated in eastern Washington to monitor adult female and cub survival in selected areas to better assess bear population status and impacts of hunting. In 2005, in response to spring bear seasons being implemented to reduce bark-peeling damage on public lands, the Department launched a population estimation / survival-monitoring project in Capitol Forest in western Washington. In the spring of 2006, 160 trap nights of effort resulted in no visits and thus no captures. Two more trapping sessions are planned for later this year. In conjunction with this project, the Tumwater School district has initiated several natural resource related student programs that will give high school students the opportunity to side-by-side with professional biologists and foresters: involvement in black bear research is part of this program. To date, over a dozen teachers have accompanied WDFW personnel in the field while conducting bear research to gather information for planning the curriculum. Human-black bear conflict The total number of black bear-human interactions over the past decade decreased from a high in 1998 of 786 complaints to a low in 2002 with 382 complaints (Figure 2). Since then, complaints have averaged 476 per year. In Washington, negative black bear/ human conflict overwhelmingly involves garbage issues (i.e. poor storage), but tree peeling, livestock, orchard and apiary depredations are also experienced. Human population growth and development has only compounded these issues. The Department recently Table 2. Statewide black bear harvest, hunter effort, and median age information, , Washington Department of Fish and Wildlife. Median Age Year Male Female Total Harvest # of Hunters % Success # Hunter Days # Days per kill Males Females % Females ,310 12,868 10% 104, % ,060 8% 97, % , ,802 20,891 9% 216, % ,106 37,033 3% 481, % ,148 37,401 3% 296, % ,431 25,141 6% 230, % ,227 24,844 7% 219, % ,556 22,510 7% 192, % , ,654 21,573 8% 186, % ,333 20,724 6% 172, % 1 Iincomplete data set, analysis is ongoing 155
156 Black Bear Status and Trend Report Beausoleil and Martorello completed a statewide policy on the handling of black bear/human conflicts by field personnel. The policy specifies circumstances in which animals will be monitored, captured and relocated, or captured and destroyed. The Department has also worked proactively to prevent these conflicts by conducting Living with Wildlife workshops annually to schools and local communities, distributing educational materials to stakeholders and in key locations, purchasing and installing bear-proof containers, and supplying regional WDFW offices with bear education materials. Black bear license plate Wildlife-themed license plates are now available to Washington residents and feature some of the state s premier wildlife species (Figure 3). Adopted by the 2005 Washington State Legislature and signed into law by Governor Christine Gregoire, these special license plates boast a black bear, bald eagle, orca, elk, or mule deer image. Plates are available for passenger vehicles, light duty pickups, trailers, motorcycles, motor homes, RVs, 5th wheels and campers. Wildlife-themed backgrounds are available for an additional cost ($40 new, $30 subsequent renewal) plus fees. Revenue generated from the sale of Washington s Wildlife license plates will be spent to improve management of Washington s game animals. Activities include, but are not limited to: habitat improvements, improved population monitoring, population restoration and expansion, improved public access opportunities, and improved educational materials. This additional revenue source will be invaluable source of funding to many game and nongame management programs. # Figure 3. One of 5 wildlife-themed license plates. Literature Cited Bunnell, F. L., and D. E. N. Tait Bears in models and in reality implications to management. International Conference Bear Research and Management 4:15-23 Caughley, G Interpretation of age ratios. Journal of Wildlife Management 38: Clark, J. D Black bear population dynamics in the Southeast: some new perspectives on some old problems. Eastern Black Bear Workshop Proceedings 15: Garshelis, D. L Monitoring effects of harvest on black bear populations in North America: A review and evaluation of techniques. Eastern Workshop of Black Bear Research and Management 10: Koehler, G. M. and D. John Pierce Black bear home-range sizes in Washington: Climatic, vegetative, and social influences. Journal of Mammalogy 84 (1):81-91 Pelton, M. R Black Bear. Pages in Demarais, S. and P. R. Krausman, Eds. Ecology and management of large mammals in North America. Prentice Hall, Upper Saddle River, New Jersey, USA. Poelker, R. J. and H. D. Hartwell Black bear of Washington. Biological Bulletin Number 14. Washington Department of Game. Washington Department of Fish and Wildlife Final environmental impact statement for the game management plan: July 2003-June Washington Department of Fish and Wildlife, Olympia, Washington YEAR Figure 2. Trend in confirmed human-black bear interactions in Washington. 156
157 Black Bear Status and Trend Report Michaelis BLACK BEAR STATUS AND TREND REPORT: REGION 6 Coastal Black Bear Management Unit (BBMU1) WARREN MICHAELIS, Wildlife Biologist Population Objectives/guidelines In view of the implementation of Initiative 655 in November of 1996 as well as the increasing number of bear complaints in residential areas the primary objective at this time is the control of a population likely to increase. Hunting Seasons And Harvest Trends The estimated total black bear harvest for the coastal region in 2005 was 242, which represents a 17 % decline from previous year. At the same time the 2005 harvest was slightly above the five- year average for the period 2000 through 2004 (Table 1). About 71 percent of this total was males and 29 percent females. Percent female harvest was similar in proportion with the reported 2004 percent female total harvest. Hunter success decreased from the 2005 season, as days/kill increased from the 2004 bear harvest statistics (Table 1). The 2005 general black bear season extended from August 1 through November 10. Nuisance and Damage Activity Spring timber damage seasons in Region 6 are on an as needed basis. Total take for the 2005 spring season was up from the 2004 spring season with 91 bears. This year 100 permits were issued to hunters for a special spring bear season in the Capitol Forest GMU 663. Season for permit holders was from April 15 to June 15, A total of total of 17 bears (12 males and 5 females) were taken. In addition for 2005, a special damage hunt was held on the Quinault Indian Nation (QIN) reservation. The results of this hunt are not part of the state harvest. Population Status And Trend Analysis The age distribution of bears harvested in the last nine years is listed in Table 2. The median age for black bear harvested in 2005 was determined by cementum annuli from black bear tooth samples submitted by successful hunters. Teeth from 102 male bears and 47 females were aged. The median ages for males harvested in 2005 was 4.4. Male bears harvested in the Coastal BBMU have been frequently documented above 24.5 years of age (Table 2). The median ages of females harvested for 2005 was 6.5; an increase over the previous year. Management Conclusions Since 1996, percentage female harvest has consistently been below that of males. With reference to hound hunting, Koehler and Pierce (2003) have suggested that male bears are more vulnerable to harvest due to the fact that they have larger home ranges and hence travel greater distances. This fact may also explain the consistently higher percentage of males in the harvest even without the use of hounds. In spring of 2006 a bear mortality study was commenced in Capitol Forest (GMU 663). Two female bear were captured using snares. These animals and future animals that will be captured are part of a project designed to monitor adult female and cub survival in an area with a spring damage season. Literature Cited Koehler,G.M. and D.J.Pierce Black bear homerange sizes in Washington: climatic, vegetative, and social influences. J. Mammology. 84(1): Table 1. Region 6 bear harvest summary Year Male Female Total Days/Kill Hunter Success % % % % % % % % % % Table 2. Age distribution of male and female black bear harvested in the Coastal BBMU from (n = number of tooth samples). Male age Female age Year n Min. Max Median n Min. Max Median
158 Black Bear Status and Trend Report Milner BLACK BEAR STATUS AND TREND REPORT: REGION 4 North Cascades Black Bear Management Unit (BBMU 3) RUTH MILNER, District Wildlife Biologist Population objectives and guidelines Bear Management Unit (BMU) 3 is comprised of Game Management Units 418, 426, 437, 448, 450, and 460. The population objective for Black Bear in the North Cascades BMU is to maintain healthy bear populations, which are capable of sustaining a recreational hunt, while minimizing damage complaints from timber owners and nuisance complaints from suburban homeowners. Hunting seasons and harvest trends The 2005 general season for the North Cascades BMU ran from August 1 through November 15, with a limit of 2 bears. Hunting conditions and access were generally favorable throughout the early season. A relatively warm and wet spring likely favorably influenced the availability of plant foods for bears. The number of bear hunters hunting in BMU 3 declined slightly from 2004 (1465 hunters (2005) vs hunters (2004)). Hunter success also declined in 2005 to 8.3%, compared to a ten year high in 2004 of 15%. The statewide harvest objectives for Black Bear include: maintain a female harvest of 40% or less of the total harvest, with median age at harvest for males at 2.5 years or older, and for females at 5 years or older. Median ages and female percentage of total harvest are given in Table 1. Median age for males harvested in 2005 was 4 years, which is above the minimum age targeted for the statewide objective. Median age for females was 6, which is also above the targeted age for females. Percentage of females taken during the harvest was 28% for the second consecutive year. Nuisance and damage activity Sixty-five depredation permits were issued to industrial timberland owners concerned about tree damage in spring 2005, with 31 males and 16 females killed. This is an increase from 2004 when 33 permits were issues and 28 males and 5 females were killed. Bear sightings by citizens living along the urbanrural interface continued in all three counties contained within BMU 3. However, these reports rarely resulted in lethal removal of the bear. Habitat condition and trend Continued conversion of open space and timberland to houses and supporting infrastructure results in a steady loss of lowland forest habitat for Black Bears. As development proceeds, we expect to see more negative interactions between people and bears. We expect to see continued population growth and land conversion in BMU 3 for the next decade or more. Management conclusions Black Bear harvest in BMU 3 met the state-wide target in In general, Black Bear management in BMU 3 appears to be positive, although fewer hunters hunted BMU 3 in 2005 and their success rate was lower than pervious years (Table 1). Table 1. Harvest data for BMU 3, North Cascades, % hunter median age % female Year male female total harvest days/kill # hunters success male female harvested , , , , , , , , , , ,
159 Black Bear Status and Trend Report Anderson BLACK BEAR STATUS AND TREND REPORT: REGION 5 South Cascades Black Bear Management Unit (BBMU 4) DAVID P. ANDERSON, District Wildlife Biologist Population Objectives and Guidelines Black bears are managed in western Washington to sustain healthy populations through all bear habitats. In addition, bear populations are managed to provide recreation, reduce timber damage, property damage, and black bear/human interactions. Black bear population levels are monitored through harvest statistics (median harvest age for each sex and percentage of females in the harvest). Acceptable harvest parameters for black bears in the South Cascade Bear Management Unit (BBMU 4) are: <40% females in the harvest, with a median female harvest age of 5, and a median male harvest age of 2. Hunting Seasons And Harvest Trends In 2005, hunter success for the general black bear season in the BBMU 4 was (0.04%). This was slightly lower than reported success in 2004 (0.05%), and is a lower success rate than the majority of other bear management units in Washington. The reported 2005 general season black bear harvest in the BBMU 4 was lower than 2004, the highest reported harvest in the past ten years (Table 1). Bear hunter numbers have remained similar over the past five years. Depredation Season In addition to general season hunting, black bear depredation permits continued to be issued to landowners during 2005 to mitigate timber damage. A total of 67 bears (33 males, 13 females, 21 unknown) were taken during the 2005 season. This is similar to the 2004 harvest (n=62). The overall effect of the spring depredation permit harvest on bear populations and the benefit these hunts have in the reduction of timber damage is uncertain. In the future, a better effort should be made to document the sex all harvested bears associated with depredation. This will assist in our efforts to evaluate management goals. Population Status And Trend Analysis In 2005, the median ages of the female harvest was 6.3, which met management goals for BBMU 4 (>5). This is an improvement from the two previous years as female harvest guidelines were not met. The percentage of females in the 2005 harvest was 27% and meets the target level of less than 39% female harvest in the population Surveys No bear surveys were conducted in BBMU 4 in Bear surveys are difficult and costly and did not rank high in our prioritization of activities for Region 5 in Nuisance and Damage During the time period 1 January to 31 December 2005, enforcement officers responded to a total of 82 black bear complaints, up from 69 in The majority of these complaints were first time sightings associated with private residences. Most issues were resolved by working with landowners to reduce bear attractants (ie. garbage). Three kill permits were issued associated with these complaints. As urbanization continues to encroach on bear habitat in BBMU 4 the bear/human interactions have continued, especially in Clark and Lewis counties. Many reports from the public are of bear sightings and do not warrant further investigation. Damage to certain industrial and private timberlands continues to be addressed through the issuance of depredation permits. Many industrial timber companies, however, continue to administer feeding programs to reduce spring bear damage to young trees. Little information exists on the impact of bear feeding and the impacts to local bear populations. This issue needs further evaluation to determine the effectiveness of bear feeding stations. Habitat Condition and Trend Black bear habitat is affected by a variety of land use practices. Timber harvest in BBMU 4 has remained relatively constant on private timberlands. Timber harvest on USFS and Washington State Department of Natural Resources lands within BBMU 4 will continue to be moderate, while industrial timber harvest will continue to be high. Bear damage will continue to be an issue on industrial timberlands. Encroaching residential development, however, poses the greatest threat to black bear habitat in BBMU 4. Since 1990, the human population in the unit has increased significantly and further bear/human interactions are expected. Management Conclusions Black bear harvest numbers declined in 2005 (168) compared to peak harvest numbers in 2004 (242), (Table 1). Female harvest objectives as a percentage of the total harvest and age class were achieved in This is an improvement from previous two years and will continue 159
160 Black Bear Status and Trend Report Anderson to be monitored to determine the need for future management changes. To better evaluate black bear harvest, WDFW has attempted to increase the number of tooth samples returned from the bear harvest, particularly from bears taken during the spring depredation permit hunt. This information will improve sex/age data for bear harvest management. Habitat management trends in large-scale forest landscapes will continue to provide habitat for black bear populations in the South Cascades. Continued long-term habitat changes (i.e. human development) in the suburban/forest interface will be one negative factor that will impact future bear populations. Table 1. General season black bear harvest in the South Cascades Black Bear Management Unit, Year Male Female Total Success Hunters Days Hunted Days/Kill Table 2. Median age of black bear harvested in the South Cascades Black Bear Management Unit, Year Male Sample Female Sample Sexes Combined Sample
161 Black Bear Status and Trend Report Fitkin BLACK BEAR STATUS AND TREND REPORT: REGION 2 Okanogan Black Bear Management Unit (BBMU 5) SCOTT FITKIN, District Wildlife Biologist Population objectives and guidelines Harvest guidelines are designed to provide maximum recreational harvest opportunity and minimize nuisance and damage complaints, while maintaining population health. The Okanogan BBMU currently meets the state management plan objective of a sustainable well-distributed black bear population. Hunting seasons and harvest trends The 2005 black bear season in the Okanogan BBMU occurred between August 1-November 15. Hunters enjoyed generally favorable conditions and access remained good throughout the season. Hunter numbers improved slightly in the Okanogan Unit, yet are still only about half of what they were in 1999, the first year of the new big game hunting packages with nominal bear tag fees. Success and harvest declined in 2005 (Table 1). The harvest of 92 animals is near the 10-year average of 95. An excellent berry crop kept bears well distributed on the landscape, including back country areas. This may account for reduced success. Population status and trend analysis Bears have always been a difficult animal to survey and census. Results from recent WDFW black bear research have helped refine statewide population estimates; however, no estimate for the Okanogan BBMU exists. Harvest figures and age population parameters for harvested animals in the Okanogan BBMU suggest a relatively stable population over the last 10 years, within the context of highly variable sample data. The median age of females harvested rose in 2005, and the percentage of females harvested fell to 33%. This data suggests current harvest pressure is sustainable. Table 1. Black bear harvest, hunter effort and median age for BBMU 5. Nuisance and damage activity Wildlife officers routinely respond to complaints of bears damaging property or potentially threatening human safety near rural residences or campgrounds. The number of complaints varies from year to year as a function of weather and changes in natural food availability. Nuisance complaint levels remained fairly low in 2005, with only 21 reported in BBMU 5. A moderate winter, and an excellent crop of many shrub fruits, appeared to provide ample natural forage, and reduce the potential for bears to come into conflict with people while seeking alternative food sources. Another good berry crop in 2006 will likely keep complaint levels low again this year. Habitat condition and trend At lower elevations throughout bear range in the Okanogan BBMU, human development continually nibbles away at bear habitat, and noxious weeds continue to displace native grasses, forbs, and shrubs. The combination of these impacts is systematically reducing the quantity and quality of black bear spring and early summer habitat components. This is likely to result in increased incidence of human-bear conflict and associated control mortality. New efforts to expand off-road use on public land in the District could negatively affect the bear population. Increased motorized use on the landscape will likely increase animal disturbance, degrade habitat and increase illegal harvest. This could undo many of the habitat gains associated with many years of aggressive, wildlife-related road management by several state and federal agencies. On the other hand, successful efforts to recover wild salmonid stocks could increase the bear forage base and positively affect bear populations. Median Age Year Male Female Total # of hunters % Success Hunter Days Days / kill Males Females % females % 5, % ,153 11% 5, % ,384 6% 7, % ,047 7% 6, % % 4, % % 3, % ,514 6% 6, % ,016 2% 25, % ,153 2% 17, % ,922 6% 13, % ,039 7% 14, % ,669 5% 11, % ,551 9% 11, % ,687 5% , %
162 Black Bear Status and Trend Report Fitkin Management conclusions In general, harvest pressure appears to be stabilizing in recent years. Easing pressure in 2005 corresponded with an improvement in population parameters of females, suggesting the current harvest level is sustainable and meets WDFW guidelines Efforts to improve hunter compliance with tooth submittal for age data need to be pursued to improve sample sizes, and diligent monitoring of the long-term trends is still warranted. Threats to habitat continue, and these will affect overall carrying capacity. Effort to pursue more aggressive road management should be supported and expansion of off-road vehicle areas should be minimized and tightly managed. This is especially true for habitat at low to mid elevations containing bear spring/summer range, the time and place where bears are often most vulnerable to illegal harvest. WDFW s ongoing land acquisition in the Unit will help protect low elevation habitat and movement corridors. This program should be supported to the fullest extent possible. All WDFW lands and facilities in bear habitat that accommodate garbage disposal should be outfitted with bear proof garbage containers. In addition, existing recommendations concerning proper sanitation in bear country should be adopted as regulations and enforced. Other agencies should be encouraged to do the same. Proper sanitation will greatly reduce the potential for bears to become conditioned to human food, and reduce the potential for human-bear encounters. This will in turn reduce the number of nuisance complaints and associated expenditure of resources. WDFW now posses two state-of-the-art culvert traps for use in the North Cascades courtesy of the North Cascades Grizzly Bear Subcommittee and Technical Group. WDFW should continue to replace older style culvert traps with modern aluminum versions that minimize tooth and claw damage to captured bears. 162
163 Black Bear Status and Trend Report Patterson and McCall BLACK BEAR STATUS AND TREND REPORT: REGION 2 East Cascades Black Bear Management Unit (BBMU 6) BEAU PATTERSON, District Wildlife Biologist TOM McCALL, Wildlife Biologist Population objectives and guidelines The management objective for black bears in the East Cascades Black Bear Management Unit (BBMU 6) is to provide maximum hunting opportunity without negatively affecting the black bear population. Harvest objectives are based on criteria associated with percent females in the harvest and median ages of harvested bears (Table 1). Table 1. Guidelines for black bear harvest management. Harvest Criteria Over Acceptable Desirable %Females in harvest >40% <36%-39% <35% Median harvest age <3 Years >4 Years >5 Years Median age of males in harvest <2 Years >2 Years >4 Years Median age of females in harvest <4 Years >5 Years >6 Years Hunting seasons and harvest trends Beginning in 1999, three big game packages that included a black bear tag were offered. These packages allowed hunters to purchase a bear tag for a nominal fee, which more than tripled the number of bear hunters in 1999 (11,050) compared to the average between (3,394) (Table 2). Because there were more hunters relative to the number of bears, success decreased from 6.0 percent in 1998 to 1.0 percent in 1999 and Since the increase in 1999, bear hunter numbers declined to around 5,300 in 2001 and 2002, with further declines to 4,700 in 2003 and 2004, and 4,300 in In 2005, hunter success was 3.8 percent, down from 4.2% in The harvest of black bears in BBMU 6 ranged between 120 and 339 from 1989 to In 2005, 166 black bears were harvested, 9% below the average from (182). In 2004, the median age of males (4.5 years) and females (7 years) remained the same as the previous year; however percent females in the harvest (31%) decreased. Sex and age composition of the harvest was within the acceptable and desirable categories (Table 1). Population status and trend analysis Harvest statistics indicate the bear population in BBMU 6 is not over-harvested. The percentage of females in the harvest has averaged 31% since 1989, while the median age of male bears harvested has remained stable and female age has increased. These data suggest a stable to increasing population. Nuisance and damage activity In general, bear nuisance and damage complaints increased from 1994 to 1998, following fires that burned large areas in However, fewer damage complaints were received 1999 to 2005, despite dry summer conditions. Habitat condition and trend In 1994, fires in Chelan County reduced the amount of forage and cover for black bear. Since the fires the amount of forbs and soft mast appears to have increased, which should benefit bears. Mast is not surveyed in BBMU 6, but casual observations and reports indicate that 2005 was an average year for huckleberries and other mast. Large sections of BBMU 6 are in remote or wilderness areas where no habitat alterations occur. Forest management has not changed significantly in recent years. Localized fringe areas have seen an increase in recreational development and orchards. The orchards provide abundant soft mast but create damage situations. Management conclusions The black bear population in BBMU 6 appears to be healthy. High amounts of secure, relatively inaccessible habitat suggest the robust nature of this population will remain so under current management. Trend in age and sex composition of harvested bears will continue to be monitored. 163
164 Black Bear Status and Trend Report Patterson and McCall Table 2. Black bear harvest information and median age of black bears for Black Bear Management Unit 6, Median age No. No. No. % Hunter % females in Year males females Total hunters success days Males Females harvest , , a , , , , , , , , , , , , , , , , , , , , , , , , , , , , , , Avg a No harvest data available. 164
165 Black Bear Status and Trend Report Zender BLACK BEAR STATUS AND TREND REPORT: REGION 1 Northeastern Black Bear Management Unit (BBMU 7) STEVE ZENDER, District Wildlife Biologist Population objectives and guidelines The objective for the Northeastern Black Bear Management Unit (BBMU) 7 is to minimize threats to public safety and property damage from black bears, while at the same time maintaining a sustainable and viable bear population. Hunting opportunity is maximized consistent with statewide bear harvest guidelines and trends in depredation and nuisance complaints. Harvest guidelines are based on median ages of males and females, and percentage of females in the bear harvest. The acceptable median age parameters for harvested males and females are 2-4 years and 5-6 years, respectfully. The acceptable percentage of females in the harvest is 35-39%. Harvest Harvest % Success 12% 10% Hunting seasons and harvest trends Black bear season in the primary bear harvest units (GMUs ) of the Northeastern BBMU opened September 6, the day after Labor Day. The rest of the GMUs opened August 1, with the season in all units extending to November 15. Hunter numbers declined 7% from 2004, which continues a declining trend in bear hunters since We expect to see fairly significant swings in the bear harvest as annual wild berry and fruit production has a great effect on hunter success. The 2005 harvest of 347 black bears was well above the 2004 kill, but still 9% below the average harvest of 381 bears. Hunter success is just over the previous 4-year average at 9% (Table 1, Figure 1). 8% 6% 4% 2% 0% Figure 1. Total harvest and % hunter success, BBMU 7, % Success Median Age Males Females % Female Figure 2. Median ages of harvested bears and % female in the harvest, BBMU 7, Population status and trend analysis In the Northeastern BBMU, the median age of harvested female black bears in 2005 remained at 5 (Table 1, Figure 2); so this unit met the minimum harvest guidelines on females (>5) three out of the last three years. The median male age remained at 3 years, which is within the acceptable range of 2-4 years. The percentage of female black bears in the 2005 harvest declined to 29%; this falls below the acceptable 36%- 39% range, thus allowing for consideration of liberalizing harvest opportunity. Nuisance and damage activity WDFW officers continue to stress management of food and other attractants that cause bear/human conflicts. High risk bear incidents involving depredation on livestock, pets, or dangerous behavior toward humans are dealt with aggressively, usually resulting in the bear being shot or trapped and euthanized. Habitat condition and trend In the short-term, huckleberry and other soft mast production has been relatively good for the past 2 summers. The long-term bear habitat condition and trend appears relatively stable or improving. Several wildfires have occurred along the Kettle Range in GMU 101 since 1988 and these areas are producing good summer and fall forage for bears. Logged areas in the Calispell Range and Selkirk Range likewise are providing a mosaic of high quality forage. % Female 165
166 Black Bear Status and Trend Report Zender While humans are increasingly moving into bear habitat, people today tend to make more of an effort to avoid conflicts rather than just eliminate the bear. Conflicts with bears escalate during specific years when huckleberry production fails. Otherwise bears and humans can generally co-exist in the same habitats with help from WDFW providing educational materials, advice and intervention when necessary. Eliminating, or improved management of food attractants around residences and campsites greatly reduces the conflicts humans have with black bears. Management conclusions The percentage of females in the harvest actually exceeded management guidelines in Median ages for females and males continue to meet the minimum management guideline. For whatever reason, bear hunter numbers continue to decline; however, hunter success increased in 2005 which resulted in more bear being taken than in There has been considerable interest from sportsman s groups, and local rural landowners and their elected county commissioners, to increase pressure on the black bear population. This is generally related to anecdotal information that suggests bear sightings have increased. Some suggest management of predation on ungulates, while others want increased harvests to reduce bear numbers and minimize threats to public safety and property damage from black bears. There are also those that support conservation of black bears but also want to maximize hunting opportunity when the population can support it. With the bear harvest in BBMU 7 consistently within management guidelines WDFW has responded to these interests with limited spring bear hunting permits in select GMU beginning in A portion of the Selkirk Grizzly Bear Recovery Zone (SGBRZ) is located in the extreme northeast area of BBMU 7 in GMU 113. The primary factor impeding grizzly recovery in the SGBRZ is mortality due to shooting. Black bear hunters present a risk since they are attempting to kill bears and must be correct in their species identification 100% of the time. For this reason WDFW maintains conservative bear hunts in this area. WDFW and USFS continue to provide a proactive approach to maintaining black bear hunting in the SGBRZ through information and education to hunters via contacts with hunters in the field and presentations at Hunter Education classes and other community gatherings. Signs that provide information on species identification, bear awareness, and do s and don ts in Bear Country are posted liberally throughout much of northeastern Washington to remind hunters and campers grizzlies may be present. Table 1. Black bear harvest, hunter effort, and median age, Northeastern Black Bear Management Unit, Median Age Hunter Rept Year Male Female Total # of hunters Success Hunter Days Days per kill Males Females % Females ,055 11% 17, ,889 9% 16, ,301 10% 40, ,292 3% 92, ,538 3% 60, ,967 5% 33, ,000 9% 34, ,943 10% 32, ,405 7% 28, ,090 9% 26, % 166
167 Black Bear Status and Trend Report Fowler and Wik BLACK BEAR STATUS AND TREND REPORT: REGION 1 Blue Mountains Black Bear Management Unit (BBMU 8) PAT FOWLER, District Wildlife Biologist PAUL WIK, Wildlife Biologist Population objectives and guidelines The black bear population in the Blue Mtns. BBMU is managed to provide optimal recreational opportunity, while maintaining a healthy bear population and minimizing conflicts with the public and other resource management objectives. Hunting seasons and harvest trends Two bear hunting opportunities are offered in the Black Bear Management Unit 8 (BBMU-8). The general season ran for 69 days in 2005 (Sept. 6 - Nov. 15). A permit controlled spring bear season runs from April 15 to May 31, with 105 permits distributed between 7 game management units. In 2006, 150 permits will be distributed through the 7 GMU s, with a 50% increase occurring in each unit. The permit controlled, spring hunting season was added in 1999 in order to improve the distribution and composition of the bear harvest. Since this season was initiated, 699 permits have been issued with 438 hunters participating in the hunt. Hunters averaged 24% success, harvesting 104 bears; 74 males, and 30 females. The 2005 permit controlled, spring season produced a hunter success rate of 24%, and a harvest of 13 bears; 10 males, 3 females (Table 1 and 2). The combined harvest for the 2005 spring/fall seasons was 74 bears; 53 males, 21 females. Hunter success during the fall general season was 5%, with a harvest of 61 bears; 43 males, 18 females. The 2005 general season bear harvest is consistent with the average of 78 bears/year. The percentage of male bears in the general season harvest averaged 62% between 1992 and In 2005, males averaged 70%, which is slightly higher than the long-term average. The age of bears harvested in 2005 ranged from 0.5 years to 14.5 years. Males ranged in age from 0.5 to 14.5 with a median age of 3.5 (N = 15). Females ranged in age from 1.5 to 12.5 years with a median of 4.5 years (N = 9). Age data from appears to indicate a difference in the vulnerability of age classes of bears harvested in the spring vs. the fall hunting season (Fig. 1). Younger bears appear to be more vulnerable in the fall, and older bears in the spring. Between , 43% of the males and 48% of the females harvested in the fall were older than 4.5 years old. In the spring, 75% of the males and 76% of the females were older than 4.5years old. Also, in the spring, 33% of the males and 36% of the females were older than 10.5 years, compared to the fall when only 12% of males and 19% of females were older than 10.5 years. The difference in vulnerability between age classes in the spring and fall hunting seasons could be due to a couple of factors; 1. older bears are much more visible in the spring, and hunters more selective, and 2. young bears are more visible in the fall and hunters are less selective. Nuisance and damage The number of bear complaints received has remained fairly stable over the last few years. Habitat condition and trend The U.S. Forest Service has implemented a prescribed fire program on the Pomeroy Ranger District. Several prescribed burns have been completed. This program will help improve habitat conditions on the Forest, which will eventually benefit the bear population by increasing the forage base (i.e., huckleberry fields). A major wildfire consumed 51,000 acres of habitat in the Tucannon drainage in August of This may re-distribute some bears from the Tucannon to adjacent areas not impacted by the fire. Management conclusions The black bear population in the Blue Mountains remains at fairly high level. The Wenaha-Tucannon Wilderness and Mill Creek Watershed are remote areas that contain healthy bear populations, but receive very little hunting pressure. These areas supplement bear populations in adjacent units through emigration. Combining the general bear season with a permit controlled spring bear season enhances our ability to provide optimum recreational opportunity and a wellbalanced harvest by game management unit. 167
168 Black Bear Status and Trend Report Fowler and Wik Table 1. Black Bear General Season Harvest Summary , Blue Mtns., Washington. Bear Harvest # of hunters % Success Hunter Days Days per kill Median Age Year Male Female Total Male Female % % % % % % % % NA NA % % % % % % Table 2. Spring Bear Hunt Statistics Bear Harvest Spring Season % Male in Hv. General Season % Males in Hv. Year Permits Hunters Males Females Total Hunter Success % 71% 86% % 82% 48% % 63% 55% % 60% 64% % 87% 58% % 64% 63% % 77% 70% Total % 71% 65% AGE CLASSES OF BEAR HARVESTED BY SEASON % AGE CLASS < 4 Yrs. > 4 Yrs > 10 Yrs < 4 Yrs. > 4 Yrs. > 10 Yrs MALES FEMALES Fall Spring Figure 1. Age Classes of Bear Harvest Spring vs. Fall Hunting Season, Blue Mtns. Wash. 168
169 Cougar 169
 occur throughout most of the forested regions of Washington State,")
170 Cougar Status and Trend Report Martorello et al. COUGAR STATUS AND TREND REPORT Statewide DONALD A. MARTORELLO, Carnivore, Furbearer, and Special Species Section Manager RICH A. BEAUSOLEIL, Bear-Cougar Specialist ROCKY SPENCER, Carnivore Specialist Distribution and abundance Cougar (Puma concolor) occur throughout most of the forested regions of Washington State, encompassing approximately 88,497 km 2 or 51% of the State (Figure 1). The statewide cougar population size is unknown, however preliminary information from WDFW and studies conducted by Washington State University suggest cougar populations in northeastern Washington are declining. Population objectives and status The statewide cougar management goal is to maintain healthy, self-sustaining cougar populations within each cougar management unit (CMU), except CMU 9, while minimizing the number of negative human-cougar interactions. Within the context, the population objective for three of the nine CMUs is to reduce cougar populations to a lower, yet sustainable, level to address concerns for human safety and depredation on pets and livestock (Table 1). The methods for assessing cougar populations are in transition in Washington, largely due to better scientific data becoming available and relatively recent changes in hunting methodologies in portions of the State. The status of regional cougar populations in western and southeastern Washington are assessed using hunter effort and success data, median age data from harvested cougar, and percentage of females in the harvest. These are not ideal methods for assessing cougar populations because harvest information can be Figure 1. Distribution of cougars (gray) and cougar management units in Washington. misleading and generally are not sensitive to small-tomoderate changes in population levels, particularly over a short period of time (<3 years). Nevertheless, these parameters suggest cougar populations are relatively stable in western and southeastern Washington. In comparison, the status of cougar populations in northeastern Washington are assessed using cougar demographic data from living cougar populations, as well as the parameters from harvest data. The department invests most of our monitoring efforts on adult female cougar survival (because of it s importance to population growth) and population size. Ancillary data on litter size, cub survival, and adult Table 1. Cougar population objectives for each cougar management unit in Washington, CMU Geographic Area Population Objective 1 Coastal Maintain a stable cougar population 2 Puget Sound Reduce * cougar population to enhance public safety and protection of property 3 North Cascades Maintain a stable cougar population 4 South Cascades Maintain a stable cougar population 5 East Cascades North Reduce * cougar population to enhance public safety and protection of property 6 East Cascades South Maintain a stable cougar population 7 Northeastern Reduce * cougar population to enhance public safety and protection of property 8 Blue Mountains Maintain a stable cougar population 9 Columbia Basin Unsustainable; not considered suitable cougar habitat * Implement cougar population reductions over a 3-year period and monitor annually. 170
171 Cougar Status and Trend Report Martorello et al Female Male Unk. I-655 Banned use of dogs Harvest Level Season Figure 2. Cougar harvest composition, , Washington State. male survival are collected on an opportunistic basis. Washington State University also has provided valuable data on population growth rates from cougar research projects in northeastern Washington. These data suggest that cougar populations in northeastern Washington are declining at a rate of 22% over three years. Hunting seasons and harvest trends Cougar became a protected big game species in 1966 and hunting seasons and harvest limits were established. In 1967, the Washington State Legislature passed a bill establishing a tag system. In 1970, WDFW began mandatory reporting of cougar kills and in 1979 inspection and sealing of cougar pelts was required for data collection. In the mid-1980 s WDFW began collecting cougar teeth for age analysis (Figure 2). Since the mid-1980s, the most significant change to cougar seasons has been the passage of three legislative bills. During the November 1996 general election, Washington voters passed Initiative 655 (I- 655) that banned the use of hounds for hunting cougar and bobcat, and the use of bait and hounds for hunting black bear. In an effort to mitigate the anticipated decrease in cougar harvest (i.e., post I-655), permitonly seasons were replaced with general seasons, cougar seasons were lengthened from approximately 6 weeks to 7 and one-half months, and bag limit was increased from 1 to 2 cougar/year. Legislation was also passed that provided the authority to the Fish and Wildlife Commission to establish reduced costs for cougar and black bear transport tags, which they did from $24 to $5 in 1996 (cougar tags can also be purchased as part of a big game package). The outcome of these strategies was the number of hunters purchasing a cougar tag in Washington increased from 1,000 to ~59,000. As a result, annual cougar harvest during post I-655 years increased slightly; however, the composition of the harvest has changed dramatically. The majority of cougar harvested pre-i 655 was done so with the aid of dogs, thus mostly males and older animals were taken. From 1996 to 2000, the majority of cougars were harvested either as opportunistic encounters by deer/elk and cougar hunters, or by using tracking and calling techniques. These harvest methods are not as selective as using dogs. Therefore, hunters harvested more females and younger cougars (Martorello and Beausoleil 2003). During the 2000 legislative session, the Legislature and Governor passed Engrossed Substitute Senate Bill 5001, which allowed the use of dogs to hunt cougar, but only to address a demonstrated public safety threat and only in portions of GMUs. Following the bill, the Fish and Wildlife Commission adopted what s called public safety cougar removals. By Commission rule, permits to use dogs to hunt cougar are allocated to GMUs with 11 of more confirmed human-cougar incidents (including sightings), of which at least 4 must be threats to public safety or pets/livestock. Kills levels associated with public safety cougar removal permits 171
172 Cougar Status and Trend Report Martorello et al. have ranged from 64 cougar in 2001 to 4 cougar in During the 2004 legislative session, the Legislature and Governor passed Substitute Senate Bill 6118, creating a pilot cougar hound hunting program. Under the program, Commission rule establishes a seasons to allow licensed hunters to hunt cougar with the aid of dogs, but only for three years and only in Chelan, Okanogan, Ferry, Stevens, and Pend O reille counties. At the completion of the third year, the Department must report back to the legislature and provide a recommendation for an improved cougar management program. Under this legislation, the Fish and Wildlife Commission established four hunt zones across the five county area, each with a total kill quota and a female subquota; the kill season remains open for a zone until either the total kill quota or female subquota is reached, at which point the season becomes a pursuit-only season (unlawful to kill cougar). During the season, two of the four hunt zones reached the quota and a total of 85 cougar were harvest. Human conflict When Washington citizens were asked about their attitudes regarding cougars, over 80% responded that reducing cougar numbers for public safety is acceptable (Duda et al. 2002). Recognizing the widespread scope of the issue and its importance to cougars and people in the future, current cougar management goals include maintaining sustainable cougar populations and reducing human-cougar interactions. In some cases, reducing cougar populations to a lower, but sustainable level may help achieve both of these goals. To that end, human-cougar interactions are not only managed through public education and capture-relocation, but include capture-removal, landowner kill permits, agency kill authority, public safety cougar removals, and the pilot cougar hound hunting season. The trend in confirmed human safety incidents, and pet and livestock depredations has decreased since the recorded high of 936 in However, interactions have appeared to stabilized near 381 since 2002 (Figure 3). It s important to point out that the management actions the Department takes to manage human-cougar conflict don t necessarily equate to the observed trends in confirmed interactions. Several factors likely impact the recorded rate of human-cougar interactions, such as changing public attitudes, significant media events, cougar population size, etc. Management conclusions The cougar population appears to be declining in northeastern Washington and is unknown in the remained for the state. As such, priority should be given to determining the desired population level for Confirmed complaints Year Figure 3. Total confirmed cougar complaints in Washington, (includes confirmed human safety and pet / livestock incidents). northeastern Washington and assess the population in other portions of the state. Given the distribution of cougars in Washington and the projected growth of human populations, interactions between humans and cougars will likely continue. As such, the long-term future of cougar in Washington ultimately rests in our ability to co-exist. Therefore, management efforts should continue to look for ways to minimize human-cougar interactions, particularly at the local population level. Literature cited Duda, M. D., P. E. De Michele, M. Jones, W. Testerman, C. Zurawski, J. Dehoff, A. Lanier, S. J. Bissell, P. Wang, and J. B. Herrick Washington residents opinions on and attitudes toward hunting and game species management. Harrisonburg, Virginia, USA. Martorello, D. A., and R. A. Beausoleil Characteristics of cougar harvest with and without the use of dogs. Pages in S.A. Becker, D.D. Bjornlie, F.G. Lindzey, and D.S. Moody, eds. Proceedings of the Seventh Mountain Lion Workshop. Lander, Wyoming, USA. 172
173 Cougar Status and Trend Report Zahn COUGAR STATUS AND TREND REPORT: REGION 6 Coastal Cougar Management Unit (CMU 1) H. M. ZAHN, District Wildlife Biologist Population objectives and guidelines The goal for cougar management in the Coastal Management Unit (CMU 1) is to maintain cougar populations at a level that is both self-sustaining and consistent with human safety concerns. Hunting seasons and harvest trends The 2005 cougar season extended from August 1, 2005 through March 15, There were no permit or pursuit-only seasons. The use of hounds is not permitted in this management unit. A total of 18 cougars were reported taken during the cougar season in the Coastal Management Unit. No public safety or depredation related removals were recorded. Of 12 cougars whose sex was determined 6 were female (50%). Teeth from 17 harvested cougars (6 males, 6 females and 5 unknown sex) were submitted for aging. The ages ranged from 0.5 to 8.5 years (median 2.0 years). The 6 females ranged in age from 0.5 to 6.5 years (median 2.0 years). The 6 males ranged in age from 1.5 to 8.5 years (median 3.0 years). The relatively large yearly fluctuations in age and sex ratio parameters are likely the result of small sample sizes. Cougar harvests for CMU 1 for the period are listed in Table 1. Table 1. Cougar hunting harvest and percent females in harvest for Year Hunt Type Harvest % Females 1996 Permit Hunts Permit Hunts General Season General Season General Season General Season General Season General Season General Season General Season Median age % Year 80% 70% 60% 50% 40% 30% 20% 10% (repeated sightings in residential areas) or they may represent a potential threat to humans (close approach without fear). They may also cause depredation to livestock or pets. Management conclusions Harvest has not increased with apparent increases in cougar populations. Increasingly cougars are being killed by Fish and Wildlife Officers or by landowners in damage situations. Seasons may need to be further liberalized to increase harvest efficiency and achieve a stable cougar population. % female Males Females % Female Figure 1. Median ages and percent females of cougar harvest, Population status and trend analysis No estimate of cougar numbers is available for this unit. However indirect indications, such as humancougar interactions, suggest that cougar numbers are viable and at least stable. Most encounters are harmless in that observers have a chance encounter with a cougar in its natural habitat. There are some cases however were cougars are perceived as nuisance 173
174 Cougar Status and Trend Report Miller and Woodin COUGAR STATUS AND TREND REPORT: REGION 5 South Cascades Cougar Management Unit (CMU 4) PATRICK J. MILLER, District Wildlife Biologist ROBIN S. WOODIN, Wildlife Biologist Population objectives and guidelines Management goals for cougar populations in the South Cascades Cougar Management Unit (CMU 4) are to maximize recreational opportunities and attempt to minimize potentially dangerous cougar-human conflicts. Hunting seasons and harvest trends The cougar-hunting season was from 1 August 2005 to 15 March The bag limit was one cougar. Harvest report cards and pelt sealing records indicate that cougar harvest (Table 1.) in CMU 4 has increased since passage of Initiative 655. Harvest of 28 cougars in 2004, was an increase in comparison to the recent past and is still higher than historical records. The majority of cougars are harvested in Lewis and Skamania Counties in Region 5. The reduced fee structure and combination license structure may be encouraging more hunters to pursue cougar. Surveys Because cougars are difficult to survey and budgets are limited, no surveys for cougar were conducted in the CMU 4. Population status and trend Based upon harvest and complaint data, the cougar population in CMU 4 is thought to be stable to increasing. The relatively high harvest of female lions is becoming a concern. The prey base and habitat in the unit are well distributed and cougar are probably utilizing most, if not all, available habitat. Nuisance complaints involving cougar are increasing; fifty-eight complaints that actually involved cougars were documented in the report period. Of these complaints; 40 involved sightings of lions, 11 were depredations on livestock or pets, 6 were classed as human incidents and 1 attack was documented. WDFW officers are spending an increasing amount of time responding to cougar sightings and complaints Habitat condition and trend The major problem facing cougar in CMU 4 is the encroachment of human civilization. This trend is likely to continue, as the Region s economic prosperity continues to draw new residents. Encroaching human habitation will lead to increased human-cougar conflicts, as cougars follow the prey base into an increasingly urban environment. Management conclusions WDFW is likely meeting the management goal of maximizing recreation on cougar, but we are unable to measure the goal of minimizing human conflict. The recent high level of cougar harvest may have reached a plateau in CMU 4, indicating the modification in lawful hunting methods is having the desired effect of increasing harvest. Increasing urbanization will force cougar to utilize areas frequented by humans, leading to increased risk for public safety. Often these areas of human/cougar conflict are not suitable for hunting with traditional means. Recent legislation that allows for hound hunting in selected areas may prove a useful tool in dealing with human-cougar conflicts, if complaint levels increase. Table 1. Cougar harvest in the South Cascades Cougar Management Unit 4 (South Cascades), Year Male Female Unk Total
175 Cougar Status and Trend Report Patterson and McCall COUGAR STATUS AND TREND REPORT: REGION 2 East Cascades North Cougar Management Unit (CMU 5) Columbia Basin Cougar Management Unit (CMU 9) BEAU PATTERSON, District Wildlife Biologist TOM McCALL, Wildlife Biologist Population objectives and guidelines The East Cascades North Cougar Management Unit (CMU 5) includes the mountainous habitats within Okanogan, Chelan, and Kittitas counties, and includes Game Management Units (GMUs) 203, 209, 215, 218, 224, 231, 233, 239, , , , , and 340. The Columbia Basin CMU (9) includes most of the drier lowlands of the Columbia Basin, and includes GMUs 136, 139, 142, 248, 254, 260, 262, 266, 269, 272, 278, 284, 290, 371, 372 and 381. Management objectives for CMUs 5 and 9 are to maintain cougar populations in areas of suitable habitat, and to minimize depredation and threats to human safety by responding to cougar complaints and encouraging recreational cougar hunting. Hunting seasons and harvest trends During the last 44 years, cougar management in Washington has become more conservative. Cougar were classified as a predator and were bountied prior to Although cougar were still classified as a predator, they were not bountied from 1961 to In 1966, cougar were reclassified as a game animal, but no bag limit was imposed. In 1973, the yearly bag limit for cougar was reduced to one animal. In 1982, a special tag was required (in addition to a hunting license) to hunt for cougar. Beginning in 1987, cougar were managed as a trophy big game animal with hunting restricted to those persons drawing a limited numbers of tags. On December 5, 1996 the use of hounds to hunt for cougar was banned by public initiative. As a result, cougar tags were made available as a general license available for purchase by any hunter. In 2004, the Washington Legislature passed a law authorizing a 3-year pilot cougar hound hunting season in 5 counties (Chelan, Okanogan, Stevens, Ferry and Pend Oreille) in northeastern Washington. Implementing this new law resulted in substantial changes in cougar seasons in these 5 counties, and included the northern portion of CMU 5. As a result, the boot hunting season (without the use of dogs) was curtailed November 30 in these 5 counties, and a permit-only hunt with the use of dogs occurred from December 1 March 31, using a kill quota system. In the Chelan Hunt Zone, comprising all of Chelan County, there was a total quota of 10 and a female quota of 4. In the Okanogan Hunt Zone there was a total quota of 28 and a female quota of 11. The Okanogan Hunt Zone is comprised of those portions of GMUs 203, 209, 215, 218, 224, 231, 233, 239 and 242 within Okanogan County. Kill quotas started September 1, 2004, and include all cougars killed during seasons with and without the aid of dogs, as well as depredation permits, landowner kill permits, and WDFW kills. Hunters were required to call a telephone hotline prior to hunting, to determine whether the quota had been filled. Once a zone quota was filled, either by attaining the total quota or the female quota, the season remained open through March 31 for pursuit-only. In the remainder of CMU 5, and in CMU 9, the season remained open for general hunting without the use of dogs from August 1 to March 15. Cougar harvest in Unit was considerably higher than in the previous eight years (42-64 per year , compared with per year ; 15 year average is 36). There is no apparent trend in Unit 9 cougar harvest, although the past 5 years are 5 of the 6 lowest harvest years during the 15 year period; harvest has ranged from 1 (2002) to 25 (1994, 1995), averaging 10 annually. The 2005 cougar harvest of 45 in Unit 5 is 25% above the average annual harvest during (36), and is typical of the past 7 years harvest ( average = 50, range = 42-64); this total includes 23 general hunter harvests, 19 hound hunter harvests, 3 depredation takes, and 0 public safety removals. General hunter harvest was the same as 2004, while depredation take decreased 67% and public safety removals remained at 0. In 2005, 4 cougar were reported killed in Unit 9; however one of these was reported as a pilot cougar hound hunt harvest, so was either mis-attributed to a GMU in Unit 9, or the GMU of harvest mis-reported. During , harvest in the Columbia Basin has averaged 10, and ranged from 1 to 25 annually. Since 1991, cougar harvest in units 5 and 9 combined has averaged 46 animals annually. Total harvest over the past 15 years has been 175
176 Cougar Status and Trend Report McCall slightly skewed toward females in CMU 5 (56%), and equal in CMU 9. The 2005 harvest was slightly skewed toward males, in marked contrast to 2003, when 78% of the harvest was females. Since 1991, median age of cougar killed by unit and sex has varied from 1.5 to 6.5 years old. In 2005, the median age of tooth-aged cougar harvested was 3.5 in CMU 5 (n=29), equal to 2004; and 1.5 in CMU 9 (n=3), compared to 2.5 in Population status and trend analysis We have no population estimates for cougar in CMUs 5 and 9. Based on anecdotal reports from the public and perceptions of field personnel, cougar numbers in CMU 5 have been at a relatively high level for several years. A DNA mark-recapture study is underway, which should produce a population estimate for a portion of the population. Habitat condition and trend Loss of mule deer due to wild fire and severe winters may have indirectly affected cougars in CMU 5 from , due to reduced prey base. Since 1997, mule deer populations have increased following winter range recovery and a series of mild winters. Expanding human population is a more serious longterm threat to cougar. Increased human population results in more cougar encounters and reduced prey base. Management conclusions Washington s human population continues to grow, reducing wildlife habitat. More people and increasing development of the rural-urban interface result in increased cougar conflicts. Managing cougar populations will be even more challenging into the foreseeable future, as more people move into the wildland interface, particularly mule deer winter ranges. Implementation of the pilot hound hunt in portions of CMU 5 may explain much of the change in harvest from previous years, particularly in Okanogan County. It appears hound hunting may have reduced the need for non-hunting removals, as evidenced by dramatic reductions in depredation and public safety removal kills. Sex and age structure of the harvest also showed improvement, with a greater proportion of males harvested, and increased median age of harvested cougars. Most of the improvement in sex composition of the harvest is attributable to the hound harvest; in CMU 5, hound hunters harvested 68% males, while 55% of known sex general hunter harvest was female, similar to 2004 when general hunter harvest was 71% female and hound hunter harvest 75% male. Inferences about the influence of the pilot hound hunt on harvest demographics are preliminary and based on only two years of data; the culmination of the 3-year pilot will provide greater insights. After two years, it appears there may be positive harvest demographic benefits attributable to this new hunt structure. Table 1. Cougar harvest for Cougar Management Unit 5 (East Cascades North) and Unit 9 (Columbia Basin), Unit 5 Unit 9 Year M a F Unknown Total M F Unknown Totalmbined total Average a M = male, F = female 176
177 Cougar Status and Trend Report Bernatowicz COUGAR STATUS AND TREND REPORT: REGION 3 East Cascades South Cougar Management Unit (CMU 6) JEFFREY A. BERNATOWICZ, District Wildlife Biologist Population objectives and guidelines Management objective for East Cascades Cougar Management Unit (CMU 6) is to maintain a cougar population at a socially acceptable level while providing recreational opportunity. Hunting seasons and harvest trends Eleven cougar were taken during the season (Table 1). The reduced harvest the last few years is surprising. Snow conditions were good during the winter of for boots hunters tracking cats. The harvest has increased since 1997 when the use of dogs was prohibited and was slightly above the 10-year average. Population status and trend analysis Prior to the 1970s cougar were rare in Yakima County and no cats were reported in Klickitat County. The limited harvest and anecdotal information suggests the population has grown. In , 6 cougar were harvested in Klickitat County and complaints are increasing. Nuisance and damage activity Nuisance and damage activity in CMU 6 was low. No cougar were harvested for depredation or threats to public safety Habitat condition and trend Cougar populations in CMU 6 were probably limited more by prey base (especially deer) than habitat. The deer population reached historic lows after the winter of , especially in the northern portion of CMU 6. The deer herd is especially healthy in Klickitat County. Elk populations remain healthy. Management conclusions Data is limited on cougar in CMU 6, but suggests the population has expanded, especially in Klickitat County. Nuisance and damage complaints are low compared to other areas of the state, but are increasing. Harvest has increased since the ban on hounds for cougar hunting. The increase in percent females needs to be monitored. Table 1. Cougar harvest in CMU 6. Year Hunt Type Harvest %Females 1995 Permit Permit/General 0 NA 1997 General Season General Season General Season General Season General Season General Season General Season General Season General Season Average
178 Cougar Status and Trend Report Zender COUGAR STATUS AND TREND REPORT: REGION 1 Northeastern Cougar Management Unit (CMU 7) STEVE ZENDER, District Wildlife Biologist Population objectives and guidelines Long-term objectives are to maintain healthy cougar populations within the Northeastern Cougar Management Unit (CMU 7) while limiting numbers compatible with public safety and property protection. Current cougar population objectives for CMU 7 are to reduce cougar populations to enhance public safety and protection of property. Substitute Senate Bill 6118 was passed by the Washington State Legislature and became effective in October This legislation directed the Washington Department of Fish and Wildlife(WDFW), in cooperation and collaboration with the county legislative authorities of Ferry, Stevens, Pend Oreille, Okanogan, and Chelan counties, to establish a three-year pilot program of cougar pursuit and kill seasons with the aid of dogs within these counties. The 2005 hunting season was the second year of this hunt. Hunting seasons and harvest trends Cougar hunting opportunity for general boot (without the aid of dogs) hunters was generally restricted to the period deer and elk seasons were open in Game Management Units and 204. These are the primary cougar harvest units within CMU 7, and cover areas within the counties open to the hound hunt. Kill and Harvest Figure 1. Cougar taken by hunters, depredation, and other means, CMU 7, pursuit hunts with the aid of dogs ran from December 1 through March 31 (except January 1 in GMUs 101 & 204). Cougar harvest levels (quotas) were established by WDFW to address cougar management goals and objectives. Cougars may be hunted until the female zone quota has been killed, the total zone quota has been killed or the season ends. The kill quotas did not change from For the Ferry-Okanogan Hunt Zone the kill was not to exceed 26 total cougar or 10 females. For the Stevens Pend Oreille Hunt Zone the quota was 38 total cougar or 15 females. The cougar harvest in CMU 7 totaled 75 cougar, up 15% from the 2004 kill and down 20% from the 5-year ( ) average (Figure 1). Boot hunters took 27 cougar, hound hunters took 41 cougar, and there were 6 kills authorized by WDFW due to depredation. The cougar harvest was distributed well across the CMU. The Ferry Okanogan Hunt Zone (GMU s 101 and 204) accounted for 25 (33%) of the kills. GMUs 105 Kelly Hill and 113 Selkirk produced 10 kills each, and GMU 133 which is not in the Pilot Hound hunt area, had a surprisingly high take again in of 7, the same number taken in Population status and trend analysis We can only make some general observations from trends in hunter success and possibly age/sex ratios of harvested cougar to address the status and trend of the population. The kill increased in The quota for the Stevens-Pend Oreille Hunt Zone was met prior to the end of the hound season when the female quota (15) was reached. The total harvest for those GMUs was 36, 2 under the quota of 38. The quota for the Ferry-Okanogan Zone was not reached, as only 7 females were taken, and the total harvest was 25, 1 short of the quota of 26. The hunting opportunity appears to have been well balanced with the cougar population available and the harvest quotas allotted. The harvest by general boot hunters declined from 41 in 2003 to 27 in 2004 and was stable at 25 in This trend as well as the lower harvest success in the Ferry- Okanogan Zone suggests cougar numbers are likely being held in check with harvest management. Only 40% of the kill was female in This is a lower female percentage than any of the 9 previous years (Table 1). The increased percentage of harvest attributed to hound hunting is likely the reason. The lower quota on females encourages hound hunters to select males, as well as the fact males usually are preferred as trophies. The median age of harvested male and female cougars in the Northeastern CMU was 3 for each sex in 2005 (Figure 2). Habitat condition and trend 178
179 Cougar Status and Trend Report Zender Median Age Females Males Figure 2. Median age of harvested cougar (sample sizes range from 21-54), CMU 7, Deer populations appear to be stable at a moderate level. The mule deer harvest declined slightly in 2005 after gains for a few years. Elk populations are at all-time highs at this time. The major habitat threat to cougar populations in the Northeastern CMU is likely the continued dispersion of human residences into the once secluded forested habitats. Conflicts increase with opportunity, whether that is in the form of more cougar or more humans and their domestic animals. Management conclusions The cougar harvest in CMU 7 increased in 2005 to 75 cats killed. The harvest was still down from the high kills in the years (Table 1). The harvest by general season boot hunters has continued to decline from a high in 1999 of 97 cougar to a low in 2005 of 25 cougars, down form 27 in Boot hunting opportunity has been relatively consistent from year to year. Since 2004 it was cut off in most GMU s after November 30; however, traditionally few boot hunters have taken cats after the deer and elk seasons closed. Given the steady decline in boot hunter kills from 1999 to 2005 it would appear that the management objective to reduce cougar populations in CMU 7 has been successful. The increase in the median age of harvested cougar along with the reduced percentage of females in the kill may be an indication the population is stabilizing and management hunts are functioning well with selection of males. For most of the GMU s in the Northeastern Cougar Management Unit, the cougar harvest quota system will continue with the on-going pilot hound hunt. This effective and selective means of harvesting cougar (tracking dogs) will be available as a management tool to minimize threats to public safety and property. At the same time the quota on the female and total kill helps to ensure cougar population viability into the future. Table 1. Cougar harvest, depredation, public safety removal, and other mortality, CMU 7, (Other Take includes Public Safety Removal Harvest). Combined Harvest Female Male (Includes Unknown sex) Year Hunter Harvest Other Take Female Total Hunter Harvest Other Take Male Total Hunter Harvest Other Take Total Harvest Percent Female % % % % % % % % % % 179
180 Cougar Status and Trend Report Fowler and Wik COUGAR STATUS AND TREND REPORT: REGION 1 Blue Mountains Cougar Management Unit (CMU 8) PAT FOWLER, District Wildlife Biologist PAUL WIK, Wildlife Biologist Population objectives and guidelines The cougar population in the Blue Mtns. Cougar Management Unit (CMU) is managed to provide recreational opportunity, while maintaining a healthy cougar population and minimizing conflicts with public safety and other management objectives. The cougar population in the Blue Mountains has expanded significantly compared to the 1970 s and 1980 s. Hunting seasons and harvest trends The cougar hunting season in CMU-8 is consistent with the statewide season; Aug. 1 March 15. The bag limit for cougar remains at two per season. The cougar harvest in CMU-8 was minimal from , averaging 2.3 cougar/year. Permit controlled cougar hunting was implemented in 1987, and ran through 1997, with the cougar harvest averaging 16 cougar/year during this period. Since hunting cougar with hounds was banned by Initiative 655, the cougar harvest has averaged 15 cougar/year. Expanded hunting opportunity and a healthy cougar population have resulted in harvest levels remaining similar to the period when cougar were harvested with hounds, and under permit control. The 2005 hunting season produced a harvest of 10 cougars, which is 38% below the average of 16 per year, and 28.5% below the 2004 harvest of 14. The biggest change in the harvest since Initiative 655 has been the percentage of males vs. females in the harvest. Prior to the Initiative ( ), the harvest averaged 38% females. Between 1997 and 2001 the percentage of females in the harvest increased dramatically, averaging 70%. However, since 2001, the percentage of females in the harvest has declined dramatically, comprising only 33% of the harvest. The median age of males harvested in 2005 ((N = 4) was 2.3 years. No females were reported in the tooth harvest data. Population status and trend analysis Although the cougar harvest has declined slightly over the last few years, the cougar population in CMU- 8 appears to remain at a fairly high level compared to population levels in the 1970 s and early 1980 s. Cougar are well distributed throughout the Blue Mountains and have moved into the farmland areas and Snake River breaks where they have not been observed for 40+ years. Sightings by agency personnel and the public are quite common. During a two-week period in July 2006, one party reported six cougar feeding on a deer kill near the cabins at Twin Buttes. A cougar was reported in a tree near the state penitentiary in Walla Walla by guards. Residents on Mill Creek reported two different sightings of a large male, and a female with two kittens. A cougar was observed near Patrick Trail. These were reported sightings over a two-week period. Cougar sightings were rare in the Blue Mtns. prior to the mid 1980 s. Nuisance and damage complaints Reports of cougar near homes in rural areas and even in neighborhoods of towns are common. The number of complaints is still higher than levels that occurred years ago. Prior to 1990, cougar complaints and sightings were rare in southeast Washington. Management conclusions The cougar population in CMU-8 remains at a high level. Major prey populations, such as white-tailed deer and elk are healthy, but mule deer populations in the mountains are depressed. Cougar were absent from the Snake River breaks for many years, but healthy deer populations in this area have attracted cougar and sightings are fairly common. The cougar hunting season should remain fairly liberal in order to maximize recreation and minimize conflicts with public safety and other management objectives. 180
181 Cougar Status and Trend Report Fowler and Wik Table 1. Cougar Harvest Trend , Blue Mtns. Wash. Year Hunt Type Males Females Unk. Total % Females 1992 Permit Hunts % 1993 Permit Hunts % 1994 Permit Hunts % 1995 Permit Hunts % 1996 Permit\General % 1997 General Season % 1998 General Season % 1999 General Season % 2000 General/Damage % 2001 General/Damage % 2002 General/Damage % 2003 General/Damage % 2004 General/Damage % 2005 General/Damage % COUGAR HARVEST HISTORY BLUE MTNS. No. Harvested Figure 1. Cougar Harvest Blue Mtns. 181
182 Mourning Dove and Band tailed Pigeon 182
183 Pigeon and Dove Status and Trend Report Kraege BAND-TAILED PIGEON AND MOURNING DOVE Statewide DON KRAEGE, Waterfowl Section Manager Population objectives and guidelines Pacific Coast band-tailed pigeons and mourning doves are managed cooperatively with the U.S. Fish and Wildlife Service (USFWS) and western states through the Pacific Flyway Council (PFC). The PFC has developed management plans for these populations, and has established a population objective for bandtailed pigeons in Washington based on the WDFW call-count survey. PFC is currently working to develop a revised population objective based on the new mineral site survey. Population objectives for mourning doves are being developed as part of the national mourning dove harvest strategy. Hunting seasons and harvest trends The band-tailed pigeon season was closed in Washington from A limited season was reopened in 2002 and continued in , with season dates of September and bag/possession limits of 2/4. The mourning dove season has run September 1-15 since 1980, with bag/possession limits of 10/20. Surveys This report describes the results of band-tailed pigeon mineral site surveys completed in the summer of 2005 and mourning dove surveys completed in the late spring of The WDFW band-tailed pigeon call-count survey was initiated in 1975, and was patterned after the mourning dove survey. In 2001, USGS-BRD (California Science Center) received a grant from USFWS to design a population index survey for use throughout the range of the Pacific Coast population of band-tailed pigeons. As part of an earlier grant, USGS-BRD evaluated several population survey techniques, and found that an optimally timed mineral site survey offered statistical advantages over other surveys, including the WDFW call-count survey. A final report on the mineral site survey was completed in 2004, and coastal states adopted the new mineral site survey as the official index for this population. Based on these actions, the WDFW call-count survey was discontinued after the 2003 survey, but is presented in this report for comparison to the mineral site survey. Methods Band-tailed pigeon call-count survey. The bandtailed pigeon call-count surveys were similar to mourning dove call-count routes. A total of 50 routes, 5.7 miles in length comprised the survey, conducted in western Washington below 1,000 ft. elevation. Surveys were completed during a 16-day period beginning the Saturday closest to June 21, as designed by Jeffrey (1989). Data were sent to USGS in Laurel, MD (Bill Kendall) for analysis using route regression programs developed for the mourning dove survey (Sauer et al., 2003). Band-tailed pigeon mineral site survey. USGS conducted mineral site surveys at 8 locations in 2001 and 2002 (Overton and Casazza 2004). These included two in Region 4 (Pigeon Point and Sumas Springs), one in Region 5 (Cedar Creek), and five in Region 6 (Lilliwaup, McAllister Creek, Mud Bay, Potlatch, and Red Salmon Creek). In 2003, WDFW surveyed these same sites. In 2004, WDFW expanded surveys to 15 sites, as specified under protocols developed for the Pacific Flyway (Overton and Casazza 2004). The new sites included two in Region 4 (Lake Cavenaugh Rd.-Pefley and Warm Beach), four in Region 5 (Altoona, Newaukum River, St. Martin s Hot Springs, and Upper Kalama) and one in Region 6 (Willapa Estuary). These sites were continued in 2005, except Sumas Springs was not run to due landowner access restrictions. Cooperators from WDFW and USFWS completed surveys during the July 10-20, 2005 survey period. Mourning dove call-count survey. The mourning dove survey was completed between May 20-31, 2006 following methods in Dolton and Smith (2006). Cooperators from WDFW, USFWS, Yakama and Colville Tribes, and Chelan P.U.D completed routes. Data were sent to USFWS in Laurel, MD. Band-tailed pigeon harvest. Band-tailed pigeon hunters were required to obtain a special hunting authorization and submit a harvest report following the season. Harvest was estimated using a two-wave sampling design to account for non-response bias after Dillman (1978). Mourning dove harvest. Mourning dove harvest was estimated as part of the statewide hunter survey conducted by WDFW (WDFW 2006). Results Band-tailed pigeon call-count surveys. Past callcount survey results are presented in Table 1 and Figure
184 Pigeon and Dove Status and Trend Report Kraege Band-tailed pigeon mineral site surveys. Mineral site survey results are presented in Table 2 and Figure 1. CC INDEX MINSITE INDEX CLAL CLAR COWL GRAY JEFF KING KITS LEWI MASO PACI PIER SANJ SKAG SKAM SNOH THUR WHAT Mourning dove call-count survey. Mourning dove survey results are presented in Dolton and Smith (2006). Mourning dove harvest. As measured by WDFW surveys, harvest in 2005 was estimated at 76,914 doves, up 12% from 2004 (Figure 2). Hunter numbers were estimated at 5,596, up 4% from Number of days hunted was 15,954, up 8% from CCINDEX CCI-LONG-TERM AVE-MINSITE Harvest Hunters Figure 2. Dove harvest and hunter trends. Band-tailed pigeon harvest. Harvest and hunter activity for the seasons are summarized in Figure 3 and Table COUNTY Figure 3. Band-tailed pigeon harvest by county. Population status and trend analysis Figure 1 and Table 1 show that based on the callcount survey, the band-tailed pigeon population generally increased since The route regression method is precise in determining short-term trends, as evidenced by the large confidence intervals for the two-year trends in Table 1. The large spans of these intervals are caused by low sample size due to changing observers from year to year. The mineral site survey in exhibited the same general trend as the call-count survey (Figure 2). This rough correlation can be used in the future to develop population objectives consistent with the past Pacific Flyway management plan. The 2004 mineral site survey results point to continued increases in numbers of band-tails present during the breeding season. Based on USGS analyses, the trend for Washington showed a non-significant increase (at the 8 sites counted for multiple years) of 10%/year (Drut et al 2006). The overall trend for Pacific Coast bandtailed pigeons also indicated an increase of nearly 11.5%/year during (Drut et al 2006). References Dillman, Don A., Mail and Telephone Surveys: The Total Design Method. John Wiley & Sons, New York, New York, USA. Dolton, D. and G. Smith Mourning dove survey. USFWS, Laurel MD. Drut, M., R. Trost, and C. Overton Status of Pacific Coast band-tailed pigeons. Unpublished report. USFWS, Portland, OR. Jeffery, Robert The band-tailed pigeon in Washington. Unpublished report. WDFW, Olympia WA. Overton, C. and M. Casazza Pacific Coast mineral site survey for breeding band-tailed 184
185 Pigeon and Dove Status and Trend Report Kraege pigeons Washington. Unpublished report. USGS, Dixon CA. Sauer, J. R., J. E. Hines, and J. Fallon The North American Breeding Bird Survey, Results and Analysis Version , USGS Patuxent Wildlife Research Center, Laurel, MD. WDFW game harvest report. Unpublished report. WDFW, Olympia WA. 185
186 Pigeon and Dove Status and Trend Report Kraege Table 1. Band-tail call-count survey results - route regression method. Start Year End Year Change Lower 90% CI Upper 90% CI Routes Used Sig. level % -14.0% -2.0% 63 p< % -50.0% 75.0% 11 n.s % -11.0% -1.0% 65 p< % -49.0% 152.0% 13 n.s % -8.2% 1.4% 69 n.s % 1.4% 141.0% 24 p< % -9.8% 4.5% 70 n.s % -31.3% 55.3% 12 n.s % -6.5% 4.9% 59 n.s % 10.4% 38.2% 30 p< % -35.9% 108.7% 18 n.s % -6.0% 4.3% 62 n.s % 0.2% 17.6% 32 p< % -35.4% 6.7% 18 n.s % -5.5% 2.4% 65 n.s % -8.7% 13.0% 34 n.s % -45.8% 23.9% 11 n.s % -4.1% 3.8% 67 n.s % -11.5% 4.9% 38 n.s % -19.7% 73.1% 14 n.s % -6.2% 5.5% 70 n.s % -2.3% 14.1% 41 n.s % -12.5% 54.8% 24 n.s % -2.3% 5.7% 70 n.s % 8.0% 23.6% 44 p< % -16.6% 20.2% 36 n.s % -3.7% 5.0% 71 n.s % 2.6% 16.2% 45 P< % -27.5% 25.8% 32 n.s % -1.7% 5.4% 71 n.s % -4.8% 5.9% 48 n.s % -30.5% 40.8% 25 n.s. Table 2. WDFW Band-tail pigeon mineral site survey results. Year Altoona Cedar Cr. L. Cavenaugh Lilliwaup McAllister Mud Bay Oyster Cr. Newaukum Potlatch Red Salmon St. Martins Sumas
187 Pigeon and Dove Status and Trend Report Kraege Table 3: WA band-tailed pigeon harvest report summary NUMBER OF PERMITS ISSUED TOTAL DAYS (SUCCESSFUL) TOTAL HARVEST HARVEST BY COUNTY CLAL CLAR COWL GRAY JEFF KING KITS LEWI MASO PACI PIER SANJ SKAG SKAM SNOH THUR WHAT
188 Waterfowl 188
189 Waterfowl Status and Trend Report - Moore WATERFOWL STATUS AND TREND REPORT Breeding Populations and Production MIKAL MOORE, Waterfowl Specialist Introduction This report summarizes waterfowl productivity data collected during 2006, including breeding waterfowl populations, duck broods, pond indices, and goose nest surveys, for the State of Washington. Washington Department of Fish and Wildlife, U.S. Army Corps of Engineers, Yakama Indian Nation, Colville Confederated Tribes, Washington Waterfowl Association, and Chelan County Public Utility District contributed data. Duck Breeding Population Survey Methods Surveys are conducted annually within the seven strata in eastern Washington: West Okanogan Potholes, Omak-Douglas Potholes, Far East Potholes, Northeast, and Palouse Streams, Columbia Basin Irrigated, and Yakima Valley Irrigated (Fig. 1). Surveys are conducted on historical transects and sampling quadrats (sections or 1/4- sections; Fig. 1). Samples are multiplied by weighting factors to provide an index to the total number of breeding ducks and coots within the defined areas (Table 1). Weighting factors are determined from the proportion of areas within the strata that are sampled. Observations are treated as complete counts within sampling units (transects or quadrats) with no corrections for visibility bias. Surveys are conducted by ground counts, except helicopter counts are used for the 1/4-sections in the Desert Wildlife Area within the Columbia Basin Irrigated strata. In 1997, breeding duck surveys were initiated in western Washington using a stratified random quadrat design. Section lines define survey plots, or square mile areas, selected at random from strata delineated based on knowledge of breeding duck densities. Most areas are surveyed by helicopter. Methods for estimating total number of breeding ducks follow the Standard Operating Procedures of Aerial Waterfowl Breeding Ground Population and Habitat Surveys in North America (USFWS & CWS 1987). Breeding populations are estimated by multiplying the number of pairs, lone drakes, and flocked drakes (<5 male birds) by 2, and grouped birds (mixed or >5 males) by 1. Lone hens are multiplied by 1 for redhead, scaup, ring-necked duck, and ruddy duck only. These diver species are known to be late nesters and males significantly outnumber females. Results: Eastern Washington The 2006 index of breeding duck populations in eastern Washington was 136,516 (Table 2; Fig. 2), up 22% from 2005 and 13% below the long-term average. This represents the first year of population increase since Eastern Washington breeding waterfowl had been experiencing an average 9.3% decline during (Table 2, Fig. 2). This decline was associated with drought-like conditions in eastern Washington over the past 7 years. Gains in total duck production over 2005 levels occurred in all strata except the Northeast strata where production was 11% below 2005 population levels (Fig. 4, Table 3). This loss is related to declines in teal and ruddy duck counts. On a positive note, canvasback, gadwall, scaup, bufflehead, and wood duck breeding populations exceed long-term averages in the Northeast strata in The Palouse stratum was up 178% in total ducks over 2005, but 49% below the longterm average (Fig. 4, Table 3). Trends in the Palouse strata are closely tied to breeding mallard numbers. Most of the long-term variability in our breeding duck index has come from surveys in the Potholes area (Fig. 4, Table 3). This area has inconsistent precipitation patterns and many semi-permanent and ephemeral wetlands. In 2006, the Potholes strata supported 34% of breeding ducks in all strata, up from 31% in In 2001, the Potholes strata supported 45% of the duck production of all strata combined. Mallard populations in the Potholes strata are at the lowest level (n=6,938) since 1992 (n=5,272), and 56% below the long-term average for the strata. Species above the longterm average in the Potholes strata include gadwall, green-winged teal, northern shoveler, 189
190 Waterfowl Status and Trend Report - Moore wood duck, canvasback, ring-necked duck, goldeneye, bufflehead, and ruddy duck. The number of ducks in the Irrigated strata was up 23% from the 2005 count, and 5% above the average, the only strata to exceed the long-term average (Figs. 4 and 5, Table 3). This represents the fifth straight year of increased production in this strata possibly an indication of displacement from the Potholes strata. Species exceeding the long-term average for the Irrigated strata include mallards, gadwall, wigeon, green-winged teal, canvasback, scaup, ring-necked duck, goldeneye, bufflehead, and ruddy duck. However, long-term declines in production on the wasteways continue (Fig. 5). These declines in the wetlands associated with the wasteway systems within the Desert Wildlife Area are believed to be the result of advanced succession of wetland vegetation and the loss of open water habitats preferred by breeding ducks. Mallards numbered 45,485, up 11% from 2005, but 15% below the long-term average (Fig. 3, Table 2). Breeding mallards continue to decline in the Potholes strata, but are steady to increasing in the Irrigated strata. Mallards may have deserted the precipitation-dependent Potholes for the more predictable water levels of the Irrigated strata over the past 7 dry years. Gadwall breeding indices remain at nearrecord levels (n=17,995), 15% above 2005 levels, and 46% above the long-term average (Fig. 3, Table 2). The population growth of gadwall seems to have occurred over the past three decades. Between the 1970's and the 1990's the average number of gadwall has increased by 3.5 times with the most noticeable increases during the early 1980's. Recently, this trend may be largely attributed to the Yakima Irrigated transect, where major efforts to restore wetland function and breeding habitat are occurring, and gadwall numbers are 393% above the long-term average. Gadwall nest later in the season than Washington s other species of dabbling ducks. This strategy may pay off in the agricultural landscape if nest initiation and peak hatch occur between hay cuttings. Earlier nesting species, such as mallards and pintail, are more likely to lose nests in hay fields during the first cutting. Cinnamon and blue-winged teal have not been separated in the long-term database because of differences among observers in recording data. However, an estimated 88% of the 2006 breeding population was cinnamon teal. Historically, the proportion of cinnamon teal has increased significantly. During , cinnamon teal averaged 37% of the population dominated by blue-winged teal. But, from cinnamon teal averaged 68% of the population, and in the past six the years ( ) the average has increase to 80% cinnamon teal in the population (Fig 6). Cinnamon/bluewinged teal were the second most common breeding duck in eastern Washington until 2002 when gadwalls surpassed them in total numbers. The combined total of cinnamon and blue-wing teal are down 23% from 2005 and 66% below the long-term average (Fig. 3, Table 2). This downward trend has occurred since In the mid-1980's we had about 4.5 times as many teal as we have currently (Fig. 3, Fig. 6). Redhead numbers in 2005 were similar to 2003 and 2004 levels, rebounding 71% after Breeding redhead populations are still 44% below the long-term average. This decline is not specific to any particular strata. The combination of an extended drought and loss of suitable open water habitat in the wasteway complexes associated with the irrigation projects has limited redhead breeding habitat. Even though 2006 had favorable conditions for breeding ducks, it will take several more wet years for populations to respond. Results: Western Washington The western Washington duck surveys estimated the breeding population index for mallards at 9,349, 6% below the 2005 index and 15% below the average. The wood duck breeding index was 1924, 867% above the 2005 index, and 17% below the long-term average. (Table 4, Fig. 7). The loss of wetlands and wetland function in developing areas is the most likely cause of declining breeding duck populations in western Washington. Pond Survey Ponds are counted on 8 transects within the Potholes Area (Fig. 1) during the breeding-duck survey to index water conditions and to monitor the availability of breeding habitat (Fig. 8, Table 5). The 1997 index of 15,665 ponds was the highest ever recorded. This year (2006) the pond index was 9,590, 280% above 2005 levels, and 46% above the long-term average. This was the highest estimated pond numbers since 1999 when 11,928 ponds were estimated (Fig. 8, Table 5). Pond counts were up on all transects in the strata over the previous year. Even though the Lincoln transect was up 495% over 2005, this was only enough to equal the long-term average 190
191 Waterfowl Status and Trend Report - Moore (Table 5). The Far East transect remains below the long-term average in pond counts (-32%). Duck Production Survey (Brood Survey) Methods The same sampling transects used for breeding duck surveys are used for brood surveys in the Potholes, Palouse, and Northeast strata (Fig. 1). These surveys are conducted in late June to early July. All broods observed are recorded by species. The numbers of broods observed are multiplied by the weighting factors for each stratum to provide an index to duck production (Table 1). Average brood size is very difficult to estimate. Historic surveys in the Irrigated strata were designed to estimate average brood size. As a result the survey effort varied somewhat among years. To provide more consistency, the surveys in the Columbia Basin were redesigned in 1995 by using six sample sites to provide an index to production. However, these surveys were not performed in 2006 due to personnel limitations. Broods for most species are highly secretive and difficult to observe. The current year's growth of emergent vegetation is more developed than during breeding population surveys in May. Production surveys should be viewed as a rough estimate of production with greater value for long-term trends than for yearto-year changes. Results The 2006 duck brood production survey for the Potholes, Palouse, and Northeast strata was up 70% over 2005 and 14% below the long-term for all combined duck species (Table 6, Fig. 9). With the exception of green-winged teal (+67%), all dabbling duck brood counts were below the long-term average (Table 6). Wood duck broods were 227% above the long-term average. With the exception of redhead, scaup, and bufflehead, all diving duck brood counts were above the long-term average (Table 6). Brood production varied across the strata with annual gains in the Channeled Scablands (+62%), Okanogan (+109%), and Northeast (+31%; Table 7). Long-term gains in brood production were seen in both the Okanogan (+131%) and Northeast (+36%), but the Channeled Scablands (-80%) and Palouse (-75%) were below the long-term average (Table 7). Canada Goose Breeding Population Survey Methods Canada goose breeding populations are indexed by nest searches conducted within four major geographic areas, mainly along the Snake and Columbia rivers (Table 8). Surveys are conducted annually, biennially, or periodically. Total number of goose nest attempts found is used to index the goose breeding population. Geese are also recorded on the breeding duck surveys (see above). Geese observed during the breeding duck surveys are weighted and provide an index to the goose population (Fig. 1, Table 1). Our nest surveys are conducted on areas with high densities of nesting geese. The breeding duck surveys cover a much larger area with low densities of nesting geese. Data from both nest surveys and breeding-duck routes are interpreted together to index Washington's breeding-goose population. Areas with relatively recent goose population expansions, particularly north of Spokane are not surveyed. Geese are also counted in the western Washington breeding duck survey. Results The 2006 index of goose nests showed moderate variation across the survey area as detailed below, but overall the nest index was 2% above 2005 with no change (0%) from the long-term average (Table 9, Fig. 10). This index increased between 1982 and 1987, and has remained relatively stable since (Figs. 9 and 10, Table 9). The nest surveys in the Upper Columbia were 5% below the 2005 nesting effort and 23% below the long-term average (Table 9, Fig. 11). The reduction of numbers primarily occurred at the Wells Pool. The loss of production is partly attributed to predation by raccoons and common ravens. The total number of nests found on the Lower Columbia increased by 7% from 2005, 22% above the long-term average (Table 9, Fig. 11). The sub-area with the most consistent survey is below the I-5 Bridge to Puget Island. For this area, 422 nests were recorded in 2006, an 8% increase from 2005, 15% above the longterm average. The most recent complete count for the Snake River was in 2002 when 199 nesting attempts were recorded. This was the lowest 191
192 Waterfowl Status and Trend Report - Moore since 1999 when 187 nests were counted. It is anticipated the numbers will continue to decline from the removal of artificial nesting structures by the U.S. Army Corps of Engineers in their effort to control the urban Canada geese population in the Clarkston area. Incomplete surveys between due to changes in personnel and management priorities make population comparisons difficult. The total number of nests found in the Columbia Basin was 7% below 2005, and 1% below the long-term average (Table 9, Fig. 11). Potholes Reservoir can have a large effect on Canada goose nesting effort in the Columbia Basin because nesting conditions can change dramatically from year to year depending on water level management and human disturbance. The weighted number of geese observed during the breeding duck survey has been included in this report since 1995 (Table 9, Fig. 12). This index provides information about the expansion of Canada geese in areas of eastern Washington outside of our traditional goose nest index areas, and provides parallel results to the information obtained from the goose nest index. The 2006 index increased 48% over 2005, 82% above the long-term average. In western Washington, the population index for Canada geese was 3,169, an increase of 127% from 2005, and 17% above the 9-year average of the survey (Table 4, Fig. 13). Potential Improvements to Waterfowl Breeding and Production Surveys Expand this report to better cover western Washington Design and initiate helicopter transect surveys for breeding duck populations compatible with adjacent states and provinces. Expand databases to include older data. Explore the possibilities of including data from National Wildlife Refuges and National Forests. Clearly delineate strata and check accuracy of weighting factors and sample size. Evaluate the goose nest survey areas for accuracy of frequency and completeness of surveys. 192
193 Waterfowl Status and Trend Report - Moore Figure 2. Total breeding duck population index for eastern Washington, Total Ducks: Eastern Washington ( ) Weighted Index
194 Waterfowl Status and Trend Report - Moore Figure 3. Indices of common breeding ducks in eastern Washington, Mallard Gadwall Blue-winged/Cinnamon Teal American Wigeon Northern Shoveler Redhead Ruddy Duck Scaup
195 Waterfowl Status and Trend Report - Moore Figure 4. Weighted duck breeding population indexes by eastern Washington strata, Irrigated Weighted Index Potholes Weighted Index Palouse 7000 Weighted Index Northeast Weighted Index 195
196 Waterfowl Status and Trend Report - Moore Figure 5. Weighted duck breeding population indices for 2 transects in the Columbia Basin, Columbia Basin Irrigation Weighted Index Winchester and Frenchman Wasteways Weighted Index Figure 6. Proportion of blue-winged and cinnamon teal in eastern Washington breeding population surveys ( ). Weighted Index Blue-winged and Cinnamon Teal: Eastern Washington Blue-winged Teal Cinnamon Teal 196
197 Waterfowl Status and Trend Report - Moore Figure 7. Western Washington total population indices for breeding ducks, Figure 8. Index to pond numbers in the Potholes Strata, Weighted Index Mallard Breeding Index: Western Washington ( ) Eastern Washington Pond Index Wood Duck Breeding Index: Western Washington ( ) Figure 9. Weighted duck brood index (all species) for 3 eastern Washington strata, Weighted Index Brood Index: Potholes, Palouse, Northeast Strata
198 Waterfowl Status and Trend Report - Moore Figure 10. Total Canada goose nest attempts found on Columbia and Snake Rivers and in Columbia Basin, Total Canada Goose Nests Nest Attempts Figure 11. Canada goose nest surveys (number of nest attempts) by strata, eastern Washington, Upper Columbia River Lower Columbia River Snake River Columbia Basin
199 Waterfowl Status and Trend Report - Moore Figure 12. Breeding Canada goose index from eastern Washington breeding duck surveys, Canada Goose Breeding Index: Eastern Washington ( ) Figure 13. Breeding Canada goose index from western Washington duck surveys, Canada Goose Breeding Index: Western Washington ( )
200 Waterfowl Status and Trend Report - Moore Table 1. Breeding duck routes, weighting factors and percent of area surveyed for areas and subareas surveyed for weighting breeding duck, goose, and ponds indices in Washington. Weighting % of Total Area Subarea Survey Factor Area Sampled Potholes West Okanogan Methow Valley Salmon Creek Sinlahekin Omak Lake Douglas County Far East Potholes Ewan-Revere Sprague-Lamont Lincoln County Highland Northeast Colville Cusick Molson-Sidley Palouse Streams Union Flat Palouse River Walla Walla River Touchet River Irrigated Columbia Basin - 65 sections Wasteways a - 19 ¼ -sections Yakima - 35 sections a Surveyed by helicopter beginning in
201 Waterfowl Status and Trend Report - Moore Table 2. Weighted breeding duck population indices by species for eastern Washington ( ). Species % change from 2005 avg 2005 LTA Mallard Gadwall Wigeon Green-winged teal Bwt+cinn teal Northern shoveler Northern pintail Wood duck Redhead Canvasback Scaup Ring-necked duck Goldeneye Bufflehead Ruddy duck Merganser TOTAL Coot Canada goose
202 Waterfowl Status and Trend Report - Moore Table 3. Weighted breeding duck population indices by area for eastern Washington ( ). Year Irrigated Potholes Palouse Northeast Total Avg vs vs. LTA Table 4. Breeding waterfowl population indices for western Washington, Species Mallard Wood Duck Canada Goose avg 2006 vs vs. LTA 202
203 Waterfowl Status and Trend Report - Moore Table 5. Weighted pond index from transects within the Pothole strata, eastern Washington, Year Douglas Okanogan Omak Lincoln Far East Total Average vs % +54% +139% +495% +70% +280% 2006 vs. LTA +108% +23% +29% 0% -32% +46% field surveys were not completed; 2001 table values were determined by extending forward the 2000 values assuming no net gain in ponds. 203
204 Waterfowl Status and Trend Report - Moore Table 6. Weighted duck brood indices by species for the Potholes, Palouse, and Northeast areas of Washington, Species Average % change from 2005 Average Mallard Gadwall Wigeon Green-winged teal Blue-winged teal Cinnamon teal Northern shoveler Northern pintail Wood duck Redhead Canvasback Scaup Ring-necked duck Goldeneye Bufflehead Ruddy duck Merganser TOTAL BROODS
205 Waterfowl Status and Trend Report - Moore Table 7. Weighted duck brood indices by area for eastern Washington, Year Channeled Columbia Scabland Okanogan Northeast Palouse TOTAL Basin No survey Avg vs % % +30.6% 0% +70.2% vs. LTA -80.0% % +36.1% -75.0% -14.3%
206 Waterfowl Status and Trend Report - Moore Table 8. Goose nest surveys conducted in Washington. Year Survey Initiated Agency Conducting Survey Survey Area UPPER COLUMBIA Hanford <1974 WDFW Biennial Priest Rapids <1974 WDFW Biennial Wanapum <1974 WDFW Periodic Rocky Reach 1975 Chelan Co. PUD Annual Rock Island <1974 Chelan Co. PUD Annual Wells 1980 WDFW Annual F.D.R WDFW Periodic Rufus Woods 1981 Army Corps Annual Mouth of Yakima <1974 WDFW Biennial Average Rate of Change Per Year (% nesting attempts) Frequency of Survey % +1.8% -2.3% +1.4% -9.2% SNAKE RIVER Snake River 1975 Army Corps Annual Snake River Cliff 1979 Army Corps Periodic LOWER COLUMBIA McNary <1974 John Day <1974 Umatilla NWR Biennial Dalles <1974 Army Corps Periodic Bonneville 1982 Army Corps Periodic Tri-Cities 1982 WDFW Biennial I-5 to Bonneville 1981 Army Corps Periodic I-5 to Puget Island 1981 WDFW Annual +10.7% +8.5% -7.9% -1.0% +8.2% +18.9% +4.0% -1.2% 0 0% COLUMBIA BASIN +7.1% % % Moses Lake 1981 WDFW Biennial Potholes Res WDFW Biennial Lenore, Alkali, Park 1981 WDFW Periodic TOTAL +8.9% +1.9% -2.1% -1.0% -1.3% Geese counted on duck surveys WDFW Annual +31.9% +32.1% +7.0% +18.8% -7.2% 206
207 Waterfowl Status and Trend Report - Moore Table 9. Canada goose nest surveys in important areas of Washington, ( ) and weighted number of geese observed during duck population surveys ( ). Number of Nests Upper Snake Lower Columbia Year Columbia River Columbia Basin TOTAL Geese observed during breeding duck surveys avg vs % +25% +7.3% -7% +2% +48% 2006 vs. LTA -23% +22% +15% -1% 0% +82% 207
208 Waterfowl Status and Trend Report Moore WATERFOWL STATUS AND TREND REPORT Winter Waterfowl Populations and Harvest MIKAL MOORE, Waterfowl Specialist Introduction This report summarizes the Washington winter waterfowl surveys, waterfowl hunting regulations, waterfowl harvest, and waterfowl hunter trends. This summary compares current data with data collected over the past 25 years in the state as well as the Pacific Flyway. These data are part of a long-term database archived by the Washington Department of Fish and Wildlife (WDFW) Waterfowl Section. Several of the data sets extend back to the late 1940's. Population surveys Methods The primary survey to determine status of wintering waterfowl throughout the Pacific Flyway is the January Midwinter Waterfowl Survey (MWS). This is a coordinated, comprehensive survey of the most important waterfowl wintering areas, using a combination of standardized surveys from fixed-winged aircraft and ground observation locations. The MWS is a combined effort among several agencies, including WDFW, U.S. Fish and Wildlife Service, and Canadian Wildlife Service. Because the MWS does not capture migration peaks or patterns of habitat use throughout the fall/winter, additional fixedwing and ground surveys take place in key wintering areas from October March. Specific age structure surveys also take place in the north Puget Sound area for snow geese, brant, and swans, along standard ground observation routes. Midwinter Waterfowl Survey Results WDFW and U.S. Fish and Wildlife Service (USFWS) personnel completed the MWS in January Washington s midwinter index for total waterfowl and coots was estimated at 1,108,267, a decrease of 6% from the previous year and 11% above the 10-year average ( ; Table 1). The Pacific Flyway midwinter index for total waterfowl was 7.23 million waterfowl for a 3.5% decrease from 2005 (7.49 million), 14.2% above the 10-year average (6.33 million; ), and 9.4% above the long-term average (6.62 million; ). The midwinter indices for total ducks in the 11 Pacific Flyway states was 5.67 million (Fig.2), down 1.7% from the count (5.76 million), but 12.1% above the 10-year average (5.05 million; ), and 0.4% below the long-term average (5.69 million; ). In Washington, the total duck population was 834,614, down 12.8% from levels of 956,979, but 7.3% above the 10-year average (Fig. 3). The Washington total duck count represents 14.7% of the Pacific Flyway wintering population, 1.3% below the state s 10-year average of 16.0% (Fig. 4). The mallard total for the Pacific Flyway was 1,091,811, down 19.6% from 2005, 14.7% below the 10-year average ( ), and 33.1% below the long-term average ( ). The total number of mallards counted in Washington was 374,881, a decrease of 20.3% from the 208
209 Waterfowl Status and Trend Report Moore previous year, and 15.9% below the 10-year average (Table 1). Washington holds a high percentage of the Pacific Flyway mallard population with a 10-year average of 34.8% (Fig. 5). Canada geese are often not well represented in midwinter surveys as they forage in widespread agricultural areas, making them difficult to locate during aerial surveys. The highest MWS counts of Canada geese occurred in the 1990s when wintering geese first numbered over 400,000. The highest count on record is the survey when 498,026 Canada geese were recorded. In , the flyway count of 428,235 was 2.9% above the previous year s count, and slightly above (0.9%) the 10-year average. The number of Canada geese wintering in Washington has been variable over the past 20 years. Canada geese numbered over 90,000 during the winter of and In 2006 the total was 45,857 for an increase of 4% from 2005, but 33% below the 10-year average (Table 1, Fig. 6). No explanation can be provided for the survey variability, but may be related to survey conditions or indicative of shifting wintering sites of geese within the flyway. The northern population of snow geese from Wrangel Island, Russia that overwinter in Skagit, Snohomish, and Island counties of NW Washington and the Fraser River Delta, B.C. have had good reproductive success in recent years. Favorable weather conditions and low predation levels on Wrangel Island during the nesting season are contributing to an increasing population. Midwinter snow geese from aerial photo counts by Canadian Wildlife Service in February 2006 numbered 80,060, all of which were in Skagit County. This represents a 17.5% increase over the December 2004 count of 68,141 snow geese, 26.7% above the 10-year average. (Table 1. Fig. 7). During , the Skagit Valley snow goose populations averaged 21.5% juveniles per year compared to 12.8% in 2004 and 15.3% in 2005, indicating a couple years of relatively reduced production or juvenile survival. However, the 2006 survey consisted of 39% juveniles, suggesting no long-term decline in productivity. The number of brant counted in Washington during the 2006 midwinter survey was 16,305, a 14% increase from 2005, and 35% above the 10-year average (Table 1, Fig. 8). The number of brant counted during the North Puget Sound midwinter aerial survey on January 10, 2006, was 11,370, with 9,495 in Skagit County (considered to be all Western High Arctic (WHA) brant; Table 2). However, color composition surveys were discontinued in The 2006 northern Puget Sound (Skagit, Whatcom, and Snohomish counties) trumpeter swan MWS totaled 5,469 (Table 2), or 4.8% above the 2005 count of 5,217. The 2005 and 2006 counts are the highest total count recorded in Washington. The previous high was in 2002 when 4,343 trumpeter swans were recorded. Juveniles accounted for 19.4% of the 2006 population (Table 2), slightly above the average of 15.7%. The northern Puget Sound tundra swan mid-winter population from to has averaged about 1,900 birds per year. The 2006 count of 2,267 was similar to the 2005 survey of 2,547, both noticeably higher than the average. Juveniles represented 14.5% of the population (Table 2). The average juvenile percentage of tundra swans in this survey is about 13%. Since 1999 trumpeter swans and, to a lesser degree, tundra swans wintering in northwestern Washington and southwestern 209
210 Waterfowl Status and Trend Report Moore British Columbia have experienced high rates of mortality due to ingestion of lead shot pellets. Of the 1,719 carcasses collected from , the majority of deaths were lead-related (77%). From , a total of 315 trumpeter and tundra swans were trapped and blood samples collected for lead residue analysis. Trumpeter swans were outfitted with VHF radio transmitters (n=243) or satellite transmitters (n=6); 61 tundra swans were fitted with neck collars. Locations of radiotagged swans were used to identify primary forage and roosting areas. Judson Lake, on the Washington/British Columbia border, was identified as a potential source of lead shot ingestion. During the winter of , hazing activities will be used to discourage swans from using the lake. Periodic Aerial Survey Results Aerial waterfowl surveys in northern Puget Sound were accomplished by WDFW, and surveys in the Columbia Basin were conducted cooperatively between USFWS and WDFW (Table 2). The highest count in the North Columbia Basin during occurred during January with 259,692 total waterfowl (including coots), however no December survey was flown. For the South Columbia Basin the highest count was in January with 207,675 total waterfowl; no October or December flights took place. The highest count in northeastern Puget Sound occurred during the December survey with 372,305 total dabbling ducks (Table 2); no October or November surveys took place. Hunting Season Regulations The waterfowl harvest was conducted under Washington State regulations (Table 3). Substantial waterfowl populations in the Pacific Flyway over the last 8 years have allowed for liberal seasons and bag limits (Table 4). The federal framework allowed the maximum (107 days) number of days under the Migratory Bird Treaty. Washington s season length was 105 days statewide with two additional days for the statewide Youth Hunt on Sept The season for canvasback was restricted to 62 days. (Tables 3 & 4). For the first time since the season, the pintail season was liberalized from 62 to 107 days. The scaup bag limit was reduced from 4 to 3. The daily bag-limit was 7 ducks, to include not more than with 2 hen mallards, 1 pintail, 3 scaup, 1 canvasback, 2 redheads, 1 harlequin, 4 scoters, and 4 long-tailed ducks (Table 3). The season lengths between and were the most restrictive since Current regulations are among the most liberal ever offered in Washington. (Table 4). WDFW instituted a new license format for the hunting season. A small game license and big game license replaced a general hunting license. For people who hunted a variety of small game species, there was little change in total costs. For people who hunted waterfowl exclusively, the new format resulted in an increase in cost. For the hunting season, the Washington Migratory Bird Stamp increased from $6.00 to $ The federal migratory bird stamp remained at $ (Table 4). Goose hunting regulations have been dynamic in recent years. Changes have resulted from efforts to protect declining populations of Canada goose subspecies, increase recreational opportunities on expanding populations of Canada geese, simplify regulations, and address damage/nuisance complaints. For the season, the cackling Canada goose bag limit was reduced from 4 to 2. White goose bag limits were liberalized from 3 to 4. The November brant season was eliminated, 5 days were added to the January season, and 210
211 Waterfowl Status and Trend Report Moore the resulting 10 days were split between Skagit and Pacific counties (Table 3). The number of goose management areas remained at 5 for (Fig. 1). Harvest surveys Methods Harvest estimates were based on the Game Harvest Questionnaire sent to 10% of the hunting license buyers. Hunters were asked to report the numbers of ducks and geese they harvested by counties. The species composition of the waterfowl harvest was derived from a Daily Waterfowl Harvest Report Card Survey. In this survey, cards were sent to waterfowl hunters prior to the start of the season to record the species of the birds they bagged. These data were used to tabulate the species composition of the waterfowl harvest (Table 5). The brant and snow goose harvest is estimated annually using a mandatory harvest report card for each species. Written authorization and harvest reports have been required of brant hunters in all hunt areas since 1990 and snow goose hunters in the primary harvest area (Skagit, Island, Snohomish counties) since Hunters must return a harvest report card in order to be included in the permit mailing the following year. Harvest reports returned by the deadline are included in the analysis as the first wave of respondents, and reminder postcards are sent out to those not returning reports by the deadline. Responses from the postcard reminder are included as the second wave and then the harvest estimates are computed accounting for the non-response bias. The harvest of dusky Canada geese is determined at mandatory hunter check stations in southwest Washington, summarized in a separate report. To more closely monitor the harvest of sea ducks, written authorization was required for all persons hunting sea ducks (harlequin, scoter and long-tailed duck) in Western Washington starting with the season. Hunters were required to report harvest by species and county with mandatory harvest report cards by February 15, Hunters failing to comply with reporting requirements were ineligible to participate in the season. Harvest Survey Results The Washington duck harvest of 411,772 was 11.5% higher than the harvest of 369,457. The lowest recorded harvest was the season when 242,516 ducks were harvested (Fig. 10). The duck harvest in Washington declined steadily from over 1,000,000 in the late 1960's, to the low of 242,516 in Since that time there was a slow and gradual increase until the season. The harvest has then declined an average of 4.4% over the past 5 years. Mallards made up 56.0% of Washington s harvest, followed by American green-winged teal (12.7%), American wigeon (10.9%), northern pintail (3.9%), ring-necked duck (3.6%), and gadwall (3.2%; Table 5). The total Canada goose harvest for was 43,312, a 70.0% increase from the record low harvest of 25,479. During recent years, local production of large Canada geese increased in Washington and has contributed to the increased harvest during the period from 1987 to 2001 (Fig. 12). The harvest of large Canada geese dropped an average of 21.8% per year during (Fig. 12). However, the harvest of large Canada geese in represented a 111.3% increase over the previous year and the first increase in harvest since the season. There are no obvious explanations for the overall decline in harvest, but it may indicate the 211
212 Waterfowl Status and Trend Report Moore production of large geese within the state has peaked. It may also represent the local Canada goose s decreased exposure to hunting in urban and suburban habitats. The harvest of small Canada geese declined from a record high of 47,270 in to a low of 8,880 in This year s harvest of 13,039 (Fig. 11) is up 16.9% from the harvest of 11,153. The reasons for the decline in small goose harvest are also uncertain. A shift in wintering areas may be occurring from central Washington to the mouth of the Columbia and Willamette Valley. Unfortunately, population trends in Washington's small Canada geese have not been well documented. Banding information is minimal and aerial surveys are logistically difficult. The waterfowl harvest is summarized by WDFW administrative regions (Table 7, and Fig. 11). Except for the season, when Regions Two, Three and Four shared equal percentages (23.0%) of the harvest, Region Two has traditional represented the highest percentage of the state s harvest. This was again the case for the season when Region Two had 27.7% of the harvest followed by Region Four (26.3%), Region Three (18.5%), Region Six (10.7%), Region One (9.7%) and Region Five (7.1%). The pre-season count of brant in Padilla/Samish/Fidalgo Bays was above the threshold of 6,000 allowing the hunting season to remain open in Skagit County. The resulting state harvest of brant was 557, a 43.2% increase over the harvest of 389 (Fig. 13, Table 8). Between 1994 and 2004, the brant harvest ranged from a high of 1,534 in 1996 to a low of 60 brant in 2002 (Table 8), for a 10-year average harvest of 574 ( ). The season was closed from 1983 to The snow goose harvest in Washington is highly variable (Table 9, Fig. 14). It was on a negative trend during the mid-1980's and early 1990 s. However, the harvest of snow geese increased and stabilized over the past since 1993 with an average harvest of 1,943 (Fig. 14). The harvest in 2005 was 6,792, a 214.4% increase over the 2004 harvest of 2,160. This is partially attributable to an increase of 12,000 snow geese in the Skagit-Fraser area, increased numbers of juveniles, and the increased bag limit on white geese. The harvest of snow geese in northern Puget Sound is weather dependent. Cold and windy weather forces geese from estuaries to forage inland where they are more vulnerable to hunters. This factor, as well as proportion of juveniles, may be of greater importance to harvest than total abundance, because the erratic annual harvest (Fig. 14) does not follow the number of geese counted in Washington during the MWS (Fig.7). The sea duck harvest survey, based on the second year of mandatory harvest report cards, indicated a total harvest of 1,928 (Table 6). The harvest was dominated by surf scoters (65.6%), followed by white-winged scoters (14.9%), longtailed ducks (7.2%), black scoters (6.4%), and harlequin ducks (5.9%). From a total of 1,359 authorizations, it was estimated that 408 hunters were successful and hunted a total of 890 days. The harvest was reported from 11 counties with Island County reporting 32.0% of the harvest followed by Skagit (18.8%) and Mason County (16.2%). Hunter Numbers The Washington hunter survey is used to estimate the number of waterfowl hunters in the state. During the season, an estimated 25,156 hunters participated in the Washington waterfowl season (Fig. 15). This represents the first year an increase in participation was seen since the season. The decline in waterfowl hunters 212
213 Waterfowl Status and Trend Report Moore follows a slight increase of hunters through the 1990 s. Prior to that, there was a steady decline in hunters through the 1980's (Fig. 15). The estimated average number of ducks harvested per hunter in was 16.4, the highest average on record since the 1960s (Fig. 16). Hunter success, based on ducks harvested per hunter per year, has been on an upward trend since the mid- 1990s (Fig. 16). Therefore, it appears the downward trend in duck harvest (Fig. 10) is largely a result of hunter numbers (Fig. 15) and not decreased annual hunter success (Fig. 16). The high success rate may indicate that we have retained the most avid and successful waterfowl hunters. Members of the hunting public often believe the decline in hunter numbers is a result of the restrictive regulations that began in the mid-1980's (Table 4). This may have contributed to the reduced hunter participation (Fig. 15), but the downward trend in hunter numbers began in the early 1980's when there was a 7 duck daily bag limit, no special restrictions on mallards and pintails, and season lengths were 93 west and 100 east (Table 4). The downward decline in hunter numbers is likely a result of changes in social views on hunting and lack of recruitment of new hunters. The quality of waterfowl hunting opportunities in Washington is good. Decreased hunter numbers result in lower hunter densities in the field and success has remained stable to increasing. In addition, the state is holding a large percentage of the Pacific Flyway's ducks. Urban encroachment in traditional hunting areas will be one of the biggest challenges faced by waterfowl hunters and managers. Regardless, the value of Washington s waterfowl resources remains high and provides quality hunting recreation for the state s hunting population. We have recognized a decline of quality hunting opportunities found on public hunting areas, and for the first time, starting with the season, have implemented a pilot Quality Hunt Area (QHA) on the Desert Wildlife area in Grant County. It is designed to limit hunter density and hunting intensity with restrictions on number of hunting parties (5 party maximum), hunting days (Wed. Sat. & Sun) and hunting hours (a.m. shooting hours until noon). Additional QHAs are in the process of development, including the Frenchman Ponds QHA, scheduled to open for the season. RECOMMENDATIONS Include update on Columbia Basin Waterfowl Management Plan for report, including evaluation of reserves and trends in field corn availability. Monitor and evaluate success of quality hunt areas and snow goose quality hunt. Evaluate success of swan hazing activities 213
 Total Ducks in the Pacific Flyway Thousands 1600 1400 1200 1000 800 600 400 200 0 Fig. 3.")
214 Waterfowl Status and Trend Report Moore Fig. 1. Washington Goose Management Areas. Millions Fig. 2 Midwinter Inventory (MWS) Total Ducks in the Pacific Flyway Thousands Fig. 3. Washington MWS: Total Ducks % 30% 25% 20% 15% 10% 5% 0% Fig. 4. Proportion of Pacific Flyway ducks in Washington during MWS 60% 50% 40% 30% 20% 10% 0% Fig. 5. Proportion of Pacific Flyway mallards in Washington during MWS
DMU 008 Barry County Deer Management Unit
 DMU 8 Barry County Deer Management Unit Area Description The Barry County Deer Management Unit (DMU) 8 is in the Southwest Region and was once part of the Bellevue deer management unit 38. Bellevue DMU
ALTERNATIVE DEER MANAGEMENT PLAN FOR GAME MANAGEMENT UNITS. 12A, 12B, 13A, 13B, 16A, 45A, 45B, 45C, and White-tailed Deer Units
 ALTERNATIVE DEER MANAGEMENT PLAN FOR GAME MANAGEMENT UNITS 12A, 12B, 13A, 13B, 16A, 45A, 45B, 45C, and White-tailed Deer Units Arizona Game and Fish Department April 4, 2006 Alternative Deer Management
Deer Management Unit 252
 Deer Management Unit 252 Geographic Location: Deer Management Unit (DMU) 252 is 297 miles 2 in size and is primarily in southeastern Marquette, southwestern Alger and northwestern Delta County. This DMU
DMU 065 Ogemaw County Deer Management Unit
 DMU 065 Ogemaw County Deer Management Unit Area Description Ogemaw County Deer Management Unit is in the Northern Lower Peninsula Region (NLP). It has roughly 99,000 acres of public land which is about
DMU 038 Jackson County
 DMU 038 Jackson County Area Description The Jackson Deer Management Unit (DMU), or DMU 038, lies in the Southern Lower Peninsula (SLP) region and covers Jackson County. The DMU consists of five percent
Deer Management Unit 152
 Deer Management Unit 152 Geographic Location: Deer Management Unit (DMU) 152 is 386 miles 2 in size and is primarily in southwestern Marquette County. This DMU falls within the moderate snowfall zone and
Deer Management Unit 122
 Deer Management Unit 122 Area Description DMU 122 is located in south Dickinson County and includes a small portion of west central Menominee County. It encompasses 163 sq. miles and has remained unchanged
Cariboo-Chilcotin (Region 5) Mule Deer: Frequently Asked Questions
 Mule Deer: Frequently Asked Questions") Harvest Cariboo-Chilcotin (Region 5) Mule Deer: Frequently Asked Questions A number of questions and concerns have been expressed from resident hunters about the change in the mule deer hunting regulations
Harvest Cariboo-Chilcotin (Region 5) Mule Deer: Frequently Asked Questions A number of questions and concerns have been expressed from resident hunters about the change in the mule deer hunting regulations
Deer Management Unit 127
 Deer Management Unit 127 Area Description Deer Management Unit (DMU) 127 is 328 sq. miles in size and is found in far western Gogebic County surrounding Ironwood, Bessemer and adjacent rural communities.
Deer Management Unit 255
 Deer Management Unit 255 Area Description DMU 255 is located primarily in northern Menominee County, but also extends into a small portion of Dickinson, Marquette, and Delta counties. It has totaled 463
021 Deer Management Unit
 021 Deer Management Unit Geographic Location: Deer Management Unit (DMU) 021 is 1,464 square miles in size and is located in the central Upper Peninsula (UP). This DMU is dominated by publicly owned land
DMU 361 Fremont Deer Management Unit Newaygo, Oceana, N. Muskegon Counties
 DMU 361 Fremont Deer Management Unit Newaygo, Oceana, N. Muskegon Counties Area Description The Fremont Deer Management Unit (DMU 361) was established in 2013. It lies within the Southwest Region and covers
Deer Management Unit 249
 Deer Management Unit 249 Geographic Location: DMU 249 lies along the Lake Michigan shoreline and is comprised largely of Mackinac and Chippewa counties with a small portion of southeastern Luce County
DMU 005 Antrim County Deer Management Unit
 DMU 005 Antrim County Deer Management Unit Area Description Antrim County Deer Management Unit is in the Northern Lower Peninsula Region (NLP). It has roughly 74 square miles (47,451 acres) of public land
DMU 072 Roscommon County Deer Management Unit
 DMU 072 Roscommon County Deer Management Unit Area Description Roscommon County Deer Management Unit is in the Northern Lower Peninsula Region (NLP). It has roughly 205,000 acres of public land which is
Job Title: Game Management, Subsection B Game Management Mountain Lion. SPECIES: Mountain Lion
 SPECIES: Goal: Manage the mountain lion population, its numbers and distribution, as an important part of Arizona s fauna and to provide mountain lion hunting recreation opportunity while maintaining existing
DMU 046 Lenawee County Deer Management Unit
 DMU 046 Lenawee County Deer Management Unit Area Description The Lenawee Deer Management Unit (DMU), or DMU 046, lies in the Southeastern Lower Peninsula (SLP) region and covers Lenawee County. The majority
Job Title: Game Management, Subsection B Game Management Mountain Lion
 Job Title:, Subsection B Goal: Manage the mountain lion population, its numbers and distribution, as an important part of Arizona s fauna and to provide mountain lion hunting recreation opportunity while
ARIKAREE DEER HERD MANAGEMENT PLAN
 ARIKAREE DEER HERD MANAGEMENT PLAN DATA ANALYSIS UNIT D-55 Game Management Units 101 & 102 January 2006 Marty Stratman Colorado Division of Wildlife Terrestrial Biologist 122 E. Edison St. Brush, CO 80723
5/DMU 069 Otsego County Deer Management Unit
 5/DMU 069 Otsego County Deer Management Unit Area Description The Otsego County Deer Management Unit (DMU 069) is in the Northern Lower Peninsula Region (NLP). It has roughly 159 Square miles (101,800
DMU 056 Midland County Deer Management Unit
 DMU 056 Midland County Deer Management Unit Area Description The Midland County Deer Management Unit (DMU) 056 is in the Northern Lower Peninsula (NLP) Region. It has roughly 333, 440 acres and consists
Kansas Deer Report Seasons
 Kansas Deer Report 215-16 Seasons I. Current Harvest Hunter harvest of deer during the 215-16 seasons was estimated to be 95,813, 2.% more than the 93,94 deer taken in 214-15 (see table below for breakdown
DMU 053 Mason County Deer Management Unit
 DMU 053 Mason County Deer Management Unit Area Description Mason County Deer Management Unit is in the Northern Lower Peninsula Region (NLP) on the Lake Michigan coast. Only 17% of the land base is public
Job Title: Game Management, Subsection B Game Management Mountain Lion. SPECIES: Mountain Lion
 SPECIES: Goal: Manage the mountain lion population, its numbers and distribution, as an important part of Arizona s fauna and to provide mountain lion hunting recreation opportunity while maintaining existing
DMU 419 Clinton, Eaton, Ingham, Ionia, and Shiawassee Counties
 DMU 419 Clinton, Eaton, Ingham, Ionia, and Shiawassee Counties Area Description Deer Management Unit (DMU) 419 is in the Southern Lower Peninsula Region (SLP). It consists of Clinton, Eaton, Ingham, Ionia,
Deer Management Unit 349
 Deer Management Unit 349 Geographic Location: DMU 349 lies along the lake Michigan shoreline and is largely comprised of western Mackinac county with small portions of southern Luce county and southeastern
NEVADA DEPARTMENT OF WILDLIFE HARVEST MANAGEMENT GUIDELINES FOR HUNTING SEASONS
 NEVADA DEPARTMENT OF WILDLIFE HARVEST MANAGEMENT GUIDELINES FOR HUNTING SEASONS Draft Page 2 of 15 TABLE OF CONTENTS Schedule for formulating harvest management guidelines..............................................
DMU 024 Emmet County Deer Management Unit
 DMU 024 Emmet County Deer Management Unit Area Description Emmet County Deer Management Unit is in the Northern Lower Peninsula Region (NLP). It has roughly 126 square miles (80,371 acres) of public land
DMU 073 Saginaw County Deer Management Unit
 Area Description DMU 073 Saginaw County Deer Management Unit The Saginaw County Deer Management Unit (DMU 073) is located in the Southern Lower Peninsula in the Saginaw Bay region of Wildlife Division
DMU 006 Arenac County Deer Management Unit
 DMU 006 Arenac County Deer Management Unit Area Description The Arenac County Deer Management Unit (DMU) 006 is in the Northern Lower Peninsula (NLP) Region. It has roughly 248,320 acres and consists of
DMU 047 Livingston County Deer Management Unit
 DMU 047 Livingston County Deer Management Unit Area Description The Livingston Deer Management Unit (DMU) lies in the Southern Lower Peninsula (SLP) region and covers only Livingston County. Most public
RANCHING Wildlife. Texas White-Tailed Deer 2017 Hunting Forecast
 RANCHING Wildlife Texas White-Tailed Deer 2017 Hunting Forecast During most summers, I take a short break and head to Colorado, Wyoming, or somewhere out west to enjoy a respite from the hot South Texas
NORTH TABLELANDS DEER HERD MANAGEMENT PLAN
 NORTH TABLELANDS DEER HERD MANAGEMENT PLAN DATA ANALYSIS UNIT D-5 Game Management Units 87, 88, 89, 90, & 95 November 2007 Marty Stratman Colorado Division of Wildlife Terrestrial Biologist 122 E. Edison
Life history Food Distribution Management... 98
 BEAR: Table of Contents Overview Life history... 97 Food... 97 Distribution... 98 Management... 98 2010 Statistical Reports Controlled spring bear season harvest... 100 General season black bear harvest...
DMU 043 Lake County Deer Management Unit
 DMU 43 Lake County Deer Management Unit Area Description Lake County Deer Management Unit is in the Northern Lower Peninsula Region (NLP). It has approximately 2, acres of public land which is about half
DMU 040 Kalkaska County Deer Management Unit
 DMU 040 Kalkaska County Deer Management Unit Area Description The Kalkaska County Deer Management Unit (DMU 040) is in the Northern Lower Peninsula Region (NLP) (Figure 1). It has roughly 170,000 acres
Full summaries of all proposed rule changes, including DMU boundary descriptions, are included in the additional background material.
 The Florida Fish and Wildlife Conservation Commission (FWC) implemented a public outreach and input process in 2013 and 2014 in management Zones A, B and C. The goal of this process was to present the
Mule Deer. Dennis D. Austin. Published by Utah State University Press. For additional information about this book
 Mule Deer Dennis D. Austin Published by Utah State University Press Austin, D.. Mule Deer: A Handbook for Utah Hunters and Landowners. Logan: Utah State University Press, 2010. Project MUSE., https://muse.jhu.edu/.
FISH AND WILDLIFE BRANCH NATURAL RESOURCES DIVISION DEPARTMENT OF ENERGY AND RESOURCE DEVELOPMENT
 216 FISH AND WILDLIFE BRANCH NATURAL RESOURCES DIVISION DEPARTMENT OF ENERGY AND RESOURCE DEVELOPMENT www.gnb.ca/erd/naturalresources MOOSE HARVEST REPORT 216 Summary Each year, moose licence quotas are
2008 & 2009 Big Game Hunting Regulations Proposal Information
 2008 & 2009 Big Game Hunting Regulations Proposal Information TAG PROPOSALS, expect minor changes due to rounding, corrections and changes Table 1. Summary of controlled hunt tag numbers. Proposed *Percent
DMU 057 Missaukee County Deer Management Unit
 DMU 057 Missaukee County Deer Management Unit Area Description Missaukee County Deer Management Unit is in the Northern Lower Peninsula Region (NLP). It has over 100,000 acres of state land, just over
White-Tailed Deer Management FAQ
 December 6 th, 217 Ministry of Forests, Lands, Natural Resource Operations and Rural Development White-Tailed Deer Management FAQ What are current white-tailed deer management objectives in the Kootenay
Minnesota Deer Population Goals. East Central Uplands Goal Block
 Minnesota Deer Population Goals East Central Uplands Goal Block Minnesota DNR Section of Wildlife, 2015 Final Deer Population Goals Block 4: East Central Uplands The following pages provide a description
2015 Deer Population Goal Setting
 Deer advisory team recommendations Block 4: East Central Uplands The following pages represent deer population goals recommended by the 2015 deer advisory team for Block 4: East Central Uplands (permit
Job Title: Game Management, Subsection B Game Management Mountain Lion. SPECIES: Mountain Lion
 SPECIES: Goal: Manage the mountain lion population, its numbers and distribution, as an important part of Arizona s fauna and to provide mountain lion hunting recreation opportunity while maintaining existing
DMU 332 Huron, Sanilac and Tuscola Counties Deer Management Unit
 DMU 332 Huron, Sanilac and Tuscola Counties Deer Management Unit Area Description The Greenleaf Deer Management Unit (DMU 332) lies in the Southeast Region of the Southern Lower Peninsula (SLP) and covers
DRAFT ARIKAREE DEER HERD MANAGEMENT PLAN
 DRAFT ARIKAREE DEER HERD MANAGEMENT PLAN DATA ANALYSIS UNIT D-55 Game Management Units 101 & 102 June 2017 Marty Stratman Colorado Division of Parks & Wildlife Terrestrial Biologist 122 E. Edison St. Brush,
IN PROGRESS BIG GAME HARVEST REPORTS FISH AND WILDLIFE BRANCH Energy and Resource Development
 BIG GAME HARVEST REPORTS 217 IN PROGRESS FISH AND WILDLIFE BRANCH Energy and Resource Development http://www2.gnb.ca/content/gnb/en/departments/erd.html MOOSE HARVEST REPORT 217 Summary Each year, moose
2017 LATE WINTER CLASSIFICATION OF NORTHERN YELLOWSTONE ELK
 2017 LATE WINTER CLASSIFICATION OF NORTHERN YELLOWSTONE ELK A collaborative survey by the Northern Yellowstone Cooperative Wildlife Working Group Report Prepared by: Karen Loveless, Montana Fish Wildlife
Confederated Tribes of the Umatilla Indian Reservation -- Cayuse, Umatilla, and Walla Walla Tribes
 2018-2019 Treaty Hunting Seasons and Regulations Confederated Tribes of the Umatilla Indian Reservation -- Cayuse, Umatilla, and Walla Walla Tribes CTUIR Tribal Hunting Rights Reserved in 1855 Treaty a
DMU 045 Leelanau County Deer Management Unit
 DMU 045 Leelanau County Deer Management Unit Area Description The Leelanau County Deer Management Unit (DMU 045) is in the Northern Lower Peninsula Region (NLP). It has roughly 7,100 acres of State Forest
Introduction to Pennsylvania s Deer Management Program. Christopher S. Rosenberry Deer and Elk Section Bureau of Wildlife Management
 Introduction to Pennsylvania s Deer Management Program Christopher S. Rosenberry Deer and Elk Section Bureau of Wildlife Management To anyone who has carefully studied the situation it is evident that
Minnesota Deer Population Goals
 This document is made available electronically by the Minnesota Legislative Reference Library as part of an ongoing digital archiving project. http://www.leg.state.mn.us/lrl/lrl.asp Minnesota Deer Population
ARIZONA GAME AND FISH DEPARTMENT GUIDELINES FOR THE AND HUNTING SEASONS
 ARIZONA GAME AND FISH DEPARTMENT GUIDELINES FOR THE 2016-2017 AND 2017-2018 HUNTING SEASONS As proposed by the Arizona Game and Fish Commission 2 TABLE OF CONTENTS Schedule for formulating 2016-2017 and
DMU 082 Wayne County Deer Management Unit
 DMU 082 Wayne County Deer Management Unit Area Description The Wayne Deer Management Unit (DMU 082) lies in the Southeast Region and borders Lake Erie to the East and includes Celeron and Stony Islands
NORTH DAKOTA STATE REPORT June 2016
 Terry Steinwand, Director North Dakota Game and Fish Department 100 N. Bismarck Expressway Bismarck, ND 58501 NORTH DAKOTA STATE REPORT June 2016 2016 Deer Season Set North Dakota s 2016 deer season is
2017 DEER HUNTING FORECAST
 2017 DEER HUNTING FORECAST Region 7 Region 7 is located in Central New York, occupying a nine-county area reaching from Lake Ontario to the Pennsylvania border. This region is comprised of two broad ecological
EXECUTIVE SUMMARY Feasibility Study on the Reintroduction of Gray Wolves to the Olympic Peninsula
 EXECUTIVE SUMMARY Feasibility Study on the Reintroduction of Gray Wolves to the Olympic Peninsula Prepared by U.S. Fish and Wildlife Service Western Washington Office Introduction Historical records indicate
RYAN WALKER, New Mexico Department of Game and Fish, P. O. Box 1145, Raton, NM 87740, (575) ,
 ,") State Status Reports RYAN WALKER, New Mexico Department of Game and Fish, P. O. Box 1145, Raton, NM 87740, (575) 445-2311, ryan.walker@state.nm.us Abstract: Overall population estimates for all deer species
State Status Reports RYAN WALKER, New Mexico Department of Game and Fish, P. O. Box 1145, Raton, NM 87740, (575) 445-2311, ryan.walker@state.nm.us Abstract: Overall population estimates for all deer species
OREGON DEPARTMENT OF FISH AND WILDLIFE SUMMARY OF COUGAR MANAGEMENT IN NEIGHBORING STATES
 OREGON DEPARTMENT OF FISH AND WILDLIFE SUMMARY OF COUGAR MANAGEMENT The department recently examined the hunting season framework, population monitoring, and damage/public safety response policies (including
Central Hills Prairie Deer Goal Setting Block G9 Landowner and Hunter Survey Results
 Central Hills Prairie Deer Goal Setting Block G9 Landowner and Hunter Survey Results Table of Contents Public Surveys for Deer Goal Setting... 1 Methods... 1 Hunter Survey... 2 Demographics... 2 Population
Implementing a Successful Deer Management Program. Kip Adams Certified Wildlife Biologist Dir. of Ed. & Outreach Quality Deer Management Association
 Implementing a Successful Deer Management Program Kip Adams Certified Wildlife Biologist Dir. of Ed. & Outreach Quality Deer Management Association QDMA Deer Population Trends 30,000,000 25,000,000 20,000,000
Deer Management in Maryland. Brian Eyler Deer Project Leader Maryland DNR
 Deer Management in Maryland Brian Eyler Deer Project Leader Maryland DNR 301-842-0332 beyler@dnr.state.md.us General Behavior Social groups Social hierarchy Home range Nocturnal Bedding Food Habits Ruminants
SPOTLIGHT DEER SURVEY YO RANCHLANDS LANDOWNERS ASSOCIATION ±10,400 ACRES KERR COUNTY
 SPOTLIGHT DEER SURVEY YO RANCHLANDS LANDOWNERS ASSOCIATION ±10,400 ACRES KERR COUNTY WRITTEN BY: SHANE KIEFER, CWB SARAH KAHLICH, AWB PLATEAU LAND & WILDLIFE MANAGEMENT AUGUST 1, 2016 EXECUTIVE SUMMARY
DEER HUNT RESULTS ON ALABAMA WILDLIFE MANAGEMENT AREAS ANNUAL REPORT, CHRISTOPHER W. COOK STUDY LEADER MAY, 2006
 DEER HUNT RESULTS ON ALABAMA WILDLIFE MANAGEMENT AREAS ANNUAL REPORT, 2005-2006 CHRISTOPHER W. COOK STUDY LEADER MAY, 2006 ALABAMA DIVISION OF WILDLIFE AND FRESHWATER FISHERIES Federal Aid Project funded
Northwest Parkland-Prairie Deer Goal Setting Block G7 Landowner and Hunter Survey Results
 Northwest Parkland-Prairie Deer Goal Setting Block G7 Landowner and Hunter Survey Results Table of Contents Public Surveys for Deer Goal Setting... 1 Methods... 1 Hunter Survey... 2 Demographics... 2 Population
Saguache Mule Deer Herd Data Analysis Unit D-26 Game Management Units 68, 681 and 682 March 2008
 Saguache Mule Deer Herd Data Analysis Unit D-26 Game Management Units 68, 681 and 682 March 2008 Colorado Division of Wildlife 0722 S Co Rd 1 E Monte Vista, CO 81144 Revised by Brad Weinmeister Terrestrial
Monitoring Population Trends of White-tailed Deer in Minnesota Marrett Grund, Farmland Wildlife Populations and Research Group
 Monitoring Population Trends of White-tailed Deer in Minnesota - 2014 Marrett Grund, Farmland Wildlife Populations and Research Group INTRODUCTION White-tailed deer (Odocoileus virginianus) represent one
Copyright 2018 by Jamie L. Sandberg
 Copyright 2018 by Jamie L. Sandberg All rights reserved. This book or any portion thereof may not be reproduced or used in any manner whatsoever without the express written permission of the publisher,
OREGON DEPARTMENT OF FISH AND WILDLIFE SUMMARY OF COUGAR POPULATION MODEL AND EFFECTS OF LETHAL CONTROL
 OREGON DEPARTMENT OF FISH AND WILDLIFE SUMMARY OF COUGAR POPULATION MODEL ODFW is authorized to reduce human-cougar conflict, livestock depredation, and benefit native ungulate populations through the
DEER AND ELK POPULATION STATUS AND HARVEST STRUCTURE IN WESTERN NORTH AMERICA: A SUMMARY OF STATE AND PROVINCIAL STATUS SURVEYS.
 DEER AND ELK POPULATION STATUS AND HARVEST STRUCTURE IN WESTERN NORTH AMERICA: A SUMMARY OF STATE AND PROVINCIAL STATUS SURVEYS. JUSTIN BINFET,' Wyoming Game and Fish Department, 5400 Bishop Boulevard,
make people aware of the department s actions for improving the deer population monitoring system,
 Investing in Wisconsin s Whitetails 1 Over the last 60 years, the department has developed a deer herd monitoring and management system that seeks to use the best science and data possible. The deer monitoring
Black Bear Quota Recommendations CR 17-13
 Black Bear Quota Recommendations CR 17-13 Recommendations 41 resident tags 4 nonresident tags Harvest limit of 20 2017 Black Bear Seasons Changes Historically entire area was open 57 out of 82 bears historically
Minnesota Deer Population Goals
 Minnesota Deer Population Goals Superior Uplands Arrowhead Goal Block Minnesota DNR Section of Wildlife, 2015 Final Deer Population Goals Block 1: Superior Uplands Arrowhead The following pages provide
Report to the Joint Standing Committee on Inland Fisheries and Wildlife
 Report to the Joint Standing Committee on Inland Fisheries and Wildlife As Required by 12 Section 10107-A White-tailed Deer Population Management Written By: Wildlife Management Staff, Inland Fisheries
Enclosed, please find the 2018 Spotlight Deer Survey Report and Recommendations that we have prepared for your review and records.
 July 26, 2018 YO Ranchlands Landowner Association 1323 Whispering Pines Houston, TX 77055 To the Wildlife Committee: Enclosed, please find the 2018 Spotlight Deer Survey Report and Recommendations that
Job Title: Game Management, Subsection B Game Management Predator and Furbearer Management. SPECIES: Predatory and Furbearing Mammals
 Job Title:, Subsection B SPECIES: Predatory and Furbearing Mammals PREDATORY AND FURBEARING MAMMALS APPROACHES (2012 data not summarized at the time of this report.) 1. Provide opportunity for 75,000 hunter
contents 2004 Big Game Statistics
 2004 Big Game Statistics Introduction How to use this information... 2 Setting regulations... 3 How the information is collected... 4 How the management system works... 5 Making your points work for you...
contents 2009 Big Game Statistics
 2009 Big Game Statistics Introduction How to use this information... 2 Setting regulations... 3 How the information is collected... 4 How the management system works... 5 Making your points work for you...
Management History of the Edwards Plateau
 Management History of the Edwards Plateau Eco regions of Texas Edwards Plateau 24,000,000 acres About 15,000 years ago, the Edwards Plateau was much cooler and was more forested than today. Pollen counts
PREDATOR CONTROL AND DEER MANAGEMENT: AN EAST TEXAS PERSPECTIVE
 PREDATOR CONTROL AND DEER MANAGEMENT: AN EAST TEXAS PERSPECTIVE BEN H. KOERTH, Institute for White-tailed Deer Management and Research, Box 6109, Arthur Temple College of Forestry, Stephen F. Austin State
Rangewide Status of Black-tailed and Mule Deer
 Rangewide Status of Black-tailed and Mule Deer July 212 Alaska (212) Sitka Black-tailed Deer are native to the wet coastal rainforests of Southeast Alaska (ADFG s Region 1) and due to historic translocation
SOUTH PLATTE RIVER DEER HERD MANAGEMENT PLAN
 SOUTH PLATTE RIVER DEER HERD MANAGEMENT PLAN DATA ANALYSIS UNIT D-44 Game Management Units 91, 92, 94, 96, & 951 March 2009 Marty Stratman Colorado Division of Wildlife Terrestrial Biologist 122 E. Edison
Recommendations for Pennsylvania's Deer Management Program and The 2010 Deer Hunting Season
 Recommendations for Pennsylvania's Deer Management Program and The 2010 Deer Hunting Season March 7, 2010 Prepared for The Pennsylvania Game Commission Board of Commissioners By John Eveland RECOMMENDATIONS
Big Game Season Structure, Background and Context
 To: Members of the Colorado Parks and Wildlife Commission From: Danielle Isenhart, Regulations Manager Date: April 16, 2018 Re: 2020-2024 Big Game Season Structure, Background and Context At the May Commission
CHECKS AND BALANCES. OVERVIEW Students become managers of a herd of animals in a paper-pencil, discussionbased
 CHECKS AND BALANCES 5 OVERVIEW Students become managers of a herd of animals in a paper-pencil, discussionbased activity. BACKGROUND White Tailed Deer White-tailed deer have always been a part of the forest
ARIKAREE DEER MANAGEMENT PLAN D-55
 ARIKAREE DEER MANAGEMENT PLAN D-55 Game Management Units 101 & 102 January 2018 Marty Stratman Colorado Division of Parks & Wildlife Wildlife Biologist 122 E. Edison St. Brush, CO 80723 HERD MANAGEMENT
1) Increase the deer population to 475,000 (mule, 150,000;
 Increase the deer population to 475,000 (mule, 150,000;") British Columbia Deer Status Report forthe 1987 Western ~ tates~cinces Deer workshop - 1. Attending Representative: Ian Hatter Wildlife Branch Ministry of Environment and Parks Victoria, British Columbia
British Columbia Deer Status Report forthe 1987 Western ~ tates~cinces Deer workshop - 1. Attending Representative: Ian Hatter Wildlife Branch Ministry of Environment and Parks Victoria, British Columbia
2009 WMU 527 Moose, Mule Deer, and White tailed Deer
 Section Author: Dave Moyles 2009 WMU 527 Moose, Mule Deer, and White tailed Deer Suggested Citation: Moyle, D. 2009. WMU 527 Moose, Mule Deer, and White tailed Deer. Pages 84 88 In: N. Webb and R. Anderson.
San Juan Basin Elk Herd E-31 Data Analysis Unit Plan Game Management Units 75, 751, 77, 771, and 78
 San Juan Basin Elk Herd E-31 Data Analysis Unit Plan Game Management Units 75, 751, 77, 771, and 78 Andy Holland Terrestrial Biologist Colorado Division of Wildlife 151 E. 16 th Street Durango, CO 81301
LEAPS BOUNDS. Growing up hunting as a kid in New Hampshire, I didn t. by Dan Bergeron
 & LEAPS BOUNDS by Dan Bergeron Growing up hunting as a kid in New Hampshire, I didn t give much thought to how the deer population was managed or what went into setting hunting seasons every year. My mind
Marrett Grund, Farmland Wildlife Populations and Research Group
 Minnesota s Wild Turkey Harvest - 2013 Marrett Grund, Farmland Wildlife Populations and Research Group Minnesota offers fall and spring turkey hunting seasons. The fall turkey season was 30 days in length
Northern Yellowstone Cooperative Wildlife Working Group 2012 Annual Report (October 1, 2012-September 30, 2012) Member Agencies
 Member Agencies") Northern Yellowstone Cooperative Wildlife Working Group 2012 Annual Report (October 1, 2012-September 30, 2012) Member Agencies Montana Fish, Wildlife & Parks National Park Service, Yellowstone National
Northern Yellowstone Cooperative Wildlife Working Group 2012 Annual Report (October 1, 2012-September 30, 2012) Member Agencies Montana Fish, Wildlife & Parks National Park Service, Yellowstone National
DMU 452 Northern Multi-County Deer Management Unit
 DMU 452 Northern Multi-County Deer Management Unit Area Description The Core TB Zone Deer Management Unit is in the Northern Lower Peninsula Region (NLP) and covers portions of Alcona, Alpena, Montmorency,
MOUNTAIN LION MANAGEMENT GUIDELINES FOR LION DAU-L17
 MOUNTAIN LION MANAGEMENT GUIDELINES FOR LION DAU-L17 GAME MANAGEMENT UNITS 123, 124, 125, 126, 127, 128, 129, 130, 132, 133, 134, 135, 136, 137, 138, 139, 141, 142, 143, 144, 145, 146, & 147 Prepared for:
White-tailed Deer: A Review of the 2010 Provincially Coordinated Hunting Regulation
 Population Estimate White-tailed Deer: A Review of the 21 Provincially Coordinated Hunting Regulation White-tailed deer in BC were managed using a combination of General Open Season (GOS) and Limited Entry
DRAFT 2, May 3, 2011 Information for May 2011, District Meetings Proposed Revision to OAR Division 46 The Dog Training Rules
 Information for May 2011, District Meetings Proposed Revision to OAR Division 46 The Dog Training Rules In early 2011 a citizen advisory group was formed and charged with making recommendations to the
Minnesota Deer Population Goals. Sand Plain Big Woods Goal Block
 Minnesota Deer Population Goals Sand Plain Big Woods Goal Block Minnesota DNR Section of Wildlife, 2015 Final Deer Population Goals Block 5: Sand Plain Big Woods The following pages provide a description
Deer Management in Maryland -Overview. Brian Eyler Deer Project Leader
 Deer Management in Maryland -Overview Brian Eyler Deer Project Leader Management History -Pre-colonial/Colonial Deer abundant Important to eastern tribes Legislatively protected in Maryland 1729 Nearly
Mule Deer. Dennis D. Austin. Published by Utah State University Press. For additional information about this book. Accessed 3 May :46 GMT
 Mule Deer Dennis D. Austin Published by Utah State University Press Austin, D.. Mule Deer: A Handbook for Utah Hunters and Landowners. Logan: Utah State University Press, 2010. Project MUSE., https://muse.jhu.edu/.