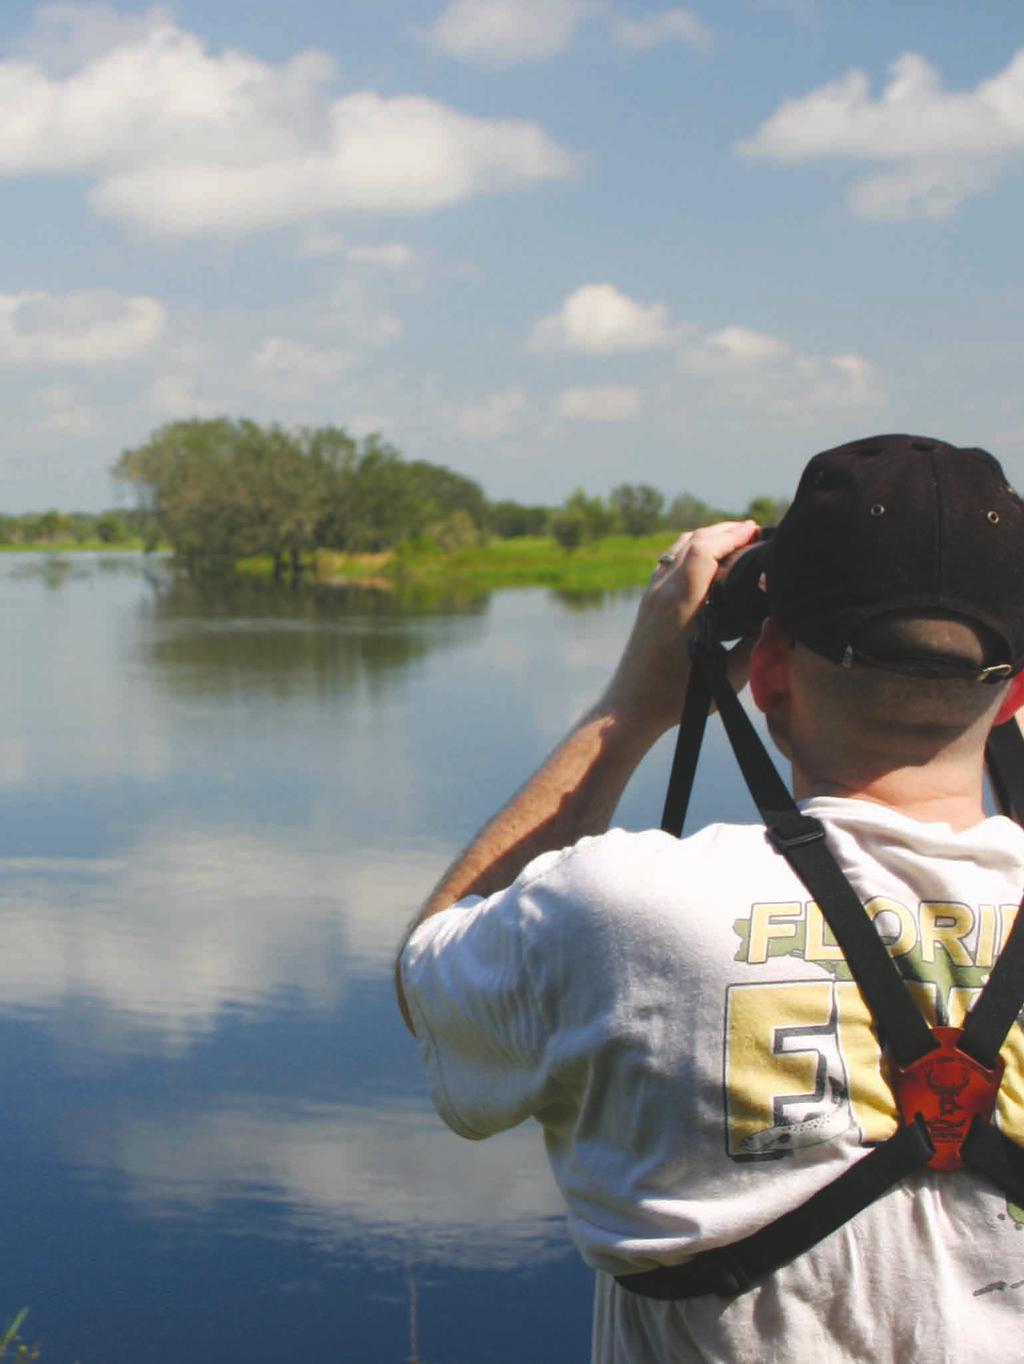
Table of contents. Florida ranks as the second highest state (after California) in the number of people participating in wildlife-viewing recreation.
|
|
|
- Lorena Richard
- 5 years ago
- Views:
Transcription

1
2 Acknowledgments This report examines the contributions of wildlife viewing to the Florida economy. Rob Southwick and Thomas Allen are the authors. This project was funded by the Florida Fish and Wildlife Conservation Commission. The authors wish to thank Anne Glick for her assistance and guidance, and all others who contributed their input and suggestions regarding this report.
...13 Earnings...13 Employment...13 Tax revenues...13 Trends since 1991.")
 in the number of people participating in wildlife-viewing recreation. (U.S.")
3 Table of contents List of tables... iv Executive summary... v Introduction...1 I. Data sources and methods...1 II. Demographics and participation Demographics...2 Participation...2 III. Economic impacts Three forms of retail sales and economic impact...7 Retail sales...8 Total economic effect (output)...13 Earnings...13 Employment...13 Tax revenues...13 Trends since Appendix A Definitions...17 Appendix B Methods...19 Appendix C Economic impact tables for wildlife viewing...21 Appendix D More fun facts...24 Florida ranks as the second highest state (after California) in the number of people participating in wildlife-viewing recreation. (U.S. Fish and Wildlife Service s 2006 National Survey of Fishing, Hunting and Wildlife-Associated Recreation) red-shouldered hawk Buteo lineatus Photo by David Moynahan


4 List of tables Table E-1. The 2006 economic impacts of wildlife viewing in Florida... v Table 1. Table 2. Table 3. Table 4. Table 5. Table 6. Table 7. Table 8. Demographic background of wildlife viewers in Florida in Participation in non-residential wildlife viewing in Florida in Participation in non-residential wildlife viewing by site visited and wildlife observed, fed or photographed in Florida in Participation in residential wildlife viewing in Florida in Participation in residential wildlife viewing by wildlife observed in Florida in Expenditures made by residents and nonresidents participating in wildlife viewing in Florida in Average expenditures for wildlife viewers in Florida in Economic impacts of wildlife viewing in Florida in Table 9. Retail sales from wildlife viewing in Florida in In 2006, the nonresident wildlife viewers in Florida (746,000) equaled the population of South Dakota and brought $653 million into the state economy. (U.S. Fish and Wildlife Service s 2006 National Survey of Fishing, Hunting and Wildlife-Associated Recreation; U.S. Census Bureau) black butterflies: yellow butterfly: Palamedes swallowtail Papilio palamedes eastern tiger swallowtail Papilio glaucus IV


5 Executive summary This project was conducted by Southwick Associates for the Florida Fish and Wildlife Conservation Commission. The purpose of this project was to quantify the 2006 economic benefits of wildlife viewing in Florida. The data used in this project were obtained from the 2006 National Survey of Fishing, Hunting, and Wildlife-Associated Recreation (Survey). The Survey is conducted by the U.S. Fish and Wildlife Service and the U.S. Census Bureau. The Survey consists of a wide range of hunting, fishing and wildlife viewing participation, expenditure and demographic information. The data were analyzed using the IMPLAN economic model to generate economic impact estimates for each activity. In 2006, there were 1.6 million wildlife viewers (residents and nonresidents) participating in non-residential activities in Florida. In addition, there were nearly 3.3 million residents participating in residential activities in Florida. Nonresidential activities are those performed at least one mile from an individual s home. Conversely, residential activities are those performed within one mile of an individual s home. The nonresidential activity cited most often by recreators was observing wildlife, whereas the primary residential activity was feeding wildlife. Overall, 4.2 million people participated in some form of residential or nonresidential wildlife viewing in Florida in The total retail sales from 2006 wildlife viewing in Florida was estimated at $3.1 billion ($2.4 billion by residents and $653.3 million by nonresidents). Since 2001, expenditures in Florida for wildlife viewing have almost doubled ($1.575 billion in 2001). These numbers show a reversal from the previous five-year period in which expenditures had decreased slightly ($1.677 billion in 1996). These 2006 expenditures support a total economic effect to the Florida economy of $5.248 billion. The 2006 economic impact of wildlife viewing in Florida is summarized below. Table E Economic impacts of wildlife viewing in Florida Resident Nonresident Total Retail sales $2.428 billion $653.3 million $3.081 billion Salaries & wages $1.204 billion $391.8 million $1.595 billion Full & part-time jobs 38,069 13,298 51,367 Tax revenues: State sales tax $243.1 million $69.7 million $312.8 million Federal income tax $292.5 million $92.8 million $385.3 million Total economic effect $4.078 billion $1.170 billion $5.248 billion Since 2001, the number of people who visited Florida to view wildlife increased 50 percent. (U.S. Fish and Wildlife Service s 2001 and 2006 National Surveys of Fishing, Hunting and Wildlife- Associated Recreation) black bear Ursus americanus V
6


7 Introduction Wildlife viewing activities, popular among residents and nonresidents alike, produce significant economic benefits for many individuals and businesses in Florida. Unlike manufacturing industries which are easily identified by large factories, the wildlife viewing industry is comprised of widely scattered retailers, manufacturers, and wholesalers and support services that, when considered together, form an important industry. Given that wildlife viewing dollars are often spent in rural or lightly populated areas, the economic contributions of wildlife viewing can be especially important to the rural economic base. Photo by David Moynahan This project assesses the 2006 economic benefits of wildlife viewing in Florida. The project was designed to provide resource managers with the economic information necessary to better conserve and manage wildlife and other natural resources. Only the economic benefits of wildlife viewing activities occurring within Florida are considered. This report measures the impact of wildlife viewing expenditures on Florida industries and individuals (in dollar terms) to produce estimates of the total economic benefits created in This report is divided into several sections to provide a better understanding of the activities undertaken by wildlife viewers and the economic effects of their activities. The first section briefly describes data sources and methodology. The second section, participation, is divided into two subsections. The first subsection explores nonresidential participation by residents and nonresidents. Nonresidential activities are those that occur more than one mile from home. The second subsection examines residential participation. Given the definitions, nonresidential recreation is enjoyed by both Florida residents and tourists visiting the state, while residential recreation only includes residents. The next section presents the economic impacts of wildlife viewing in Florida. Definitions of several terms used in this report are provided in Appendix A. Appendix B provides methodological descriptions. Appendix C presents tables detailing the economic impacts of wildlife viewing. I. Data sources & methods Data on recreators demographics, participation and expenditures were obtained from the 2006 National Survey of Fishing, Hunting, and Wildlife-Associated Recreation (Survey), which is conducted approximately every five years by the U.S. Fish and Wildlife Service and the U.S. Bureau of the Census. The Survey provides data required by natural resource management agencies, industry and private organizations at the state and national levels to assist in optimally managing natural resources. The Survey is funded through excise taxes on hunting and fishing equipment through the Federal Aid in Sport Fish and Wildlife Restoration acts. The expenditure data was analyzed using economic models to quantify the economic impacts. A more detailed description of the methods used to generate the economic estimates is presented in Appendix B. 1
8 II. Demographics and participation Characteristics of recreators Demographics Participants in wildlife viewing in Florida are near 50 years of age, are likely to be married, and are split fairly evenly between male and female, though more nonresidents are female. Only a small percentage of wildlife viewers in Florida, both nonresidential and residential, report they are non-white (Table 1). Table 1. Demographic background of wildlife viewers in Florida in 2006 (participants 16 years old and older) Nonresidential activity Resident Nonresident Residential activity Race (non-white) 7% 5% 5% Average age 49 years 51 years 51 years Gender (male) 47% 34% 48% Marital status (married) 56% 80% 62% Average household income $62,816 $73,862 $60,641 Education 8 years or less 2.3% 0% 3.8% 9-11 years 4.9% 2.3% 5.7% 12 years 32.4% 16.1% 34.4% 1-3 years college 22.9% 24.5% 24.0% 4 years college or more 37.5% 57.2% 32.0% The average household income for residents participating in nonresidential and residential activities is similar. Nonresidents have, on average, a household income higher than resident participants. Both have incomes higher than the 2006 state average ($44,448, per U.S. Census Bureau). As with income levels, the education levels of residents who participate in residential and non-residential activities are similar; however, nonresidents have, on average, a higher level of education. Participation Wildlife viewing includes a broad category of activities. To help describe the types of activities undertaken by residents and tourists, and to better understand the types of wildlife they enjoy and the surroundings preferred, participation information is divided into two subsections. The first subsection explores nonresidential activities by residents and tourists. The second subsection examines residential activities. Nonresidential participation In 2006, there were 1.6 million wildlife viewers (residents and tourists) participating in nonresidential activities in Florida (Table 2). Of the total recreators in Florida, 813,381 were state residents and 746,403 were tourists (Table 3). The total number of wildlife viewing days in Florida was 16.6 million. 2
 Number of participants Observing wildlife Photographing wildlife Resident Nonresident Total")

9 Table 2. Participation in non-residential wildlife viewing in Florida in 2006 (participants 16 years old and older) Number of participants Observing wildlife Photographing wildlife Resident Nonresident Total 813, ,403 1,559, , ,210 1,171, , , ,307 Feeding wildlife 304, , ,638 Number of days 10,449,338 6,101,889 16,551,227 Observing wildlife Photographing wildlife 9,708,907 4,853,203 14,562,110 4,585,262 2,428,434 7,013,696 Feeding wildlife 5,411, ,477 5,858,235 Number of trips 8,184,700 1,487,109 9,671,809 The primary wildlife viewing activity, measured in terms of number of participants and number of activity days, was observing wildlife; photographing wildlife was the second preferred activity. Please note one participant may engage in two or more activities per trip as these activities are not exclusive of one another. Participation by resident and nonresident recreators in terms of sites visited and wildlife observed, fed or photographed is presented in Table 3. Note that the results presented in Table 3 do not necessarily imply that recreators prefer a certain site type or prefer to observe a certain wildlife type. This is because the results in Table 3 reflect participants preferences and the availability of sites and wildlife. With 746,000 visitors per year, more people travel to Florida to view wildlife than any other state - 24 percent more than the second-place state, California (U.S. Fish and Wildlife Service s 2006 National Survey of Fishing, Hunting and Wildlife-Associated Recreation) 3
 Number of participants")
: Birds 706,272 661,175 1,367,447 Shorebirds 605,069 684,439 1,289,508 Waterfowl 593,438 572,978 1,166,416 Birds of prey")
10 Table 3. Participation in non-residential wildlife viewing by site visited and wildlife observed, fed, or photographed in Florida in 2006 (Participants 16 years old and older, ranked) Number of participants Resident Nonresident Total 813, ,404 1,559,785 Number of recreators visiting (ranked by total number of users): Public land 783, ,373 1,402,665 Private land 119, , ,109 Number of recreators observing, feeding or photographing (ranked by major species): Birds 706, ,175 1,367,447 Shorebirds 605, ,439 1,289,508 Waterfowl 593, ,978 1,166,416 Birds of prey 495, , ,008 Songbirds 480, , ,840 Other birds 167, , ,007 Other wildlife 551, , ,148 Mammals 507, , ,415 Small land mammals 478, , ,521 Ocean mammals 348, , ,756 Large land mammals 262, , ,607 Fish 461, , ,751 Note = a participant may be counted towards more than one category above green anole Anolis carolinensis Wildlife viewing supports nearly as many jobs in-state as employed by Walt Disney World. (Orlando Business Journal Book of Lists 2006) 4
 Residential participation Photo by Danny Bales In 2006, there were 3.")

11 One of every six Florida residents participates in some form of wildlife-viewing activity. ( million state residents in 2006 per U.S. Census Bureau, and million wildlife watching participants residing in Florida) Residential participation Photo by Danny Bales In 2006, there were 3.3 million residential wildlife viewing participants in Florida (Table 4). This number represents Florida residents participating in wildlife viewing within one mile of their home. Compared to non-residential activity, there are twice as many residents who participate in wildlife watching within one mile of their homes than those who travel away from home. Table 4. Participation in residential wildlife viewing in Florida in 2006 (participants 16 years old and older, ranked) Number of 3,273,861 participants Feeding birds and wildlife 2,474,003 (75.6%) Birds 2,307,829 (70.5%) Other wildlife 1,164,855 (35.6%) Observing wildlife 2,363,676 (72.2%) Photographing 1,230,178 (37.6%) wildlife Visiting parks 624,088 (19.1%) near home Maintaining 448,175 (13.7%) plantings around home Maintaining 423,347 (12.9%) natural areas around home Number of days Observing wildlife 245,609,606 Photographing wildlife 36,212,590 Note = a participant may enjoy more than one type of wildlife listed above 5


12 The primary residential wildlife viewing activity, measured in terms of number of participants, was feeding wildlife. Observing wildlife was the second most popular residential wildlife viewing activity. This is in contrast to the ranking of the nonresidential activities, where observing wildlife was the most popular activity. Of those who participate in feeding birds and wildlife, most feed wild birds. Given the manner in which the survey questions were asked, we cannot determine the number of days spent feeding wildlife. However, we can determine the number of days spent observing and photographing wildlife around the home. In terms of days spent in wildlife viewing activities, observing wildlife again was the most popular activity. Residents spent approximately million days observing wildlife around their home compared with only 9.7 million days spent observing wildlife on trips away from home. The no. 1 type of wildlife observed by residential recreators in Florida was birds (Table 5). The second most prominent category to be observed by residents was mammals, with most of these being small mammals. As with the results presented in Table 3, the Table 5 results do not necessarily imply that recreators prefer to observe a certain wildlife type because the results reflect participants preferences and the availability of wildlife types. Table 5. Participation in residential wildlife viewing by wildlife observed in Florida in 2006 (Number of participants 16 years old and older, ranked) Number of recreators Birds 2,121,773 (64.8%) Mammals 1,747,916 (53.4%) small mammals 1,652,789 (50.5%) large mammals 573,417 (17.5%) Amphibians or reptiles 1,410,326 (43.1%) Insects or spiders 1,060,140 (32.4%) Fish and other wildlife 789,253 (24.1%) Note = a participant may enjoy more than one type of wildlife listed above In 2006, Florida residents who enjoyed viewing wildlife around their homes outnumbered the population of 21 states. (U.S. Census Bureau) Miami blue Cyclargus thomasi bethunebakeri 6 Photo by Jaret C. Daniels

 2006 National Survey of Fishing, Hunting and Wildlife-Associated Recreation (FWS Survey).")
13 III. Economic impacts Three forms of retail sales and economic impact: Retail sales, and economic impacts overall, can be reported in several forms. None is superior to the others; the choice of method used depends on the situation at hand. The three forms reported in this text are: Option 1: Overall expenditures this option provides the total retail sales as reported by the U.S. Fish and Wildlife Service s (FWS) 2006 National Survey of Fishing, Hunting and Wildlife-Associated Recreation (FWS Survey). Included are travel and equipment expenses, including big-ticket items such as vehicles and real estate. This number should be considered the upper-end estimate of the actual expenditures made in-state for wildlife viewing. Option 2: Overall expenditures minus some equipment items the FWS Survey reports expenditures reported by participants made primarily for the purpose of wildlife viewing. However, even if the item s primary purpose was for wildlife viewing, it may be safe to say some of these items are used partly or mostly for non-wildlife viewing purposes. Examples include a camper which may also be used for general vacations in addition to wildlife viewing activities, or binoculars which may be used for sporting events in addition to bird watching. Including the full cost of these items may overestimate the true impact of wildlife viewing. Therefore, adjustments are made to discount these items. This estimate may be considered the lower range of the actual expenditures made in-state for wildlife viewing. This option excludes expenditures for binoculars, cameras, other miscellaneous special equipment, tents and tarps, vehicles, camping equipment and one-half of backpacks, daypacks and clothing - all items that may be used for other activities besides wildlife viewing. Option 3: Often travel expenses are the major item of interest. This is especially true when considering tourism and local economic impacts. This option is offered to help explain the economic impacts of wildlife-related travel and tourism. This option excludes all equipment expenditures. Only travel related items are included such as transportation costs, food and beverages, lodging, etc. Which option to use depends on the situation. If wildlife viewing is to be compared to other recreation-based industries, especially those that report the full range of related consumer purchases, then Option #1 is correct. If the ramifications to the state economy from diminished wildlife resources or their related recreation are being considered, then Option #2 may be the best option. When comparing the tourism contributions of wildlife, Option #3 may be best. Users are advised to carefully examine all issues when selecting the best data option to apply. 7

, followed by land purchases ($364.4 million) and boats ($302.1 million).")
14 Retail sales The expenditure figures (Table 6) describe the total retail sales generated from 2006 wildlife viewing by specific categories of goods and services. Adjustments for Options #2 and #3 are first made in Table 7. Regarding trip expenditures, residents spent the largest amount on food, drink and refreshments (almost $90.3 million), followed by lodging ($63 million). Nonresidents, on the other hand, spent the most on lodging ($236.3 million), followed by food, drink and refreshments ($175.6 million). The largest equipment expenditures by Florida residents were for pickups, campers and motor homes ($517.6 million), followed by land purchases ($364.4 million) and boats ($302.1 million). Note that equipment expenditures are comprised of expenditures that may have been made for residential and/or non-residential activities. Before any adjustments are made for Options #2 and #3, total resident expenditures for wildlife viewing were $2.43 billion. Nonresident expenditures were $653.3 million and represent new dollars brought into the state economy by out-of-state visitors. Table 7 shows figures for the average amount spent per day by recreators for residential activities and non-residential activities, as well as the average spent annually. Adjustments are made in Table 7 to present Options #2 and #3 as described in the beginning of this section. Since the Survey does not collect total days of residential participation, the residential per day figures in Table 7 are estimated based on the number of days spent observing wildlife. The non-residential per day figures are estimated by totaling the travel expenses plus several equipment items that would be used away from home: binoculars, clothing, camping gear, backpacks and daypacks, vehicles and one-half of cameras, film and developing (unless a specific item is deleted for a specific option). The residential per day figure is estimated by totaling the remaining equipment items. Also, since purchased land may be used for recreation or to build a home, 50 percent of its value was assigned to both the residential and non-residential estimates. Wildlife viewing-related expenditures (equipment, travel, wildlife feed, etc.) in Florida are comparable to sales of golf equipment nationally. (National Sporting Goods Association and the U.S. Fish and Wildlife Service: $3.4 billion for golf equipment in 2006 and $3.1 billion for wildlife viewing in Florida) 8
15
16 Table 6. Expenditures made by residents and non-residents participating in wildlife viewing in Florida in 2006 (Participants 16 years old and older) Trip Expenditures Residents Nonresidents Total Food $90,279,272 $175,641,624 $265,920,896 Lodging $62,955,541 $236,300,069 $ 299,255,610 Airfare $21,901,712 $54,911,245 $76,812,957 Public transportation $7,116,584 $56,906,695 $64,023,279 Private transportation $49,768,204 $73,447,849 $123,216,052 Guide fees $7,469,937 $18,545,772 $26,015,709 Public land access fees $4,746,921 $2,260,215 $7,007,136 Private land access fees $77,599 $7,164,204 $7,241,803 Equipment rental $7,212,661 $6,740,189 $13,952,851 Boat fuel $686,210 $486,717 $1,172,927 Other boat costs $1,545,816 $128,273 $1,674,089 Heating and cooking fuel $1,228,372 $420,563 $1,648,934 Equipment Expenditures Binoculars, scopes $27,396,727 $2,094,747 $29,491,474 Cameras $126,204,502 $3,701,686 $129,906,188 Film and developing $38,240,834 $5,749,188 $43,990,021 Commercially prepared bird food $69,499,033 $69,499,033 Other bird food $13,177,909 $6,986 $13,184,894 Food for other wildlife $30,836,606 $441,892 $31,278,498 Nest boxes, feeders $24,549,534 $1,906,091 $26,455,625 Other special equipment $1,076,359 $72,339 $1,148,697 Tents, tarps $12,277,912 $519,809 $12,797,721 Backpacking equipment $235,308 $235,308 Other camping equipment $9,428,780 $9,428,780 Day packs, special clothing $7,479,961 $611,747 $8,091,708 Magazines and books $19,122,187 $4,856,946 $23,979,133 Membership dues, contributions $31,941,477 $363,232 $32,304,709 10


17 Other equipment $1,696,966 $1,696,966 Off-road and 4WD vehicles, $284,590,750 $284,590,750 Pickups, campers, motor homes $517,614,174 $517,614,174 Boats $302,130,123 $302,130,123 Trailer, boat accessories $8,980,326 $8,980,326 Cabin Other equipment $239,631,362 $239,631,362 Land purchases $364,426,890 $364,426,890 Land leases Plantings $42,691,136 $42,691,136 Total trip and equipment expenditures $2,428,217,684 $653,278,076 $3,081,495,760 In 2006, all state residents who participated in wildlife viewing activities in Florida could fill FSU s Doak Campbell Stadium nearly 39 times, UF s Ben Hill Griffin Stadium at Florida Field nearly 37 times, Tampa s Raymond James Stadium nearly 50 times, Miami Dolphins Stadium over 43 times, and Jacksonville Municipal Stadium over 43 times. (Florida State University, the University of Florida and ballparks.com) Photo by Meaghan Manning 11
18 Table 7. Average expenditures for wildlife viewers in Florida in 2006 (participants 16 years old and older) Avg. per participant, annually Option 1: Residential activities $256 Residents Nonresidents Average Non-residential activities $1,954 $865 $1,433 Option 2: Non-residential activities, minus equipment used possibly for nonrecreational $748 $856 $800 activities 1 Option 3: Non-residential activities, travel expenses only 2 $313 $848 $569 Avg. per day, per participant Option 1: Non-residential activities $152 $106 $135 Option 2: Non-residential activities, minus equipment used possibly for non-recreational $58 $105 $75 activities 1 Option 3: Non-residential activities, travel expenses only 2 $24 $104 $54 Total spent by recreators Option 1: Total Residential activities $838,649,459 $7,647,486 $846,296,944 Non-residential activities (includes ALL equipment) $1,589,568,225 $645,630,590 $2,235,198,816 Total: $2,428,217,684 $653,278,076 $3,081,495,760 Option 2: Residential activities $597,941,738 $7,575,147 $605,516,885 Non-residential activities, minus equipment used possibly for nonrecreational $608,197,746 $639,008,475 $1,247,206,221 activities 1 Total: $1,206,139,484 $646,583,622 $1,852,723,106 Option 3: Residential activities n/a n/a Non-residential activities, travel expenses only 2 $254,988,829 $632,953,414 $887,942,242 Total: $254,988,829 $632,953,414 $887,942,242 1 = This figure excludes expenditures for binoculars, cameras, other miscellaneous special equipment, tents and tarps, vehicles, camping equipment and 1/2 of backpacks, daypacks and clothing - all items that may be used for other activities besides wildlife viewing. 2 = Travel expenses include fuel, transportation, food, beverages, restaurants, lodging and related expenses. 12


19 Once boats and vehicles are removed from the equation, residents on average spend about one-half the amount per day of activity than nonresidents when they travel away from home to view, feed or photograph wildlife. Residents spend more annually, but that most likely reflects a higher proportion of their overall annual activities occurring in Florida compared to nonresidents. Total economic effect (output) Expenditures made by wildlife viewers generate rounds of additional spending through the economy. For example, once a sale is made, the retailer buys additional inventory from the wholesaler, who in turn buys more from a manufacturer. These are indirect impacts. Each of these businesses also pays their employees (known as induced impacts). The sum of these multiple rounds of spending is the total economic effect resulting from the original retail sale. Additional descriptions of direct, indirect and induced impacts are provided in Appendix A. The economic figures in Table 8 show the total economic effect from 2006 wildlife viewing activities in Florida ranges from $3.2 billion upwards to $5.2 billion ($4.1 billion by residents and nearly $1.2 billion by nonresidents). Travel expenses alone generate $1.6 billion in total economic effects. Tables detailing the economic impacts of wildlife viewing for each specific category of goods and services are provided in Appendix C. Earnings Total household income (salaries and wages) generated during 2006 from wildlifeviewing recreation in Florida was estimated upwards of $1.6 billion ($1.2 billion by residents and $391.8 million by nonresidents). Employment During 2006, wildlife viewing supported a minimum of 34,523 full and parttime jobs and a maximum of 51,367 full and part-time jobs in Florida (38,069 generated by resident spending and 13,298 generated by nonresident spending) in These are jobs that are directly associated with wildlife viewing use, in addition to jobs in industries that indirectly support these activities. Travelrelated expenses alone supported 17,883 jobs. Tax revenues Expenditures by residents and nonresidents generate sales tax revenues for the state. Likewise, the jobs generated by wildlife-viewing activities create additional federal income tax revenues. Total state tax revenues generated by wildlife viewing are estimated at a minimum of $205.6 million up to $312.8 million. Total federal income tax revenues generated by wildlife viewing ranges up to $385.3 million. 13
20 Table 8. Economic impacts of wildlife viewing in Florida in 2006 (population 16 years old and older) Option 1 - Impacts generated from ALL travel and equipment expenditures Resident Nonresident All participants Retail sales $2,428,217,684 $653,278,076 $3,081,495,760 Total economic effect 1 $4,078,379,997 $1,169,686,254 $5,248,066,251 Salaries and wages $1,203,704,652 $391,836,701 $1,595,541,353 Full and part-time jobs 38,069 13,298 51,367 Tax revenues: State and local revenue $243,091,642 $69,722,853 $312,814,495 Federal revenue $292,512,306 $92,798,273 $385,310,579 Option 2 - impacts generated from all expenditures EXCLUDING equipment, possibly used part of the year for non-wildlife viewing activities Resident Nonresident All participants Retail sales $1,206,139,484 $646,583,622 $1,852,723,106 Total economic effect 1 $1,995,227,703 $1,157,436,909 $3,152,664,612 Salaries and wages $592,004,011 $387,662,433 $979,666,444 Full and part-time jobs 21,322 13,201 34,523 Tax revenues: State and local revenue $136,393,950 $69,170,810 $205,564,760 Federal revenue $150,073,564 $91,843,194 $241,916,758 Option 3 - Impacts generated from travel-related expenditures only Resident Nonresident All participants Retail sales $254,988,829 $632,953,414 $887,942,242 Total economic effect 1 $453,201,982 $1,133,123,579 $1,586,325,561 Salaries and wages $146,752,482 $379,697,237 $526,449,719 Full and part-time jobs 4,899 12,984 17,883 Tax revenues: State and local revenue $27,124,677 $67,857,579 $94,982,256 Federal revenue $34,909,161 $90,003,733 $124,912,894 1 Total economic effect = The rounds of additional spending throughout the state economy stimulated by the original retail sale. For example, once a sale is made, the retailer buys additional inventory from the wholesaler, who in turn buys more from a manufacturer. These are indirect impacts. Each of these businesses also pays employees (known as induced impacts), and pays other bills. The sum of these transactions is the total economic effect, also known as the output or multiplier effect. 14

21 Trends since 1991 Over the past ten years, there has been some fluctuation in the retail sales and impacts attributable to wildlife viewing. Some of the fluctuation can be attributed to ever-shifting number of participants and expenditures per outing, and some of the trend can be attributed to natural error in the survey data sources. The degree that each source contributes to change is unknown. Please note that trends are best measured based on retail sales. A change in the economic models from the 2001 report to the 2006 report do not permit an accurate trend comparison for the total multiplier effects of jobs, income and tax revenues. However, retail sales estimates were unaffected. It is valid and safe to compare 2006 retail sales data from this report to previous retail sales estimates from previous reports. Table 9 presents the ten-year trends. Table 9. Retail sales from wildlife viewing in Florida in 2006 (Population 16 years old and older) Year Retail sales Percent change since $1.212 billion 1996 $1.677 billion 38% 2001 $1.575 billion 30% 2006 $3.081 billion 154% The state and local tax revenues generated by wildlife-viewing activity in Florida could fund the annual salaries for up to 6,550 more school teachers. (National Center for Education Statistic, $47,750 average salary per teacher) 15
22


23 Appendix A Definitions Economic benefits can be estimated by two types of economic measures: economic impacts and economic values. An economic impact addresses the business and financial activity resulting from the use of a resource. Economic value, on the other hand, is a non-business measure that estimates the value people receive from an activity after subtracting for their costs and expenditures. This concept is also known as consumer surplus. There are three types of economic impact: direct, indirect and induced. A direct impact is defined as the economic impact of the initial purchase made by the consumer (the original retail sale). Indirect impacts are the secondary effects generated from a direct impact, such as the retailer buying additional inventory, and the wholesaler and manufacturers buying additional materials. Indirect impacts affect not only the industry being studied, but also the industries that supply the first industry. An induced impact results from the salaries and wages paid by the directly and indirectly impacted industries. The employees of these industries spend their income on various goods and services. These expenditures are induced impacts, which, in turn, create a continual cycle of indirect and induced effects. The direct, indirect and induced impact effects add together to provide the overall economic impact of the activity under study. As the original retail purchase (direct impact) goes through round after round of indirect and induced effects, the economic impact of the original purchase is multiplied, benefiting many industries and individuals. Likewise, the reverse is true. If a particular item or industry is removed from the economy, the economic loss is greater than the original lost retail sale. Once the original retail purchase is made, each successive round of spending is smaller than the previous round. When the economic benefits are no longer measurable, the economic examination ends. This study presents several important measures: Retail sales These include the expenditures made by wildlife viewers for equipment, travel expenses and services related to their wildlife viewing activities over the course of the year. The initial retail sale is the direct impact. Total economic effect Also known as the total multiplier effect or output, this measure reports the sum of the direct, indirect and induced impacts resulting from the original retail sale. This figure explains the total activity in the economy generated by a retail sale. 17


24 Another way to look at this figure is, if the activity in question were to disappear and participants did not spend their money elsewhere, the economy would contract by this amount. Salaries and wages This figure reports the total salaries and wages paid in all sectors of the economy as a result of the activity under study. These are not just the paychecks of those employees directly serving recreators or manufacturing their goods, it also includes portions of the paychecks of, for example, the truck driver who delivers food to the restaurants serving recreators and the accountants who manage the books for companies down the supply chain, etc. This figure is based on the direct, indirect and induced effects, and is essentially a portion of the total economic effect figure reported in this study. Jobs Much like salaries and wages, this figure reports the total jobs in all sectors of the economy as a result of the activity under study. These are not just the employees directly serving recreators or manufacturing their goods, they also include, for example, the truck driver who delivers food to the restaurants serving recreators and the accountants who manage the books for companies down the supply chain, etc. This figure is based on direct, indirect and induced effects. Wildlife viewing is defined here as the primary purpose of observing, photographing or feeding of fish or other wildlife. Wildlife is defined as animals that are living in natural or wild environments. Animals in museums, zoos and aquariums are not included. Domestic and farm animals also are not included as wildlife. Wildlife viewing is divided into two types of activity: residential and nonresidential. According to the 2006 USFWS Survey, residential activities are those activities that occur within one mile of one s home for the primary purpose of observing, photographing or feeding wildlife. In contrast, according to the Survey, nonresidential activities are trips or outings that occur at least one mile from home for the primary purpose of observing, photographing or feeding wildlife. Given the definitions, residential activities are made by Florida residents, whereas non-residential activities are made by both Florida residents and nonresidents. Wildlife viewing, photography and feeding is enjoyed by million Florida residents 21 percent more than the population of the Tampa/St. Petersburg/ Clearwater metropolitan area. (U.S. Census Bureau) 18
 from the 2006 National Survey of Fishing, Hunting, and Wildlife-Associated Recreation (Survey); 2.")

25 Appendix B Methods The methods used to generate the economic impact estimates are separated into three stages: 1. Tabulate the expenditures made by recreators (16 years old and older) from the 2006 National Survey of Fishing, Hunting, and Wildlife-Associated Recreation (Survey); 2. Estimate the indirect and induced effects of the consumer spending through the use of an input-output model of the state economy and the IMPLAN economic modeling software; and 3. Estimate federal and state/local tax revenues with the IMPLAN economic modeling software. 1. Tabulating expenditures Wildlife viewing expenditures were obtained from the survey. This Survey is conducted approximately every five years by the FWS and U.S. Bureau of the Census. The Survey provides data required by natural resource management agencies, industry and private organizations at the local, state and national levels to assist in optimally managing natural resources. The Survey is funded through excise taxes on hunting and fishing equipment through the Federal Aid in Sport Fish and Wildlife Restoration Acts. Expenditures by wildlife viewers were categorized into resident and nonresident files. Both included information on travel-related categories such as food and lodging and equipment expenditures such as guidebooks and binoculars. Together, the resident and nonresident files represent all expenditures made in state in Applying the economic model To estimate the economic impacts, the data were analyzed with the IMPLAN input-output model. The IMPLAN model was developed by MIG, Inc. of Stillwater, Minn. originally for use by the U.S. Forest Service. Input-output models describe how sales in one industry impact other industries. For example, once a consumer makes a purchase, the retailer buys more merchandise from wholesalers, who buy more from manufacturers, who, in turn, purchase new inputs and supplies. In addition, the salaries and wages paid by these businesses stimulate more benefits. Simply, the first purchase creates numerous rounds of purchasing. Input-output analysis tracks how the various rounds of purchasing benefit other industries and generates economic benefits. 19


26 The relationships between industries are explained through multipliers. For example, an income multiplier of.09 for Industry X would indicate that for every dollar received by the industry under study, nine cents would be paid to the employees of Industry X for its products or services. The IMPLAN model provides multipliers for all major industries in the United States and for each state. The IMPLAN model includes output, earnings and employment multipliers. The output multiplier measures the total economic effect created by the original retail sale. The earnings multiplier measures the total salaries and wages generated by the original retail sale. The employment multiplier estimates the number of jobs supported by the original retail sale. IMPLAN also estimates federal, state and local tax revenues. To apply the IMPLAN model, wildlife viewing expenditures are matched to the appropriate industry sector. The resulting estimates describe the salaries and wages, total economic effects and jobs supported by the purchases made by wildlife viewers. This same process is repeated for all reported expenditures. 3. Estimating Tax Revenues The IMPLAN model estimates detailed tax revenues at the local, state and federal levels. The summary estimates provided in this report represent the total taxes estimated by the IMPLAN model including all income, sales, property and other taxes and fees that accrue to the various local, state and federal taxing authorities. The total spent annually in Florida for wildlife viewing is two and a half times greater than the value of the state s annual orange crop harvest. ($1.23 billion in 2006, per the USDA as reported by the Lakeland Ledger) 20
27 Appendix C Economic impact tables for wildlife viewing Economic sectors stimulated by nonresident Wildlife viewing spending* Agriculture, forestry, fish and hunting Total output (sales) Employment Income $7,886, $1,660,581 Mining $17,569, $1,109,874 Utilities $17,974, $3,773,144 Construction $6,413, $2,790,390 Manufacturing $96,645, $13,613,712 Wholesale trade $38,092, $16,238,840 Transportation and warehousing $172,607,136 1,095 $51,284,684 Retail trade $94,488,824 1,813 $43,774,668 Information $28,566, $7,549,087 Finance and insurance $41,523, $14,204,411 Real estate and rental $55,969, $10,857,670 Professional scientific and technical services $48,686, $22,986,248 Management of companies $13,843, $6,352,276 Administrative and waste services $30,507, $13,759,839 Educational services $3,539, $1,994,861 Health and social services $40,326, $21,889,040 Arts-entertainment and recreation Accommodation and food services $24,454, $9,358,849 $347,832,128 5,366 $117,583,840 Other services $30,704,092 1,122 $16,820,466 Government and non NAICs $51,629, $14,234,223 Total $1,169,261,121 13,297 $391,836,703 * Wildlife viewing expenditures benefit nearly all sectors of Florida s economy. For example, purchases of bird seed and the planting of wildlife food plots and backyard wildlife habitats stimulate the sale of seed and native plants through local stores and nurseries. 21
28 Economic sectors stimulated by resident Wildlife viewing spending* Total output (sales) Employment Income Agriculture, forestry, fish and hunting $106,166,352 2,727 $18,849,766 Mining $19,778, $1,469,441 Utilities $44,566, $9,317,842 Construction $16,659, $7,181,852 Manufacturing $1,299,312,384 4,093 $233,364,432 Wholesale trade $132,286,160 1,001 $56,393,924 Transportation and warehousing $251,205,088 1,283 $66,090,688 Retail trade $612,757,440 13,039 $317,525,184 Information $84,771, $22,440,736 Finance and insurance $129,257, $44,296,992 Real estate and rental $496,669,856 3,425 $80,890,856 Professional scientific and technical services Management of companies Administrative and waste services $162,094,752 1,499 $74,642,792 $47,474, $21,785,198 $81,306,096 1,505 $39,948,440 Educational services $11,176, $6,287,064 Health and social services Arts-entertainment and recreation Accommodation and food services $124,163,784 1,647 $67,391,976 $26,108, $10,958,147 $175,529,056 3,084 $60,660,084 Other services $116,552,056 1,982 $48,180,032 Government and non NAICs $135,725, $16,029,191 Total $4,073,563,023 38,069 $1,203,704,637 * Wildlife viewing expenditures benefit nearly all sectors of Florida s economy. For example, purchases of bird seed and the planting of wildlife food plots and backyard wildlife habitats stimulate the sale of seed and native plants through local stores and nurseries. 22
29 Economic sectors stimulated by resident and Nonresident wildlife viewing spending* Total output (sales) Employment Income Agriculture, forestry, fish and hunting $114,053,327 2,853 $20,510,347 Mining $37,347, $2,579,315 Utilities $62,541, $13,090,986 Construction $23,072, $9,972,242 Manufacturing $1,395,958,248 4,382 $246,978,144 Wholesale trade $170,378,452 1,289 $72,632,764 Transportation and warehousing $423,812,224 2,378 $117,375,372 Retail trade $707,246,264 14,851 $361,299,852 Information $113,338, $29,989,823 Finance and insurance $170,780,896 1,109 $58,501,403 Real estate and rental $552,639,068 3,818 $91,748,526 Professional scientific and technical services Management of companies Administrative and waste services $210,781,336 1,961 $97,629,040 $61,318, $28,137,474 $111,813,394 2,004 $53,708,279 Educational services $14,716, $8,281,925 Health and social services Arts-entertainment and recreation Accommodation and food services $164,489,844 2,181 $89,281,016 $50,563, $20,316,996 $523,361,184 8,450 $178,243,924 Other services $147,256,148 3,104 $65,000,498 Government and non NAICs $187,355, $30,263,414 Total $5,242,824,144 51,366 $1,595,541,340 * Wildlife viewing expenditures benefit nearly all sectors of Florida s economy. For example, purchases of bird seed and the planting of wildlife food plots and backyard wildlife habitats stimulate the sale of seed and native plants through local stores and nurseries. 23
 3.")
30 Appendix D More fun facts 1. Wildlife viewing supports nearly four times more jobs in-state than employed by FPL Group, the parent of Florida Power and Light. (2006 Fortune 500) 2. Wildlife viewing, photography and feeding is enjoyed by million Florida residents nearly 10 times more than the population of the Tallahassee metropolitan area. (U.S. Census Bureau) 3. Since 2001, the number of people who visited Florida to view wildlife increased 50 percent. (U.S. Fish and Wildlife Service s 2001 and 2006 National Surveys of Fishing, Hunting and Wildlife-Associated Recreation) 4. In 2006, the nonresident wildlife viewers in Florida (746,000) equaled the population of South Dakota and brought $653 million into the state economy. (U.S. Fish and Wildlife Service s 2006 National Survey of Fishing, Hunting and Wildlife-Associated Recreation; U.S. Census Bureau) 5. Approximately the same number of people participated in wildlife viewing in Florida than voted for either candidate in the 2004 presidential election. (3.274 million residents participated in wildlife viewing, million people voted for Bush and million voted for Kerry; U.S. Federal Elections Commission) 6. The state tax revenues from viewing wildlife in Florida in 2006 equaled half the annual toll collections on the Florida Turnpike. (Florida Department of Transportation) 7. In 2006, if the jobs supported by wildlife viewing expenditures had disappeared, the state unemployment rate would have jumped from 3.3 percent to 3.9 percent. (as of November, 2006; data source: U.S. Bureau of Labor Statistics) 8. Jobs supported by wildlife viewing in Florida are approximately the same size as the work force in the Sebastian/Vero Beach area. (U.S. Bureau of Labor Statistics) 9. In 2006, seven times more was spent just in Florida for wildlife viewing than earned nationally by Pirates of the Caribbean: Dead Man s Chest the top grossing movie of (BoxOfficeMojo.com) 24
31
32 Prepared by: Southwick Associates, Inc. P. O. Box 6435 Fernandina Beach, FL (904) For the February 27, 2008
The 2001 Economic Benefits of Hunting, Fishing and Wildlife Watching in MISSOURI. Prepared by:
 The 2001 Economic Benefits of Hunting, Fishing and Wildlife Watching in MISSOURI Prepared by: Southwick Associates, Inc. PO Box 6435 Fernandina Beach, FL 32035 Ph (904) 277-9765 Fax (904) 261-1145 Email:
The 2006 Economic Benefits of Hunting, Fishing and Wildlife Watching in TEXAS. Prepared by:
 The 2006 Economic Benefits of Hunting, Fishing and Wildlife Watching in TEXAS Prepared by: Southwick Associates, Inc. P.O. Box 6435 Fernandina Beach, FL 32035 Ph (904) 277-9765 Fax (904) 261-1145 Email:
The 2006 Economic Benefits of Hunting, Fishing and Wildlife Watching in NORTH CAROLINA. Prepared by:
 The 2006 Economic Benefits of Hunting, Fishing and Wildlife Watching in NORTH CAROLINA Prepared by: Southwick Associates, Inc. P.O. Box 6435 Fernandina Beach, FL 32035 Ph (904) 277-9765 Fax (904) 261-1145
Wildlife Watching in the U.S.: The Economic Impacts on National and State Economies in 2011
 U.S. Fish & Wildlife Service Wildlife Watching in the U.S.: The Economic Impacts on National and State Economies in 2011 Addendum to the 2011 National Survey of Fishing, Hunting, and Wildlife-Associated
The University of Georgia
 The University of Georgia Center for Agribusiness and Economic Development College of Agricultural and Environmental Sciences Economic Impacts of Alabama Quail Hunting Prepared by: Archie Flanders and
WILDLIFE WATCHING U.S. FISH & WILDLIFE SERVICE 2006 NATIONAL SURVEY HIGHLIGHTS*
 WILDLIFE WATCHING U.S. FISH & WILDLIFE SERVICE 2006 NATIONAL SURVEY HIGHLIGHTS* During 2006, 71 million U.S. residents, 31 percent of the U.S. population sixteen years old and older, participated in wildlife-watching
The Power of Outdoor Recreation Spending in Pennsylvania:
 The Power of Outdoor Recreation Spending in Pennsylvania: How hunting, fishing, and outdoor activities help support a healthy state economy November, 2018 Prepared for the Theodore Roosevelt Conservation
Wildlife Watching in the U.S.: The Economic Impacts on National and State Economies in 2006
 U.S. Fish & Wildlife Service Wildlife Watching in the U.S.: The Economic Impacts on National and State Economies in 2006 Addendum to the 2006 National Survey of Fishing, Hunting, and Wildlife-Associated
Economic Contribution of the 2018 Recreational Red Snapper Season in the South Atlantic
 Economic Contribution of the 2018 Recreational Red Snapper Season in the South Atlantic Produced for the: American Sportfishing Association (ASA) PO Box 6435 Fernandina Beach, FL 32035 Office (904) 277-9765
Hunter and Angler Expenditures, Characteristics, and Economic Effects, North Dakota,
 Agribusiness and Applied Economics Report No. 507-S January 2003 Hunter and Angler Expenditures, Characteristics, and Economic Effects, North Dakota, 2001-2002 Dean A. Bangsund and F. Larry Leistritz*
COOPERATIVE EXTENSION Bringing the University to You
 COOPERATIVE EXTENSION Bringing the University to You Special Publication - 06-16 ECONOMIC IMPACT OF TOURISM ON COLORADO RIVER COMMUNITIES INCLUDING: LAUGHLIN BULLHEAD CITY FORT MOHAVE MOHAVE VALLEY GOLDEN
The 2010 Economic Contribution of Tourism to the Meadowlands Liberty Region
 The 2010 Economic Contribution of Tourism to the Meadowlands Liberty Region Key Metrics & Evaluation 93 MAIN STREET :: ANNAPOLIS, MD 21401 WWW.VANTAGESTRATEGY.COM :: 202-449- 9708 1 Vantage Strategy ::.
VALUES ASSOCIATED WITH THE APALACHICOLA BAY MARINE ECONOMY
 PBTC 03-3 VALUES ASSOCIATED WITH THE APALACHICOLA BAY MARINE ECONOMY By Alan W. Hodges and Charles Adams PBTC 03-3 March 2003 POLICY BRIEF SERIES INTERNATIONAL AGRICULTURAL TRADE AND POLICY CENTER MISSION
Independent Economic Analysis Board. Review of the Estimated Economic Impacts of Salmon Fishing in Idaho. Task Number 99
 IEAB Independent Economic Analysis Board Roger Mann, Chair Noelwah R. Netusil, Vice-Chair Kenneth L. Casavant Daniel D. Huppert Joel R. Hamilton Lon L. Peters Susan S. Hanna Hans Radtke Review of the Estimated
The Economic Impact of Golf In South Carolina
 The Economic Impact of Golf In South Carolina By Dudley Jackson Research Director South Carolina Department of Parks, Recreation and Tourism For South Carolina Golf Course Owners Association April 2016
Economic Impact Analysis BOONE DOCKS RESORT AND MARINA, LLC
 Economic Impact Analysis BOONE DOCKS RESORT AND MARINA, LLC Analysis conducted using the on-line Boating Economic Impact Model developed by Drs. Ed Mahoney (mahoneye@msu.edu), Dan Stynes (stynes@msu.edu)
2001 National Survey of Fishing, Hunting, and Wildlife-Associated Recreation National Overview
 U.S. Fish & Wildlife Service National Survey of Fishing, Hunting, and Wildlife-Associated Recreation National Overview Issued May 2002 Preliminary Findings Tami Heilemann/DOI Director s Message Our fish
colorado.edu/business/brd
 colorado.edu/business/brd Big Changes, Unknown Impacts Southwest Business Forum Place cover image here Richard Wobbekind Senior Economist and Associate Dean for Business and Government Relations January
Sport Fishing Expenditures and Economic Impacts on Public Lands in Washington
 Sport Fishing Expenditures and Economic Impacts on Public Lands in Washington For: Northwest Sportfishing Industry Association By: Southwick Associates Released June 2015 PO Box 6435 Fernandina Beach,
THE ECONOMIC IMPACT OF RECREATIONAL SALTWATER FISHING ON THE LOUISIANA ECONOMY
 THE ECONOMIC IMPACT OF RECREATIONAL SALTWATER FISHING ON THE LOUISIANA ECONOMY By Loren C. Scott & Associates, Inc. 743 Woodview Court Baton Rouge, LA 70810 225-751-1707 lorencscott@aol.com for The Coastal
15, 2015 EXECUTIVE SUMMARY
 Economic Contribution, Impacts, and Economic Benefits of Deer, Waterfowl and Upland Game Bird Hunting in North and South Dakota: Relationship to CRP Lands Dr. John Loomis and Dr. Michelle Haefele in cooperation
Economic Impact of Hunting Expenditures on Southern U.S
 Economic Impact of Hunting Expenditures on Southern U.S Jagdish Poudel (Corresponding author) Graduate Research Assistant Forest and Wildlife Research Center College of Forest Resource Mississippi State
HUNTING IN AMERICA. An Economic Force for Conservation 2018 EDITION
 HUNTING IN AMERICA An Economic Force for Conservation 2018 EDITION HUNTING IN AMERICA Hunting is a grand tradition in America, loved and practiced by millions of people each year. Despite stereotypical
Final Report, October 19, Socioeconomic characteristics of reef users
 Socioeconomic Study of Reefs in Southeast Florida - Executive Summary By Hazen and Sawyer in association with Florida State University and National Oceanic and Atmospheric Administration, October 19, 2001
A study prepared for: Presented by:
 Economic Impact of the Coachella Valley Golf Industry A study prepared for: Presented by: Acknowledgements The Hi-Lo Desert Golf Course Superintendents Association would like to acknowledge the California
State and National Economic Effects of Fishing, Hunting and Wildlife-Related Recreation on U.S. Forest Service-Managed Lands
 State and National Economic Effects of Fishing, Hunting and Wildlife-Related Recreation on U.S. Forest Service-Managed Lands Prepared by the: American Sportfishing Association for the: Wildlife, Fish and
2016 National Survey of Fishing, Hunting, and Wildlife-Associated Recreation
 U.S. Fish & Wildlife Service 2016 National Survey of Fishing, Hunting, and Wildlife-Associated Recreation National Overview Issued August 2017 Preliminary Findings Director s Message From the earliest
Sport Fishing Expenditures and Economic Impacts on Public Lands in Oregon
 Sport Fishing Expenditures and Economic Impacts on Public Lands in Oregon For: Northwest Sportfishing Industry Association By: Southwick Associates October 2013 PO Box 6435 Fernandina Beach, FL32035 Tel
The Economic Impact of Recreational Fishing in the Everglades Region
 The Economic Impact of Recreational Fishing in the Everglades Region Prepared for: The Everglades Foundation Prepared by: Tony Fedler, Ph.D. For the Bonefish and Tarpon Trust December 2009 Table of Contents
ECONOMIC ACTIVITY ASSOCIATED WITH HUNTING ALONG THE TEXAS GULF COAST. Joni S. Charles, PhD. Contracted through the. River Systems Institute
 ECONOMIC ACTIVITY ASSOCIATED WITH HUNTING ALONG THE TEXAS GULF COAST Joni S. Charles, PhD Contracted through the River Systems Institute Texas State University San Marcos For the National Wildlife Federation
2011 National Survey of Fishing, Hunting, and Wildlife-Associated Recreation
 U.S. Fish & Wildlife Service 2011 National Survey of Fishing, Hunting, and Wildlife-Associated Recreation National Overview Issued August 2012 Preliminary Findings Director s Message From its monumental
The Economic Impact of Colonial Downs in Virginia
 The Economic Impact of Colonial Downs in Virginia Prepared for Revolutionary Racing January 31, 2018 1309 E Cary Street, Richmond, VA 23219 1025 Huron Road East, Cleveland, OH 44115 chmuraecon.com Table
Economic Contribution of Off-Highway Vehicle Recreation in Colorado. Executive Summary Season. A joint cooperation report
 Economic Contribution of Off-Highway Vehicle Recreation in Colorado Executive Summary 2014-2015 Season A joint cooperation report Page intentionally left blank to accommodate double-sided printing December
Big Changes, Unknown Impacts
 Big Changes, Unknown Impacts Boulder Economic Forecast Place cover image here Richard Wobbekind Senior Economist and Associate Dean for Business and Government Relations January 17, 2018 Real GDP Growth
THE ECONOMIC CONTRIBUTION FROM HORSES
 THE ECONOMIC CONTRIBUTION FROM HORSES ECONOMIC CONTRIBUTION FROM HORSES HIGHLIGHTS The horse industry contributes more than $19 billion annually to the Canadian economy On-farm activities with horses generate
Big Blue Adventure Event Analysis UTC Tourism Center October 2016
 A report summarizing Big Blue Adventure events economic impact on the Lake Tahoe region as well as participants assessments of their event experience Big Blue Adventure Event Analysis UTC Tourism Center
Economic Analysis of Marine Recreational Fishing at NOAA Fisheries
 Economic Analysis of Marine Recreational Fishing at NOAA Fisheries Office of Science & Technology Sabrina Lovell Recreational Fisheries Economist March 8, 2017 Presented at EAA Seminar: Sustainable fisheries
The 2017 Economic Contributions of Outdoor Recreation in Colorado A regional and county-level analysis
 July 23, 2018 The 2017 Economic Contributions of Outdoor Recreation in Colorado A regional and county-level analysis Colorado Parks & Wildlife Denver, CO PO Box 6435 Fernandina Beach, FL 32035 Office (904)
Economic Impact of the Recreational Marine Industry Broward, Miami-Dade, and Palm Beach Counties, Florida
 Economic Impact of the Recreational Marine Industry Broward, Miami-Dade, and Palm Beach Counties, Florida - 2018 Completed by THOMAS J. MURRAY & ASSOCIATES, INC. For MARINE INDUSTRIES ASSOCIATION OF SOUTH
Teton County Related Hunting and Fishing Spending, For the Wyoming Wildlife Federation. David T. Taylor & Thomas Foulke
 Teton County Related Hunting and Fishing Spending, 2015 For the Wyoming Wildlife Federation University of Wyoming, Department of Agricultural & Applied Economics David T. Taylor & Thomas Foulke 1 February
Fremont County Related Hunting and Fishing Spending, 2015
 Fremont County Related Hunting and Fishing Spending, 2015 For the Wyoming Wildlife Federation University of Wyoming, Department of Agricultural & Applied Economics David T. Taylor & Thomas Foulke September,
Nevada County Population Projections 2015 to 2034
 Nevada County Population Projections 2015 to 2034 Prepared By: Jeff Hardcastle, AICP Nevada State Demographer Nevada Department of Taxation Reno Office: 4600 Kietzke Lane, Building L Suite 235 Reno, NV
Commercial Red Grouper Fishing in the Gulf of Mexico States
 Commercial Red Grouper Fishing in the Gulf of Mexico States According to NOAA Fisheries (https://www.fisheries.noaa.gov/species/red-grouper), the red grouper (Epinephelus morio) fishery in the Gulf of
Carbon County Related Hunting and Fishing Spending, 2015
 Carbon County Related Hunting and Fishing Spending, 2015 1 For the Wyoming Wildlife Federation University of Wyoming, Department of Agricultural & Applied Economics AAAAddd David T. Taylor & Thomas Foulke
Marine Recreational and Commercial Industries and Activities in Lee and Charlotte Counties: Economic Consequences and Impacts
 Marine Recreational and Commercial Industries and Activities in Lee and Charlotte Counties: Economic Consequences and Impacts Betty Staugler Florida Sea Grant Extension Marine Agent & Chuck Adams Florida
SPORTING HERITAGE. Fueling the American Economy 2018 EDITION
 AMERICA S SPORTING HERITAGE Fueling the American Economy 2018 EDITION INTRODUCTION One of the greatest benefits all Americans share is their access to the great outdoors. Whether fishing in a suburban
Lower Fryingpan River and Ruedi Reservoir Economic Impact Study
 Lower Fryingpan River and Ruedi Reservoir Economic Impact Study July, 2015 Martin Shields, Colorado State University Martin.Shields@colostate.edu John Loomis, Colorado State University Rebecca Hill, Colorado
2011 National Survey of Fishing, Hunting, and Wildlife-Associated Recreation
 U.S. Fish & Wildlife Service 2011 National Survey of Fishing, Hunting, and Wildlife-Associated Recreation State Overview Issued September 2012 Preliminary Estimates 2 2011 National Survey of Fishing, Hunting,
Economic Contribution of Off-Highway Vehicle Recreation in Colorado July 2009
 Colorado Off-Highway Vehicle Coalition Economic Contribution of Off-Highway Vehicle Recreation in Colorado July 2009 www.cohvco.org THE Louis Berger Group, INC. 12596 W. Bayaud Ave. Suite 201 Lakewood,
U.S. Fish & Wildlife Service National Survey of Fishing, Hunting, and Wildlife-Associated Recreation. Wyoming. Bait
 U.S. Fish & Wildlife Service 2011 National Survey of Fishing, Hunting, and Wildlife-Associated Recreation Wyoming Bait FHW/11-WY (RV) Revised January 2014 2011 National Survey of Fishing, Hunting, and
Texas Housing Markets: Metropolitan vs. Border Communities. September 22, 2014
 Texas Housing Markets: Metropolitan vs. Border Communities Luis Bernardo Torres Ruiz, Ph.D. Research Economist El Paso Branch Dallas Federal Rio Grande Economic Association September 22, 2014 Contents
Nevada County Population Projections 2013 to 2032 Based On The Last Estimate Year of 2012
 Nevada County Population Projections 2013 to 2032 Based On The Last Estimate Year of 2012 Prepared By: The Nevada State Demographer s Office Jeff Hardcastle, AICP NV State Demographer University of NV
The Economic Significance of Florida Bay. Dr. Andrew Stainback GEER April Coral Springs, Florida
 The Economic Significance of Florida Bay Dr. Andrew Stainback GEER April 17-20 Coral Springs, Florida The Economic Significance of Florida Bay o Florida Bay provides numerous benefits that directly impact
An input-output analysis of recreational fishing expenditures (2006 & 2011) across the southern United States
 across the southern United States") International Journal of Environmental Studies ISSN: 0020-7233 (Print) 1029-0400 (Online) Journal homepage: http://www.tandfonline.com/loi/genv20 An input-output analysis of recreational fishing expenditures
International Journal of Environmental Studies ISSN: 0020-7233 (Print) 1029-0400 (Online) Journal homepage: http://www.tandfonline.com/loi/genv20 An input-output analysis of recreational fishing expenditures
Re: Algae/Cyanobacteria Bloom in St. Lucie, Martin, Palm Beach and Lee Counties.
 July 18, 2016 Richard L. Scott Governor, State of Florida 400 S Monroe St Tallahassee, FL 32399 Re: Algae/Cyanobacteria Bloom in St. Lucie, Martin, Palm Beach and Lee Counties. Dear Governor Scott: I am
A Social and Economic Analysis of the Recreational Fisheries in Mississippi Flood Control Reservoirs
 A Social and Economic Analysis of the Recreational Fisheries in Mississippi Flood Control Reservoirs Final Report Federal Assistance in Sport Fish Restoration Grant F-138 Jan. 1, 2006 June 30, 2008 Kevin
Impacts of Nonresident Sportfishing on the Ketchikan Economy. Prepared for: Ketchikan Visitors Bureau
 Impacts of Nonresident Sportfishing on the Ketchikan Economy Prepared for: Ketchikan Visitors Bureau February 2010 Impacts of Nonresident Sportfishing on the Ketchikan Economy Prepared for: Ketchikan Visitors
Golfers in Colorado: The Role of Golf in Recreational and Tourism Lifestyles and Expenditures
 Golfers in Colorado: The Role of Golf in Recreational and Tourism Lifestyles and Expenditures by Josh Wilson, Phil Watson, Dawn Thilmany and Steve Davies Graduate Research Assistants, Associate Professor
Economic Impact of Mountain Biking in the Nantahala and Pisgah National Forests
 Economic Impact of Mountain Biking in the Nantahala and Pisgah National Forests JAMES N. MAPLES, Ph D MICHAEL J. BRADLEY, Ph D Report submitted to Outdoor Alliance on August 5, 2017 Study funded by Outdoor
Economic Impact of the Michigan Equine Industry, 2006
 Economic Impact of the Michigan Equine Industry, 2006 Summary Animals and operations 155,000 equine animals housed in Michigan on June 1, 2007-86,000 at private residences - 21,000 at breeding farms -
The Economic Impacts of Recreational Fishing in the Matagorda Bay System
 The Economic Impacts of Recreational Fishing in the Matagorda Bay System Prepared by Andrew Ropicki 1 Daniel Hanselka 2 Rebekka Dudensing 3 Rhonda Cummins 4 Bill Balboa 5 December 12, 2016 1 Assistant
ASSOCIATION OF FISH AND WILDLIFE AGENCIES HUNTING. in America AN ECONOMIC ENGINE AND CONSERVATION POWERHOUSE
 ASSOCIATION OF FISH AND WILDLIFE AGENCIES HUNTING in America AN ECONOMIC ENGINE AND CONSERVATION POWERHOUSE Hunting in America HUNTING IS ONE OF THE GREATEST of America s traditional pastimes with a history
The Economic Benefits of Hunting and Fishing Activities in Alberta in 2008
 The Economic Benefits of Hunting and Fishing Activities in Alberta in 2008 Submitted to Hunting For Tomorrow Foundation Submitted by May, 2009 Introduction Hunting and Fishing related expenditures by Alberta
Department of Agricultural and Resource Economics, Fort Collins, CO
 July 2011 EMPR 11-01 Department of Agricultural and Resource Economics, Fort Collins, CO 80523-1172 http://dare.colostate.edu/pubs WHAT IS THE VALUE OF A FISHING TRIP? A COMPARISON OF PUBLIC AND PRIVATE
AMERICAN SPORTFISHING ASSOCIATION SPORTFISHING. in America AN ECONOMIC ENGINE AND CONSERVATION POWERHOUSE
 AMERICAN SPORTFISHING ASSOCIATION SPORTFISHING in America AN ECONOMIC ENGINE AND CONSERVATION POWERHOUSE REVISED JANUARY 2008 Sportfishing in America TO MOST PEOPLE, fishing is seen as an enjoyable escape
Bob Costello Chief Economist & Vice President American Trucking Associations. Economic & Motor Carrier Industry Update.
 Bob Costello Chief Economist & Vice President American Trucking Associations Economic & Motor Carrier Industry Update February 26, 2013 The Worst Recession Since the Great Depression 0% Loss from Peak
The Economic Impacts of Recreational Fishing in the San Antonio Bay System
 The Economic Impacts of Recreational Fishing in the San Antonio Bay System Prepared by Andrew Ropicki 1 Daniel Hanselka 2 Rebekka Dudensing 3 Rhonda Cummins 4 December 12, 2016 1 Assistant Professor and
University Of Maryland
 2000 Census Census Data 200 Census Change 2000 to 200 SUBJECT Number Percent SUBJECT Number Percent Number Percent TOTAL POPULATION 437 TOTAL POPULATION 246-9 -43.7 White 283 64.8 White 65 67. -8-4.7 Black
ECONOMIC DEVELOPMENT ELEMENT
 ECONOMIC DEVELOPMENT ELEMENT Background The Economic Development Element considers labor force and labor force characteristics, employment by place of work and residence, and analysis of the community
2005 Arkansas Nongame Wildlife Conservation Survey
 2005 Arkansas Nongame Wildlife Conservation Survey by Survey Research Center Institute of Government University of Arkansas at Little Rock 2801 South University Avenue Little Rock Arkansas 72204 501.569.8561
SHOOTING IN AMERICA. An Economic Force for Conservation 2018 EDITION
 TARGET SHOOTING IN AMERICA An Economic Force for Conservation 2018 EDITION INTRODUCTION Target shooting is enjoyed by millions of Americans each year. It is so popular, in fact: More people participate
Wenlin Liu, Senior Economist. Stateof Wyoming. Economic Analysis Division State of Wyoming 1
 WYOMING DEMOGRAPHIC AND ECONOMIC TREND LCCC LIFE Program April 7, 2012 Cheyenne, Wyoming Wenlin Liu, Senior Economist Economic Analysis Division Stateof Wyoming Economic Analysis Division State of Wyoming
ECONOMIC IMPACTS AND CONTRIBUTIONS OF SPORTFISHING IN ALASKA
 ECONOMIC IMPACTS AND CONTRIBUTIONS OF SPORTFISHING IN ALASKA 2 0 0 7 R E P O R T A Message from the Director CHARLIE SWANTON, DIRECTOR ADF&G, DIVISION OF SPORT FISH Alaska supports arguably some of the
Economic Growth in the Trump Economy
 Economic Growth in the Trump Economy Presented to State Data Center Conference William F. Fox, Director November 18, 2016 GDP Grows, Though Slowly 10.0 8.0 Percentage Change, Previous Qtr, SAAR 6.0 4.0
Angler Use, Harvest and Economic Assessment on Trout Stocked Streams in Pennsylvania
 Angler Use, Harvest and Economic Assessment on Trout Stocked Streams in Pennsylvania R. Greene 1, R. Weber 1, R. Carline 2, D. Diefenbach 2 and M. Shields 3 1 Pennsylvania Fish & Boat Commission Fisheries
 Time of Change We Are Growing We Are An Attractive Place To Live We Are Age Diverse + Living Longer 50000 40000 30000 20000 10000 0 2010 Census Job Density Housing Sheds Transit Sheds The Project FUNDING
Economic Impact of Recreational Fishing for Bonefish, Permit and Tarpon in Belize for 2007
 Economic Impact of Recreational Fishing for Bonefish, Permit and Tarpon in Belize for 2007 Prepared by: Anthony J. Fedler, Ph.D. Human Dimensions Consulting 9707 SW 55 th Road Gainesville, Florida 32608
Job Creation Survey, 4 th Quarter 2015 and 1 st Quarter 2016
 Job Creation Survey, 4 th Quarter 2015 and 1 st Quarter 2016 Summary Finding and Selected Tables National Bureau of Statistics June, 2016. Summary Findings and Tables of the Quarterly Job Creation 4 th
Central Hills Prairie Deer Goal Setting Block G9 Landowner and Hunter Survey Results
 Central Hills Prairie Deer Goal Setting Block G9 Landowner and Hunter Survey Results Table of Contents Public Surveys for Deer Goal Setting... 1 Methods... 1 Hunter Survey... 2 Demographics... 2 Population
The Greater Sage-Grouse:
 The Greater Sage-Grouse: Hunter opinions regarding potential conservation strategies in eleven western states For: National Wildlife Federation October 30, 2014 PO Box 6435 Fernandina Beach, FL 32035 Tel
ECONOMIC IMPACT OF THE UNITED STATES CERVID FARMING INDUSTRY
 ECONOMIC IMPACT OF THE UNITED STATES CERVID FARMING INDUSTRY Agricultural and Food Policy Center Texas A&M University August 007 Department of Agricultural Economics Texas Agricultural Experiment Station
Angling in Manitoba (2000)
") Angling in Manitoba (2000) TABLE OF CONTENTS Page Introduction 1 Angler Profile 2 Angling Effort 7 Catch and Harvest 10 Angling Expenditures 13 Bait Use 16 Nonresident Trip Characteristics 18 Angling in
Angling in Manitoba (2000) TABLE OF CONTENTS Page Introduction 1 Angler Profile 2 Angling Effort 7 Catch and Harvest 10 Angling Expenditures 13 Bait Use 16 Nonresident Trip Characteristics 18 Angling in
Rural Ontario s Hidden Sector: The Economic Importance of the Horse Industry Final Report
 Rural Ontario s Hidden Sector: The Economic Importance of the Horse Industry Final Report - 2009 Photo Credit: J.W. Wilton Dr. Bronwynne Wilton and Dr. Wayne Caldwell University of Guelph 1 Executive Summary
Northwest Parkland-Prairie Deer Goal Setting Block G7 Landowner and Hunter Survey Results
 Northwest Parkland-Prairie Deer Goal Setting Block G7 Landowner and Hunter Survey Results Table of Contents Public Surveys for Deer Goal Setting... 1 Methods... 1 Hunter Survey... 2 Demographics... 2 Population
RESIDENTIAL AND GOLF COURSE MARKET ANALYSIS AND FINANCIAL FEASIBILITY STUDY
 RESIDENTIAL AND GOLF COURSE MARKET ANALYSIS AND FINANCIAL FEASIBILITY STUDY APPLETREE GOLF COURSE FOUNTAIN, COLORADO PREPARED FOR: CITY OF FOUNTAIN Economic & Market Research / Land & Development Planning
Market Size and Economic Impact of the Sporting Firearms and Ammunition Industry in America
 SPORTING ARMS AND AMMUNITION MANUFACTURERS' INSTITUTE, INC. Since 1926 Market Size and Economic Impact of the Sporting Firearms and Ammunition Industry in America (2004 Revised Edition) Background Paper
A Threatened Bay: Challenges to the Future of the Penobscot Bay Region and its Communities
 A Threatened Bay: Challenges to the Future of the Penobscot Bay Region and its Communities 1 A A Threatened Bay: Challenges to the Future of the Penobscot Bay Region and its Communities In 1996 the Island
A Measure of the Economic Impact of Keeneland Racing and Sales on Lexington-Fayette County. Prepared by the Center for Business and Economic Research
 A Measure of the Economic Impact of Keeneland Racing and Sales on Lexington-Fayette County Prepared by the Gatton College of Business and Economics April 20, 2015 Gatton College of Business and Economics
The Chamber of Commerce for Greater Philadelphia Economic Outlook Survey Results
 The Chamber of Commerce for Greater Philadelphia Economic Outlook Survey Results January 19, 2018 Elif Sen Senior Economic Analyst FEDERAL RESERVE BANK OF PHILADELPHIA * The views expressed today are my
Angler Spending on Fishing-related Durable Goods: Results from the 2014 Marine Recreational Fishing Expenditure Survey
 Angler Spending on Fishing-related Durable Goods: Results from the 2014 Marine Recreational Fishing Expenditure Survey Sabrina Lovell1, James Hilger2, and Scott Steinback3 NAAFE 2015 Ketchikan, AK 1US
2014 Economic Indicators, Trends & Observations. 51 South Main Street Janesville, WI P F RockCountyAlliance.
 2014 Economic Indicators, Trends & Observations 51 South Main Street Janesville, WI 53545 P.608.757.5598 F.608.757.5586 RockCountyAlliance.com Indicators, Trends & Observations National Level State of
Labour Market Segmentation in Poland. Artur Gajdos Department of Spatial Econometrics University of Lodz
 Labour Market Segmentation in Poland Artur Gajdos Department of Spatial Econometrics University of Lodz gajdos@uni.lodz.pl Lisbon, 24 November 2016 Agenda Introduction Labour market facts Policy reforms
THE PERRYMAN GROUP. The Economic Benefits of the Precision Dance Industry Inspired by the Kilgore College Rangerettes
 The Economic Benefits of the Precision Dance Industry Inspired by the Kilgore College Rangerettes THE PERRYMAN GROUP 510 N. Valley Mills Dr. Suite 300 Waco, TX 76710 ph. 254.751.9595 fax 254.751.7855 info@perrymangroup.com
2018 Annual Economic Forecast Dragas Center for Economic Analysis and Policy
 2018 Annual Economic Forecast Dragas Center for Economic Analysis and Policy PRESENTING SPONSOR EVENT PARTNERS 2 The forecasts and commentary do not constitute an official viewpoint of Old Dominion University,
Vision - Britain's Ocean City One of Europe's most vibrant waterfront cities where an outstanding quality of life is enjoyed by everyone
 PLYMOUTH Economy Nina Sarlaka, Enterprise & Inward Investment Manager Vision - Britain's Ocean City One of Europe's most vibrant waterfront cities where an outstanding quality of life is enjoyed by everyone
THE FUTURE OF SALES TAX REVENUE
 THE FUTURE OF SALES TAX REVENUE Presented by Adam Fulton, Senior Economic Associate The Outlook for Sales Taxes State governments rely on state sales taxes for more than a fifth of their revenue Economic
Not For Sale. An American Profile: The United States and Its People
 An American Profile: The United States and Its People Not For Sale 1 759_EM_AmPro_ptg1.indd 1 Not For Sale 759_EM_AmPro_ptg1.indd 2 An American Profile: The United States and Its People 3 Table 1 Population,
Recreational Fishing License Sales in Florida:
 Recreational Fishing License Sales in Florida: 1990-2000 1 Kristina Stephan and Chuck Adams 2 Introduction The recreational fishing industry is an important natural resource-based industry in Florida.
The Economic Impacts of Carolina Beach Inlet Navigability
 The Economic s of Carolina Beach Inlet Navigability June 27, 2014 By: Chris Dumas, Ph.D. Department of Economics and Finance Cameron School of Business UNC-Wilmington 601 South College Road Wilmington,
Fiscal Impact of SunTrust Park and The Battery Atlanta on Cobb County Executive Summary Sept. 18, 2018
 Fiscal Impact of SunTrust Park and The Battery Atlanta on Cobb County Executive Summary Sept. 18, 2018 Overview Historically, professional sports stadiums were privately owned by the sports teams that