Background Summary Kaibab Plateau: Source: Kormondy, E. J. (1996). Concepts of Ecology. Englewood Cliffs, NJ: Prentice-Hall. p.96.
|
|
|
- Pierce Blake
- 5 years ago
- Views:
Transcription

1 Assignment #1: Policy Analysis for the Kaibab Plateau Background Summary Kaibab Plateau: Source: Kormondy, E. J. (1996). Concepts of Ecology. Englewood Cliffs, NJ: Prentice-Hall. p.96. Prior to 1907, the deer herd on the Kaibab Plateau, which consists of some 727,000acres and is on the north side of the Grand Canyon in Arizona, numbered about 4,000. In 1907, a bounty was placed on cougars, wolves, and coyotes all natural predators (over 8,000) and a consequent and immediate irruption of the deer population. By 1918, the deer population had increased more than tenfold; the evident over browsing of the area brought the first of a series of warnings by competent investigators, none of which produced a much needed quick change in either the bounty policy or that deal with deer removal. In the absence of predation by its natural predators (cougars, wolves, coyotes) or by man as a hunter, the herd reached 100,000 in 1924; in the absence of sufficient food, 60 percent of the herd died off in two successive winters. By then, the girdling of so much of the vegetation through browsing precluded recovery of the food reserve to such an extent that subsequent die-off and reduced natality yielded a population about half that which could theoretically have been previously maintained. Perhaps the most pertinent statement relative to the matter of the interregulatory effect of predator and prey is the following by Aldo Leopold, one of the most significant of recent figures on the conservation scene: We have found no record of a deer irruption in North America antedating the removal deer predators. Those parts of the continent which still retain the native predators have reported no irruptions. This circumstantial evidence supports the surmise that removal of predators predisposes a deer herd to irruptive behavior. 1
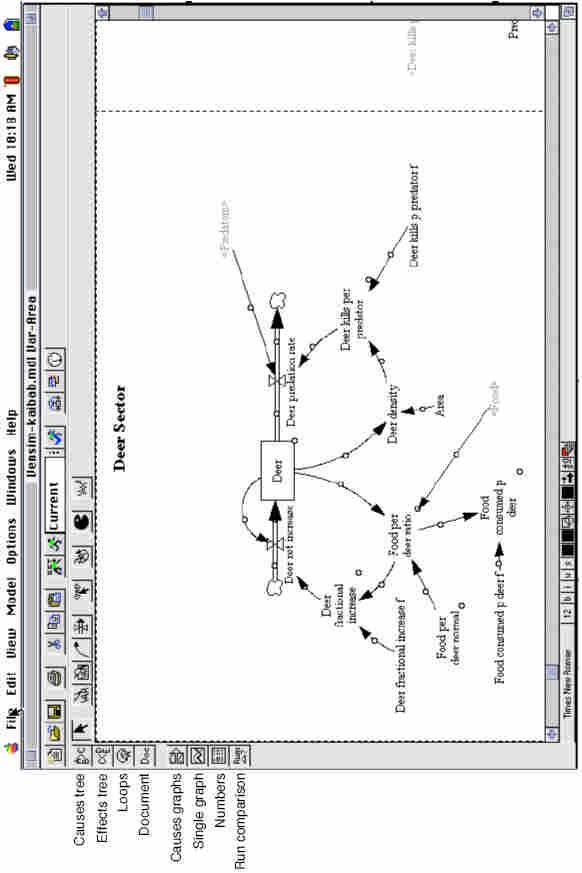
2 The Task: Your task is to maintain the environmental balance of the Kaibab Plateau with the focus on the task of controlling of the deer population which has grown alarmingly since the elimination of predators began around In addition, you have to take into consideration the voices of various opinion groups of local residents while making policy recommendations. These groups and their opinions are as follows: The Sierra Club argues that the elimination of the predators is mainly responsible for the problem, so reintroduction of the predators, such as cougars and wolves, will solve it. The ranchers, who are worried about their herds to be attacked by the predators, are seriously against the idea of reintroduction of predators. The local hunters want free access to the plateau to harvest predators. Overview of Vensim PLE: Open the Kaibab model in Vensim PLE, and you should see a screen below: a. To change the view of the model, go to the function menu on the top of the window, select View/Zoom/, and use the options to change the size of the view. b. To change the setting for printing out the model, go to the function menu, select File/Print Options, and use the options there to change the setting for print out. c. To change the simulation setting of the model, go to the function menu, select Model/Setting, and use the options to change the simulation setting, such as the simulation time frame. 2
3 3
4 The Assignment: (1) Draw a causal-loop diagram for the whole Kaibab model. Identify the stocks (a.k.a. levels) by using rectangles to represent them, while leave the rest in simple words and arrows (e.g. represent an inflow/outflow as a variable, which is shown as a word or a set of simple words). Since a model usually contains a number of loops which are difficult for us to identify with our eyes. However, Vensim PLE provides a tool that can help us to identify the loop(s) that a particular variable/stock is in. Use the following procedure: Double click the Deer stock to select it (it should appear in the window bar, the blue bar at the very top of Vensim window, as the variable on Vensim s workbench. ) Use the loop symbol in the vertical bar of tools at the left of the Vensim screen (the 3 rd one on the vertical bar). You will see a list of loops in lengths (the number of other variables around the loop). Start with the loop 1 and draw it. Proceed until you finish drawing all the loops that involve Deer. Use the same procedure on Predator and Food to draw all the loops that involve them. Finally, try to organize your stocks, variables, and arrows to make your diagram clear as possible as you can, but do not waste too much time on it. Identify the polarities of links (arrows) and loops in your diagram. (2) On the menu bar at the top of Vensim screen (see the figure below), there is a text field for you to name each simulation run. In the figure below, the name is Base, but you can name it anything as you wish (it is not case sensitive). Once you name your simulation run (e.g. Base run kaibab ), click to runner button to simulate the model. When the simulation is done you will see a pop-up window wit some warnings. Please ignore them for now and close the window. Click on the dial button at the right-end of the menu bar (see the figure above) to bring up the Control Panel (see the figure below) and choose the Graphs tag. 4

5 There are two kinds of graphs that are set in advance. Double-click the KAIBAB POPULATIONS (or select it and then click the Display button) to show a graph of Deer, Predators, and Food. Click on the other graph to see some other information. You can also use the Graph button and the Casual Graph button of the menu bar at the left of Vensim window to get some more information to understand and evaluate the kaibab model. A suggestion here is that you can use these two buttons to show graphs of key variables and stocks to help you explain why you think it is appropriate for us to use this kaibab model to test policies for the Kaibab Plateau (use the concept of reference mode. ) You can copy the graphs by using the Export button on the menu bar at the top of the Graph window (see the figures below) and paste them to your Word processing document. 5

6 (3) Policy analysis: Reintroduction of predators The Predator harvest fraction in Predator Sector of the model represents the fraction of the predator population that ranchers and hunters kill every year. The graph above shows the pattern with points marked every 5 years from 1900 to The idea of the graph is that the bounty offered in 1905 led within 5 years to enough hunting activity to eliminate 20% of the predator population every year from 1910 on. 6
7 (a) Simulate the policy of removing the bounty in 1920 and bringing hunting on the Plateau to a stop by In order to change the setting of the graphic function for policy analysis while keeping the original setting in the model, click on the SET button ( ; the one at the left of the in the top menu bar). Once the SET button is clicked, some of the variables will become blue. These variables are those you can select to change their values for policy testing purposes. Click on Fraction harvest p yr f ; you will see the window shown above containing a graph over time of the fraction of predators we are assuming are being harvested each year because of the bounty placed upon predators. In the table of values at the left, change the 1925 value from 0.2 to 0. Continue for 1930, 1935 and so on to You should see the graph change accordingly (you can also change these points in the graph itself by moving points with the mouse, but it is hard to be precise). When you are done, click OK. Then name the run ReintroA or some other suitable name and click on the Run (runner) button. Click on the Dial button to see the Custom Graphs, but before viewing them we have to make the new graphs the active ones. Click on Datasets, and then click once on ReintroA to bring it to the top of the list. Then click on Graphs and select the graph(s) you want to see. Looking at the model diagram you can select variables to view in comparative graphs. Double click on Deer, for example, and then click on the Single Graph button (on the left). You should see a graph that shows the deer population in both the Base and ReintroA simulations. You might do this for each of the stocks in the model, and anything else you thinking might be interesting to look at in this comparative way. The Causes Graph tool works the same way here, showing you the two simulation runs together. In your report, discuss what happens in this policy and explain why it happens. (b) Suppose the ranchers delay the implementation of this policy 5 years. Try the same kind of simulation with the zero harvest fraction starting 5 years later (1930). Be sure to rename your new simulation (e.g. ReintroB). Are the results predictable? 7
8 (c) Try another hunting policy of your own devising. Note that the first 5 numbers in the Predator hunting fraction table must be 0, 0, 0.2, 0.2, and 0.2 since these are history that you are dealing with up to 1920, after which you can take some different action. Hand in a graph of your run and comment on it. As the number of simulation runs increases, it is a good idea to remove some unnecessary or irrelevant datasets so that they don t show up in future graphs. To do so, call up the Control Panel using the Dial button, and then click on the Dataset tab. Use the arrow buttons in the middle to load or unload simulation runs (datasets) as you desire. (4) Policy analysis: Harvesting deer Hunters have urged the hunting of deer to maintain a healthy herd and prevent the collapse. We will test 3 harvesting policies: a constant number of deer per year, a constant fraction of the deer per year, and a harvest whenever the deer population exceeds a chosen target. To test these policies, we have to edit the model. First, in the Deer Sector, we add a new outflow (call it Deer harvest rate ) to the Deer as shown in the figure below. Deer Sector Deer harvest rate Deer net increase Deer Deer predation rate Since the Deer stock has a new outflow, we need to add this outflow to its equation. You can click on the Equations button in the top menu bar and then click on the Deer stock to call up the equation-writing window (or hold down the Ctrl + Shift keys simultaneously and then click on the Deer stock) and then edit its equation. You should subtract the new outflow Deer harvest rate in the original equation, and then click OK. We will set the Deer Harvest Rate equal to the sum of 3 new auxiliary variables: DHR1, DHR2, and DHR3. Since there is not enough room for them in the Deer Sector, we will add 8
9 them to a new sector named Deer Harvest Sector. The structure of the Deer Harvest Sector is shown in the figure below (although the geometry may be different in your diagram, the arrows and variables should be the same): Deer Harvest Sector Deer harvest year DHR Desired deer pop DHR1 DHR2 DHR3 Constant deer harvest Deer harvest frac <Deer> Time to correct deer pop Add and formulate all the new variables to the Deer Harvest Sector as shown in the figure above. The variable <Deer> is a shadow variable, which is a copy of the defined variable Deer in the Deer Sector. To add this shadow variable to the Deer Harvest Sector, select the Shadow variable button in the top menu bar and click near DHR2 and DHR3; from the list of variables that appears select Deer and click OK. You will have added <Deer> to your diagram. The equations of the new auxiliary variables are as follows: DHR = DHR1+DHR2+DHR3 [units = deer/year] DHR1 = (Constant deer harvest)*(step(1, Deer harvest year)) [units = deer/year] DHR2 = (Deer harvest frac)*(deer)*(step(1, Deer harvest year)) [units = deer/year] DHR3 = MAX(0, (Deer - Desired deer pop)/(time to correct deer pop))*step(1, Deer harvest year) [units = deer/year] (Note: the STEP and MAX in the equations of DHR2 and DHR3 are built-in functions. You can enter them by just typing their names. Make sure the parentheses match.) The initial values of the new parameters are as follows: Deer harvest year = 1920 [units = year] Constant deer harvest = 0 [units = deer/year] Deer harvest frac = 0 [units = 1/year] 9
10 Desired deer pop = 1e6 [1,000,000; units = deer] Time to correct DP = 1 [units = year] The next step is to link the DHR variable to the outflow Deer harvest rate you created in the Deer Sector. Again, use the Shadow variable button to create a shadow variable of DHR near the Deer harvest rate and then add an arrow from <DHR> to the Deer harvest rate (as shown in the figure below). Deer Sector <DHR> Deer harvest rate Deer net increase Deer Deer predation rate Now click on the Equations button and you will find that the Deer harvest rate shows up black. This means that it is an unspecified variable (a variable which has not been assigned a proper equation). You should fix the equation in Deer harvest rate (equation = DHR; units = deer/year) and all the other unspecified variables (if there are any) in your diagram. Now you have created all the necessary changes and the model should run with the new sector present. However, in order to make sure that every equation in the model has been properly specified, go to Model/Check Model (or click Ctrl+T) in the Vensim s main function menu at the top of the screen. You hope to get the message Model is A.O.K. Otherwise, fix the error(s) that the Check Model identifies. Once everything is fine, save your model. If you want to look at all the equations in the model, click on the Document Model button at the left of the screen and you should see all the new equations just as you want them. There are some more things you should know. First, the parameters (the variables with NO arrows coming into them, as known as exogenous variables) are set so that the policies are all initially inactive. You will change these constants in reruns to test the policies. If you run the model in this condition, it should behave exactly as before, since the new deer harvesting structures are not active. Try to run a simulation and name it DHR0. The strip graphs or the 10
.")
11 single graph tool will show both runs, so you can easily compare. If DHR0 behaves differently from the Base run, go back over your changes to fix them until the model behaves just as before. Do not continue unless it does. Save your model. Print out a model diagram (click in the diagram to make it the active window and select Print from the File menu). Print out an equation listing by clicking on the Document Model tool in the tool bar on the left of your screen and clicking on the little printer icon in the window bar of the model listing. Or, you can use the Export window contents tool (see the figure below) to copy the equations and paste them in your word processing document. Hand in a model diagram and an equation listing with your new equations highlighted somehow. (5) Deer harvest policy 1: (a) Draw a stock and flow diagram of the deer population and the structure of the first deer harvesting policy (DHR1). There should be no feedback loop in this structure. (b) Simulate the deer harvesting policy 1 by clicking on the SET button and clicking on the Constant Deer Harvest parameter. Set its new value to 1,000. Name the run DHR1 and click on the Run (runner) button to simulate. Check the resulting predefined custom graph and any strip graphs you like, and include them in your written report. (c) Try other values for the constant number of deer harvested per year in order to understand what this policy 1 is likely to do. Determine whether DHR1 is a good or bad policy and why. (d) Summarize your results (include any illustrative graphs you wish for question (5) or the 11
12 remaining questions in this assignment). (6) Deer harvest policy 2: (e) Draw a stock and flow diagram of the deer population and the structure of the second deer harvesting policy (DHR2). Use the loops tool to help you if necessary. There should be a feedback loop in this structure. Determine the polarity of this loop. (f) Simulate policy 2 by changing the fraction of deer harvested per year from zero to 0.1 (Change the constant by clicking on the SET button and the constant, as before). (g) Try other values of the fraction of deer harvested per year until you think you understand this policy 2 well. Finally, summarize your findings about the policy 2. (7) Deer harvest policy 3: (a) Draw a stock and flow diagram of the deer population and the structure of the third deer harvesting policy (DHR3). Use the loops tool to help you if necessary. There should be a feedback loop in this structure. Determine the polarity of this loop. (b) The case description of the Kaibab Plateau indicates that 30,000 would be a sustainable size for the deer herd. Simulate policy 3, trying a Desired deer population equal to 30,000, and then try 35,000. Try other values of Desired deer population if you want. Explain what happens and why. (c) Try Desired deer population = 30,000 with the Deer harvest year to 1926, simulating implementation of the 30,000 deer limit in 1926 instead of 1920 (you have to change to constants in the SET mode). Explain what happens in the simulation runs and what you learn from it. (d) Summarize your findings about this third policy. (8) Policy recommendations: There are two key questions as follows: (a) What policy would you recommend to the government and why? (b) How would you plan to implement your policy recommendation? 12
Deer Population Student Guide
 Deer Population Student Guide In many places, deer have become nuisance animals because they are so numerous. In some areas, a hunting season has been introduced or lengthened to reduce the number of deer.
A Hare-Lynx Simulation Model
 1 A Hare- Simulation Model What happens to the numbers of hares and lynx when the core of the system is like this? Hares O Balance? S H_Births Hares H_Fertility Area KillsPerHead Fertility Births Figure
Regents Biology LAB. NATURAL CONTROLS OF POPULATIONS
 Period Date LAB. NATURAL CONTROLS OF POPULATIONS The size of populations in a community are regulated in many ways. Some of the controls acting on populations are: the amount of food and water available
The Lesson of the Kaibab
 Morales Biology Name Date Period The Lesson of the Kaibab Introduction: The environment may be altered by forces within the biotic community, as well as by relationships between organisms and the physical
Graphing population size daily Review Deer: Predation or Starvation
 : Predation or Starvation Introduction: In 1970 the deer population of an island forest reserve about 518 square kilometers in size was about 2000 animals. Although the island had excellent vegetation
Biology B / Sanderson!
 Biology B / Sanderson NATURAL CONTROLS OF POPULATIONS Adapted from Kim Foglia I. Introduction: (Read this first) The size of populations in a community are regulated in many ways. Some of the controls
Guided Study Program in System Dynamics System Dynamics in Education Project System Dynamics Group MIT Sloan School of Management 1
 Guided Study Program in System Dynamics System Dynamics in Education Project System Dynamics Group MIT Sloan School of Management 1 Assignment #17 Reading Assignment: There is no reading assignment. 1
Guided Study Program in System Dynamics System Dynamics in Education Project System Dynamics Group MIT Sloan School of Management 1
 Guided Study Program in System Dynamics System Dynamics in Education Project System Dynamics Group MIT Sloan School of Management 1 Solutions to Assignment #17 Friday, March 12, 1999 Reading Assignment:
[MYLAPS INTEGRATION]
![[MYLAPS INTEGRATION]](/thumbs/75/72535008.jpg "[MYLAPS INTEGRATION]") 2018 The Race Director MyLaps Integration Manual [MYLAPS INTEGRATION] This document explains how to manage the results data between your MyLaps readers and Race Director using manual file transfers. Contents
2018 The Race Director MyLaps Integration Manual [MYLAPS INTEGRATION] This document explains how to manage the results data between your MyLaps readers and Race Director using manual file transfers. Contents
Lab: Predator-Prey Simulation
 Lab: Predator-Prey Simulation A Simulation of Jackrabbit and Mountain Lion Interactions Name Biology Pd Background: During the 1920s, as the story goes, the people of the northern Arizona and southern
Lab 4: Root Locus Based Control Design
 Lab 4: Root Locus Based Control Design References: Franklin, Powell and Emami-Naeini. Feedback Control of Dynamic Systems, 3 rd ed. Addison-Wesley, Massachusetts: 1994. Ogata, Katsuhiko. Modern Control
Building System Dynamics Models
 Building System Dynamics Models Stella Guide 6 Overshoot and Collapse Deer Population Vegetation 7000.00 90000.00 3500.00 45000.00 0.00 0.00 0.00 5.00 0.00 5.00 0.00 Graph p () Years 4:0 pm Mon, Feb 6,
Science Skills Station
 Science Skills Station Objective 1. Interpret and analyze data so to determine the relationship between resource availability and carrying capacity of a population. 2. Identify biotic and abiotic factors
UNDERGROUND SURVEY WITH MINEMODELLER
 UNDERGROUND SURVEY WITH MINEMODELLER A Tutorial Derek C. Diamond derek@primethought.biz CONTENTS Underground Survey with MineModeller... 2 Introduction... 2 Requirements... 2 Getting Started with MineModeller...
NATURAL CONTROLS OF POPULATIONS: 3 CASE STUDIES
 NATURAL CNTRL F PPULATIN: 3 CA TUDI Population size in a community is regulated in many ways. ome of the controls acting on populations are: the amount of food and water available to feed the population
Boyle s Law: Pressure-Volume Relationship in Gases
 Boyle s Law: Pressure-Volume Relationship in Gases The primary objective of this experiment is to determine the relationship between the pressure and volume of a confined gas. The gas we will use is air,
Figure SM1: Front panel of the multipatcher software graphic user interface (GUI) at the beginning of multipatcher operation.
 at the beginning of multipatcher operation.") APPENDIX 2. Multipatcher Software Setup and Operation. The multipatcher program is organized into four panels. There are controls that allow the user to specify various parameters into the system. The
APPENDIX 2. Multipatcher Software Setup and Operation. The multipatcher program is organized into four panels. There are controls that allow the user to specify various parameters into the system. The
2015 Deer Population Goal Setting
 Deer advisory team recommendations Block 4: East Central Uplands The following pages represent deer population goals recommended by the 2015 deer advisory team for Block 4: East Central Uplands (permit
Ammonia Synthesis with Aspen Plus V8.0
 Ammonia Synthesis with Aspen Plus V8.0 Part 2 Closed Loop Simulation of Ammonia Synthesis 1. Lesson Objectives Review Aspen Plus convergence methods Build upon the open loop Ammonia Synthesis process simulation
Workshop 1: Bubbly Flow in a Rectangular Bubble Column. Multiphase Flow Modeling In ANSYS CFX Release ANSYS, Inc. WS1-1 Release 14.
 Workshop 1: Bubbly Flow in a Rectangular Bubble Column 14. 5 Release Multiphase Flow Modeling In ANSYS CFX 2013 ANSYS, Inc. WS1-1 Release 14.5 Introduction This workshop models the dispersion of air bubbles
Predator Prey Lab Exercise L3
 Predator Prey Lab Exercise L3 Name Date Objective: To compare predator and prey populations over time in a small ecosystem. Introduction: In 1970 the deer population of a small island forest preserve was
16. Studio ScaleChem Calculations
 16. Studio ScaleChem Calculations Calculations Overview Calculations: Adding a new brine sample Studio ScaleChem can be used to calculate scaling at one or more user specified temperatures and pressures.
Chapter 20. Case #7 (Review Copy) Cycles in Predator and Prey Populations
 Cycles in Predator and Prey Populations") Chapter. Case #7 (Review Copy) Cycles in Predator and Prey Populations The relationship between predators and their prey has always occupied a special place in the minds of ecologists. Indeed, there has
Chapter. Case #7 (Review Copy) Cycles in Predator and Prey Populations The relationship between predators and their prey has always occupied a special place in the minds of ecologists. Indeed, there has
Gas Pressure and Volume Relationships *
 Gas Pressure and Volume Relationships * MoLE Activities To begin this assignment you must be able to log on to the Internet (the software requires OSX for mac users). Type the following address into the
The ICC Duckworth-Lewis-Stern calculator. DLS Edition 2016
 The ICC Duckworth-Lewis-Stern calculator DLS Edition 2016 (DLS2-2016) Installation and operating instructions Queries about program operation should be sent to: Steven.Stern@qut.edu.au 2016 International
Chapter 14 Coal Boiler Flue Gas Scrubber II
 Chapter 14 Coal Boiler Flue Gas Scrubber II The Application The following case study is a continuation of the base case scenario created previous chapter. The base case scenario contained four process
MoLE Gas Laws Activities
 MoLE Gas Laws Activities To begin this assignment you must be able to log on to the Internet using Internet Explorer (Microsoft) 4.5 or higher. If you do not have the current version of the browser, go
CS Problem Solving and Object-Oriented Programming Lab 2 - Methods, Variables and Functions in Alice Due: September 23/24
 CS 101 - Problem Solving and Object-Oriented Programming Lab 2 - Methods, Variables and Functions in Alice Due: September 23/24 Pre-lab Preparation Before coming to lab, you are expected to have: Read
Horse Farm Management s Report Writer. User Guide Version 1.1.xx
 Horse Farm Management s Report Writer User Guide Version 1.1.xx August 30, 2001 Before you start 3 Using the Report Writer 4 General Concepts 4 Running the report writer 6 Creating a new Report 7 Opening
Hydrus 1D Tutorial. Example: Infiltration and drainage in a large caisson. 1) Basic model setup. Sebastian Bauer Geohydromodellierung
 Basic model setup. Sebastian Bauer Geohydromodellierung") Sebastian Bauer Geohydromodellierung Modellieren in der Angewandten Geologie Sommersemester 2008 Hydrus 1D Tutorial Example: Infiltration and drainage in a large caisson 1) Basic model setup Start Hydrus
Sebastian Bauer Geohydromodellierung Modellieren in der Angewandten Geologie Sommersemester 2008 Hydrus 1D Tutorial Example: Infiltration and drainage in a large caisson 1) Basic model setup Start Hydrus
2017/2018 Club Director Club Administrator Instructions
 2017/2018 Club Director Club Administrator Instructions These instructions will help you build the teams in your club for the current season. Before you are granted Club Administration access, you must
MoLE Gas Laws Activities
 MoLE Gas Laws Activities To begin this assignment you must be able to log on to the Internet using Internet Explorer (Microsoft) 4.5 or higher. If you do not have the current version of the browser, go
Predator-Prey Interactions: Bean Simulation. Materials
 Predator-Prey Interactions: Bean Simulation Introduction Interactions between predators and their prey are important in 1) determining the populations of both predators and prey, and 2) determining and
Steltronic Focus. User Manual Manage Focus Tournaments
 Steltronic Focus User Manual Manage Focus Tournaments Steltronic S.p.A. Via Artigianale 34, 25082 Botticino Sera Brescia - Italy Tel: +39 030 2190811 Fax: +39 030 2190798 Service: + 39 030 2190830 http:
UNITY 2 TM. Air Server Series 2 Operators Manual. Version 1.0. February 2008
 UNITY 2 TM Air Server Series 2 Operators Manual Version 1.0 February 2008 1. Introduction to the Air Server Accessory for UNITY 2...2 1.1. Summary of Operation...2 2. Developing a UNITY 2-Air Server method
STUDENT PACKET # 6 Student Exploration: Rabbit Population by Season
 STUDENT PACKET # 6 Student Exploration: Rabbit Population by Season Name_ Date Big Idea 17: Interdependence Benchmark: SC.7.L.17.2: Compare and contrast the relationships among organisms such as mutualism,
CHEMICAL ENGINEERING LABORATORY CHEG 239W. Control of a Steam-Heated Mixing Tank with a Pneumatic Process Controller
 CHEMICAL ENGINEERING LABORATORY CHEG 239W Control of a Steam-Heated Mixing Tank with a Pneumatic Process Controller Objective The experiment involves tuning a commercial process controller for temperature
XC2 Client/Server Installation & Configuration
 XC2 Client/Server Installation & Configuration File downloads Server Installation Backup Configuration Services Client Installation Backup Recovery Troubleshooting Aug 12 2014 XC2 Software, LLC Page 1
Microsoft Windows Software Manual for FITstep Stream Version 4
 Thank you for purchasing this product from Gopher. If you are not satisfied with any Gopher purchase for any reason at any time, contact us and we will replace the product, credit your account, or refund
This portion of the piping tutorial covers control valve sizing, control valves, and the use of nodes.
 Piping Tutorial A piping network represents the flow of fluids through several pieces of equipment. If sufficient variables (flow rate and pressure) are specified on the piping network, CHEMCAD calculates
McKnight Hockey Association
 McKnight Hockey Association Electronic Evaluation Tool Manual 2013-2014 Table of Contents Introduction...3 Evaluation Tool...3 Login to OneClickIce...3 Evaluations...4 PROCESS...4 Evaluation Procedure...5
Trial # # of F.T. Made:
 OPEN SPINNER APPLICATION APPS Prob Sim ENTER (Spin Spinner) SET UP SPINNER. TABL (graph) the blank graph disappears & will later become a table. SET (zoom) Change Sections to ENTER. ADV (window) Change
Navy Guidance and Tips for Using DOEHRS-IH Ventilation NAVY & MARINE CORPS PUBLIC HEALTH CENTER
 Navy Guidance and Tips for Using DOEHRS-IH Ventilation NAVY & MARINE CORPS PUBLIC HEALTH CENTER October 2010 Purpose This document is a supplemental Navy guide to the DOEHRS Student Guide/User Manual Version
"Oh! Deer! & Limiting Factors" adapted from Project Wild Mr. Mark Musselman Audubon at the Francis Beidler Forest
 "Oh! Deer! & Limiting Factors" adapted from Project Wild Mr. Mark Musselman Audubon at the Francis Beidler Forest Overview: Student act out the parts of a deer herd looking for food, water, and shelter.
NCSS Statistical Software
 Chapter 256 Introduction This procedure computes summary statistics and common non-parametric, single-sample runs tests for a series of n numeric, binary, or categorical data values. For numeric data,
KISSsoft 03/2016 Tutorial 9
 KISSsoft 03/2016 Tutorial 9 Cylindrical Gear Fine Sizing KISSsoft AG Rosengartenstrasse 4 8608 Bubikon Switzerland Phone: +41 55 254 20 50 Fax: +41 55 254 20 51 info@kisssoft.ag www.kisssoft.ag Table of
by Robert Gifford and Jorge Aranda University of Victoria, British Columbia, Canada
 Manual for FISH 4.0 by Robert Gifford and Jorge Aranda University of Victoria, British Columbia, Canada Brief Introduction FISH 4.0 is a microworld exercise designed by University of Victoria professor
Page 1 GM-FAQ Club Profile FAQs. Page
 Page 1 Club Profile FAQs Page How do I see my club's profile?... 2 How do I update my club's profile?... 3 How do I add/change my club's picture?... 5 How do I add Social Media links to my club s profile?...
BEFORE YOU OPEN ANY FILES:
 Dive Analysis Lab * Make sure to download all the data files for the lab onto your computer. * Bring your computer to lab. * Bring a blank disk or memory stick to class to save your work and files. The
Chapter 7 Single Point Calculations
 Chapter 7 Single Point Calculations Objectives By this point we have learned a great deal about the thermodynamics of the OLI Software and the internal workings of the simulation engine. We have also learned
Module 3 Developing Timing Plans for Efficient Intersection Operations During Moderate Traffic Volume Conditions
 Module 3 Developing Timing Plans for Efficient Intersection Operations During Moderate Traffic Volume Conditions CONTENTS (MODULE 3) Introduction...1 Purpose...1 Goals and Learning Outcomes...1 Organization
Version 3.1.0: New Features/Improvements: Improved Bluetooth connection on Windows 10
 Version 3.1.0: Improved Bluetooth connection on Windows 10 ***Important notice for Mac Users: Upgrading from Shearwater Desktop 3.0.8 to 3.1.0 will not cause issues. Upgrading from any 2.X.X to any 3.X.X
Step 1. CoderDojo Milltown Exercise 1 Pong Page 1 of 13
 CoderDojo Milltown Exercise 1 Pong Page 1 of 13 Step 1 Open up Scratch on your computer or online at http://scratch.mit.edu/projects/editor/? tip_bar=getstarted Scratch 1.4 looks like this Scratch 2.0
Online League Management lta.tournamentsoftware.com. User Manual. Further support is available online at
 Online League Management lta.tournamentsoftware.com User Manual Further support is available online at www.lta.org.uk/leagueplanner Contents Welcome... 3 Using this guide... 3 Further support?... 3 Publishing
American Thoroughbred Handicapping Program
 American Thoroughbred Handicapping Program The Program s Main Menu Model above When the program starts up, this is the first screen you will see. As you can see it looks very simple, and it is very easy
Previous Release Notes
 Release Notes Shearwater Desktop 3.1.5 Support for NERD 2. Previous Release Notes Version 3.1.4 Improved Bluetooth Reliability with the initial connection. Bug Notes: dded software workaround to allow
Chapter 5: Methods and Philosophy of Statistical Process Control
 Chapter 5: Methods and Philosophy of Statistical Process Control Learning Outcomes After careful study of this chapter You should be able to: Understand chance and assignable causes of variation, Explain
SCRATCH CHALLENGE #3
 SCRATCH CHALLENGE #3 Objective: Demonstrate your understanding of scratch by designing the pong game. **View this Pong Game PDF for the instructions on how to design the pong game.** Scroll down for the
FIG: 27.1 Tool String
 Bring up Radioactive Tracer service. Click Acquisition Box - Edit - Tool String Edit the tool string as necessary to reflect the tool string being run. This is important to insure proper offsets, filters,
To Logon On to your tee sheet, start by opening your browser. (NOTE: Internet Explorer V. 6.0 or greater is required.)
") 1. Log-On To Logon On to your tee sheet, start by opening your browser. (NOTE: Internet Explorer V. 6.0 or greater is required.) (NOTE: Logon ID s must be 7 characters or more and passwords are case sensitive.)
1. Log-On To Logon On to your tee sheet, start by opening your browser. (NOTE: Internet Explorer V. 6.0 or greater is required.) (NOTE: Logon ID s must be 7 characters or more and passwords are case sensitive.)
Gas Pressure Volume Relationships Laboratory Simulation
 Gas Pressure Volume Relationships Laboratory Simulation Name Lab Section Problem Statement: How are the pressure and volume of a gas sample related? How do pressure/volume relationships of different gases
SIDRA INTERSECTION 6.1 UPDATE HISTORY
 Akcelik & Associates Pty Ltd PO Box 1075G, Greythorn, Vic 3104 AUSTRALIA ABN 79 088 889 687 For all technical support, sales support and general enquiries: support.sidrasolutions.com SIDRA INTERSECTION
Page 1 Make more profit from your betting at Betting Speed Evolution and the Race Advisor
 Page 1 Introduction The information contained here has been put together to assist you in not only finding winning horses, but making good profits. The software is based around a complex professional strategy.
Heart Foundation Walking Website user guide for Walk Organisers
 Heart Foundation Walking Website user guide for Walk Organisers Proudly supported by Website User Guide for Walk Organisers Contents 1. Introduction... 2 1.1 Finding the HFW website... 2 1.2 Log in on
Hot Springs Village Member Portal User Guide
 HOW TO USE THE MEMBER PORTAL: CHECK YOUR ACCOUNT BALANCE, MAKE ACCOUNT PAYMENTS, BOOK GOLF OR TENNIS RESERVATIONS, REPORT VISITORS TO THE EAST AND WEST GATES AND MUCH MORE. Table of Contents Portal Options...
CENTER PIVOT EVALUATION AND DESIGN
 CENTER PIVOT EVALUATION AND DESIGN Dale F. Heermann Agricultural Engineer USDA-ARS 2150 Centre Avenue, Building D, Suite 320 Fort Collins, CO 80526 Voice -970-492-7410 Fax - 970-492-7408 Email - dale.heermann@ars.usda.gov
LEO SEM SOP Page 1 of 9 Revision 1.4 LEO 440 SEM SOP. Leica Leo Stereoscan 440i
 LEO SEM SOP Page 1 of 9 LEO 440 SEM SOP Gun (Filament) Column Manual Valves Chamber Window Chamber Stage Movement Leica Leo Stereoscan 440i 1. Scope 1.1 This document provides the procedure for operating
1. A Tutorial on LSA SwimMeet
 SwimMeet 5.7 --1 1. A Tutorial on LSA SwimMeet Thank you for selecting LSA SwimMeet. This simple tutorial shows you how to use the program to run a swim meet. If you aren't familiar with LSA SwimMeet,
An Alternative Explanation for Leopold s Kaibab Deer Herd Irruption of the 1920 s
 An Alternative Explanation for Leopold s Kaibab Deer Herd Irruption of the 1920 s The Kaibab Plateau: Mountain lying down /Buckskin Mountain The Kaibab is a natural laboratory with specific geographic
Hot Springs Village Member Portal User Guide
 Contents Portal Options... 2 Portal Display:... 2 MAIN Options:... 2 E-COMMERCE Options... 2 Annual Registrations... 2 Pets... 2 Boats... 3 Carts... 3 Vehicles... 3 GHIN... 4 Annual Passes... 4 My Transactions...
Early History, Prehistory
 History of Management of Large Mammals in North America What experience and history teach us is this that nations and governments have never learned anything from history, or acted upon any of the lessons
How to Setup and Score a Tournament. May 2018
 How to Setup and Score a Tournament May 2018 What s new for 2018 As the rules change, the programmers must adjust the scoring program as well. Feedback from scorers also assist in providing ways to make
For clarification or assistance with TDM-web or any USTA web-based application,
 TD # 1 Tournament Set Up Guidelines: Follow These Steps and TDM Q&A s - April 2014 Batch enter players & process entries on the sanction form. Then use TDM to enter tournament information. For clarification
DSTWU A Shortcut Distillation Model in Aspen Plus V8.0
 DSTWU A Shortcut Distillation Model in Aspen Plus V8.0 1. Lesson Objectives Learn how to use DSTWU to start distillation column design. Learn the strengths and limitations of shortcut methods 2. Prerequisites
FireWorks NFIRS BI User Manual
 FireWorks NFIRS BI User Manual Last Updated: March 2018 Introduction FireWorks Business Intelligence BI and analytics tool is used to analyze NFIRS (National Fire Incident Reporting System) data in an
FRDS GEN II SIMULATOR WORKBOOK
 FRDS GEN II SIMULATOR WORKBOOK Trotter Control Inc 2015 Document# Revision Revised 9001-0038 FRDS GEN II Simulator Workbook E 02/15/2015 by DC FRDS GEN II Simulator Workbook This workbook is a follow-on
FIBA Europe Coaching Website. Manual. Practice Section
 FIBA Europe Coaching Website Manual Practice Section CONTENTS Page 1. How to get started 3 Roster Management 4 Attendance 4 Practice Planner 5 2. Drills 8 Search Mask 8 Overview 11 Create Drill 13 3. Plays
LOW PRESSURE EFFUSION OF GASES adapted by Luke Hanley and Mike Trenary
 ADH 1/7/014 LOW PRESSURE EFFUSION OF GASES adapted by Luke Hanley and Mike Trenary This experiment will introduce you to the kinetic properties of low-pressure gases. You will make observations on the
Physics 122 Projectile Motion Unit
 Physics 122 Projectile Motion Unit In your assigned group of students (4-6 students) you will be responsible for researching the concepts, teaching each other, discussing questions and checking problems.
Predator Prey Lab Exercise L2
 Predator Prey Lab Exercise L2 Name Date Objective: To compare predator and prey populations over time in a small ecosystem. Introduction: In 1970 the deer population of a small island forest preserve was
Tension Cracks. Topics Covered. Tension crack boundaries Tension crack depth Query slice data Thrust line Sensitivity analysis.
 Tension Cracks 16-1 Tension Cracks In slope stability analyses with cohesive soils, tension forces may be observed in the upper part of the slope. In general, soils cannot support tension so the results
A REVIEW AND EVALUATION OF NATURAL MORTALITY FOR THE ASSESSMENT AND MANAGEMENT OF YELLOWFIN TUNA IN THE EASTERN PACIFIC OCEAN
 A REVIEW AND EVALUATION OF NATURAL MORTALITY FOR THE ASSESSMENT AND MANAGEMENT OF YELLOWFIN TUNA IN THE EASTERN PACIFIC OCEAN Mark N. Maunder and Alex Aires-da-Silva Outline YFT history Methods to estimate
Computer Scorekeeping Procedures
 Computer Scorekeeping Procedures 3-23-16 COMPUTER SETUP: Unlock Computer Storage Box: Enter combination so that it appears on the side of the lock Computer Setup: Place a computer, keyboard & mouse at
Boyle s Law: Pressure-Volume Relationship in Gases. PRELAB QUESTIONS (Answer on your own notebook paper)
") Boyle s Law: Pressure-Volume Relationship in Gases Experiment 18 GRADE LEVEL INDICATORS Construct, interpret and apply physical and conceptual models that represent or explain systems, objects, events
Boyle s Law: Pressure-Volume Relationship in Gases Experiment 18 GRADE LEVEL INDICATORS Construct, interpret and apply physical and conceptual models that represent or explain systems, objects, events
Ministry of Forests, Lands and Natural Resource Operations
 For Immediate Release 2015FLNR0004-000035 January 15, 2015 INFORMATION BULLETIN Government acting to save endangered caribou VICTORIA - The Ministry of Forests, Lands and Natural Resource Operations is
uemis CONNECT: Synchronisation of the SDA with myuemis
 uemis CONNECT: Synchronisation of the SDA with myuemis 1 What is myuemis? In myuemis, your private area on the Internet portal www.uemis.com, you can visualise your dives, manage your database and transfer
FIRST Tech Challenge Scorekeeper Manual Part II: Scoring System Guide (For Non-League Event Types)
") 2017-2018 FIRST Tech Challenge Scorekeeper Manual Part II: Scoring System Guide (For Non-League Event Types) 2 FIRST Tech Challenge Scoring System Guide (Non-League Events) Sponsor Thank You Thank you
2017-2018 FIRST Tech Challenge Scorekeeper Manual Part II: Scoring System Guide (For Non-League Event Types) 2 FIRST Tech Challenge Scoring System Guide (Non-League Events) Sponsor Thank You Thank you
3. Select a colour and then use the Rectangle drawing tool to draw a rectangle like the one below.
 Pong Game Creating the Bat 1. Delete the cat sprite. 2. Click the Paint new sprite button. 3. Select a colour and then use the Rectangle drawing tool to draw a rectangle like the one below. 4. Click the
Integrated Sports Systems (ISS) Inc. Meet Management Suite
 Inc. Meet Management Suite") November 2010 Integrated Sports Systems (ISS) Inc. Meet Management Suite User Guide and Technical Document Version 2.0 Table of Contents Table of Contents... 2 General Concepts... 3 Installation Meet Management
November 2010 Integrated Sports Systems (ISS) Inc. Meet Management Suite User Guide and Technical Document Version 2.0 Table of Contents Table of Contents... 2 General Concepts... 3 Installation Meet Management
2017 Census Reporting To access the SOI s Census Reporting web site go to:
 To access the SOI s Census Reporting web site go to: https://census.specialolympics.org/login You will need to enter your username (valid email address) and password. If you have not received your password
Deer and Deer Management in Central New York: Local Residents Interests and Concerns
 Deer and Deer Management in Central New York: Local Residents Interests and Concerns NYS Department of Environmental Conservation Division of Fish, Wildlife & Marine Resources and the Human Dimensions
DATA SCIENCE SUMMER UNI VIENNA
 Prerequisites - You have installed Tableau Desktop on your computer. Available here: http://www.tableau.com/academic/students - You have downloaded the data (athlete_events.csv) available here: https://www.kaggle.com/heesoo37/120-years-of-olympic-historyathletes-and-results
P3000 Deadweight Tester Setup, Part 1: Limited Partial Correction Method
 P3000 Deadweight Tester Setup, Part 1: Limited Partial Correction Method 19 May 2014 M. Daniels This tutorial is for configuring a P3000 series (Pressurements) deadweight tester to be used with COMPASS
ScoreKeeper tm. ~ Software for Golf ~ for Microsoft Windows 98 through Windows 7. User's Guide
 ScoreKeeper tm ~ Software for Golf ~ for Microsoft Windows 98 through Windows 7 User's Guide March, 2011 Copyright Mark II Systems. Long Valley, N.J., USA 908-850-5252 www.scorekeeper.com Installation
Table Football. Introduction. Scratch. Let s make a world cup football game in Scratch! Activity Checklist. Test your Project.
 Scratch + Table Football All Code Clubs must be registered. By registering your club we can measure our impact, and we can continue to provide free resources that help children learn to code. You can register
FireHawk M7 Interface Module Software Instructions OPERATION AND INSTRUCTIONS
 FireHawk M7 Interface Module Software Instructions OPERATION AND INSTRUCTIONS WARNING THE WARRANTIES MADE BY MSA WITH RESPECT TO THE PRODUCT ARE VOIDED IF THE PRODUCT IS NOT USED AND MAINTAINED IN ACCORDANCE
League Manager Tutorial
 League Manager Tutorial ===================================================================================== This tutorial will give you a quick overview of the League Manager. In this tutorial you will:
USA Jump Rope Tournament Software User Guide 2014 Edition
 USA Jump Rope Tournament Software User Guide www.usajumprope.org Table of Contents Contents System Requirements... 3 System Conventions... 4 Phase 1 Tournament Pre registration Preparation... 5 Name Your
ADVANCED. CATIA V5 Workbook. Knowledgeware and Workbenches. Release 16. Knowledgeware. Workbenches. Richard Cozzens. Southern Utah University
 ADVANCED CATIA V5 Workbook Knowledgeware and Workbenches Release 16 Knowledgeware Tutorial Exercises Workbenches Kinematics Stress Analysis Sheetmetal Design Prismatic Machining Richard Cozzens Southern
LOW PRESSURE EFFUSION OF GASES revised by Igor Bolotin 03/05/12
 LOW PRESSURE EFFUSION OF GASES revised by Igor Bolotin 03/05/ This experiment will introduce you to the kinetic properties of low-pressure gases. You will make observations on the rates with which selected