Universitas Sumatera Utara
|
|
|
- Mary Holmes
- 6 years ago
- Views:
Transcription

1
2 Crosstabs Kelompok Usia (thn) * Hiperplasia Crosstabulation Hiperplasia Simpleks Kompleks Total Kelompok Usia (thn) <= 40 Count ,5% 22,7% 34,1% > 40 Count ,5% 77,3% 65,9% Total Count ,0% 100,0% 100,0% Bcl-2 observer 1 * Hiperplasia Crosstabulation Hiperplasia Simpleks Kompleks Total Bcl-2 observer 1 0 Count ,3% 27,3% 27,3% 1 Count ,5% 18,2% 31,8% 2 Count ,5% 31,8% 18,2% 3 Count ,7% 22,7% 22,7% Total Count ,0% 100,0% 100,0%
3 Bcl-2 observer 2 * Hiperplasia Crosstabulation Hiperplasia Simpleks Kompleks Total Bcl-2 observer 2 0 Count ,3% 22,7% 25,0% 1 Count ,5% 22,7% 34,1% 2 Count ,6% 31,8% 22,7% 3 Count ,6% 22,7% 18,2% Total Count ,0% 100,0% 100,0%
4 Explore Hiperplasia Descriptives Hiperplasia Statistic Std. Error Bcl-2 observer 1 Simpleks 1,23,237 95% Confidence Interval for Lower Bound,74 Upper Bound 1,72 5% Trimmed 1,20 Median 1,00 Variance 1,232 Std. Deviation 1,110 Minimum 0 Maximum 3 Range 3 Interquartile Range 2 Skewness,656,491 Kurtosis -,832,953 Kompleks 1,50,244 95% Confidence Interval for Lower Bound,99 Upper Bound 2,01 5% Trimmed 1,50 Median 2,00 Variance 1,310 Std. Deviation 1,144 Minimum 0 Maximum 3 Range 3 Interquartile Range 2 Skewness -,105,491 Kurtosis -1,397,953 Bcl-2 observer 2 Simpleks 1,14,211 95% Confidence Interval for Lower Bound,70 Upper Bound 1,58 5% Trimmed 1,10 Median 1,00
5 Variance,981 Std. Deviation,990 Minimum 0 Maximum 3 Range 3 Interquartile Range 2 Skewness,675,491 Kurtosis -,325,953 Kompleks 1,55,235 95% Confidence Interval for Lower Bound 1,06 Upper Bound 2,03 5% Trimmed 1,55 Median 2,00 Variance 1,212 Std. Deviation 1,101 Minimum 0 Maximum 3 Range 3 Interquartile Range 2 Skewness -,127,491 Kurtosis -1,253,953 Tests of Normality Hiperplasia Endometrium non-atipik Kolmogorov-Smirnov a Shapiro-Wilk Statistic df Sig. Statistic df Sig. Bcl-2 observer 1 Simpleks,308 22,000,800 22,001 Kompleks,214 22,010,855 22,004 Bcl-2 observer 2 Simpleks,282 22,000,841 22,002 Kompleks,206 22,016,870 22,008 a. Lilliefors Significance Correction
6 dime nsion 1 Group Statistics Subyek N Std. Deviation Std. Error Skor_Intensitas2 1, ,1364,99021, , ,5455 1,10096,23473 NPar Tests Mann-Whitney Test Ranks Hiperplasia Endometrium non-atipik N Rank Sum of Ranks Bcl-2 observer 1 Simpleks 22 21,00 462,00 Kompleks 22 24,00 528,00 Total 44 Bcl-2 observer 2 Simpleks 22 20,09 442,00 Kompleks 22 24,91 548,00 Total 44 Test Statistics a Bcl-2 observer 1 Bcl-2 observer 2 Mann-Whitney U 209, ,000 Wilcoxon W 462, ,000 Z -,803-1,292 Asymp. Sig. (2-tailed),422,196 a. Grouping Variable: Hiperplasia
7 Reliability Scale: ALL VARIABLES Case Processing Summary N % Cases Valid ,0 Excluded a 0,0 Total ,0 a. Listwise deletion based on all variables in the procedure. Symmetric Measures Value Asymp. Std. Error a Approx. T b Approx. Sig. Measure of Agreement Kappa,908,051 10,355,000 N of Valid Cases 44 a. Not assuming the null hypothesis. b. Using the asymptotic standard error assuming the null hypothesis. Group Statistics kelompok hiperplasia N Std. Deviation Std. Error usia pasien simpleks kompleks skor Bcl 2 simpleks kompleks
8 Tes normalitas data One-Sample Kolmogorov-Smirnov Test usia pasien skor Bcl 2 N Normal Parameters(a,b) Most Extreme Differences Std. Deviation Absolute Positive Negative Kolmogorov-Smirnov Z Asymp. Sig. (2-tailed) a Test distribution is Normal. b Calculated from data. Independent Samples Test Levene's Test for Equality of Variances Sig. (2- tailed) t-test for Equality of s Difference Std. Error Difference 95% Confidence Interval of the Difference usia pasien skor Bcl 2 Equal variances assumed Equal variances not assumed Equal variances assumed Equal variances not assumed F Sig. T df Upper Lower
9 TABEL INDUK No Nama Usia Suku No. PA Subyek hiperplasia endometrium skor total Bcl-2 skor total Bcl-2 (thn) non atipik observer 1 observer 2 1 xxx 46 Batak B/1115/13 simpleks xxx 50 Aceh B/1321/13 simpleks xxx 36 Melayu B/3682/12 simpleks xxx 43 Batak O/3538/14 simpleks xxx 71 Batak B/2947/08 simpleks xxx 43 Nias B/2643/09 simpleks xxx 40 Jawa OK/112/14 simpleks xxx 49 Melayu OK/103/14 simpleks xxx 35 Batak OB/13/2014 simpleks xxx 32 JAwa B/32/14 simpleks xxx 30 Batak OK/31/14 simpleks xxx 43 Batak B/283/13 simpleks xxx 22 Batak B/266/13 simpleks xxx 44 Aceh OK/233/13 simpleks xxx 40 Jawa B/213/13 simpleks xxx 40 Jawa B/208/13 simpleks xxx 45 Melayu B/154/13 simpleks xxx 40 Melayu OK/54/13 simpleks xxx 28 Batak OK/357/12 simpleks xxx 53 Batak OK/307/12 simpleks xxx 46 Batak OK/270/12 simpleks xxx 51 Batak HJ/257/14 simpleks xxx 44 Jawa O/4462/13 kompleks xxx 43 Aceh B/3134/13 kompleks xxx 49 Jawa B/2294/12 kompleks xxx 21 Melayu B/4858/09 kompleks xxx 36 Aceh B/73499/13 kompleks xxx 30 Minang OK/7292/12 kompleks xxx 42 Jawa OK/68/2012 kompleks xxx 42 Batak H/071/14 kompleks 0 0
10 31 xxx 47 Batak HJ/104/14 kompleks xxx 50 Minang B/2811/13 kompleks xxx 48 Aceh B/4170/13 kompleks xxx 35 Minang JH/2404/14 kompleks xxx 45 Batak H/2765/14 kompleks xxx 47 Batak JH/2215/14 kompleks xxx 46 Jawa JH/1960/14 kompleks xxx 48 Aceh JH/1896/14 kompleks xxx 54 Batak JH/1602/14 kompleks xxx 44 Batak JH/1354/14 kompleks xxx 35 Jawa JH/1198/14 kompleks xxx 45 Jawa JH/1167/14 kompleks xxx 42 tionghoa JH/1033/14 kompleks xxx 57 Batak JH/7094/14 kompleks 1 1

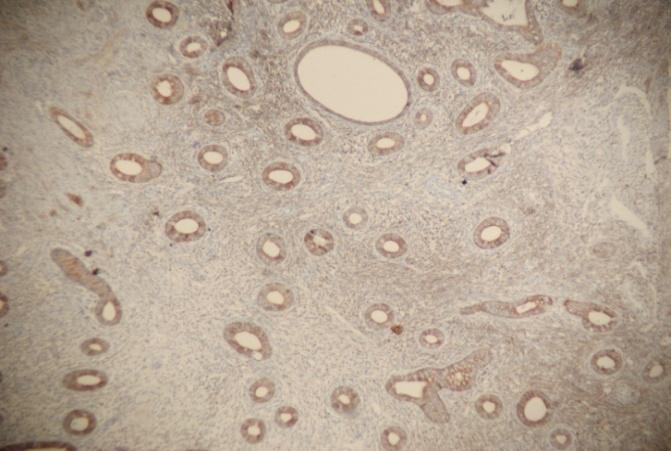
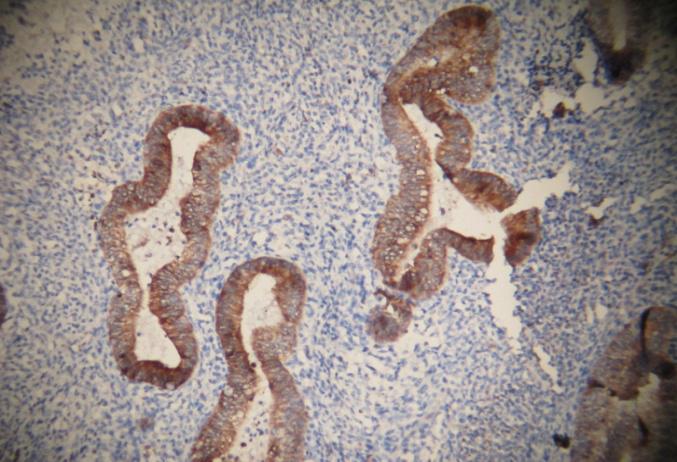
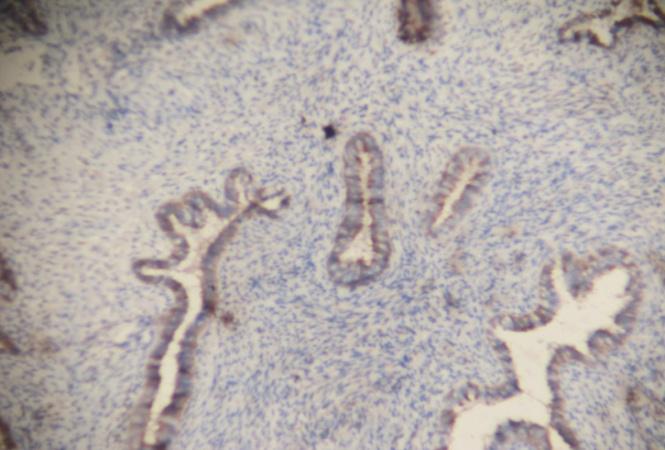
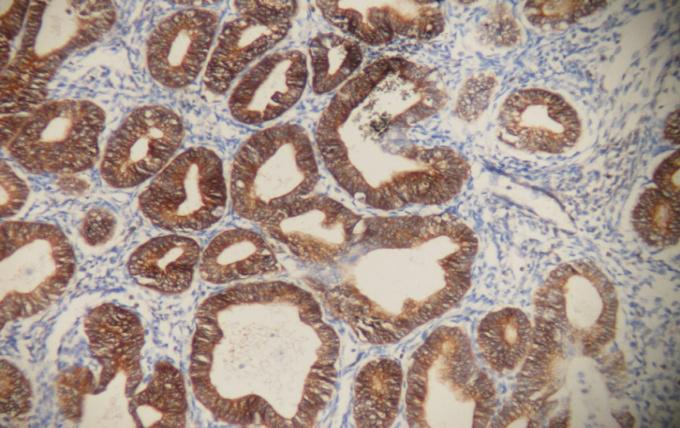
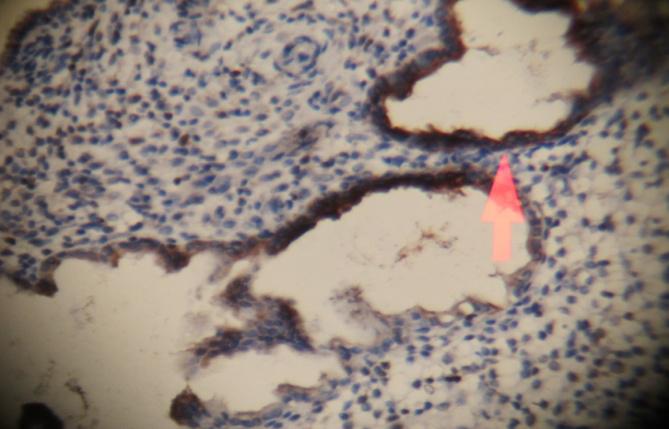
11 GAMBARAN EKSPRESI IMUNOHISTOKIMIA Bcl-2 Ekspresi negative Bcl-2 Ekspresi lemah Bcl-2 Ekspresi sedang Bcl-2 Ekspresi kuat Bcl-2
Stats 2002: Probabilities for Wins and Losses of Online Gambling
 Abstract: Jennifer Mateja Andrea Scisinger Lindsay Lacher Stats 2002: Probabilities for Wins and Losses of Online Gambling The objective of this experiment is to determine whether online gambling is a
LAMPIRAN A UJI VALIDITAS DAN RELIABILITAS
 LAMPIRAN A UJI VALIDITAS DAN RELIABILITAS Validitas Komitmen Karyawan Scale Mean if Item Deleted Scale Variance if Item Deleted Corrected Item- Total Correlation Cronbach's Alpha if Item Deleted Item01
Case Processing Summary. Cases Valid Missing Total N Percent N Percent N Percent % 0 0.0% % % 0 0.0%
 GET FILE='C:\Users\acantrell\Desktop\demo5.sav'. DATASET NAME DataSet1 WINDOW=FRONT. EXAMINE VARIABLES=PASSYDSPG RUSHYDSPG /PLOT BOXPLOT HISTOGRAM /COMPARE GROUPS /STATISTICS DESCRIPTIVES /CINTERVAL 95
Introduction to Analysis of Variance (ANOVA) The Structural Model, The Summary Table, and the One- Way ANOVA
 The Structural Model, The Summary Table, and the One- Way ANOVA") Introduction to Analysis of Variance (ANOVA) The Structural Model, The Summary Table, and the One- Way ANOVA Limitations of the t-test Although the t-test is commonly used, it has limitations Can only
Introduction to Analysis of Variance (ANOVA) The Structural Model, The Summary Table, and the One- Way ANOVA Limitations of the t-test Although the t-test is commonly used, it has limitations Can only
Lampiran 1. Surat Uji Coba Penelitian dari Fakultas. Lampiran 2. Expert Judgement
 57 Lampiran 1. Surat Uji Coba Penelitian dari Fakultas Lampiran 2. Expert Judgement 58 59 Lanjutan Lampiran 2. 60 Lanjutan Lampiran 2. 61 Lanjutan lampiran 2. 62 Lanjutan lampiran 2. 63 Lanjutan lampiran
APPENDIX 1 DAFTAR POPULASI DAN SAMPEL TAHUN
 APPENDIX 1 DAFTAR POPULASI DAN SAMPEL TAHUN 2011-2013 No Nama Perusahaan Kode Kriteria Kriteria Kriteri Kriteria Sampel 1 2 a 3 4 1. Agung Podomoro Land APLN 2. Alam Sutera Reality ASRI 3. Bekasi Asri
Daftar Perusahaan Otomotif yang Terdatar di Bursa Efek Indonesia(Periode )
") 114 Lampiran 1: Populasi Penelitian Daftar Perusahaan Otomotif yang Terdatar di Bursa Efek Indonesia(Periode 2006 2012) 89 1 PT. Astra Internasional Tbk. ASII 2 PT. Astra Otoparts Tbk. AUTO 3 PT. Indo
114 Lampiran 1: Populasi Penelitian Daftar Perusahaan Otomotif yang Terdatar di Bursa Efek Indonesia(Periode 2006 2012) 89 1 PT. Astra Internasional Tbk. ASII 2 PT. Astra Otoparts Tbk. AUTO 3 PT. Indo
Running head: DATA ANALYSIS AND INTERPRETATION 1
 Running head: DATA ANALYSIS AND INTERPRETATION 1 Data Analysis and Interpretation Final Project Vernon Tilly Jr. University of Central Oklahoma DATA ANALYSIS AND INTERPRETATION 2 Owners of the various
Driv e accu racy. Green s in regul ation
 LEARNING ACTIVITIES FOR PART II COMPILED Statistical and Measurement Concepts We are providing a database from selected characteristics of golfers on the PGA Tour. Data are for 3 of the players, based
Table 4.1: Descriptive Statistics for FAAM 26-Item ADL Subscale
 Table 4.1: Descriptive Statistics for FAAM 26-Item ADL Subscale Item Content Number missing Mean Median SD Skewness (Std. Error) Kurtosis (Std. Error) 1) Standing 52(5.3%) 2.74 3 1.09-0.55(.078) -0.41(.16)
Full file at
 Chapter 2 1. Describe the distribution. survival times of persons diagnosed with terminal lymphoma A) approximately normal B) skewed left C) skewed right D) roughly uniform Ans: C Difficulty: low 2. Without
Statistical Analysis of PGA Tour Skill Rankings USGA Research and Test Center June 1, 2007
 Statistical Analysis of PGA Tour Skill Rankings 198-26 USGA Research and Test Center June 1, 27 1. Introduction The PGA Tour has recorded and published Tour Player performance statistics since 198. All
CHAPTER ANALYSIS AND INTERPRETATION Average total number of collisions for a try to be scored
 CHAPTER 8 8.1 ANALYSIS AND INTERPRETATION As mentioned in the previous chapter, four key components have been identified as indicators of the level of significance of dominant collisions when evaluating
D1.2 REPORT ON MOTORCYCLISTS IMPACTS WITH ROAD INFRASTRUCTURE BASED OF AN INDEPTH INVESTIGATION OF MOTORCYCLE ACCIDENTS
 WP 1 D1.2 REPORT ON MOTORCYCLISTS IMPACTS WITH ROAD INFRASTRUCTURE BASED OF AN INDEPTH INVESTIGATION OF MOTORCYCLE ACCIDENTS Project Acronym: Smart RRS Project Full Title: Innovative Concepts for smart
Chapter 7. Comparing Two Population Means. Comparing two population means. T-tests: Independent samples and paired variables.
 Chapter 7 Comparing Two Population Means Comparing two population means T-tests: Independent samples and paired variables. Usually subjects are assigned to treatment or control groups and one or more variables
Unit4: Inferencefornumericaldata 4. ANOVA. Sta Spring Duke University, Department of Statistical Science
 Unit4: Inferencefornumericaldata 4. ANOVA Sta 101 - Spring 2016 Duke University, Department of Statistical Science Dr. Çetinkaya-Rundel Slides posted at http://bit.ly/sta101_s16 Outline 1. Housekeeping
CAPACITY ESTIMATION OF URBAN ROAD IN BAGHDAD CITY: A CASE STUDY OF PALESTINE ARTERIAL ROAD
 VOL. 13, NO. 21, NOVEMBER 218 ISSN 1819-668 26-218 Asian Research Publishing Network (ARPN). All rights reserved. CAPACITY ESTIMATION OF URBAN ROAD IN BAGHDAD CITY: A CASE STUDY OF PALESTINE ARTERIAL ROAD
STANDARD SCORES AND THE NORMAL DISTRIBUTION
 STANDARD SCORES AND THE NORMAL DISTRIBUTION REVIEW 1.MEASURES OF CENTRAL TENDENCY A.MEAN B.MEDIAN C.MODE 2.MEASURES OF DISPERSIONS OR VARIABILITY A.RANGE B.DEVIATION FROM THE MEAN C.VARIANCE D.STANDARD
Analysis of Variance. Copyright 2014 Pearson Education, Inc.
 Analysis of Variance 12-1 Learning Outcomes Outcome 1. Understand the basic logic of analysis of variance. Outcome 2. Perform a hypothesis test for a single-factor design using analysis of variance manually
Warm-up. Make a bar graph to display these data. What additional information do you need to make a pie chart?
 Warm-up The number of deaths among persons aged 15 to 24 years in the United States in 1997 due to the seven leading causes of death for this age group were accidents, 12,958; homicide, 5,793; suicide,
EXST7015: Salaries of all American league baseball players (1994) Salaries in thousands of dollars RAW DATA LISTING
 Salaries in thousands of dollars RAW DATA LISTING") ANOVA & Design Randomized Block Design Page 1 1 **EXAMPLE 1******************************************************; 2 *** The 1994 salaries of all American league baseball players ***; 3 *** as reported
ANOVA & Design Randomized Block Design Page 1 1 **EXAMPLE 1******************************************************; 2 *** The 1994 salaries of all American league baseball players ***; 3 *** as reported
That pesky golf game and the dreaded stats class
 That pesky golf game and the dreaded stats class Marsha Jance Indiana University East A case study that involves golf and statistics is presented. This case study focuses on descriptive statistics and
Pearson Edexcel Level 3 GCE Psychology Advanced Subsidiary Paper 2: Biological Psychology and Learning Theories
 Write your name here Surname Other names Centre Number Candidate Number Pearson Edexcel Level 3 GCE Psychology Advanced Subsidiary Paper 2: Biological Psychology and Learning Theories Monday 23 May 2016
Prokopios Chatzakis, National and Kapodistrian University of Athens, Faculty of Physical Education and Sport Science 1
 Differences between geographic areas (continents) in the distribution of medals at the Beijing Olympic Games 2008 and at the London Olympic Games. Prokopios Chatzakis, National and Kapodistrian University
Descriptive Statistics
 Descriptive Statistics Descriptive Statistics vs Inferential Statistics Describing a sample Making inferences to a larger population Data = Information but too much information. How do we summarize data?
Week 7 One-way ANOVA
 Week 7 One-way ANOVA Objectives By the end of this lecture, you should be able to: Understand the shortcomings of comparing multiple means as pairs of hypotheses. Understand the steps of the ANOVA method
One-factor ANOVA by example
 ANOVA One-factor ANOVA by example 2 One-factor ANOVA by visual inspection 3 4 One-factor ANOVA H 0 H 0 : µ 1 = µ 2 = µ 3 = H A : not all means are equal 5 One-factor ANOVA but why not t-tests t-tests?
STAT 155 Introductory Statistics. Lecture 2-2: Displaying Distributions with Graphs
 The UNIVERSITY of NORTH CAROLINA at CHAPEL HILL STAT 155 Introductory Statistics Lecture 2-2: Displaying Distributions with Graphs 8/31/06 Lecture 2-2 1 Recall Data: Individuals Variables Categorical variables
Chapter 1: Why is my evil lecturer forcing me to learn statistics?
 Chapter : Why is my evil lecturer forcing me to learn statistics? Labcoat Leni s Real Research Is Friday the 3th Unlucky? Problem Scanlon, T. J., et al. (3). British Medical Journal, 3, 8 8. Many of us
Chapter 1: Why is my evil lecturer forcing me to learn statistics?
 Chapter 1: Why is my evil lecturer forcing me to learn statistics? Labcoat Leni s Real Research Is Friday the 13th Unlucky? Problem Scanlon, T. J., et al. (1993). British Medical Journal, 307, 1584 158.
Confidence Interval Notes Calculating Confidence Intervals
 Confidence Interval Notes Calculating Confidence Intervals Calculating One-Population Mean Confidence Intervals for Quantitative Data It is always best to use a computer program to make these calculations,
Data Set 7: Bioerosion by Parrotfish Background volume of bites The question:
 Data Set 7: Bioerosion by Parrotfish Background Bioerosion of coral reefs results from animals taking bites out of the calcium-carbonate skeleton of the reef. Parrotfishes are major bioerosion agents,
One-way ANOVA: round, narrow, wide
 5/4/2009 9:19:18 AM Retrieving project from file: 'C:\DOCUMENTS AND SETTINGS\BOB S\DESKTOP\RJS\COURSES\MTAB\FIRSTBASE.MPJ' ========================================================================== This
Psychology - Mr. Callaway/Mundy s Mill HS Unit Research Methods - Statistics
 Psychology - Mr. Callaway/Mundy s Mill HS Unit 2.3 - Research Methods - Statistics How do psychologists ask & answer questions? Last time we asked that we were discussing Research Methods. This time we
Was John Adams more consistent his Junior or Senior year of High School Wrestling?
 Was John Adams more consistent his Junior or Senior year of High School Wrestling? An investigation into my Dad s high school Wrestling Career Amanda Adams Period 1 Statistical Reasoning in Sports December
1 Hypothesis Testing for Comparing Population Parameters
 Hypothesis Testing for Comparing Population Parameters Hypothesis testing can address many di erent types of questions. We are not restricted to looking at the estimated value of a single population parameter.
DISMAS Evaluation: Dr. Elizabeth C. McMullan. Grambling State University
 DISMAS Evaluation 1 Running head: Project Dismas Evaluation DISMAS Evaluation: 2007 2008 Dr. Elizabeth C. McMullan Grambling State University DISMAS Evaluation 2 Abstract An offender notification project
IMPACT OF TRANSIT SIGNAL PRIORITY (TSP) ON BUS TRAVEL TIMES, LATE BUS RECOVERY, DELAY AND LEVEL OF SERVICE (LOS)
 ON BUS TRAVEL TIMES, LATE BUS RECOVERY, DELAY AND LEVEL OF SERVICE (LOS)") IMPACT OF TRANSIT SIGNAL PRIORITY (TSP) ON BUS TRAVEL TIMES, LATE BUS RECOVERY, DELAY AND LEVEL OF SERVICE (LOS) Presenter: Sotonye Ikiriko 1, Deo Chimba 1 College of Engineering, Tennessee State University,
IMPACT OF TRANSIT SIGNAL PRIORITY (TSP) ON BUS TRAVEL TIMES, LATE BUS RECOVERY, DELAY AND LEVEL OF SERVICE (LOS) Presenter: Sotonye Ikiriko 1, Deo Chimba 1 College of Engineering, Tennessee State University,
ASTERISK OR EXCLAMATION POINT?: Power Hitting in Major League Baseball from 1950 Through the Steroid Era. Gary Evans Stat 201B Winter, 2010
 ASTERISK OR EXCLAMATION POINT?: Power Hitting in Major League Baseball from 1950 Through the Steroid Era by Gary Evans Stat 201B Winter, 2010 Introduction: After a playerʼs strike in 1994 which resulted
Unit 3 ~ Data about us
 Unit 3 ~ Data about us Investigation 3: Data Sets & Displays I can construct, interpret, and compare data sets and displays. I can find, interpret, and compare measures of center and variation for data
Chapter 2: Modeling Distributions of Data
 Chapter 2: Modeling Distributions of Data Section 2.1 The Practice of Statistics, 4 th edition - For AP* STARNES, YATES, MOORE Chapter 2 Modeling Distributions of Data 2.1 2.2 Normal Distributions Section
Chapter 9: Hypothesis Testing for Comparing Population Parameters
 Chapter 9: Hypothesis Testing for Comparing Population Parameters Hypothesis testing can address many di erent types of questions. We are not restricted to looking at the estimated value of a single population
Reminders. Homework scores will be up by tomorrow morning. Please me and the TAs with any grading questions by tomorrow at 5pm
 Reminders Homework scores will be up by tomorrow morning Please email me and the TAs with any grading questions by tomorrow at 5pm 1 Chapter 12: Describing Distributions with Numbers Aaron Zimmerman STAT
Chapter 13. Factorial ANOVA. Patrick Mair 2015 Psych Factorial ANOVA 0 / 19
 Chapter 13 Factorial ANOVA Patrick Mair 2015 Psych 1950 13 Factorial ANOVA 0 / 19 Today s Menu Now we extend our one-way ANOVA approach to two (or more) factors. Factorial ANOVA: two-way ANOVA, SS decomposition,
STAT 101 Assignment 1
 STAT 1 Assignment 1 1. From the text: # 1.30 on page 29. A: For the centre the median is 2, the mean is 2.62. I am happy with either for an answer and I am happy to have these read off roughly by eye.
A few things to remember about ANOVA
 A few things to remember about ANOVA 1) The F-test that is performed is always 1-tailed. This is because your alternative hypothesis is always that the between group variation is greater than the within
(JUN10SS0501) General Certificate of Education Advanced Level Examination June Unit Statistics TOTAL.
 General Certificate of Education Advanced Level Examination June Unit Statistics TOTAL.") Centre Number Candidate Number For Examiner s Use Surname Other Names Candidate Signature Examiner s Initials Statistics Unit Statistics 5 Friday 18 June 2010 General Certificate of Education Advanced
Centre Number Candidate Number For Examiner s Use Surname Other Names Candidate Signature Examiner s Initials Statistics Unit Statistics 5 Friday 18 June 2010 General Certificate of Education Advanced
Select Boxplot -> Multiple Y's (simple) and select all variable names.
 and select all variable names.") One Factor ANOVA in Minitab As an example, we will use the data below. A study looked at the days spent in the hospital for different regions of the United States. Can the company reject the claim the
One Factor ANOVA in Minitab As an example, we will use the data below. A study looked at the days spent in the hospital for different regions of the United States. Can the company reject the claim the
A COMPARATIVE STUDY OF MENTAL TOUGHNESS AND WILL TO WIN AMONG BATSMEN AND BOWLERS IN CRICKET
 A COMPARATIVE STUDY OF MENTAL TOUGHNESS AND WILL TO WIN AMONG BATSMEN AND BOWLERS IN CRICKET Bagchi, Amritashish Ph.D scholar, Lakshmibai National Institute of Physical Education, Gwalior, M.P, India ABSTRACT
CHAPTER 2 Modeling Distributions of Data
 CHAPTER 2 Modeling Distributions of Data 2.2 Density Curves and Normal Distributions The Practice of Statistics, 5th Edition Starnes, Tabor, Yates, Moore Bedford Freeman Worth Publishers Density Curves
Announcements. Lecture 19: Inference for SLR & Transformations. Online quiz 7 - commonly missed questions
 Announcements Announcements Lecture 19: Inference for SLR & Statistics 101 Mine Çetinkaya-Rundel April 3, 2012 HW 7 due Thursday. Correlation guessing game - ends on April 12 at noon. Winner will be announced
Sample Final Exam MAT 128/SOC 251, Spring 2018
 Sample Final Exam MAT 128/SOC 251, Spring 2018 Name: Each question is worth 10 points. You are allowed one 8 1/2 x 11 sheet of paper with hand-written notes on both sides. 1. The CSV file citieshistpop.csv
Section 3.2: Measures of Variability
 Section 3.2: Measures of Variability The mean and median are good statistics to employ when describing the center of a collection of data. However, there is more to a collection of data than just the center!
Stat 139 Homework 3 Solutions, Spring 2015
 Stat 39 Homework 3 Solutions, Spring 05 Problem. Let i Nµ, σ ) for i,..., n, and j Nµ, σ ) for j,..., n. Also, assume that all observations are independent from each other. In Unit 4, we learned that the
Legendre et al Appendices and Supplements, p. 1
 Legendre et al. 2010 Appendices and Supplements, p. 1 Appendices and Supplement to: Legendre, P., M. De Cáceres, and D. Borcard. 2010. Community surveys through space and time: testing the space-time interaction
How are the values related to each other? Are there values that are General Education Statistics
 How are the values related to each other? Are there values that are General Education Statistics far away from the others? Class Notes Measures of Position and Outliers: Z-scores, Percentiles, Quartiles,
In the actual exam, you will be given more space to work each problem, so work these problems on separate sheets.
 K300 Practice Exam 1 Note: This gives you an idea of the types of questions I ask. The length of the exam may differ. The questions are meant to be representative but not all-inclused (i.e. this is a sample
1wsSMAM 319 Some Examples of Graphical Display of Data
 1wsSMAM 319 Some Examples of Graphical Display of Data 1. Lands End employs numerous persons to take phone orders. Computers on which orders are entered also automatically collect data on phone activity.
Safety at Intersections in Oregon A Preliminary Update of Statewide Intersection Crash Rates
 Portland State University PDXScholar Civil and Environmental Engineering Master's Project Reports Civil and Environmental Engineering 2015 Safety at Intersections in Oregon A Preliminary Update of Statewide
REPLACING REDUNDANT STABILOMETRY PARAMETERS WITH RATIO AND MAXIMUM DEVIATION PARAMETERS
 Proceedings of the 12th IASTED International Conference Biomedical Engineering (BioMed 2016) February 15-16, 2016 Innsbruck, Austria REPLACING REDUNDANT STABILOMETRY PARAMETERS WITH RATIO AND MAXIMUM DEVIATION
STAT 625: 2000 Olympic Diving Exploration
 Corey S Brier, Department of Statistics, Yale University 1 STAT 625: 2000 Olympic Diving Exploration Corey S Brier Yale University Abstract This document contains a preliminary investigation of data from
Durban University of Technology, South Africa Durban University of Technology, South Africa
 ROOT CAUSE ANALYSIS FOR REDUCTION OF WASTE ON BOTTLE FILLING AND CROWNING OPERATIONS M. Dewa 1, A. Naicker 2 and R. Singh 3 1 Department of Industrial Engineering Durban University of Technology, South
WorkSHEET 13.3 Univariate data II Name:
 WorkSHEET 13.3 Univariate data II Name: 1 The back-to-back stem-and-leaf plot shows the number of people (to the nearest thousand) that attend cricket matches in both Sydney and Melbourne during a season.
How Fast Can You Throw?
 Name Date Period How Fast Can You Throw? Directions: Find a spot 40 feet from a wall and mark it with a piece of chalk. From that point, you will throw the ball 5 times with your right hand, and then five
Political Science 30: Political Inquiry Section 5
 Political Science 30: Political Inquiry Section 5 Taylor Carlson tncarlson@ucsd.edu Link to Stats Motivation of the Week They ve done studies, you know. 60% of the time, it works every time. Brian, Anchorman
Lampiran 1. Daftar Perusahaan. Hasil dari pemilihan sampel dengan kriteria tertentu adalah sebagai berikut:
 Lampiran 1. Daftar Perusahaan Hasil dari pemilihan sampel dengan kriteria tertentu adalah sebagai berikut: NO KODE NAMA PERUSAHAAN 1. AISA Tiga Pilar Sejahtera Food 2. ALMI Alumindo Light Metal Industry
The Art and Science of Debt Sustainability Analysis Ugo Panizza
 The Art and Science of Debt Sustainability Analysis Ugo Panizza Pictet Chair in Finance and Development The Graduate Institute & CEPR Trade and Development Board Geneva, September 2016 d = i g d ps DSA:
STT 315 Section /19/2014
 Name: PID: A STT 315 Section 101 05/19/2014 Quiz 1A 50 minutes 1. A survey by an electric company contains questions on the following: Age of household head, Gender of household head and use of electric
ANALYSIS OF THE DOMINATING POWER OF SERVICE RECEPTION IN VOLLEYBALL IN DIFFERENT LEVELS OF COMPETITIONS
 ANALYSIS OF THE DOMINATING POWER OF SERVICE RECEPTION IN VOLLEYBALL IN DIFFERENT LEVELS OF COMPETITIONS 1 SANJIB GHOSH 2 DR. MAHESH SWETA 1 Research scholar, department of Physical Education, Visva-Bharati,
Empirical Example II of Chapter 7
 Empirical Example II of Chapter 7 1. We use NBA data. The description of variables is --- --- --- storage display value variable name type format label variable label marr byte %9.2f =1 if married wage
COMPARISON OF METHODS USED TO EXTENT THE
 BACHELOR THESIS COMPARISON OF METHODS USED TO EXTENT THE TIME OF HAY UPTAKE IN HORSES Anne Nettersheim Animal Husbandry/Equine Leisure and Sports 10.02.2014 03.07.2014 Career Counsellor: Tom Wiggers, Van
Solutionbank S1 Edexcel AS and A Level Modular Mathematics
 Page 1 of 1 Exercise A, Question 1 A group of thirty college students was asked how many DVDs they had in their collection. The results are as follows. 12 25 34 17 12 18 29 34 45 6 15 9 25 23 29 22 20
A Study on the Relationship Between Bicyclists Degree of Involvement and Place Attachment A Case Study on the Kaohsiung Hedi Park
 A Study on the Relationship Between Bicyclists Degree of Involvement and Place Attachment A Case Study on the Kaohsiung Hedi Park Chen, Chao-Chien Department of Physical Education, Asia University, Taiwan
Denise L Seman City of Youngstown
 Denise L Seman City of Youngstown The control chart is one of the most important tools of quality control for laboratory data. A control chart is a specific kind of run chart that allows unusual change
Explore the basis for including competition traits in the genetic evaluation of the Icelandic horse
 Elsa Albertsdóttir The Swedish Agricultural University Faculty of Veterinary Medicine and Animal Science Department of Animal Breeding and Genetics Uppsala Explore the basis for including competition traits
Unit 3 - Data. Grab a new packet from the chrome book cart. Unit 3 Day 1 PLUS Box and Whisker Plots.notebook September 28, /28 9/29 9/30?
 Unit 3 - Data Grab a new packet from the chrome book cart 9/28 9/29 9/30? 10/3 10/4 10/5 10/6 10/7-10/10 10/11 10/12 10/13 Practice ACT #1 Lesson 1: Box and Whisker Plots I can find the 5 number summary
FENCING TRAINING EFFECT ON MUSCULOSKELETAL FITNESS IN CHILDREN DIAGNOSED WITH ATTENTION DEFICIT HYPERACTIVITY DISORDER
 Analele Universităţii din Oradea Facicula Educaţie Fizică şi Sport ISSN 2286-2870, E-ISSN 1224-5100 Rev. noxxviii /2018 pp.18-29 Article no. 28102-848 FENCING TRAINING EFFECT ON MUSCULOSKELETAL FITNESS
Effective Use of Box Charts
 Effective Use of Box Charts Purpose This tool provides guidelines and tips on how to effectively use box charts to communicate research findings. Format This tool provides guidance on box charts and their
Biostatistics & SAS programming
 Biostatistics & SAS programming Kevin Zhang March 6, 2017 ANOVA 1 Two groups only Independent groups T test Comparison One subject belongs to only one groups and observed only once Thus the observations
Analysis of wind power generation with application of wind tunnel attachment
 University of Northern Iowa UNI ScholarWorks Electronic Theses and Dissertations Graduate College 2013 Analysis of wind power generation with application of wind tunnel attachment Ulan Dakeev University
Table 9 and 10 present the norms by gender and by age group, respectively. As can be
 Table 9 and 10 present the norms by gender and by age group, respectively. As can be seen from Table 9, male and female participants were very similar in their reported levels of psychological well-being
Find Mean, Median, Mode, and Outlier
 SS SDA G6.S.5.c 2 dentify Giving the mode(s) quantitative for sets measures of categorical of center (median data, and/or the mean) and variability (interquartile mode(s), range median, and/or and mean
Astronomy Departmental Climate Report, 2017
 Astronomy Departmental Climate Report, 2017 Overview Overall departmental climate in Astronomy is generally positive with roughly three quarters of respondents having positive responses to the climate
September Population analysis of the Finnish Spitz breed
 Population analysis of the Finnish Spitz breed Genetic analysis of the Kennel Club pedigree records of the UK Finnish Spitz population has been carried out with the aim of estimating the rate of loss of
Descriptive Statistics. Dr. Tom Pierce Department of Psychology Radford University
 Descriptive Statistics Dr. Tom Pierce Department of Psychology Radford University Descriptive statistics comprise a collection of techniques for better understanding what the people in a group look like
September Population analysis of the Portuguese Water Dog breed
 Population analysis of the Portuguese Water Dog breed Genetic analysis of the Kennel Club pedigree records of the UK Portuguese Water Dog population has been carried out with the aim of estimating the
Unit 4: Inference for numerical variables Lecture 3: ANOVA
 Unit 4: Inference for numerical variables Lecture 3: ANOVA Statistics 101 Thomas Leininger June 10, 2013 Announcements Announcements Proposals due tomorrow. Will be returned to you by Wednesday. You MUST
Announcements. % College graduate vs. % Hispanic in LA. % College educated vs. % Hispanic in LA. Problem Set 10 Due Wednesday.
 Announcements Announcements UNIT 7: MULTIPLE LINEAR REGRESSION LECTURE 1: INTRODUCTION TO MLR STATISTICS 101 Problem Set 10 Due Wednesday Nicole Dalzell June 15, 2015 Statistics 101 (Nicole Dalzell) U7
ANOVA - Implementation.
 ANOVA - Implementation http://www.pelagicos.net/classes_biometry_fa17.htm Doing an ANOVA With RCmdr Categorical Variable One-Way ANOVA Testing a single Factor dose with 3 treatments (low, mid, high) Doing
THE INTEGRATION OF THE SEA BREAM AND SEA BASS MARKET: EVIDENCE FROM GREECE AND SPAIN
 THE INTEGRATION OF THE SEA BREAM AND SEA BASS MARKET: EVIDENCE FROM GREECE AND SPAIN Lamprakis Avdelas, Managing Authority for the Operational programme for Fisheries, lamprakisa@in.gr Jordi Guillen, University
Lake Michigan Wind Assessment Project Data Summary and Analysis: October 2012
 Grand Valley State University ScholarWorks@GVSU Monthly Buoy Report Offshore Wind Project 1-1- Lake Michigan Wind Assessment Project Data Summary and Analysis: October Lake Michigan Offshore Wind Assessment
September Population analysis of the Dogue De Bordeaux breed
 Population analysis of the Dogue De Bordeaux breed Genetic analysis of the Kennel Club pedigree records of the UK Dogue De Bordeaux population has been carried out with the aim of estimating the rate of
Psychology Advanced Subsidiary Paper 2: Biological Psychology and Learning Theories
 Write your name here Surname Other names Pearson Edexcel Level 3 GCE Centre Number Candidate Number Psychology Advanced Subsidiary Paper 2: Biological Psychology and Learning Theories Monday 22 May 2017
save percentages? (Name) (University)
 (University)") 1 IB Maths Essay: What is the correlation between the height of football players and their save percentages? (Name) (University) Table of Contents Raw Data for Analysis...3 Table 1: Raw Data...3 Rationale
1 IB Maths Essay: What is the correlation between the height of football players and their save percentages? (Name) (University) Table of Contents Raw Data for Analysis...3 Table 1: Raw Data...3 Rationale
The pth percentile of a distribution is the value with p percent of the observations less than it.
 Describing Location in a Distribution (2.1) Measuring Position: Percentiles One way to describe the location of a value in a distribution is to tell what percent of observations are less than it. De#inition:
Safety Effectiveness of Pedestrian Crossing Treatments
 Portland State University PDXScholar TREC Friday Seminar Series Transportation Research and Education Center (TREC) 10-13-2017 Safety Effectiveness of Pedestrian Crossing Treatments Christopher Monsere
The game of rugby union is developing and evolving rapidly from the players to the
 1.0 Introduction The game of rugby union is developing and evolving rapidly from the players to the coaching and management staff (Vivian et al., 1997). The introduction of professionalism on the twenty
Frequency Distributions
 Descriptive Statistics Dr. Tom Pierce Department of Psychology Radford University Descriptive statistics comprise a collection of techniques for better understanding what the people in a group look like
TECHNICAL REPORT STANDARD TITLE PAGE
 TECHNICAL REPORT STANDARD TITLE PAGE 1. REPORT NO. 2. GOVERNMENT ACCESSION NO. 3. RECIPIENT S CATALOG NO. 4. TITLE AND SUBTITLE AIR VOID CHARACTERISTICS OF OKLAHOMA CONCRETE / AVA SOURCES OF ERROR 7. AUTHOR(S)
PRACTICAL EXPLANATION OF THE EFFECT OF VELOCITY VARIATION IN SHAPED PROJECTILE PAINTBALL MARKERS. Document Authors David Cady & David Williams
 PRACTICAL EXPLANATION OF THE EFFECT OF VELOCITY VARIATION IN SHAPED PROJECTILE PAINTBALL MARKERS Document Authors David Cady & David Williams Marker Evaluations Lou Arthur, Matt Sauvageau, Chris Fisher