DG AGRI DASHBOARD: CITRUS FRUIT Last update:
|
|
|
- Natalie Watson
- 5 years ago
- Views:
Transcription


 125 Current 2017/2018 121 () 2016/2017 115 Monthly 5 year MAX Monthly 5 year")
 85 81 Current 2017/2018 77 75 () 2016/2017 Monthly 5 year MAX Monthly 5 year MIN 68 64 65 5 year avg 62 61 60 56 56 58 55 52 52 49 52 50 49 47 47 48 48 47 45 46")

 Small citrus Oranges 7 000 6 000 Spain 6 246.0 4 000 3 500 3 524.0 5 000 Italy Greece 3 000 2 500 4 000 3 000 Portugal 2 6,4 2 000 1 500 Spain Greece Italy Portugal 1 591.")


1 Small citrus (group mandarines): clementines, satsumas and other. DG AGRI DASHBOARD: CITRUS FRUIT Last update: EU AVG PRICES MS PRICES /100 kg EUROPEAN UNION - Orange prices, weighted avg ( /100kg) 85 Current 2017/ () 2016/2017 Monthly 5 year MAX Monthly 5 year MIN 5 year avg Oct Nov Dec Jan Feb Mar Apr May Jun Jul Aug Sep /100 kg SPAIN - Orange prices ( /100kg) 75 Current 2017/ () 2016/ Monthly 5 year MAX 69 Monthly 5 year MIN year avg Oct Nov Dec Jan Feb Mar Apr May Jun Jul Aug Sep /100 kg ITALY - Orange prices ( /100kg) 125 Current 2017/ () 2016/ Monthly 5 year MAX Monthly 5 year MIN 5 year avg Oct Nov Dec Jan Feb Mar Apr May Jun Jul Aug Sep /100 kg GREECE - Orange prices ( /100kg) Current 2017/ () 2016/2017 Monthly 5 year MAX Monthly 5 year MIN year avg Oct Nov Dec Jan Feb Mar Apr May Jun Jul Aug Sep /100 kg PORTUGAL - Orange prices ( /100kg) Current 2017/ () 2016/2017 Monthly 5 year MAX Monthly 5 year MIN 5 year avg Oct Nov Dec Jan Feb Mar Apr May Jun Jul Aug Sep Lemons EU citrus production: oranges, small citrus* and lemons (in.000 tonnes) Citrus fruit production (in 000 tonnes) Orange production (in.000 tonnes) Small citrus Oranges Spain Italy Greece Portugal 2 6, Spain Greece Italy Portugal ,5 354, A r e a EU Import of main citrus varieties (in.000 tonnes ) Lemons 600 Pomelos and grapefruit 0 Small citrus 200 Oranges Source: Eurostat, Comext EU Import of oranges by region of origin ( in.000 tonnes) Others (America) Mediterranean 544 Southern Hemisphere Source: Eurostat, Comext EU export of citrus fruit (in.000 tonnes) 900 Lemons Oranges 800 Small citrus Source: Eurostat, Comext Sources: Eurostat, MSs notifications, PSD, DG Agri, Eurostat, Comext, Comtrade, ITC, GTA, Expert groups
2 Orange market situation - summary Recent developments In June the EU average price was 71 /100 kg, 13% lower than in May mainly due to different varieties available on the market, but still 16% above the 5 year average (the reference period). In Italy, Spain and Portugal prices were respectively 23%, 18% and 19% higher than the 5 year average. Only in Greece they were 9% lower than the reference period. Background Due to adverse weather events in the US, Brazil and the EU global supply of oranges for fresh consumption in 2017/18 is expected to be about 7.5 % lower compared to the previous marketing year. (source: USDA report) Consequently, prices are expected to be high and so far indeed all the EU producing member states have been notifying monthly prices well above the reference period most of the time. The average EU price has been above the 5-year-maximum price from the beginning of the marketing year until May included. 2
3 /100 kg Current 2017/2018 () 2016/2017 Monthly 5 year MAX Monthly 5 year MIN 5 year avg EUROPEAN UNION - Orange prices, weighted avg Oct Nov Dec Jan Feb Mar Apr May Jun Jul Aug Sep ( /100kg) 3

4 Citrus prices /100kg and % changes CURRENT PRICES COMPARED TO 5 YEAR AVERAGE CURRENT PRICES COMPARED TO ONE MONTH AGO June 2018, Price, /100 kg June 2018, comparison to 5 year avg, base = 100 % 5 year avg price '13-'17, changes from June to May % 2018, changes from June to May % EU % +1% - 13% EL-Greece % - 10% - 13% ES-Spain % + 8% - 5% IT-Italy % - 2% - 22% PT-Portugal % + 5% + 8 % 4
5 /100 kg Current 2017/2018 () 2016/2017 Monthly 5 year MAX Monthly 5 year MIN 5 year avg SPAIN - Orange prices ( /100kg) Oct Nov Dec Jan Feb Mar Apr May Jun Jul Aug Sep 5

6 /100 kg 85 GREECE - Orange prices ( /100kg) Current 2017/2018 () 2016/2017 Monthly 5 year MAX Monthly 5 year MIN 5 year avg Oct Nov Dec Jan Feb Mar Apr May Jun Jul Aug Sep 6
 86 74 71 64 97 83 73 99 90 75 60 60 106 96 82 69 121 94 90 89 90 78 66 76 77 Oct Nov Dec Jan Feb Mar Apr May Jun Jul Aug Sep 68 69")
7 /100 kg Current 2017/2018 () 2016/2017 Monthly 5 year MAX Monthly 5 year MIN 5 year avg ITALY - Orange prices ( /100kg) Oct Nov Dec Jan Feb Mar Apr May Jun Jul Aug Sep
8 /100 kg 90 PORTUGAL - Orange prices ( /100kg) Current 2017/2018 () 2016/2017 Monthly 5 year MAX Monthly 5 year MIN 5 year avg Oct Nov Dec Jan Feb Mar Apr May Jun Jul Aug Sep 8
9 Lemons Small citrus Oranges EU citrus production: oranges, small citrus* and lemons (in.000 tonnes) Small citrus (group mandarines): clementines, satsumas and other. 9
10 8 000 Citrus fruit production (in 000 tonnes) Spain Italy Greece Portugal , ,5 354,
11 4 500 Orange production (in.000 tonnes) Spain Greece Italy Portugal
12 Small citrus production (in.000 tonnes) Spain Italy Greece Cyprus France Portugal
13 EU Import of main citrus varieties (in.000 tonnes ) Lemons Pomelos and grapefruit Small citrus Oranges Source: Eurostat, Comext 13
14 EU Import of oranges by region of origin ( in.000 tonnes) Others (America) Mediterranean Southern Hemisphere Source: Eurostat, Comext 14
 900 800 Lemons Oranges Small citrus 0 600 500 103 315 0 300 200 2 100-2007 2008")
15 EU export of citrus fruit (in.000 tonnes) Lemons Oranges Small citrus Source: Eurostat, Comext 15

16 Further detail 16


17 EXTREME WEATHER EVENTS IN EUROPE 90 DAY TEMPERATURE ANALYSIS OF ANOMALIES May 2018 // C above or below normal Further detail Source: Climate Prediction Center 17


18 EXTREME WEATHER EVENTS IN EUROPE TEMPERATURE ANOMALIES +/- C ON AVG 15 May 2018 to 13 June 2018 (+/- 30 days) Further detail Source: Climate Prediction Center 18


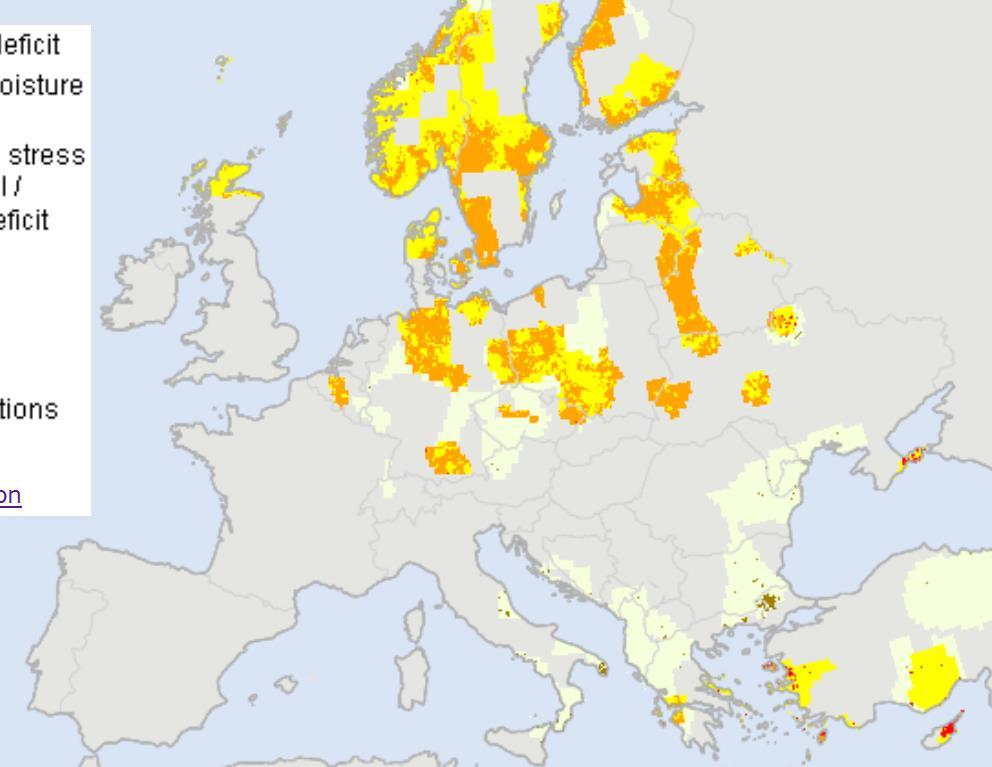
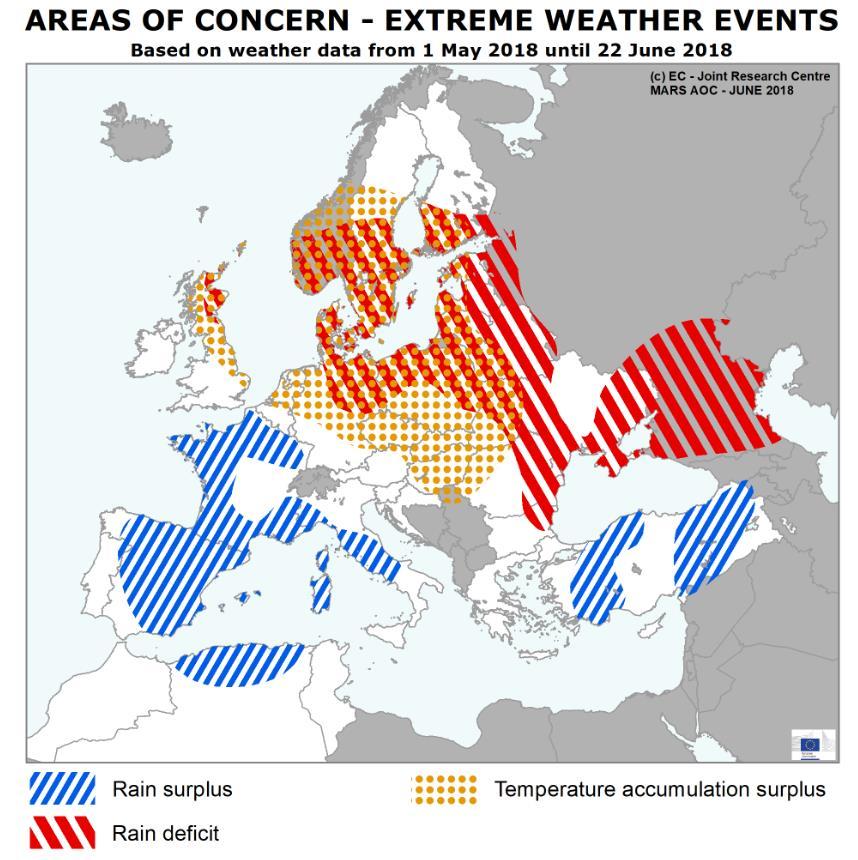
19 Source: JRC Further detail 19
 - % of normal Source: Ag Weather Further")
20 EXTREME WEATHER EVENTS IN EUROPE 90 DAY PRECIPITATION ANALYSIS OF ANOMALIES 14 March 2018 to 13 June 2018 (90 days) - % of normal Source: Ag Weather Further detail 20


21 EXTREME WEATHER EVENTS IN EUROPE 30 DAY PRECIPITATION ANALYSIS OF ANOMALIES 14 May 2018 to 13 June 2018 (30 days) - % of normal Further detail Source: Ag Weather 21


22 Main area of severe wind EXTREME WEATHER EVENTS IN EUROPE 16 May 2018 to 15 June 2018 Source: Severe weather database 22
23 KEY MARKET BALANCE INDICATORS FOR CITRUS FRUITS (oranges, small citrus, lemons) - tonnes Month Extra-EU imports Extra-EU exports EU production EU consumption estimates Annual Market access (imports/consumption): 12,4% 13,5% 15,4% Exports/production : 6,7% 5,8% 5,5% Apparent consumption, kg per capita: 23,0 23,2 22,8 23


24 TOP WORLD CITRUS IMPORTERS FROM ALL ORIGINS CN CODE Further detail 24

25 TOP WORLD CITRUS IMPORTERS FROM ALL ORIGINS Further detail 25

26 TOP WORLD CITRUS IMPORTERS FROM ALL ORIGINS Further detail 26
27 TOP WORLD CITRUS IMPORTERS FROM ALL ORIGINS Importers Value imported in 2016 (USD thousand) Trade balance in 2016 (USD thousand) Quantity imported in 2016 Quantity Unit Unit value (USD/unit) Annual growth in value between (%) Annual growth in quantity between (%) Annual growth in value between (%) Share in world imports (%) Average distance of supplying countries (km) Concentration of supplying countries World Tons Average tariff (estimated) applied by the country (%) France Tons Germany Tons Russian Federation Tons Netherlands Tons United States of America Tons United Kingdom Tons Canada Tons Italy Tons Hong Kong, China Tons Japan Tons Poland Tons China Tons Saudi Arabia Tons Belgium Tons Spain Tons Korea, Republic of Tons United Arab Emirates Tons Iraq Tons Viet Nam Tons Switzerland Tons Romania Tons Sweden Tons Austria Tons Malaysia Tons

28 Further detail 28

29 Further detail 29
30 30
31 End 31
DG AGRI DASHBOARD: CITRUS FRUIT Last update:
 8.000 7.000 6.000 5.000 4.000 3.000 2.000 1.000 0 1996 1997 1998 1999 2000 2001 2002 2003 2004 2005 2006 2007 2008 2009 2010 2011 2012 2013 2014 2015 2016 2017 Small citrus (group mandarines): clementines,
I. World trade in Overview
 I. Table I.1 Growth in the volume of world merchandise exports and production by major product group, 1995-3 ( change) 1995-21 22 23 World merchandise exports 7. -.5 3. 4.5 Agricultural products 3.5 2.5
41th meeting of the Advisory Committee
 41th meeting of the Advisory Committee Marseille, France 8 July 213 OLIVE OIL BALANCES 211/12-212/13 OLIVE OIL 211/12 (final) (thousand tonnes) 212/13 (prov.) Starting stocks 773. 1.5 Production 3377.5
OCEAN2012 Fish Dependence Day - UK
 OCEAN2012 Fish Dependence Day - UK Europeans are now so dependent on fish products originating from external waters that half the fish they consume are sourced outside the EU Fish dependence: The EU s
Bluetongue Disease (BT)
") Bluetongue Disease (BT) Analysis of ADNS data since 01/2018 Reporting period: 2018-01-01 2018-12-09 Data query: 2018-12-10 AGES DSR Austrian Agency for Health and Food Safety www.ages.at Parameters Data
Bluetongue Disease (BT) Analysis of ADNS data since 01/2018 Reporting period: 2018-01-01 2018-12-09 Data query: 2018-12-10 AGES DSR Austrian Agency for Health and Food Safety www.ages.at Parameters Data
COMPARISON OF FIXED & VARIABLE RATES (25 YEARS) CHARTERED BANK ADMINISTERED INTEREST RATES - PRIME BUSINESS*
 CHARTERED BANK ADMINISTERED INTEREST RATES - PRIME BUSINESS*") COMPARISON OF FIXED & VARIABLE RATES (25 YEARS) Fixed Rates Variable Rates FIXED RATES OF THE PAST 25 YEARS AVERAGE RESIDENTIAL MORTGAGE LENDING RATE - 5 YEAR* (Per cent) Year Jan Feb Mar Apr May Jun Jul
COMPARISON OF FIXED & VARIABLE RATES (25 YEARS) Fixed Rates Variable Rates FIXED RATES OF THE PAST 25 YEARS AVERAGE RESIDENTIAL MORTGAGE LENDING RATE - 5 YEAR* (Per cent) Year Jan Feb Mar Apr May Jun Jul
STATISTICS BOTSWANA INTERNATIONAL MERCHANDISE TRADE STATISTICS. Monthly Digest February 2018
 STATISTICS BOTSWANA INTERNATIONAL MERCHANDISE TRADE STATISTICS Monthly Digest February 2018 Contact Statistician: Malebogo Rakgantswana Email: mrakgantswana@statsbots.org.bw Tel: (+267) 367 1300 Statistics
Max Sort Sortation Option - Letters
 Max Sort Sortation Option - Letters Western Europe Prices Product Code PS5 PS6 Austria* 0.330 7.550 0.330 7.400 Belgium* 0.370 3.700 0.370 3.540 Denmark* 0.620 5.350 0.620 4.215 Finland* 0.385 4.400 0.385
Monthly Digest February 2016 No. 2016/04. Copyrights Statistics Botswana 2016
 STATISTICS BOTSWANA BOTSWANA INTERNATIONAL MERCHANDISE TRADE STATISTICS Monthly Digest February 2016 No. 2016/04 Copyrights Statistics Botswana 2016 Contact Statistician: Malebogo Rakgantswana Email: mrakgantswana@gov.bw
Commemorative Books Coverage List
 Commemorative Books Coverage List England International Football 2018 Date of Paper Pages Event Covered (Daily Mirror ) 3 Apr 1905 Pages 8 and 14 England 1 Scotland 0 (Home Championship) 5 Apr 1909 Page
TEGMA Fall Transportation Symposium
 TEGMA 2017 Fall Transportation Symposium John Wilson Senior Vice President Dairy industry trends 1997 1998 1999 2000 2001 2002 2003 2004 2005 2006 2007 2008 2009 2010 2011 2012 2013 2014 2015 2016 Million
IBSA Goalball World Rankings 31 December 2017 Men's Division
 IBSA Goalball World Rankings 31 December 2017 Men's Division Rank No v Oc t Se p Au g Ju l Team Region Score Goal Diff Results Gol p Gme Last Plyd Weight 1st 5 6 6 1 2 Brazil Americas 661.802 4.564 0.872
INTERNATIONAL MERCHANDISE TRADE STATISTICS
 STATISTICS BOTSWANA INTERNATIONAL MERCHANDISE TRADE STATISTICS Monthly Digest January 2018 Contact Statistician: Malebogo Rakgantswana Email: mrakgantswana@statsbots.org.bw Tel: (+267) 3671300 Release
Japanese Market Potential
 Growth Strategy (announced on 14 June 2013) : Japan is BACK. Overall Target: 2% Real GDP Growth in the next 10 years JPY1.5 million Increase of GNI/capita after 10 years Unleash the Potential of Private
STATISTICS BOTSWANA. INTERNATIONAL MERCHANDISE TRADE STATISTICS Monthly Digest March 2018
 STATISTICS BOTSWANA INTERNATIONAL MERCHANDISE TRADE STATISTICS Monthly Digest March 2018 Contact Statistician: Malebogo Rakgantswana Email: mrakgantswana@statsbots.org.bw Tel: (+267) 367 1300 Statistics
Global Construction Outlook: Laura Hanlon Product Manager, Global Construction Outlook May 21, 2009
 Global Construction Outlook: Short-term term Pain, Long-term Gain Laura Hanlon Product Manager, Global Construction Outlook May 21, 2009 What This Means for You The world is set to be hit this year with
STATISTICS
 DGAGRI-G2 23 Novembre 2017 W O R K I N G D O C U M E N T Horticultural Products FLOWERS AND ORNAMENTAL PLANTS STATISTICS 2006-2016 This statistical document has been prepared by Unit G.2 of DG AGRI, in
AREA TOTALS OECD Composite Leading Indicators. OECD Total. OECD + Major 6 Non Member Countries. Major Five Asia. Major Seven.
 Reference series Composite leading indicators OECD Composite Leading Indicators AREA TOTALS 7-03- 19 OECD Total 19 OECD + Major 6 Non Member Countries 19 Major Seven 19 Major Five Asia 19 Euro area 19
NEW COMMERCIAL VEHICLE REGISTRATIONS EUROPEAN UNION 1. July and August 2017
 PRESS EMBARGO: NEW COMMERCIAL VEHICLE REGISTRATIONS EUROPEAN UNION 1 July and August 2017 Next press release: Tuesday 24 October 2017 1 Data for Malta unavailable Page 1 of 12 Commercial vehicle registrations:
MONTHLY DIGEST May Copyrights Statistics Botswana 2017
 INTERNATIONAL MERCHANDISE TRADE STATISTICS Copyrights Statistics Botswana 2017 Contact Statistician: Zibo Albert Email: zalbert@statsbots.org.bw Tel: (+267) 3671300 Release Date: August 2017 1 Statistics
USTA Player Development 2017 Excellence Grant Criteria Jr Girls, Collegiate & Professional Players
 USTA Player Development 2017 Excellence Grant Criteria Jr Girls, Collegiate & Professional Players In order to encourage the development of U.S. players we have designed USTA Player Development Excellence
Ministry of Economy and Sustainable Development of Georgia
 Ministry of Economy and Sustainable Development of Georgia Economic Growth 42,000.0 36,000.0 30,000.0 24,000.0 18,000.0 12,000.0 6,000.0 0.0 GDP AND ECONOMIC GROWTH 7.2% 6.2% 6.4% 4.6% 4.8% 3.4% 2.9% 2.8%
UK Trade Statistics 2016
 Value ( million) Rate of Exchange (USD against GBP) ORNAMENTAL AQUATIC TRADE ASSOCIATION LTD. "The Voice of the Ornamental Fish Industry" 1 st Floor Office Suite, Wessex House 4 Station Road, Westbury,
Market Insights. June 30, 2018
 June 30, 2018 Economic Overview 2 Global & Regional Growth Forecasts IMF GDP Forecasts (% change YoY) 2010 2011 2012 2013 2014 2015 2016 2017 2018 Advanced Economies 1.7% 1.2% 1.3% 2.1% 2.3% 1.7% 2.3%
Market Insights. March 29, 2019
 March 29, 2019 Economic Overview 2 Global & Regional Growth Forecasts IMF GDP Forecasts (% change YoY) 2010 2011 2012 2013 2014 2015 2016 2017 2018 Advanced Economies 1.2% 1.4% 2.1% 2.3% 1.7% 2.4% 2.3%
Common Market Organisation (CMO) Fruit and vegetables sector Evolution of EU prices of certain F&V
 Fruit and vegetables sector Evolution of EU prices of certain F&V") Common Market Organisation (CMO) Fruit and vegetables sector Evolution of EU prices of certain F&V Unit C.2. - Wine, spirits, horticultural products, specialised crops DG Agriculture and Rural Development
Common Market Organisation (CMO) Fruit and vegetables sector Evolution of EU prices of certain F&V Unit C.2. - Wine, spirits, horticultural products, specialised crops DG Agriculture and Rural Development
Foreign overnights in the Nordic countries 2015
 Foreign overnights in the Nordic countries 2015 Sources: Statistics Statistics Statistics Statistics July 2016 VISIT FINLAND STATISTICS Contents Foreign overnights in the Nordic countries.4 Overnights
Traffic Safety Basic Facts 2008
 Urban road fatalities were reduced by more than 29% between 1997 and 2006. In 2006, more than 8.100 persons died in road accidents inside urban areas in the EU-14. This corresponds to 33,2% of all the
Business opportunities in Turkish Maritime Industry Marco Rensma Director MEYS Emerging Markets Research Istanbul, 24 May 2012
 Business opportunities in Turkish Maritime Industry Marco Rensma Director MEYS Emerging Markets Research Istanbul, 24 May 2012 Content presentation 1. Introduction MEYS Emerging Markets Research 2. Global
Production, trade and supply of natural gas Terajoules
 Terajoules Table Notes Production includes quantities from other sources, which would include any quantities of biogas, LPG or manufactured gas blended with natural gas. Please refer to the Definitions
Energy Security: Markets and Policy
 Energy Security: Markets and Policy Pierre Noël EPRG, University of Cambridge Critical Infrastructure Conference, London, 20 April 2011 Contents Global Oil and the Middle East European Gas and Russia Japan
THE WORLD COMPETITIVENESS SCOREBOARD 2011
 THE WORLD COMPETITIVENESS SCOREBOARD 2011 98.557 94.063 92.588 92.011 90.782 90.219 89.259 87.824 86.475 86.418 86.313 85.707 84.380 84.120 81.629 81.619 81.100 80.278 79.799 78.499 77.599 77.101 76.827
Traffic Safety Basic Facts 2011
 Urban areas Fatalities on urban roads were reduced by 32% between 2000 and 2009. In 2009, about 12.300 people died in traffic accidents on urban roads in the EU-19. This corresponds to 38% of all road
Key Figures and Trends for the Agricultural Machinery Industry
 Key Figures and Trends for the Agricultural Machinery Industry Update: November 2015 (monthly) Contact: Philip Nonnenmacher VDMA Agricultural Machinery Association philip.nonnenmacher@vdma.org Subject
STATISTICS BOTSWANA INTERNATIONAL MERCHANDISE TRADE STATISTICS. Monthly Digest February 2017
 INTERNATIONAL MERCHANDISE TRADE STATISTICS Monthly Digest February 2017 Contact Statistician: Malebogo Rakgantswana Email: mrakgantswana@statsbots.org.bw Tel: (+267) 3671300 Release Date: June 2017 STATISTICS
Small Arms Survey 2015 Annexe 4.4 Authorized transfers of small arms and light weapons to Egypt, Libya, and Syria,
 Small Arms Survey 2015 Annexe 4.4 Authorized transfers of small arms and light weapons to Egypt, Libya, and Syria, 2001 13 Contents 2 Table 4.6a Reported deliveries of small arms to Egypt, 2001 13 6 Table
TABLE 1. REAL GDP AND GROWTH RATES IN THE ESCWA REGION AT CONSTANT 1995 PRICES, (Millions of US dollars and percentages) Percentage change
 Percentage change") TABLE 1. REAL GDP AND GROWTH RATES IN THE ESCWA REGION AT CONSTANT 1995 PRICES, 2001-2004 (Millions of US dollars and percentages) Percentage change Country/area 2000 2001 2002 2003 a/ 2004 b/ 2001 2002
TABLE 1. REAL GDP AND GROWTH RATES IN THE ESCWA REGION AT CONSTANT 1995 PRICES, 2001-2004 (Millions of US dollars and percentages) Percentage change Country/area 2000 2001 2002 2003 a/ 2004 b/ 2001 2002
The Golf Related Products Produced by IAR Team Focus Technology Co., Ltd.
 The Golf Related Products 2012.12 Produced by IAR Team Focus Technology Co., Ltd. Contents 1. The Current Export Situation of China Golf Related Products At 2012...3 1.1. The Export Analysis of Chinese
African swine fever in domestic pigs and wild boar (ASF)
") African swine fever in domestic pigs and wild boar (ASF) Analysis of ADNS data since 01/2018 Reporting period: 2018-01-01 2018-12-09 Data query: 2018-12-10 AGES DSR Austrian Agency for Health and Food
African swine fever in domestic pigs and wild boar (ASF) Analysis of ADNS data since 01/2018 Reporting period: 2018-01-01 2018-12-09 Data query: 2018-12-10 AGES DSR Austrian Agency for Health and Food
CURRENT DEMOGRAPHIC SITUATION IN LATVIA
 CURRENT DEMOGRAPHIC SITUATION IN LATVIA Peteris Zvidrins University of Latvia Workshop Very old people s housing and housing and health situation in Latvia 21 May, 2013 Population and its change in 10
Traffic Safety Basic Facts 2008
 More than 5.000 people died in road traffic accidents involving HGVs in 2006 1 (EU-14 plus the Czech Republic, Estonia, Hungary Malta and Poland) Traffic Safety Basic Facts 2008 and Buses (HGVs) are defined
Debriefing from Stone Fruit GREX (6/06/2012)
") Debriefing from Stone Fruit GREX (6/06/2012) Catalina STANCU European Commission DG Agriculture and Rural Development (DG AGRI) Unit C.2. Olive oil, horticultural products Management Committee Brussels,
Debriefing from Stone Fruit GREX (6/06/2012) Catalina STANCU European Commission DG Agriculture and Rural Development (DG AGRI) Unit C.2. Olive oil, horticultural products Management Committee Brussels,
Traffic Safety Basic Facts 2012
 Urban areas Fatalities on urban roads were reduced by 39% between 2001 and 2010. In 2010, about 10.830 people died in traffic accidents on urban roads in the EU-19. This corresponds to 38% of all road
Global Containerboard Outlook
 Global Containerboard Outlook European Conference March 2018 Gleb Sinavskis Economist, European Paper Packaging Copyright 2018 RISI, Inc. Proprietary Information Gleb Sinavskis Economist, European Paper
Freshwater fish. Carp, Perch, Pike, Burbot, Barb, Milkfish. Extract from GLOBEFISH Databank Prices - Exports - Imports - Production
 Commodity Update Freshwater fish Carp, Perch, Pike, Burbot, Barb, Milkfish Extract from GLOBEFISH Databank Prices - Exports - Imports - Production November 2012 Freshwater fish - Carp, Perch, Pike, Burbot,
2016 River Use Statistics -by Steve Sullivan
 Grand Canyon River Office 2016 River Use Statistics -by Steve Sullivan Topics River Use Statistics Overview Commercial River Use Statistics Noncommercial River Use Statistics Noncommercial River Lottery
Traffic Safety Basic Facts 2008
 In 2006 1, more than 4.700 seniors died in road traffic accidents in 14 European countries. Fatalities of elderly people in road traffic accidents reduced by over 3 between 1997 and 2006. Traffic Safety
DEVELOPMENT AID AT A GLANCE
 DEVELOPMENT AID AT A GLANCE STATISTICS BY REGION 5. EUROPE 2018 edition All the data in this report are available at: http://www.oecd.org/dac/financing-sustainable-development/ 5.1. ODA TO EUROPE - SUMMARY
October 23, 2015 FINAL STATISTICAL REPORT 2014/15
 C A L I F O R N I A D R I E D P L U M B O A R D 3840 Rosin Court Phone (916) 565-6232 Suite 170 Fax (916) 565-6237 Sacramento, CA 95834 www.californiadriedplums.org October 23, 2015 FINAL STATISTICAL REPORT
Introductions, Middle East, Israel, Jordan, Yemen, Oman Week 1: Aug Sept. 1
 Introductions, Middle East, Israel, Jordan, Yemen, Oman Week 1: Aug. 28 - Sept. 1 ASSIGNMENT Monday Tuesday Wednesday Thursday Friday Due Wednesday pgs. 6-11 Do not start the workbook or study sheet assignments
Mean Sea Level Pressure and Wind Climatology over the North Indian Ocean: Quality control, Validation and Biases
 Mean Sea Level Pressure and Wind Climatology over the North Indian Ocean: Quality control, Validation and Biases M. Rajeevan and S.K.Dikshit India Meteorological Department Pune. India Introduction India
FINAL REPORT for Sports Tourism Report For the Year 2013
 FINAL REPORT for Sports Tourism Report For the Year 2013 Prepared for The Cyprus Tourism Orgaization September 201 CONTENTS Page 1. Main Findings 2 2. Appointment and Methodology 3. General Indicators:
January Deadline Analysis: Domicile
 January Deadline Analysis: Domicile Applicants by domicile at the 15 January deadline D.1.1 Applicants by domicile group UK EU (excluding UK) Not EU All domiciles 20% 10% -0% -10% -20% -30% -40% -50% 2009
Relative age effect: a serious problem in football
 CIES Football Observatory Monthly Report Issue no. 10 - December 2015 Relative age effect: a serious problem in football Drs Raffaele Poli, Loïc Ravenel and Roger Besson 1. Introduction Numerous studies
UK Trade Statistics 2017
 Value ( million) Rate of Exchange (USD against GBP) ORNAMENTAL AQUATIC TRADE ASSOCIATION LTD. "The Voice of the Ornamental Fish Industry" 1 st Floor Office Suite, Wessex House 4 Station Road, Westbury,
08 / Industriveien 18 Phone: N Kristiansund Fax:
 Aquaculture Bulletin HEADLINES 08 / 2006 - a guideline for investors in the aquaculture business * Still high prices on the wholesale markets in the EU, with total supply of Atlantic salmon up with 4.6
Beer statistics edition. The Brewers of Europe
 Beer statistics 2016 edition The Brewers of Europe Beer statistics 2016 edition The Brewers of Europe November 2016 ISBN 978-2-9601382-7-6 EAN 9782960138276 1 TABLE OF CONTENTS Foreword by President
Mobarakeh Steel Company (MSC) Can Iranian slabs & HRC support SE Asian steel industries?
 Can Iranian slabs & HRC support SE Asian steel industries?") (MSC) Can Iranian slabs & HRC support SE Asian steel industries? JAKARTA June 2018 Iranian slab, an opportunity for SE Asia flat producers Overview of global slab trade Slab trade in SE Asia (MSC) An overview
(MSC) Can Iranian slabs & HRC support SE Asian steel industries? JAKARTA June 2018 Iranian slab, an opportunity for SE Asia flat producers Overview of global slab trade Slab trade in SE Asia (MSC) An overview
Student Nationality Mix for BAT Bath
 Student Nationality Mix for BAT Bath Country Total Saudi Arabia 16. Oman 11.8% Spain 10. China 10. Libya 7. Thailand 6. Korea (South) 6. France 3.9% Venezuela 3. Italy 2.9% Brazil 2. Turkey 2. Switzerland
Beef Cattle Market Update
 Beef Cattle Market Update August 8, 2017 Dr. Scott Brown Agricultural Markets and Policy Division of Applied Social Sciences University of Missouri brownsc@missouri.edu http://amap.missouri.edu Twitter
2 nd Road Safety PIN Conference 23 June 2008 Countdown to only two more years to act!
 2 nd Road Safety PIN Conference 23 June 2008 Countdown to 2010 - only two more years to act! EU ambition EU target to cut by 50% yearly road deaths between 2001 and 2010 Countries have similar national
European Values Study & World Values Study - Participating Countries ( )
") GESIS Data Archive for the Social Sciences http://www.gesis.org/en/home/ ASEP/JD Data Archive http://www.jdsurvey.net/jds/jdsurvey.jsp European Values Study & World Values Study - Participating Countries
GESIS Data Archive for the Social Sciences http://www.gesis.org/en/home/ ASEP/JD Data Archive http://www.jdsurvey.net/jds/jdsurvey.jsp European Values Study & World Values Study - Participating Countries
 Children (Aged
 New Growth Segments for the Air Cargo Industry
 Page 1 New Growth Segments for the Air Cargo Industry 4 th Air Cargo Economics Conference Prague, April 22-23, 2004 Page 2 Assumptions Primary commodity sectors and their growth Perishables: are they really
U.S. Product Exports by Type to NAFTA Partners (Billion $USD)
") Veronica Nigh, American Farm Bureau Federation August 24, 2017 45.0 U.S. Product Exports by Type to NAFTA Partners (Billion $USD) Bulk Consumer Oriented Intermediate 40.0 35.0 30.0 25.0 20.0 15.0 10.0
Veronica Nigh, American Farm Bureau Federation August 24, 2017 45.0 U.S. Product Exports by Type to NAFTA Partners (Billion $USD) Bulk Consumer Oriented Intermediate 40.0 35.0 30.0 25.0 20.0 15.0 10.0
Elements for the Biennial Review And Assessment of the World Timber Situation SELECTED DATA AND ANALYSIS.
 Elements for the Biennial Review And Assessment of the World Timber Situation 2015-2016 SELECTED DATA AND ANALYSIS Frances Maplesden Content Results of the 2016 Joint Forest Sector Questionnaire Secondary
OECD employment rate increases to 68.4% in the third quarter of 2018
 Paris, 17th January 2019 News Release: 3rd Quarter 2018 OECD employment rate increases to 68.4% in the third quarter of 2018 The OECD area employment rate the share of the working-age population with jobs
SWISS Traffic Figures May 2004
 SWISS Traffic Figures May 2004 SWISS continues seat load factor improvement in May SWISS s load factor for May was 4.8 percentage points better than for the same period last year. Seat load factor for
Update of trade weights data underlying the EERs and HCIs
 August 2017 Update of trade weights data underlying the EERs and HCIs The trade weights underlying the calculation of the effective exchange rates (EERs) of the euro and the harmonised competitiveness
June Deadline Analysis: Domicile
 June Deadline Analysis: Domicile Applicants by domicile at the 30 June deadline I.1.1 Applicants by domicile group Difference between cycle and 2017 cycle UK EU (excluding UK) Not EU All domiciles 10%
2017/18 Corn Outlook
 217/18 Corn Outlook 217 Ag Econ In service Training Dr. S. Aaron Smith, Assistant Professor, Department of Agricultural and Resource Economics, University of Tennessee https://ag.tennessee.edu/arec/pages/cropeconomics.aspx
Cattle Market Outlook & Important Profit Factors for Cattle Producers
 Cattle Market Outlook & Important Profit Factors for Cattle Producers Dr. Scott Brown Agricultural Markets and Policy Division of Applied Social Sciences brownsc@missouri.edu http://amap.missouri.edu $
Bicycle Produced by IAR Team Focus Technology Co., Ltd
 Bicycle 2012.11 Produced by IAR Team Focus Technology Co., Ltd Contents 1. 2012 Chinese Bicycle Export Situation...3 1.1. Jan.-Sep.2012 China Bicycle Exports Monthly Trend... 3 1.2. Jan.-Sep.2012 China
Production and Consumption of Ozone Depleting Substances under the Montreal Protocol UNEP. Ozone Secretariat UNEP November 2005
 Production and Consumption of Ozone Depleting Substances under the Montreal Protocol 1986 2004 UNEP Ozone Secretariat UNEP November 2005 Published: November 2005 by Secretariat for The Vienna Convention
SWISS reports stable load factors
 SWISS Corporate Communications Phone: +41 (0)848 773 773 Fax: +41 (0)44 564 2127 communications@swiss.com SWISS.COM Media release Zurich Airport, October 10, 2008 SWISS reports stable load factors SWISS
Dry Bulk Shipping in Indonesia Opportunities & Outlook
 Dry Bulk Shipping in Indonesia Opportunities & Outlook Mare Forum, Jakarta 27 Peter Malpas 29 th November 27 Introduction Indonesia Key Facts Land Area 1,919,44 km2 = World s s 16 th Largest Population
GLOBAL BAROMETER OF HOPE AND DESPAIR FOR 2011
 GLOBAL BAROMETER OF HOPE AND DESPAIR FOR 2011 Volume 1: Statistical Report Findings based on responses from more than 64,000 scientifically selected cross-section of Men and Women from all socioeconomic
KINGDOM OF CAMBODIA NATION RELIGION KING 3
 KINGDOM OF CAMBODIA NATION RELIGION KING 3 TOURISM STATISTICS REPORT February 2018 MINISTRY OF TOURISM Statistics and Tourism Information Department No. A3, Street 169, Sangkat Veal Vong, Khan 7 Makara,
The Baltic economies: Current situation and future trends, possibilities and pitfalls
 The Baltic economies: Current situation and future trends, possibilities and pitfalls Riga, 15 October 2015 Morten Hansen Head of Economics Department, Stockholm School of Economics in Riga Member of the
Finance Domain Task Force
 March 20 21, 2018, Reston, VA OMG Technical Meetings March 2018 (note the time zone is Eastern Daylight Time (EDT = GMT-4) Tuesday March 20 2018 Time Topic Presenter, Comments Meeting 09:00 9.05 Kick-off,
TABLE 1: NET OFFICIAL DEVELOPMENT ASSISTANCE FROM DAC AND OTHER DONORS IN 2012 Preliminary data for 2012
 TABLE 1: NET OFFICIAL DEVELOPMENT ASSISTANCE FROM DAC AND OTHER DONORS IN 2012 DAC countries: 2012 2011 2012 ODA ODA/GNI ODA ODA/GNI ODA Percent change USD million % USD million % USD million (1) 2011
Economic Outlook March Economic Policy Division
 Economic Outlook March 212 Economic Policy Division Real GDP Outlook Percent Change, Annual Rate 2 1 1 - -1 197 197 198 198 199 199 2 2 21 U.S. GDP Actual and Potential Quarterly, Q1 197 to Q4 211 Real
Portuguese, English, and. Bulgarian, English, French, or
 Country Language Fiber Content Algeria Arabic Angola Portuguese, English, and French (optional) Optional Argentina Spanish Armenia Armenian Optional Australia English Austria German Bahrain Arabic or English
Salmon Market Analysis 2007
 Salmon Market Analysis 2007 April 2008 Systemizing the World of Aquaculture and Fisheries Industriveien 18, NO-6517 Kristiansund N Norway Tel.: +47 71 68 33 00 Fax: +47 71 68 33 01 E-mail: mail@kontali.no
Asian Bowling Federation Bowling Calendar 2010
 Asian Bowling Federation Bowling Calendar 2010 Jan 23 Feb 2 Asian Youth Tenpin Bowling Championships Kuwait Feb 11 26 Dubai International Open Bowling Tournament 2010 Dubai, UAE*+ Feb 25 Mar 4 HH The Emir
Utah Ag Bankers Conference Alfalfa and Dairy Outlook
 Utah Ag Bankers Conference Alfalfa and Dairy Outlook Dillon M Feuz Utah State University Extension Feb 2018 Hay Market Most data provided by USDA- AMS, NASS & FAS 1990 1990 1991 1991 1992 1992 1993 1994
German Machine Tool Industry - Key Figures
 German Machine Tool Industry - Key Figures Mill. EUR %-Change 1-2Q 1-2Q 1-2Q 2014 2015 2016 2017 2017 2018 2016 2017 2018 Production total 14.486 15.087 15.007 16.006 7.062 7.820-1 +7 +11 Metal working
Heavy Goods Vehicles and Buses
 Traffic Safety Basic Facts 2013 - Main Figures Traffic Safety Basic Facts 2015 Heavy Goods Vehicles and Buses General More than 4.000 people died in road accidents involving HGVs in 2013. Heavy Goods Vehicles
Beef Outlook. Regional Dealer Event. February 9, Dr. Scott Brown Agricultural Markets and Policy Division of Applied Social Sciences
 Beef Outlook Regional Dealer Event February 9, 2018 Dr. Scott Brown Agricultural Markets and Policy Division of Applied Social Sciences brownsc@missouri.edu http://amap.missouri.edu $ Per Cwt. MED. & LRG.
Current Hawaii Economic Conditions. Eugene Tian
 Current Hawaii Economic Conditions Eugene Tian Department of Business, Economic Development & Tourism At the PATA/TTRA 2016 Annual Outlook & Economic Forecast Forum February 3, 2016 Positive Signs in the
Beer statistics edition. The Brewers of Europe
 Beer statistics 2015 edition The Brewers of Europe Beer statistics 2015 edition The Brewers of Europe Editor: Marlies Van de Walle October 2015 ISBN 978-2-9601382-5-2 EAN 9782960138252 1 TABLE OF CONTENTS
Finland s sawmilling industry
 Finland s sawmilling industry Howard Sidney-Wilmot Stora Enso - Sales Director UK, Ireland & Benelux September 2015 Stora Enso Wood Products 13/10/2015 1 Finland s forest products 19bn total value 11bn
Public data underlying the figures of Annual Report on the Results of Monitoring the Internal Electricity and Natural Gas Markets in 2016
 Public data underlying the figures of Annual Report on the Results of Monitoring the Internal Electricity and Natural Gas Markets in 2016 December 2017 Legal notice This document is a joint publication
DEVELOPMENT AID AT A GLANCE
 DEVELOPMENT AID AT A GLANCE STATISTICS BY REGION 6. OCEANIA 2018 edition All the data in this report are available at: http://www.oecd.org/dac/financing-sustainable-development/ 6.1. ODA TO OCEANIA - SUMMARY
Traffic Safety Basic Facts 2010
 Heavy Goods Vehicles and Buses Heavy Goods Vehicles (HGVs) are defined as goods vehicles of over 3,5 tons maximum permissible gross vehicle weight. Road traffic accidents involving HGVs tend to be more
Office of Institutional Research
 ri a l C ty Consistency Sim p li c it y Office of Institutional Research Place of Residence for International Students by Gender: Published October 2012 OIR Staff: Peggy Johnson - Associate Director Miriam
IR-Pay Go Rates. There are three pricing groups for Pay Go rates for International Roaming as follows:
 IR-Pay Go Rates A. IR Pay Go Rate Summary There are three pricing groups for Pay Go rates for International Roaming as follows: Sr IR Pay Go Rate Group 1 Rs 2 2 2 2 Rs 10 10 10 3 Rs 50 600 25 Applicable
2017/18 Soybean Outlook
 217/18 Soybean Outlook 217 Ag Econ In service Training Dr. S. Aaron Smith, Assistant Professor, Department of Agricultural and Resource Economics, University of Tennessee https://ag.tennessee.edu/arec/pages/cropeconomics.aspx
CMMI Maturity Profile Report. 30 June 2017
 CMMI Maturity Profile Report 30 June 2017 Executive Summary Appraisals increased 14% 1 Jan 30 Jun 17 Companies who reappraise continue to increase, currently at 74% 10% of reported appraisals are high
Beer statistics edition. The Brewers of Europe
 Beer statistics 2017 edition The Brewers of Europe Beer statistics 2017 edition The Brewers of Europe December 2017 ISBN 978-2-9601382-9-0 EAN 9782960138290 1 TABLE OF CONTENTS Foreword by President