The Importance of Mina site within Mecca urban cover change between 1998 and 2013
|
|
|
- Rose Burke
- 5 years ago
- Views:
Transcription


1 FINAL INTERNSHIP REPORT Internship in Urban Remote Sensing Period: February through May 2015 Company: Starlab Ltd, UK The Importance of site within Mecca urban cover change between 1998 and 2013 Author Ayman Imam Supervised by Bahaaeddin Alhaddad, GISP, PhD Business Developer, Starlab Space :the city of tents, Saudi Arabia
2 Introduction The following report describes the activities carried out during a 12-week, full-time internship at the STARLAB LTD, UK Office. The document contains information about the organization and the responsibilities performed throughout the period between 16 th of February and 16 th of May More than a plain account of tasks, the objective of this text is to reflect upon the experiences collected during the internship from the perspective of a PhD student in Urban Management Field. The first part of the report offers an overview of the organization, followed by the working plan initially agreed upon with the company and approved by the Barcelona Tech University as a suitable internship. Following, it proceeds to describe in some detail the most relevant tasks carried out and their respective analysis. Finally, the report wraps-up with a few closing remarks and conclusions from the experience. Starlab Ltd Starlab is a high-tech company innovating in two fields since 2000: Space and Neuroscience. Starlab's mission is to transform science into technologies with a profound positive impact on society. Our vision is to make science more useful, alive, vibrant, and faster. They focuses on creation of new technologies, value added information products and spin-off creation. They are currently organized in two business units: Neuroscience Research, Neurokai (neuromonitoring and neuromodulation services), Star2Earth (Earth Observation products and services) and Space Technology (Space tech research, simulation and performance analysis).
3 Working Plan Scuda Project The main project to be carried out during the internship was to work on the Scuda Project that was an Earth Observation Support for Asian Development Bank Activities (Secondary cities urban development in Armenia) to provide key information to support the creation of a priority list of urban investment projects and improvements in the selected cities. In that project I was in charge to complete the digitizing process for the satellite images provided for the selected cities on one hand, and on the other hand to examine the continuity and discontinuity of the built up area for 2003 and 2013 for each city in order to observe the changes. GIS and Remote sensing practices During the second part of the internship was focusing on some of GIS and Remote sensing application in which I have learned how to obtain the Landsat satellite images, how to open them on ENVI (Envi is the abbreviation of word phrases The Environment for Visualizing Images and this is the name for the software system to evolve and advanced image processing), how to process them to be useful for information extraction and classification and how to export them to ArcMap (as a shape file in order to apply some urban morphology indicators (ArcMap is the main component of Esri's ArcGIS suite of geospatial processing programs, and is used primarily to view, edit, create, and analyze geospatial data. The next slides show the work I have done exploiting the experience I learned from the Scuda project
4 The Title The site of within Makkah urban cover change between 1998 and 2013 Objectives Analyzing the urban cover change of Makkah between 1998 and 2013 in order to find out: 1- How much have changed the urban cover of Makkah 2- The pattern and the directions of the growth. 3- Comparison between the growth of the different part of Makkah. 4- How important the part where is located among the other parts 5- The change of the Entropy and the compactness of the urban cover and how their impact on the site if could be. 6- The location of and its relation with the social and economic spot of Makkah. Methods Multi-temporal satellite images analysis using the Remote sensing and GIS application to extract data as much as possible from Landsat Satellite images of Makkah for the years of 1998, 2003, 2008 and 2013 Source Download Landsat satellite images from EarthExplorer (USGS) Software ENVI 5.1, ArcMap 10, Excel and PowerPoint.
 Date Resolution 1998")

5 Working Plan A) Landsat satellite imagery download Year Satellite Sensor type Acquisition Spatial (Dataset) Date Resolution 1998 LANDSAT_5 TM 8/25/ m 2003 LANDSAT_7 ETM+ 8/15/ m 2008 LANDSAT_7 ETM+ 8/28/ m 2013 LANDSAT_7 ETM+ 8/26/ m


6


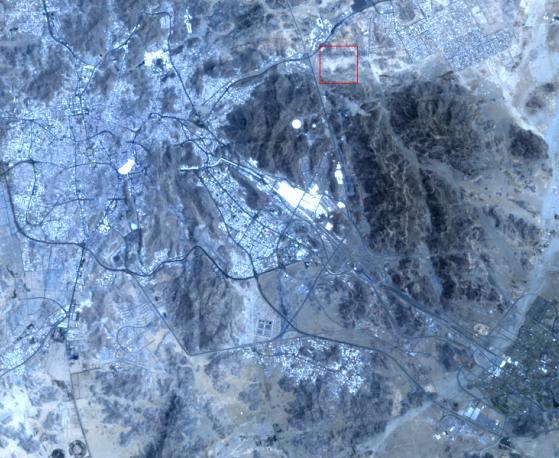
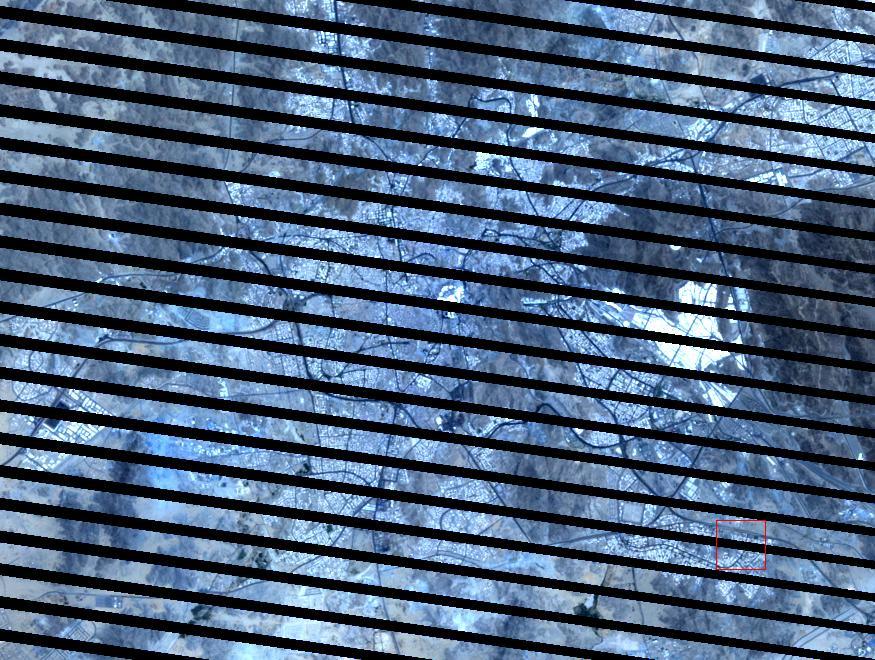
7 B) Filling Gaps in Landsat ETM Images On 31 May 2003 the Landsat 7 Enhanced Thematic Mapper (ETM) sensor had a failure of the Scan Line Corrector (SLC). Since that time all Landsat ETM images have had wedgeshaped gaps on both sides of each scene, resulting in approximately 22% data loss. Scaramuzza, et al (2004) developed a technique which can be used to fill gaps in one scene with data from another Landsat scene. A linear transform is applied to the filling image to adjust it based on the standard deviation and mean values of each band, of each scene. This can be applied by using ENVI software and install the plugin landsat_gapfill.sav in the proper ENVI install folder. Below you can see an example of this gap-filling technique as applied to a pair of Landsat ETM

8 B) Pan-sharpening Satellite Images This technique to increase image quality. Pan-sharpening produces a high-resolution color image from three, four or more low-resolution multispectral satellite bands plus a corresponding high-resolution panchromatic bands: High-res grayscale band + Low-res color bands = Hi-res color image Resolution 15 m Resolution 30 m
 in order to facilitate the")

9 C) Region of interest selection It is important to define and select the region of our interest (Makkah city) in order to facilitate the rest of processing, by imported the boundary of Makkah into the full downloaded images in order to extract the city of Makkah. Full image Makkah city

10 C) Land cover change detection Many methods and techniques have been used to detect the land cover change of the multi-temporal satellite images of Makkah in order to extract the urban caver change. we have applied the supervised classification technique in which the user selects representative samples for each land cover class in the digital image. These sample land cover classes are called training sites. The image classification software uses the training sites to identify the land cover classes in the entire image. The classification of land cover is based on the spectral signature defined in the training set. The digital image classification software determines each class on what it resembles most in the training set. Five land cover class we have identify; Urban, Street, Slope, Soil and Vegetation
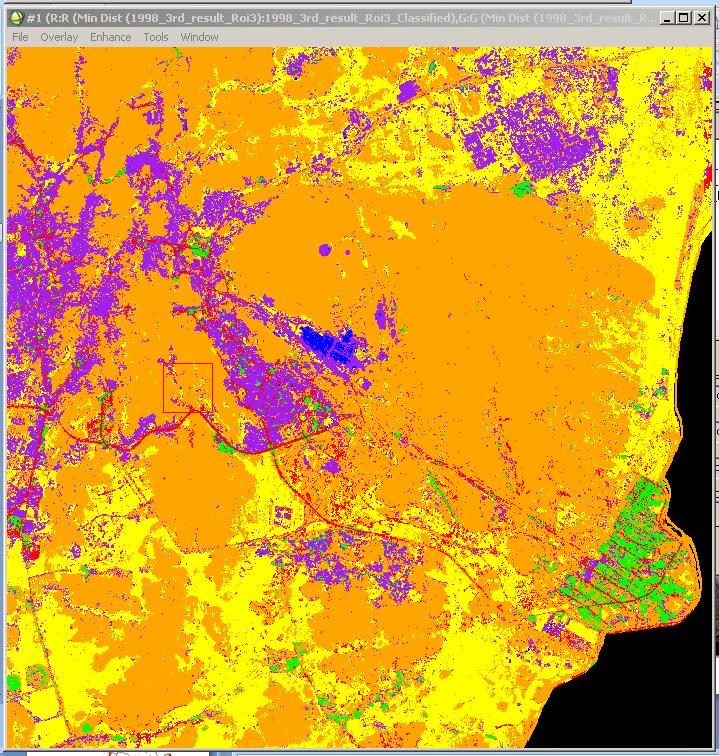
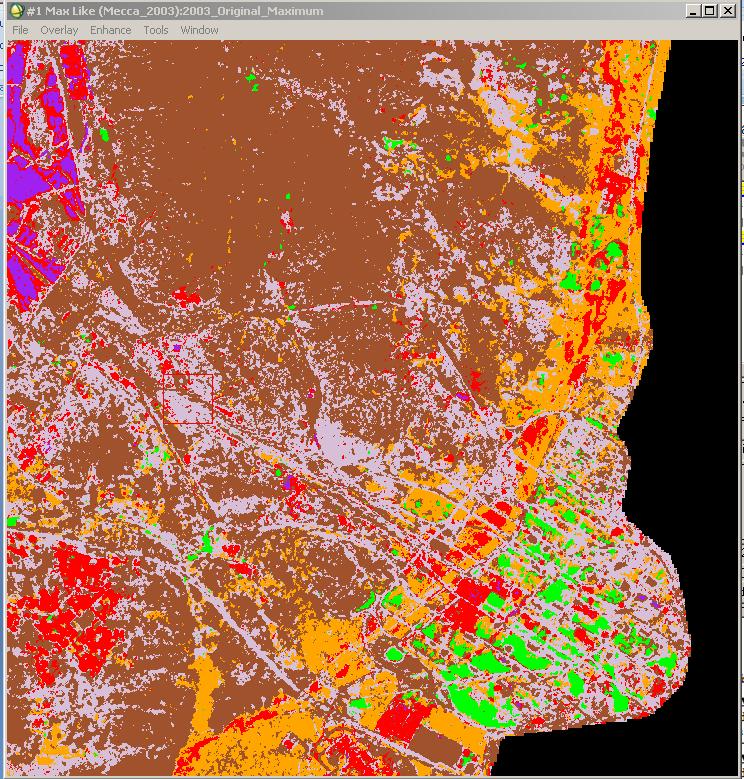
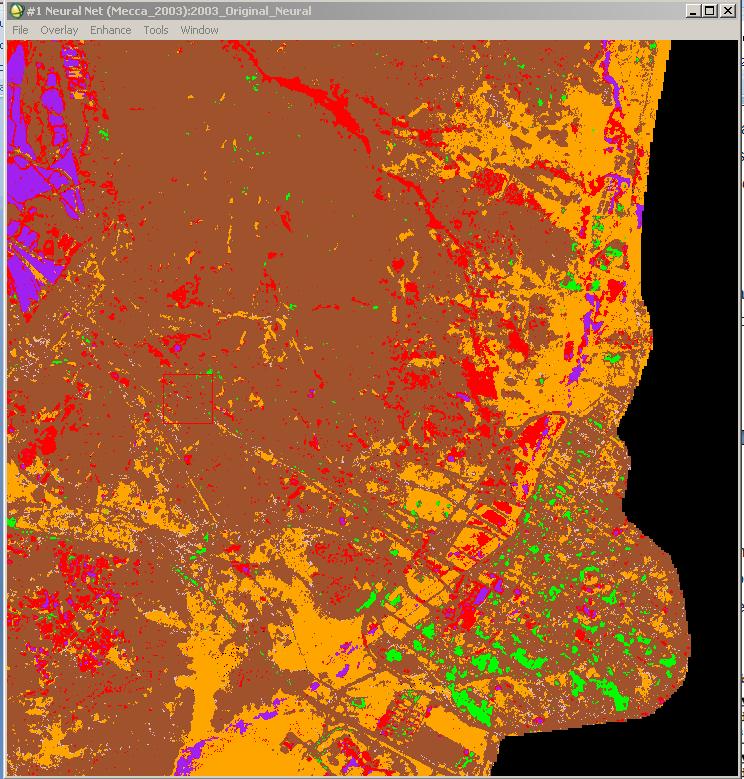
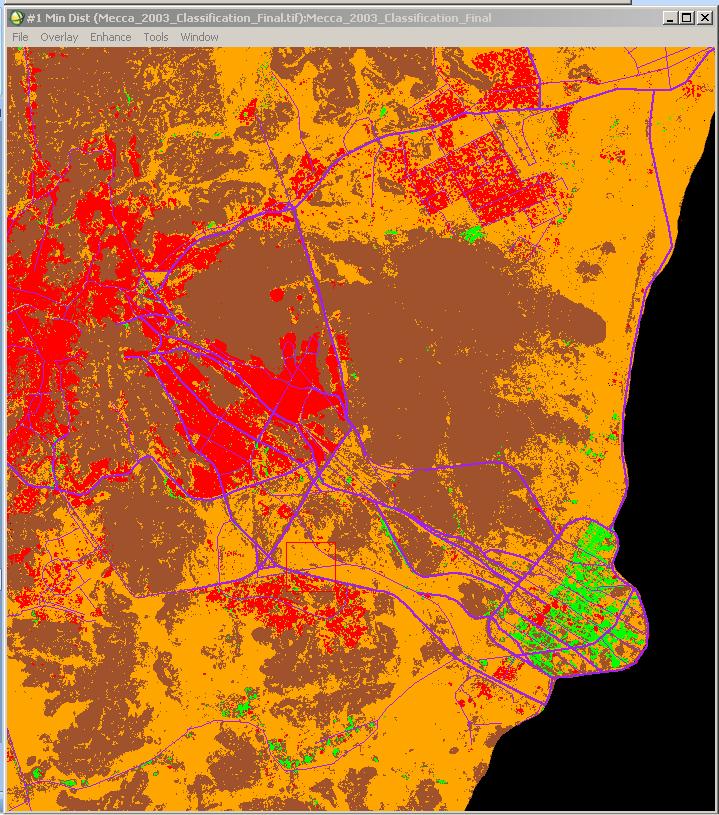
11 Classification test


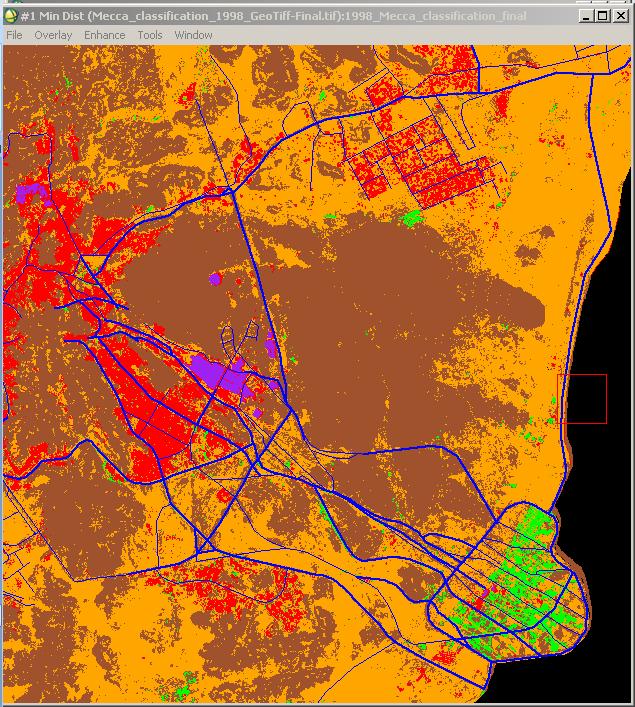
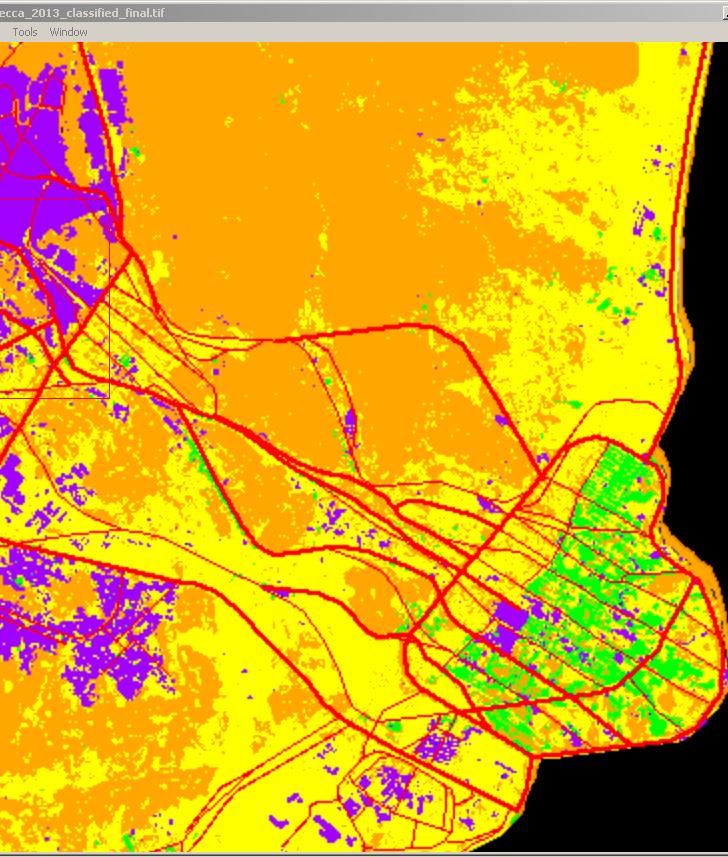
12 Exporting the result to GIS After having the land cover classified using ENVI, we exported the result to GIS in order to start the analysis and apply some urban morphology indices
13 Urban Cover class In a city such Makkah most of land cover change between 1998 and 2013 have been occurred within the urban cover class and the roads network. Our focusing in this part is the urban cover change in order to measuring change by km2, the pattern and axis of change, comparison between the different part of Makkah, the Entropy and the compactness change etc
14 1998 Total urban cover area m2 (77.29 Km2) Urban Cover City Center Roads network
15 2003 Total urban cover area m2 (90.61 Km2) Change Percentage % Urban Cover City Center Roads network
 Change Percentage 17.")
16 2008 Total urban cover area m2 ( Km2) Change Percentage % Urban Cover City Center Roads network
17 2013 Total urban cover area m2 ( Km) Change Percentage % Urban Cover City Center Roads network
18 Makkah urban cover change between 1998 and % % Built-up area change by Km % 14.00% 12.00% Change Percentag % Year Built-up area change by Km Year Total Change Percentage % 17.23% 17.61% 13.69% 56.75%
19 The total change percentage between 1998 and 2013 is (56.75%) Year Change % Urban Km m Urban cover area by Km Urban Km m2 Note : The change between 2008 and 2013 is less than the change between and between , because of the huge urban development projects started since 2011 which eliminate many slum areas located in the city center.

20 Urban Growth Direction As observed that most of the urban growth of Makkah concentrates on five main axes, the west, the northwest, the northeast, the southeast and the southwest. West axis Jeddah Road Northwest axis Al-madinah Road Northeast axis Riyadh Road Those five axes are the direction of five important cities, Jeddah, Al-madinah, Riyadh, Taif and Jizan. The site of is located between tow axes, the Northeast (Riyadh Road) and Southeast (Taif Road). Southwest axis Jizan Road Southeast axis Taif Road

21 Urban Growth Direction In order to measure the urban cover change in each axis, we divide the urban cover into five parts according to the five axes and observe and calculate the urban cover change of each part to find out the percentage of change of the parts where the site of is located. We called the five parts as; Northwest Part (NWP), Northeast Part (NEP), Southeast Part (SEP), Southwest Part (SWP) and West Part (WP).
22 Northwest Part (NWP) Year Urban km2 chg. % % from the total of Urban change by km2 (NWP) (NWP) Precentage of chg. %
23 Northwest Part (NWP) Year Urban km2 Chg. % % from the total of Urban change by km2 (NWP) (NWP) Precentage of chg. %
24 Southeast Part (SEP) Year Urban km2 chg. % % from the total of Urban change by km2 (SWP) (NWP) Precentage of chg. %
25 Northwest Part (NWP) Year Urban km2 chg. % % from the total of Urban change by km2 (SWP) (SWP) Precentage of chg. %
26 Northwest Part (NWP) Year Urban km2 chg. % % from the total of Urban change by km2 (WP) (WP) Precentage of chg. %
27 Urban cover area change by km2 35 Year NWP NEP SEP SWP WP WP NWP SWP NEP SEP Percentages of change % Year NWP NEP SEP SWP WP Total chg WP NWP SWP NEP SEP NWP (39.78%) NEP (89.10%) SEP (71.18%) SWP (55.03%) WP (23.58%)
28 Observation The below charts show the comparison between the areas and percentage of change for all parts. it is observed that the Northeast part (NEP) had more urban cover change than the other parts and the (NEP) and (SEP) Parts where is located have had higher percentage of change than the other parts during the last 20 years. that said, the parts where is located have had more than the half of the total urban cover change of Makkah, therefore, the location of is also getting higher importance within the urban growth of Makkah chg km2 chg % All parts Chg of 55.51% Total NEP SEP NWP (39.78%) NEP (89.10%) SEP (71.18%) SWP (55.03%) WP (23.58%)

 cells value close to one indicate")
29 The Entropy Index Objective -To describe the structure and behavior of different systems such as the urban growth. -Identify and characterize the degree of spatial concentration or dispersion in a specific area. Methods By converting the urban cover into cells and apply a specific developed tool on GIS to calculate the correlation between each cell and its surrounded cells. The highest cell value will be 1 and the lowest will be 0, cells value close to zero indicate that there are more chance to change (high entropy) cells value close to one indicate that the change is hard (low entropy).. For urban studies it is preferred to have more high entropy cells than low entropy cells.. Lowest entropy cell Highest entropy cell
30 1998 NWP NEP - All Cells Comparison WP All Parts NEP NWP SEP SWP WP Total cells Low entropy cells High Entropy cells Percentage % SWP SEP NWP NEP - High Entropy Cells Comparison WP NEP NWP SEP SWP WP High Entropy Cells SWP SEP
31 2003 NWP NEP - All Cells Comparison WP All Parts NEP NWP SEP SWP WP Total cells Low entropy cells High Entropy cells Percentage % SWP SEP NWP NEP - High Entropy Cells Comparison WP NEP NWP SEP SWP WP SWP SEP High Ent High Ent
32 2008 NWP NEP - All Cells Comparison WP All Parts NEP NWP SEP SWP WP Total cells Low entropy cells High Entropy cells Percentage % SWP SEP NWP NEP - High Entropy Cells Comparison WP NEP NWP SEP SWP WP High Ent SWP SEP High Ent High Ent
33 2013 NWP NEP - All Cells Comparison WP All Parts NEP NWP SEP SWP WP Total cells Low entropy cells High Entropy cells Percentage % SWP SEP NWP NEP - High Entropy Cells Comparison WP NEP NWP SEP SWP WP High Ent High Ent High Ent High Ent SWP SEP
34 Observation As we can observed below that the parts of (NEP and SEP) where located are the parts with the highest number of high entropy cells, that said, the opportunity of growing in these parts are higher than the other parts, which indicate that for the future urban growth of Mecca will be inside the most growing parts of Mecca. On the other hand the percentage of change shows that the (WP) part had the highest change during last twenty years because of the demolish work in the central part of Mecca, and the (NEP and SEP) parts come next. Year NWP NEP SEP SWP WP Year NWP NEP SEP SWP WP Total chg NWP NWP NEP SEP SWP WP NEP SEP SWP WP
35 Comparing the area change with the entropy values change for each part of Mecca Urban cover area change by km2 Year NWP NEP SEP SWP WP High Entropy cells change Year NWP NEP SEP SWP WP WP NWP SWP NEP SEP NWP NEP SEP SWP WP Year NWP NEP SEP SWP WP Total chg WP NWP SWP NEP SEP Year NWP NEP SEP SWP WP Total chg NWP NEP SEP SWP WP

36 1998 The kernel density of the entropy value change indicate the direction of growth
37 2003
38 2008
39 2013
40 Conclusion - The urban cover change of Mecca shows that the parts where located have gained higher importance than the other parts, that because of the higher change of the urban cover area and in the same time higher number of high entropy cells. -The central part have had the lowest urban cover change but have had the highest percentage of high entropy cells change. -The site of during the last twenty years have not changed in its cover area neither in its entropy cells value, which indicate the opportunity to change the site of to adapt the future need of Mecca growth is low. But the surrounding areas have high opportunity to grow than the other parts of Mecca -The last slides show the Kernel density of the entropy value change which can indicate the direction of growth inside the parts where is located and how that direction gives more importance to the sites of within the future growth of Mecca. -Many others indexes can be applied to analyze the urban cover change and its impact on the site of.
41 Future Plans -Participating in XXIII ISPRS CONGRESS, Prague Publishing some articles related to the subject. - Trying to make some kind of collaboration between my university in Saudi Arabia and Barcelona tech university and Starlab company as well. CLOSING REMARKS - The internship, and in general working at Starlab, provided interesting insight of how is urban remote sensing analysis and development is important nowadays for any academic or professional urban study - Simultaneously, it was a good opportunity to put in practice and develop further negotiation and organizational skills and refresh some concepts in Urban field required for the completion of my PhD Thesis - Last but not least, it was a great opportunity for developing personal networking activities and making contacts which may prove of value in the near future and to work with a fantastic team of very hard-working guys
Monitoring tidal movements in Cook Inlet, Alaska, using the integration of remote sensing data, GIS, and inundation models
 Monitoring tidal movements in Cook Inlet, Alaska, using the integration of remote sensing data, GIS, and inundation models Hua Liu Department of political Science and Geography Old Dominion University
Uncertainty Estimates in Satellite Derived Bathymetry
 Uncertainty Estimates in Satellite Derived Bathymetry Richard Flemmings, TCarta #chcnsc2018 Introduction and Overview 1. TCarta 2. Satellite Derived Bathymetry Overview 3. Satellite Derived Bathymetry
March 6, 2013 Tony Giarrusso, Rama Sivakumar Center for GIS, Georgia Institute of Technology
 March 6, 2013 Tony Giarrusso, Rama Sivakumar Center for GIS, Georgia Institute of Technology 33 46 35.74 N, 83 23 48.33 W Location: Georgia Institute of Technology, College of Architecture Established:1996
Creation of bathymetric maps using satellite imagery
 Creation of bathymetric maps using satellite imagery Bradley L. McCarthy, Richard C. Olsen, Angela M. Kim Naval Postgraduate School, 1 University Circle, Monterey, CA ABSTRACT Coastal bathymetry near Camp
WHEN WILL YOUR MULTI-TERABYTE IMAGERY STOP REQUIRING YOU TO BUY MORE DATA STORAGE?
 PRODUCT BROCHURE WHEN WILL YOUR MULTI-TERABYTE IMAGERY STOP REQUIRING YOU TO BUY MORE DATA STORAGE? WHEN YOU START COMPRESSING IT TO HEXAGON GEOSPATIAL S ECW FORMAT 2 WHEN WILL YOUR MULTI-TERABYTE IMAGERY
University of Miami Rosenstiel School of Marine and Atmospheric Science. Billfish Research Program
 University of Miami Rosenstiel School of Marine and Atmospheric Science Billfish Research Program 2011-2013 UNIVERSITY OF MIAMI Billfish Science Laboratory: RESEARCH FOCUS Uses advanced remote sensing
Planform Observation of De-Connectivity of Old Brahmaputra Offtake in Lean Period Using Satellite Images
 Journal of Modern Science and Technology Vol. 6. No. 1. March 2018 Issue. Pp.1-9 Planform Observation of De-Connectivity of Old Brahmaputra Offtake in Lean Period Using Satellite Images Md. Safin Ahmed
Advanced PMA Capabilities for MCM
 Advanced PMA Capabilities for MCM Shorten the sensor-to-shooter timeline New sensor technology deployed on off-board underwater systems provides navies with improved imagery and data for the purposes of
Chapter 4: Google Earth Exercise
 Chapter 4: Google Earth Exercise Exercise 1 Visualizing the Three Gorges Dam Hydroelectric Project The Three Gorges Dam was the largest infrastructure project in China since the Great Wall. Completed in
The Walkability Indicator. The Walkability Indicator: A Case Study of the City of Boulder, CO. College of Architecture and Planning
 1 : A Case Study of the City of Boulder, CO College of Architecture and Planning University of Colorado Author Note: Daryoosh Ardalan, Urban Regional Planning, College of Architecture and Planning, University
THE POLARIMETRIC CHARACTERISTICS OF BOTTOM TOPOGRAPHY RELATED FEATURES ON SAR IMAGES
 THE POLARIMETRIC CHARACTERISTICS OF BOTTOM TOPOGRAPHY RELATED FEATURES ON SAR IMAGES Taerim Kim Professor, Ocean System Eng. Dept. Kunsan University Miryong Dong San 68, Kunsan, Jeonbuk, Korea, trkim@kunsan.ac.kr
Small Footprint Topo-Bathymetric LiDAR
 May 8, 2013 Small Footprint Topo-Bathymetric LiDAR PNAMP Remote Sensing Forum Russ Faux, Co-CEO, WSI Amar Nayegandhi, Manager of Elevation Technologies, Dewberry Colin Cooper, Senior Analyst, WSI Watershed
1 st Tidal and Water Level Working Group Meeting DHN, Niteroi, Brazil 31/03/09 02/04/09 Vertical Offshore Reference Framework (VORF) Chris Jones
 Chris Jones") 1 st Tidal and Water Level Working Group Meeting DHN, Niteroi, Brazil 31/03/09 02/04/09 Vertical Offshore Reference Framework (VORF) Chris Jones United Kingdom Hydrographic Office Presentation Structure
1 st Tidal and Water Level Working Group Meeting DHN, Niteroi, Brazil 31/03/09 02/04/09 Vertical Offshore Reference Framework (VORF) Chris Jones United Kingdom Hydrographic Office Presentation Structure
T&E M&S War Game Results. Jim Hazlett Director, Mission Profiling Mission Innovation Raytheon Integrated Defense Systems
 T&E M&S War Results Jim Hazlett Director, Mission Profiling Mission Innovation Raytheon Integrated Defense Systems Overview Purpose: Recent seminar war game for modeling and simulation (M&S) sponsor to
Digital Elevation Models
 Digital Elevation Models National Elevation Dataset 14-Oct-14 GEO327G/386G, UT Austin 1 Data Sets US DEM series 7.5, 30, 1 o for conterminous US 7.5, 15 for Alaska US National Elevation Data (NED) GTOPO30
Stream temperature records
 Stream temperature records 1 2 Appendix A. Temporal sequence of stream temperature records from the Boise River basin used to parameterize temperature models (n = 78). 2 16 12 8 4 3 4 1993 1994 1995 1996
Challenges in determining water surface in airborne LiDAR topobathymetry. Amar Nayegandhi, Dewberry 15 th Annual JALBTCX Workshop, June 11 th 2014
 Challenges in determining water surface in airborne LiDAR topobathymetry Amar Nayegandhi, Dewberry 15 th Annual JALBTCX Workshop, June 11 th 2014 Why topobathy LiDAR? Complements acoustic (multi-beam sonar)
Solving the problem of serving large image mosaics. Using ECW Connector and Image Web Server with ArcIMS
 Solving the problem of serving large image mosaics Using ECW Connector and Image Web Server with ArcIMS A White Paper from Earth Resource Mapping 9 April 2003 Asia Pacific Regional Office Americas Region
Survey Technique for Underwater Digital Photography with Integrated GPS Location Data
 Survey Technique for Underwater Digital Photography with Integrated GPS Location Data Tim Siwiec: United States Environmental Protection Agency Abstract This survey technique is an inexpensive method of
Cross-Country Madness: Run for Your Life
 Cross-Country Madness: Run for Your Life BY: THE MAPSTERBATORS- JHON AFRIDI, EMMA LUNDBERG, LUCAS REYES 12TH OF DECEMBER, 2014 Abstract Athletic facilities at Redwood Fields in Eureka, CA are assessed
Open Research Online The Open University s repository of research publications and other research outputs
 Open Research Online The Open University s repository of research publications and other research outputs Developing an intelligent table tennis umpiring system Conference or Workshop Item How to cite:
Monetisation of sustainable business models for Satellite Derived Bathymetry
 Monetisation of sustainable business models for Satellite Derived Bathymetry Who are we? We are a UK & UAE based company specialising in satellite derived seabed & environmental mapping products We aim
Reliable, accurate groundwater Diver dataloggers and software. Diver-Suite
 Reliable, accurate groundwater Diver dataloggers and software Diver-Suite SMART MONITORING TECHNOLOGY Diver-Suite*, from Schlumberger Water Services, provides groundwater and environmental professionals
Agile project management with scrum
 Agile project management with scrum CS 236503 Dr. Oren Mishali Based on the book Agile Project Management with Scrum Overview of the Scrum process The following slides give an overview of the Scrum process,
Contributions from a multidisciplinary university Finn Gunnar Nielsen Professor Geophysical Institute
 Workshop Floating Offshore Wind Norwegian Offshore Wind Cluster Dublin 4 th and 5 th December 2018 Contributions from a multidisciplinary university Finn Gunnar Nielsen Professor Geophysical Institute
Urban Environmental Climate Maps for Urban Planning Considering Urban Heat Island Mitigation in Hiroshima
 Academic Article Journal of Heat Island Institute International Vol. 9-2 (2014) Urban Environmental Climate Maps for Urban Planning Considering Urban Heat Island Mitigation in Hiroshima Kaoru Matsuo* 1
Analyzing Gainesville s Bicycle Infrastructure
 Mateo Van Thienen 1 DCP 2002: Intro to GIS II Final Project Paper Abstract: Analyzing Gainesville s Bicycle Infrastructure The main purpose of this project is to determine which areas within Gainesville
Diver Training Options
 MAIN INTERNET ON-SITE TAILORED PACKAGES INTER-COMPANY Diver Training Options DBI offers a menu of tailored courses Designed for users as well as IT Professionals to learn how to master the functionality
Long Beach Island Holgate Spit Little Egg Inlet Historical Evolution Introduction Longshore Transport Map, Survey and Photo Historic Sequence
 Appendix B Long Beach Island Holgate Spit Little Egg Inlet Historical Evolution Introduction The undeveloped southern end of Long Beach Island (LBI) is referred to as the Holgate spit as it adjoins the
Developing a Bike/Pedestrian Plan Using ArcInfo and Public Participation Rob Shumowsky, Madison County Council of Governments
 Developing a Bike/Pedestrian Plan Using ArcInfo and Public Participation Rob Shumowsky, Madison County Council of Governments Abstract: The Madison County Council of Governments is creating a bike/pedestrian
OPPORTUNITIES IN THE WATER & WASTEWATER SECTOR (NWC TRANSFORMATION JOURNEY)
") OPPORTUNITIES IN THE WATER & WASTEWATER SECTOR (NWC TRANSFORMATION JOURNEY) LOAY AL MUSALLAM, CEO NATIONAL WATER COMPANY JAPANESE-SAUDI BUSINESS FORUM 1 ST FEBRUARY 2012, TOKYO, JAPAN AGENDA INTRODUCTION
OPPORTUNITIES IN THE WATER & WASTEWATER SECTOR (NWC TRANSFORMATION JOURNEY) LOAY AL MUSALLAM, CEO NATIONAL WATER COMPANY JAPANESE-SAUDI BUSINESS FORUM 1 ST FEBRUARY 2012, TOKYO, JAPAN AGENDA INTRODUCTION
TomTom South African Congestion Index
 TomTom South African Congestion Index Disclaimer All copyrights, commercial rights, design rights, trademarks and other elements considered intellectual property that are published in this report are reserved
Spatial and Temporal Patterns of Pedestrian Crashes Along The Urbanization Gradient
 Spatial and Temporal Patterns of Pedestrian Crashes Along The Urbanization Gradient Tram Truong, GISP GIS-T Conference Raleigh, NC April 4-7, 2016 Acknowledgement Trung Tran, PhD, GISP Northern Kentucky
OPERATIONAL AMV PRODUCTS DERIVED WITH METEOSAT-6 RAPID SCAN DATA. Arthur de Smet. EUMETSAT, Am Kavalleriesand 31, D Darmstadt, Germany ABSTRACT
 OPERATIONAL AMV PRODUCTS DERIVED WITH METEOSAT-6 RAPID SCAN DATA Arthur de Smet EUMETSAT, Am Kavalleriesand 31, D-64295 Darmstadt, Germany ABSTRACT EUMETSAT started its Rapid Scanning Service on September
Neighborhood Influences on Use of Urban Trails
 Neighborhood Influences on Use of Urban Trails Greg Lindsey, Yuling Han, Jeff Wilson Center for Urban Policy and the Environment Indiana University Purdue University Indianapolis Objectives Present new
Impact of the tides, wind and shelf circulation on the Gironde river plume dynamics
 Impact of the tides, wind and shelf circulation on the Gironde river plume dynamics F. Toublanc 1, N. Ayoub 2, P. Marsaleix 3, P. De Mey 2 1 CNES/LEGOS 2 CNRS/LEGOS 3 CNRS/LA, Toulouse, France 5th GODAE
D-Case Modeling Guide for Target System
 D-Case Modeling Guide for Target System 1/32 Table of Contents 1 Scope...4 2 Overview of D-Case and SysML Modeling Guide...4 2.1 Background and Purpose...4 2.2 Target System of Modeling Guide...5 2.3 Constitution
Wind Atlas for the Gulf of Suez Satellite Imagery and Analyses
 Downloaded from orbit.dtu.dk on: Nov 09, 2017 Wind Atlas for the Gulf of Suez Satellite Imagery and Analyses Hasager, Charlotte Bay Publication date: 2003 Document Version Publisher's PDF, also known as
RIVET Satellite Remote Sensing and Small Scale Wave Process Analysis
 DISTRIBUTION STATEMENT A. Approved for public release; distribution is unlimited. RIVET Satellite Remote Sensing and Small Scale Wave Process Analysis Hans C. Graber RSMAS Department of Ocean Sciences
CHAPTER 8 ASSESSMENT OF COASTAL VULNERABILITY INDEX
 124 CHAPTER 8 ASSESSMENT OF COASTAL VULNERABILITY INDEX 8.1 INTRODUCTION In order to assess the vulnerability of the shoreline considered under this study against the changing environmental conditions,
UAV-based monitoring of pedestrian groups
 UAV-based monitoring of pedestrian groups Florian Burkert, Friedrich Fraundorfer Technische Universität München, 04.09.2013, UAV-g 2013, Rostock 1 Motivation 2 Overview State of the art UAV imagery for
Video-Based Mapping of Oyster Bottom in the Upper Piscataqua River, Sturgeon Creek, and Spruce Creek
 University of New Hampshire University of New Hampshire Scholars' Repository PREP Reports & Publications Institute for the Study of Earth, Oceans, and Space (EOS) 1-21-2009 Video-Based Mapping of Oyster
DIGITAL MAPPING FOR CORAL REEF IN BINTANGOR ISLAND, WEST SUMATRA PROVINCE, INDONESIA
 DIGITAL MAPPING FOR CORAL REEF IN BINTANGOR ISLAND, WEST SUMATRA PROVINCE, INDONESIA Sri Yudawati CAHYARINI Research and Development Center for Geotechnology, Indonesian Institute of Sciences, Komplek
Smart-Walk: An Intelligent Physiological Monitoring System for Smart Families
 Smart-Walk: An Intelligent Physiological Monitoring System for Smart Families P. Sundaravadivel 1, S. P. Mohanty 2, E. Kougianos 3, V. P. Yanambaka 4, and M. K. Ganapathiraju 5 University of North Texas,
Hydrographic Surveying at The Port of London
 Hydrographic Surveying at The Port of London John Dillon-Leetch Port and Terminal Technology 2009 14 th October, Antwerp Overview Introduction Surveying the Thames Navigational Charting High Resolution
Application Note AN-107
 SPEC Sensor TM Characterization & Calibration Considerations Scope This document is provided to describe the considerations needed to characterize, calibrate, verify and validate the measurement performance
High Definition Laser Scanning (HDS) Underwater Acoustic Imaging and Profiling
 Underwater Acoustic Imaging and Profiling") High Definition Laser Scanning (HDS) Underwater Acoustic Imaging and Profiling Images at Depth: The Use of Acoustic Imaging on Large River Crossings A Case Study AGENDA Background of project Review of
High Definition Laser Scanning (HDS) Underwater Acoustic Imaging and Profiling Images at Depth: The Use of Acoustic Imaging on Large River Crossings A Case Study AGENDA Background of project Review of
Pass Appearance Time and pass attempts by teams qualifying for the second stage of FIFA World Cup 2010 in South Africa
 Technical Report : Game Analysis Pass Appearance Time and passes attempts in FIFA South African World Cup Pass Appearance Time and pass attempts by teams qualifying for the second stage of FIFA World Cup
Currents measurements in the coast of Montevideo, Uruguay
 Currents measurements in the coast of Montevideo, Uruguay M. Fossati, D. Bellón, E. Lorenzo & I. Piedra-Cueva Fluid Mechanics and Environmental Engineering Institute (IMFIA), School of Engineering, Research
INFLUENCE OF MEASURING PROCESS AUTOMATION ON UNCERTAINTY OF MASS STANDARD AND WEIGHTS CALIBRATION.
 Andrzej Hantz RADWAG BALANCES AND SCALES INFLUENCE OF MEASURING PROCESS AUTOMATION ON UNCERTAINTY OF MASS STANDARD AND WEIGHTS CALIBRATION. The article presents the influence of comparison process automatization
Cork to Limerick Route Pre-Feasibility Study Update
 Cork to Limerick Route Pre-Feasibility Study Update November 2008 Document Title: Cork to Limerick Route Pre-Feasibility Study Update Document Ref(s). : Date Rev Status Originator Checked Approved 01/12/08
SENSOR SYNERGY OF ACTIVE AND PASSIVE MICROWAVE INSTRUMENTS FOR OBSERVATIONS OF MARINE SURFACE WINDS
 SENSOR SYNERGY OF ACTIVE AND PASSIVE MICROWAVE INSTRUMENTS FOR OBSERVATIONS OF MARINE SURFACE WINDS N. Ebuchi Institute of Low Temperature Science, Hokkaido University, N19-W8, Kita-ku, Sapporo 060-0819,
Image compression: ER Mapper 6.0 ECW v2.0 versus MrSID 1.3
 Image compression: ER Mapper 6.0 ECW v2.0 versus MrSID 1.3 With massive file sizes for digital imagery now commonplace, compression is a natural choice to shrink 100 s of GB of imagery down to a manageable
Advanced Test Equipment Rentals ATEC (2832) OMS 600
 OMS 600") Established 1981 Advanced Test Equipment Rentals www.atecorp.com 800-404-ATEC (2832) OMS 600 Continuous partial discharge monitoring system for power generators and electrical motors Condition monitoring
Established 1981 Advanced Test Equipment Rentals www.atecorp.com 800-404-ATEC (2832) OMS 600 Continuous partial discharge monitoring system for power generators and electrical motors Condition monitoring
Training with Hockey IntelliGym
 Training with Hockey IntelliGym Presented by: Kevin McLaughlin, Senior Director of Hockey Development, USA Hockey Danny Dankner, CEO, Applied Cognitive Engineering (ACE) Training Hockey Sense The Big Picture
ADOT Statewide Bicycle and Pedestrian Program Summary of Phase IV Activities APPENDIX B PEDESTRIAN DEMAND INDEX
 ADOT Statewide Bicycle and Pedestrian Program Summary of Activities APPENDIX B PEDESTRIAN DEMAND INDEX May 24, 2009 Pedestrian Demand Index for State Highway Facilities Revised: May 29, 2007 Introduction
Walking up Scenic Hills: Towards a GIS Based Typology of Crowd Sourced Walking Routes
 Walking up Scenic Hills: Towards a GIS Based Typology of Crowd Sourced Walking Routes Liam Bratley 1, Alex D. Singleton 2, Chris Brunsdon 3 1 Department of Geography and Planning, School of Environmental
Oceanographic Research With The LiquID Station
 Oceanographic Research With The LiquID Station Application Note OCEANOGRAPHIC RESEARCH The field of oceanography relies on knowing the precise physical, chemical, and biological state of seawater at different
Vermont Rail conversion/feasibility Study
 Vermont Rail conversion/feasibility Study Stakeholder Meetings May 2018 Welcome https://www.youtube.com/watch?v=jcg3cjutk80 Purpose of Tonight s Meeting > Provide a study overview > Solicit feedback and
Road Data Input System using Digital Map in Roadtraffic
 Data Input System using Digital Map in traffic Simulation Namekawa,M 1., N.Aoyagi 2, Y.Ueda 2 and A.Satoh 2 1 College of Management and Economics, Kaetsu University, Tokyo, JAPAN 2 Faculty of Engineering,
Chapter 5 FUNCTIONAL CLASSIFICATION
 Chapter 5 FUNCTIONAL CLASSIFICATION Functional classification is a system by which streets and roadways may be distinguished by types according to their function within the entire transportation network.
RUNNING LOADS IN DECATHLON TRAINING
 RUNNING LOADS IN DECATHLON TRAINING By S. Shelkov and N. Semikolenov The organization of running training in the decathlon appears to have a considerable influence on the total score. In the following
CYCLING TRACK SALES CONSULTING
 CYCLING TRACK SALES CONSULTING Overview The diversity of events in Cycling Track makes the sport one of the most complex for timekeeping. Quite different timing methods are required for the various types
Look Twice! Inventorying Pavement Markings for the City of Austin. Our story of how we accomplished data inventory of our city crosswalks.
 Look Twice! Inventorying Pavement Markings for the City of Austin. Our story of how we accomplished data inventory of our city crosswalks. City of Austin Austin Transportation Department Signs & Markings
Ocean Wave Forecasting
 Ocean Wave Forecasting Jean-Raymond Bidlot* Marine Prediction Section Predictability Division of the Research Department European Centre for Medium-range Weather Forecasts (E.C.M.W.F.) Reading, UK * With
An Application of Signal Detection Theory for Understanding Driver Behavior at Highway-Rail Grade Crossings
 An Application of Signal Detection Theory for Understanding Driver Behavior at Highway-Rail Grade Crossings Michelle Yeh and Jordan Multer United States Department of Transportation Volpe National Transportation
SUPPLEMENTARY INFORMATION
 SUPPLEMENTARY INFORMATION Spatially variable response of Himalayan glaciers to climate change affected by debris cover Dirk Scherler 1 *, Bodo Bookhagen 2, Manfred R. Strecker 1 1 Institute of Earth and
Mining and Agricultural Productivity
 Mining and Agricultural Productivity - A presentation of preliminary results for Ghana The World Bank, Washington D.C., USA, 29 May 214 MAGNUS ANDERSSON, Senior Lecturer in Human Geography, Lund University,
An Atlas of Oceanic Internal Solitary Waves (February 2004) by Global Ocean Associates Prepared for Office of Naval Research Code 322 PO
 by Global Ocean Associates Prepared for Office of Naval Research Code 322 PO") Overview The is located in the North Atlantic Ocean between southern Ireland and southwest England (Figure 1). The Sea s western edge covers a continental shelf region characterized by rough and irregular
Overview The is located in the North Atlantic Ocean between southern Ireland and southwest England (Figure 1). The Sea s western edge covers a continental shelf region characterized by rough and irregular
Summary Report for Individual Task Select Landing Zone (LZ)/Pick-up Zone (PZ)/Holding Area (HA) (OH-58A/C) Status: Approved
/Pick-up Zone (PZ)/Holding Area (HA) (OH-58A/C) Status: Approved") Summary Report for Individual Task 011-228-2067 Select Landing Zone (LZ)/Pick-up Zone (PZ)/Holding Area (HA) (OH-58A/C) Status: Approved Report Date: 03 Nov 2014 Distribution Restriction: Approved for
Summary Report for Individual Task 011-228-2067 Select Landing Zone (LZ)/Pick-up Zone (PZ)/Holding Area (HA) (OH-58A/C) Status: Approved Report Date: 03 Nov 2014 Distribution Restriction: Approved for
Feasibility Analysis of China s Traffic Congestion Charge Legislation
 International Conference on Social Science and Technology Education (ICSSTE 2015) Feasibility Analysis of China s Traffic Congestion Charge Legislation Wang Jiyun Beijing Jiaotong University Law School
Status report on the current and future satellite systems by CMA. Presented to CGMS45-CMA-WP-01, Plenary session, agenda item D.1
 Status report on the current and future satellite systems by CMA Presented to CGMS45-CMA-WP-01, Plenary session, agenda item D.1 Overview - Planning of CMA satellite systems FengYun Meteorological Satellites
Bathymetry User Needs and Challenges in Australia and New Zealand
 Bathymetry User Needs and Challenges in Australia and New Zealand Nathan Quadros nquadros@crcsi.com.au Shallow Water Survey February 212 Background Recent significant investment in Bathymetric LiDAR acquisition
Analysis of Run-Off-Road Crashes in Relation to Roadway Features and Driver Behavior
 Analysis of Run-Off-Road Crashes in Relation to Roadway Features and Driver Behavior Ertan Örnek University of Wisconsin, Madison Traffic Operations Lab 141 NW Barstow Street Waukesha, WI 53187 ornek@wisc.edu
Living Streets response to the Draft London Plan
 Living Streets response to the Draft London Plan Contents Living Streets response to the Draft London Plan... 1 About Living Streets... 2 Summary... 2 Consultation response... 3 Chapter 1: Planning London
Reply of Guyana Annex R2
 Summary of Findings: Analysis of Recent Shoreline Revisions to the This report assesses recent shoreline changes made to the 2005 edition of Dutch nautical chart NL 2218. This new edition is credited jointly
Investigating Commute Mode and Route Choice Variability in Jakarta using multi-day GPS Data
 Investigating Commute Mode and Route Choice Variability in Jakarta using multi-day GPS Data Zainal N. Arifin Kay W. Axhausen Conference paper STRC 2011 Investigating Commute Mode and Route Choice Variability
2018 ICEE ICFA ANNUAL CONFERENCE
 November 11-17, 2018 la Caixa Foundation Madrid Barcelona CALL FOR PAPERS March-April 2018 2018 ICEE ICFA ANNUAL CONFERENCE www.exhibitionexchange.com Cultural Heritage: Transition and Transformation 2018
A Walkability Study for Downtown Brunswick
 Alex Thompson and Sam Vitello E.S. 204 Semester Project-Final Paper A Walkability Study for Downtown Brunswick Introduction and Problem Statement The goal of our project was to analyze parking availability
ERS-1/2 Scatterometer new products: mission reprocessing and data quality improvement
 ERS-1/2 Scatterometer new products: mission reprocessing and data quality improvement Giovanna De Chiara (1), Raffaele Crapolicchio (1), Pascal Lecomte (2) (1) Serco SpA Via Sciadonna 22-24 Frascati (Roma),
US 69 RELIEF ROUTE STUDY
 US 69 RELIEF ROUTE STUDY Jacksonville, Texas PUBLIC MEETING #2 May 29 th, 2018 Welcome to the public meeting for the US 69 Relief Route Study in Jacksonville. This is the second public meeting for this
Validation of Measurements from a ZephIR Lidar
 Validation of Measurements from a ZephIR Lidar Peter Argyle, Simon Watson CREST, Loughborough University, Loughborough, United Kingdom p.argyle@lboro.ac.uk INTRODUCTION Wind farm construction projects
MATRIX-MG Series. Innovation with Integrity. Automated High-Performance Gas Analyzers FT-IR
 MATRIX-MG Series Automated High-Performance Gas Analyzers Innovation with Integrity FT-IR The MATRIX-MG Series comprises three high-performance FT-IR gas analyzers in a compact and rugged housing. They
Transportation Master Plan Advisory Task Force
 Transportation Master Plan Advisory Task Force Network Alternatives & Phasing Strategy February 2016 BACKGROUND Table of Contents BACKGROUND Purpose & Introduction 2 Linking the TMP to Key Council Approved
Spatial Analysis of Bicycle and Pedestrian Collisions and Factors Corina Chung, MS Epidemiologist Jessica Garner Community Health Planner
 Spatial Analysis of Bicycle and Pedestrian Collisions and Factors Corina Chung, MS Epidemiologist Jessica Garner Community Health Planner Get Healthy San Mateo County (GHSMC): A Local Collaborative Building
THE CHALLENGES OF A LARGE-AREA BATHYMETRIC SURVEY
 THE CHALLENGES OF A LARGE-AREA BATHYMETRIC SURVEY Agenda: - Introduction - Tender - Project Planning - Survey - Processing - Delivery - Conclusion 2 Introduction We know less of the oceans at our feet,
For IEC use only. Technical Committee TC3: Information structures, documentation and graphical symbols
 For IEC use only 3/686/INF 2003-08 INTERNATIONAL ELECTROTECHNICAL COMMISSION Technical Committee TC3: Information structures, documentation and graphical symbols Labels to be used in database standards
Reef Ecology and Fisheries Anal ysis in Diani Diani--Chale, southern Kenya: Chale, southern Kenya: A G IS GIS & RDBMS application
 Reef Ecology and Fisheries Analysis in Diani-Chale, southern Kenya: A GIS & RDBMS application Jelvas Mwaura 4 th. Symposium on GIS/Spatial analysis in Fisheries Sciences and Management Nearshore reef fishery
Proposal to the African Elephant Fund
 Proposal to the African Elephant Fund 1.1 Country: KENYA 1.2 Project Title: Developing drought mitigation measures for elephants in Tsavo by understanding long-term elephant distribution and mortality
Title: 4-Way-Stop Wait-Time Prediction Group members (1): David Held
: David Held") Title: 4-Way-Stop Wait-Time Prediction Group members (1): David Held As part of my research in Sebastian Thrun's autonomous driving team, my goal is to predict the wait-time for a car at a 4-way intersection.
Title: 4-Way-Stop Wait-Time Prediction Group members (1): David Held As part of my research in Sebastian Thrun's autonomous driving team, my goal is to predict the wait-time for a car at a 4-way intersection.
SCIENTIFIC COMMITTEE SEVENTH REGULAR SESSION August 2011 Pohnpei, Federated States of Micronesia
 SCIENTIFIC COMMITTEE SEVENTH REGULAR SESSION 9-17 August 2011 Pohnpei, Federated States of Micronesia CPUE of skipjack for the Japanese offshore pole and line using GPS and catch data WCPFC-SC7-2011/SA-WP-09
Cricket Visualization Tool
 CS675 Project Cricket Visualization Tool Muralidharan Dhanakoti 1. Abstract Mitigated by rapid advances in ball tracking systems, cricket visualization systems have emerged as an indispensable tool for
Grip on speed. A multi-stakeholder approach to road safety
 Grip on speed A multi-stakeholder approach to road safety Authors: Erik Donkers VIA, traffic consultancy & software, The Netherlands Berry de Jong SRE (Eindhoven Urban Region), The Netherlands Polis Conference
IMPROVED OIL SLICK IDENTIFICATION USING CMOD5 MODEL FOR WIND SPEED EVALUATION ON SAR IMAGES
 IMPROVED OIL SLICK IDENTIFICATION USING CMOD5 MODEL FOR WIND SPEED EVALUATION ON SAR IMAGES H.KHENOUCHI & Y. SMARA University of Sciences and Technology Houari Boumediene (USTHB). Faculty of Electronics
WildCat RF unit (0.5W), full 32-byte transmissions with built-in checksum
, full 32-byte transmissions with built-in checksum") Overview of SMRU series 9000 SRDL satellite tags Basic tag construction and function Housing: Standard sensors: Optional sensor: normal solid epoxy body rated to 500m, reinforced 2000m pressure (resolution
Overview of SMRU series 9000 SRDL satellite tags Basic tag construction and function Housing: Standard sensors: Optional sensor: normal solid epoxy body rated to 500m, reinforced 2000m pressure (resolution
July 2007, Number 46 ALL-WAYS TM NEWSLETTER
 July 2007, Number 46 ALL-WAYS TM NEWSLETTER ALL-Ways Multi-Level Software Level ONE and Level TWO Recap Level THREE: Analysis and Control Handicapping Process Series Part 5: Feedback Inside This Newsletter
El Niño climate disturbance in northern Madagascar and in the Comoros
 El Niño climate disturbance in northern Madagascar and in the Comoros Rabeharisoa J. M.¹, Ratiarison A.¹, Rakotovao N.¹, Salim Ahmed Ali¹ ² (*) ¹ Laboratoire de Dynamique de l Atmosphère, du Climat et
Section 3: Atmospheric Circulation
 Section 3: Atmospheric Circulation Preview Key Ideas The Coriolis Effect Global Winds Local Winds Maps in Action Key Ideas Explain the Coriolis effect. Describe the global patterns of air circulation,
One Day Meetings. Road to improved TV Product
 One Day Meetings Road to improved TV Product Index 1. Starting Point 2. Examples from other sports 3. Potential Media Strategy 4. Potential Competition improvements 5. Top Down Support 6. Bottom up Build
EFFICIENCY OF TRIPLE LEFT-TURN LANES AT SIGNALIZED INTERSECTIONS
 EFFICIENCY OF TRIPLE LEFT-TURN LANES AT SIGNALIZED INTERSECTIONS Khaled Shaaban, Ph.D., P.E., PTOE (a) (a) Assistant Professor, Department of Civil Engineering, Qatar University (a) kshaaban@qu.edu.qa