Foreign overnight stays 31% Domestic overnight stays 69% 8.3 MILLION FOREIGN VISITORS IN FINLAND IN 2017
|
|
|
- Clarissa Barrett
- 5 years ago
- Views:
Transcription

1

 OF FOREIGN VISITORS IN 2017: 21.")


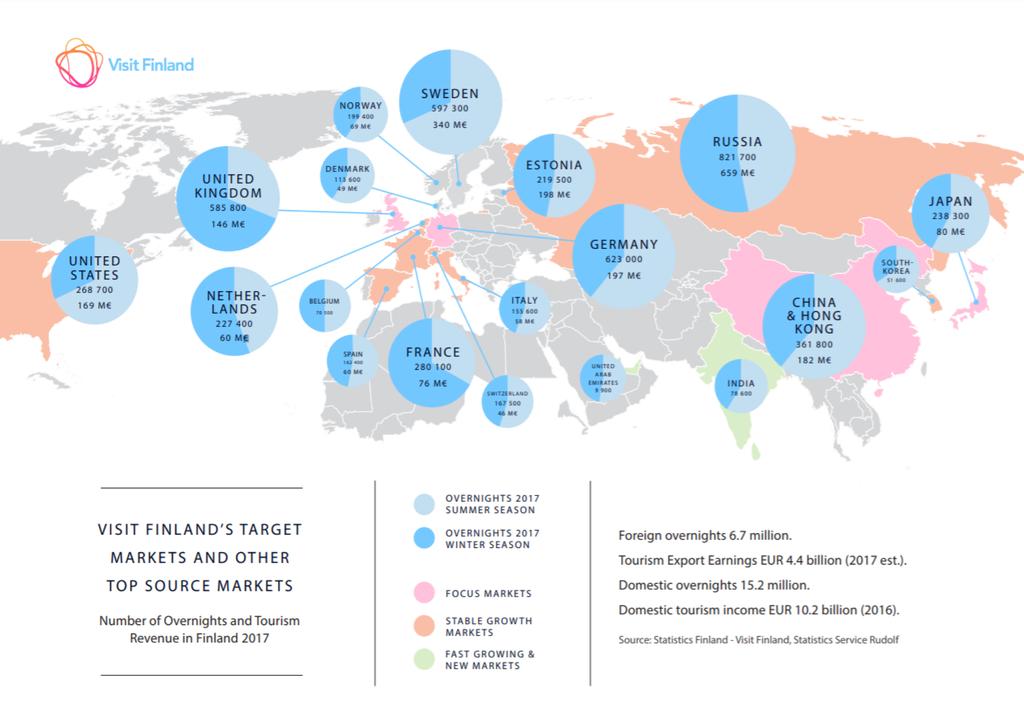
2 TOURISM IS A GROWING SOURCE OF EXPORT REVENUE AND A SIGNIFICANT EMPLOYMENT PROVIDER IN FINLAND TOURISM HAS A MULTIPLIER EFFECT ON OTHER SECTORS. 1 EURO IN TOURISM ADDS 56 CENTS VALUE TO THE OTHER SECTORS. OVERNIGHT STAYS (6.7 MILLION) OF FOREIGN VISITORS IN 2017: 21.9 MILLION OVERNIGHT STAYS AT FINNISH ACCOMMODATION Russia 12% America 6% Other countries 13% EU-28 53% Foreign overnight stays 3 Asia Domestic overnight stays MILLION FOREIGN VISITORS IN FINLAND IN 2017 SPENDING PER VISIT IN China EUR 1, Spain EUR Belgium EUR France EUR India EUR USA EUR South Korea EUR Japan EUR Australia EUR Canada EUR 516 BREAKDOWN OF CONSUMPTION BY FOREIGN VISITORS IN 2017 Other countries 33% Russia 24% Japan 3% Estonia 4% UK 4% China 17% Sweden 8% Germany 6% Source Visit Finland Statistics, Statistics Finland
3
 18 billion EUR Spending per trip Spanish visitor rankings in Finland 754 No.")
4 Market Volume Population 47 million people Outbound travel from Spain: 25 million arrivals to all destinations in compared to > Europe s share of Spanish outbound travel is 77% -> Finland s share of Spanish outbound travel is: 0,4% Travel expenditure (total outbound travel from Spain) 18 billion EUR Spending per trip Spanish visitor rankings in Finland 754 No. 13 in overnights in 2017 ( , +2) No. 11 in travel receipts in 2017 ( 60 million, +) Share of overnights by regions % 12% 10% 32% Arrivals Forecast for Global Spanish Outbound Travel and Expenditure in foreign countries % 8 % 6 % 4 % Spanish overnights in Finland % 11 % 9 % 5 % EUR (billions) 0 % 2 % 0 % Sources: Visit Finland Statistics Service Rudolf, Statistics Finland Visit Finland Visitor Survey % 18 % 4 % 4 % 29 % 4 % Arrivals (000s) Source UNWTO/IMF Balance of Payments % 30 % 25 % 20 % 15 % 10 % 5 % EUR (Billion)
 Summer (May-Oct): 78 900 (+2) 60 000 Spain 50 000 40 000")
 Spring season (03-05) 3% High")

5 Spanish overnights in Finland 2017 Winter (Nov-Apr): (+26%) Summer (May-Oct): (+2) Spain % High winter season (12-02) Spring season (03-05) 3% High summer season (06-08) Autumn season (09-11) 2% 2% 34% 3% 4% 3% 64% 2% Sources: Visit Finland Statistics Service Rudolf, Statistics Finland

 53 300 + Autumn (Sep-Nov) 28 900")


6 Spanish overnights in Finland Seasonal overnights in 2017 Year 2017 Whole Finland Actual seasonal change vs Winter (Dec-Feb) Spring (Mar-May) % Summer (Jun-Aug) Autumn (Sep-Nov) % Rovaniemi 38% Kuusamo Inari/Saariselkä 14% Salla 10% Muonio 6% Spanish overnights in Finland by season in 2017 Turku 23% Oulu 1 Pudasjärvi/Syöte 1 Pori 7% Vaasa Uusimaa (excl. greater Helsinki area) 1 Tampere 20% Savonlinna Jyväskylä 12% Mikkeli 8% Lappeenranta Kuopio reg. Helsinki 7 Vantaa 1 Espoo 10% Source: Rudolf data base, Statistics Finland
7 Spanish visitors in Finland Spanish overnights in Finland by month Spanish overnights by monthly change % % % % 40 % 20 % 0 % -20 % % 0 January February March April May June July August September October November December -60 % January February March April May June July August September October November December Sources: Visit Finland Statistics Service Rudolf, Statistics Finland


8 Spain - Yearly overnights in the Nordic countries Nordic countries' share of Spanish overnights 2017 Development of Spanish overnights Sweden % Iceland % Norway % Denmark % Finland % Denmark Finland Norway Sweden Iceland Spanish overnights, change % Change 2017/16 Average annual change % 1 8% 12% 4% 4% 3% Denmark Finland Norway Sweden Iceland

9 Spain - Seasonal overnights in the Nordic countries Spanish overnights in the Nordic countries, winter season (Dec-Apr) Spanish overnights in the Nordic countries, summer season (Jun-Aug) Denmark Finland Norway Sweden Denmark Finland Norway Sweden Corresponding seasonal overnights not available for Iceland Change of Spanish overnights by season 2017/16 Winter (Dec-Apr) Summer (Jun-Aug) 26% 22% 14% 1 1 Denmark Finland Norway Sweden 9
 Extended family (with family members")


10 Spanish visitors in Winter (Nov-April) Immediate family (household with kids) Extended family (with family members outside the PURPOSE OF TRAVEL Transit 2 % Business trip 10 % Study or training 17 % Visiting friends or relatives 27 % TRAVEL COMPANY Alone Spouse/Partner only Group of friends Other company 10% Other reason 2 % Holiday trip 42 % 26% 38% 6 days or more 54 % A Spanish traveler spends on average 664 per trip during winter. 36% Duration 27% 1 day 6 % 2 days 15 % 4-5 days 21 % Age group 2 3 days 4 % 10% 2% 4% over 64 Camping area, hostel or rented cottage 10 % Rental flat (incl. Airbnb) 15 % Accommodation Other 9 % Friends or relatives 28 % Hotel or motel 38 % Spanish visitors activities and interests, Winter (Nov-April) Experienced during the trip Buildings, castles, monuments, Walking, hiking, camping in nature Finnish sauna Finnish culinary experiences Other winter activities and experiences National parks Cultural events Other outdoor activities Winter sports Concerts and music festivals Finnish summer cottages Sport events Family destinations Biking, mountaing biking Wellness services and treatments Interested but did not experience during the trip Shopping 17% 2 14% 1 26% % 8% 50% 42% 4 2 7% 56% 22% 10% 22% 38% % 1 Note: the figures on this slide are not definite but directional figures. Winter N=127 Source: VF Visitor Survey 2017


 18 % Camping area, hostel or rented cottage 20 % Other 5 % 2%")


11 Spanish visitors in Summer (May-Oct) Transit 5 % Business trip 6 % Study or training 14 % Visiting friends or relatives 18 % Immediate family (household with kids) Extended family (with family members outside the PURPOSE OF TRAVEL Holiday trip 56 % TRAVEL COMPANY Alone Group of friends Spouse/Partner only Other company 7% 2 20% 1 Other reason 1 % 3 6 days or more 40 % A Spanish traveler spends on average 916 per trip during summer. 30% Duration 4-5 days 21 % 1 day 14 % 2 2 days 11 % 3 days 14 % Age group 13% Accommodation Rental flat (incl. Airbnb) 18 % Camping area, hostel or rented cottage 20 % Other 5 % 2% over 64 Hotel or motel 34 % Friends or relatives 23 % Spanish visitors activities and interests, Summer (May-Oct) Experienced during the trip Buildings, castles, monuments, museums Finnish sauna National parks Finnish culinary experiences Other winter activities and experiences Walking, hiking, camping in nature Cultural events Other outdoor activities Winter sports Concerts and music festivals Family destinations Finnish summer cottages Sport events Biking, mountaing biking Wellness services and treatments Interested but did not experience during the trip Shopping 6% 4% 13% 3% 2% 26% 20% 2 33% 26% 8% 47% 46% 48% 44% 10% 6% 67% 48% 17% 27% 6% 13% 4% 14% Note: the figures on this slide are not definite but directional figures. Summer N= 109 Source: VF Visitor Survey 2017
Germany. M A R K E T R E V I E W German Visitors in Finland Statistical Trends and Profile
 Germany M A R K E T R E V I E W 2 0 1 6 German Visitors in Finland Statistical Trends and Profile VOLUME OF GERMAN OUTBOUND TRAVEL AND IMPACT FOR FINLAND Population 80,6 million people Outbound travel
Germany, Switzerland & Austria Market Report November 2018
 Germany, Switzerland & Austria Market Report November 2018 Visit Finland Country Representative Jyrki Oksanen Semiannual Report Germany, Switzerland & Austria Summer season 2018 and outlook for winter
Foreign overnights in the Nordic countries 2015
 Foreign overnights in the Nordic countries 2015 Sources: Statistics Statistics Statistics Statistics July 2016 VISIT FINLAND STATISTICS Contents Foreign overnights in the Nordic countries.4 Overnights
FINAL REPORT for Sports Tourism Report For the Year 2013
 FINAL REPORT for Sports Tourism Report For the Year 2013 Prepared for The Cyprus Tourism Orgaization September 201 CONTENTS Page 1. Main Findings 2 2. Appointment and Methodology 3. General Indicators:
South Korea Market Report
 Visit Finland South Korea South Korea Market Report Jani Toivanen November 2017 8.11.2017 Semiannual Report SOUTH KOREA Summer season 2017 and outlook for winter 2017-2018 CONTENTS What factors have affected
TEGMA Fall Transportation Symposium
 TEGMA 2017 Fall Transportation Symposium John Wilson Senior Vice President Dairy industry trends 1997 1998 1999 2000 2001 2002 2003 2004 2005 2006 2007 2008 2009 2010 2011 2012 2013 2014 2015 2016 Million
China Market Report November 2018
 China Market Report November 2018 Visit Finland Country Representative Lia Lin, Lisa Li, Aster Lai and David Wu Semiannual Report CHINA Summer season 2018 and outlook for winter 2018-19 CONTENTS Factors
AREA TOTALS OECD Composite Leading Indicators. OECD Total. OECD + Major 6 Non Member Countries. Major Five Asia. Major Seven.
 Reference series Composite leading indicators OECD Composite Leading Indicators AREA TOTALS 7-03- 19 OECD Total 19 OECD + Major 6 Non Member Countries 19 Major Seven 19 Major Five Asia 19 Euro area 19
Stockholm s tourism industry. November 2016
 Stockholm s tourism dustry. November 2016 Durg the month of November ca 1.1 million guest were recorded at commercial accommodations the county of Stockholm. This was an crease of 5 compared to November
Stockholm s tourism industry. December 2016
 Stockholm s tourism dustry. December 2016 Durg the month of December ca 0.9 million guest were recorded at commercial accommodations the county of Stockholm. This was an crease of 12 compared to December
THE ICELANDIC ECONOMY AN IMPRESSIVE RECOVERY BUT WHAT CHALLENGES LIE AHEAD?
 THE ICELANDIC ECONOMY AN IMPRESSIVE RECOVERY BUT WHAT CHALLENGES LIE AHEAD? FROM BUST TO BOOM. AN EPIC BUST After 16 years of growth with a short pause for breath in 2002, the Icelandic economy entered
Finland s sawmilling industry
 Finland s sawmilling industry Howard Sidney-Wilmot Stora Enso - Sales Director UK, Ireland & Benelux September 2015 Stora Enso Wood Products 13/10/2015 1 Finland s forest products 19bn total value 11bn
Japanese Market Potential
 Growth Strategy (announced on 14 June 2013) : Japan is BACK. Overall Target: 2% Real GDP Growth in the next 10 years JPY1.5 million Increase of GNI/capita after 10 years Unleash the Potential of Private
OCEAN2012 Fish Dependence Day - UK
 OCEAN2012 Fish Dependence Day - UK Europeans are now so dependent on fish products originating from external waters that half the fish they consume are sourced outside the EU Fish dependence: The EU s
The international. ski market
 LV/18/05/2014 Abstract The international ski market Presentation to ISIA Congress 17 May 2014 - Vuokatti Market metrics Skier : one person practising ski, snowboard or other downhill slide, independent
Big data analytics for enrichment of rural area content tourism in Okhotsk sub-prefecture of Japan
 Big data analytics for enrichment of rural area content tourism in Okhotsk sub-prefecture of Japan Ali Bakdur, Fumito Masui, Michal Ptaszynski Kitami Institute of Technology, Dept. of Computer Science,
OECD employment rate increases to 68.4% in the third quarter of 2018
 Paris, 17th January 2019 News Release: 3rd Quarter 2018 OECD employment rate increases to 68.4% in the third quarter of 2018 The OECD area employment rate the share of the working-age population with jobs
German Machine Tool Industry - Key Figures
 German Machine Tool Industry - Key Figures Mill. EUR %-Change 1-2Q 1-2Q 1-2Q 2014 2015 2016 2017 2017 2018 2016 2017 2018 Production total 14.486 15.087 15.007 16.006 7.062 7.820-1 +7 +11 Metal working
Key Figures and Trends for the Agricultural Machinery Industry
 Key Figures and Trends for the Agricultural Machinery Industry Update: November 2015 (monthly) Contact: Philip Nonnenmacher VDMA Agricultural Machinery Association philip.nonnenmacher@vdma.org Subject
The markets for Australian wool. Mr Chris Wilcox Chief Economist, The Woolmark Company
 The markets for Australian wool Mr Chris Wilcox Chief Economist, The Woolmark Company Agenda 1. Prices 2. Fibre supply trends 3. Regional shifts in wool textile production 4. Wool end uses and retail trends
COMPARISON OF FIXED & VARIABLE RATES (25 YEARS) CHARTERED BANK ADMINISTERED INTEREST RATES - PRIME BUSINESS*
 CHARTERED BANK ADMINISTERED INTEREST RATES - PRIME BUSINESS*") COMPARISON OF FIXED & VARIABLE RATES (25 YEARS) Fixed Rates Variable Rates FIXED RATES OF THE PAST 25 YEARS AVERAGE RESIDENTIAL MORTGAGE LENDING RATE - 5 YEAR* (Per cent) Year Jan Feb Mar Apr May Jun Jul
COMPARISON OF FIXED & VARIABLE RATES (25 YEARS) Fixed Rates Variable Rates FIXED RATES OF THE PAST 25 YEARS AVERAGE RESIDENTIAL MORTGAGE LENDING RATE - 5 YEAR* (Per cent) Year Jan Feb Mar Apr May Jun Jul
Market Insights. June 30, 2018
 June 30, 2018 Economic Overview 2 Global & Regional Growth Forecasts IMF GDP Forecasts (% change YoY) 2010 2011 2012 2013 2014 2015 2016 2017 2018 Advanced Economies 1.7% 1.2% 1.3% 2.1% 2.3% 1.7% 2.3%
Market Insights. March 29, 2019
 March 29, 2019 Economic Overview 2 Global & Regional Growth Forecasts IMF GDP Forecasts (% change YoY) 2010 2011 2012 2013 2014 2015 2016 2017 2018 Advanced Economies 1.2% 1.4% 2.1% 2.3% 1.7% 2.4% 2.3%
Global Containerboard Outlook
 Global Containerboard Outlook European Conference March 2018 Gleb Sinavskis Economist, European Paper Packaging Copyright 2018 RISI, Inc. Proprietary Information Gleb Sinavskis Economist, European Paper
Some Facts About Output
 Some Facts About Output GNP as a Percentage of GDP in 2009 Country % Kuwait 110,38 United Kingdom 102 Japan 103,14 United States 99,24 China 100,87 Germany 101,41 Mexico 98,34 Poland 96,76 Ireland 81,19
Lithuanian export: is it time to prepare for changes? Aleksandr Izgorodin Expert
 Lithuanian export: is it time to prepare for changes? Aleksandr Izgorodin Expert Export is the main locomotive behind growth in LT economy Lithuania: change in real GDP and its components, % 78,2 71,8
The Golf Related Products Produced by IAR Team Focus Technology Co., Ltd.
 The Golf Related Products 2012.12 Produced by IAR Team Focus Technology Co., Ltd. Contents 1. The Current Export Situation of China Golf Related Products At 2012...3 1.1. The Export Analysis of Chinese
TABLE 1: NET OFFICIAL DEVELOPMENT ASSISTANCE FROM DAC AND OTHER DONORS IN 2012 Preliminary data for 2012
 TABLE 1: NET OFFICIAL DEVELOPMENT ASSISTANCE FROM DAC AND OTHER DONORS IN 2012 DAC countries: 2012 2011 2012 ODA ODA/GNI ODA ODA/GNI ODA Percent change USD million % USD million % USD million (1) 2011
Commemorative Books Coverage List
 Commemorative Books Coverage List England International Football 2018 Date of Paper Pages Event Covered (Daily Mirror ) 3 Apr 1905 Pages 8 and 14 England 1 Scotland 0 (Home Championship) 5 Apr 1909 Page
Monthly Digest February 2016 No. 2016/04. Copyrights Statistics Botswana 2016
 STATISTICS BOTSWANA BOTSWANA INTERNATIONAL MERCHANDISE TRADE STATISTICS Monthly Digest February 2016 No. 2016/04 Copyrights Statistics Botswana 2016 Contact Statistician: Malebogo Rakgantswana Email: mrakgantswana@gov.bw
The Nordic countries in figures
 The Nordic countries in figures 2010 Order your Nordic Statistica Yearbook 2010 on www.norden.org Nordic countries in figures 2010 ANP 2010:773 T RY K S A G N R. 541-618 Nordic countries in figures 2010
Origin Mid Atlantic. Other US States Overseas. Overseas Target Market Other Overseas. Central States
 Note: due to changes in 2013 survey methodology domestic data is not comparable to prior years Destination: CMA 580 Year: 2014 Origin Mid Atlantic and East North Central States Other US States Overseas
The Cairns Economy Recent Trends and Prospects
 MINING, AGRICULTURE, TOURISM, TRANSPORT, CONSTRUCTION, MANUFACTURING, DEFENCE, EDUCATION, ADMINISTRATION, SERVICES The Cairns Economy Recent Trends and Prospects WS (Bill) Cummings PRESENTATION TO Ref:
Energy Security: Markets and Policy
 Energy Security: Markets and Policy Pierre Noël EPRG, University of Cambridge Critical Infrastructure Conference, London, 20 April 2011 Contents Global Oil and the Middle East European Gas and Russia Japan
To receive a Certificate of Completion, please provide information requested in the session sign-in sheet for each session attended
 Welcome Session A1 Tourism Basics: How to Understand and Benefit from Domestic and International Tribal Tourism Research and Data Tuesday, September 18, 2018 10:30am - 12:00pm To receive a Certificate
DEVELOPMENT AID AT A GLANCE
 DEVELOPMENT AID AT A GLANCE STATISTICS BY REGION 5. EUROPE 2018 edition All the data in this report are available at: http://www.oecd.org/dac/financing-sustainable-development/ 5.1. ODA TO EUROPE - SUMMARY
Beef Cattle Market Update
 Beef Cattle Market Update August 8, 2017 Dr. Scott Brown Agricultural Markets and Policy Division of Applied Social Sciences University of Missouri brownsc@missouri.edu http://amap.missouri.edu Twitter
DEVELOPMENT AID AT A GLANCE
 DEVELOPMENT AID AT A GLANCE STATISTICS BY REGION 6. OCEANIA 2018 edition All the data in this report are available at: http://www.oecd.org/dac/financing-sustainable-development/ 6.1. ODA TO OCEANIA - SUMMARY
Global economic cycle has slowed
 Year-on-year % change Confidence index, 50= no change Global economic cycle has slowed 25% 70 20% International trade growth 65 15% 10% Industrial production growth 60 5% 55 0% 50-5% Business confidence
Impacts of the Global Economy on Asia Pacific Travel. 29 June 2007 John Walker
 Impacts of the Global Economy on Asia Pacific Travel 29 June 2007 John Walker jwalker@oxfordeconomics.com Oxford Economics Founded in 1981 Over 300 clients including blue chip companies and government
GLOBAL BAROMETER OF HOPE AND DESPAIR FOR 2011
 GLOBAL BAROMETER OF HOPE AND DESPAIR FOR 2011 Volume 1: Statistical Report Findings based on responses from more than 64,000 scientifically selected cross-section of Men and Women from all socioeconomic
SA economic review Kevin Lings. August 2018
 SA economic review Kevin Lings August 2018 South Africa real GDP growth year-on-year %y/y 8 7 6 5 Ave 4.3% 4 Ave 2.5% 3 2 Ave 0.9% 1 0-1 -2-3 00 01 02 03 04 05 06 07 08 09 10 11 12 13 14 15 16 17 18 2
The economic value of the EU shipping industry. Andrew P Goodwin
 The economic value of the EU shipping industry Andrew P Goodwin 2 nd April 2014 Introduction Shipping is a vital facilitator of world trade 135 % Increase in world GDP in the last two decades 180 % Increase
Current Hawaii Economic Conditions. Eugene Tian
 Current Hawaii Economic Conditions Eugene Tian Department of Business, Economic Development & Tourism At the PATA/TTRA 2016 Annual Outlook & Economic Forecast Forum February 3, 2016 Positive Signs in the
Muhlenkamp & Company. Webinar December 1, Ron Muhlenkamp, Portfolio Manager Jeff Muhlenkamp, Portfolio Manager Tony Muhlenkamp, President
 Muhlenkamp & Company Webinar December 1, 2016 Ron Muhlenkamp, Portfolio Manager Jeff Muhlenkamp, Portfolio Manager Tony Muhlenkamp, President Muhlenkamp & Company, Inc. Intelligent Investment Management
Press Release PR /CD
 Press Release I N T E R N A T I O N A L O L Y M P I C C O M M I T T E E CHÂTEAU DE VIDY - 1001 LAUSANNE - SWITZERLAND - TEL (41-21) 621 6111 - FAX (41-21) 621 6354 - WWW.OLYMPIC.ORG PR 085-00/CD SYDNEY
Ministry of Economy and Sustainable Development of Georgia
 Ministry of Economy and Sustainable Development of Georgia Economic Growth 42,000.0 36,000.0 30,000.0 24,000.0 18,000.0 12,000.0 6,000.0 0.0 GDP AND ECONOMIC GROWTH 7.2% 6.2% 6.4% 4.6% 4.8% 3.4% 2.9% 2.8%
DG AGRI DASHBOARD: CITRUS FRUIT Last update:
 14 000 12 000 10 000 8 000 6 000 4 000 2 000 0 1996 1997 1998 1999 2000 2001 2002 2003 2004 2005 2006 2007 2008 2009 2010 2011 2012 2013 2014 2015 2016 Small citrus (group mandarines): clementines, satsumas
Economic Outlook March Economic Policy Division
 Economic Outlook March 212 Economic Policy Division Real GDP Outlook Percent Change, Annual Rate 2 1 1 - -1 197 197 198 198 199 199 2 2 21 U.S. GDP Actual and Potential Quarterly, Q1 197 to Q4 211 Real
Maximizing Tourism Marketing Investments A Canadian Perspective
 Maximizing Tourism Marketing Investments A Canadian Perspective Understanding the potential of markets Economics: GDP; Inflation; Unemployment; Employment; Disposable Income; Private Consumption; Consumer
ERRATA A few figures and tables in the print publication contain errors or lack information. The corrected versions are presented below.
 Newspapers in the Nordic Media Landscape 217 1. The Nordic Context ERRATA A few figures and tables in the print publication contain errors or lack information. The corrected versions are presented below.
INTRODUCING GOLF TOURISM TRENDS IN GOLF TOURISM. How much do international golf tourists spend on their trip in New Zealand?
 Tourists INTRODUCING GOLF TOURISM This report provides an overview of golf tourism in New Zealand including trends and characteristics of international golf tourists. is a popular tourist activity. New
Cheese (American, Italian, Hard, Soft, Fresh and Others) Market - Global Industry Analysis, Size, Share, Growth, Trends and Forecast,
 Market - Global Industry Analysis, Size, Share, Growth, Trends and Forecast,") Cheese (American, Italian, Hard, Soft, Fresh and Others) Market - Global Industry Analysis, Size, Share, Growth, Trends and Forecast, 2013-2019 ResearchMoz include new market research report" Cheese (American,
Cheese (American, Italian, Hard, Soft, Fresh and Others) Market - Global Industry Analysis, Size, Share, Growth, Trends and Forecast, 2013-2019 ResearchMoz include new market research report" Cheese (American,
KINGDOM OF CAMBODIA NATION RELIGION KING 3
 KINGDOM OF CAMBODIA NATION RELIGION KING 3 TOURISM STATISTICS REPORT February 2018 MINISTRY OF TOURISM Statistics and Tourism Information Department No. A3, Street 169, Sangkat Veal Vong, Khan 7 Makara,
Origin Mid Atlantic. Other US States Overseas. Overseas Target Market Other Overseas. Central States
 States Target Market Other Total Visits Total Unweighted 466 431 402 29 15 7 8 20 7 13 Total Household/Party Visits (Weighted) 853,373 834,161 816,781 17,380 9,894 4,601 5,292 9,319 2,975 6,343 Total Person
Happiness trends in 24 countries,
 Happiness trends in 4 countries, 1946-006 The following graphs shows the trends in happiness levels found in 4 countries, using comparable data from all available surveys for countries having at least
DG AGRI DASHBOARD: CITRUS FRUIT Last update:
 8.000 7.000 6.000 5.000 4.000 3.000 2.000 1.000 0 1996 1997 1998 1999 2000 2001 2002 2003 2004 2005 2006 2007 2008 2009 2010 2011 2012 2013 2014 2015 2016 2017 Small citrus (group mandarines): clementines,
HotelBenchmark Survey and assessment of European hotel performance trends
 A HotelBenchmark Survey and assessment of European hotel performance trends Launch of the HotelBenchmark Survey for Belgium and The Netherlands Julia Felton Executive Director HotelBenchmark HotelBenchmark
THE WORLD COMPETITIVENESS SCOREBOARD 2011
 THE WORLD COMPETITIVENESS SCOREBOARD 2011 98.557 94.063 92.588 92.011 90.782 90.219 89.259 87.824 86.475 86.418 86.313 85.707 84.380 84.120 81.629 81.619 81.100 80.278 79.799 78.499 77.599 77.101 76.827
Beer statistics edition. The Brewers of Europe
 Beer statistics 2017 edition The Brewers of Europe Beer statistics 2017 edition The Brewers of Europe December 2017 ISBN 978-2-9601382-9-0 EAN 9782960138290 1 TABLE OF CONTENTS Foreword by President
Opportunities in a Challenging Global Business Environment: Can the World Avoid a Double-Dip?
 Opportunities in a Challenging Global Business Environment: Can the World Avoid a Double-Dip? Ross DeVol Chief Research Officer (310) 570 4615 rdevol@milkeninstitute.org www.milkeninstitute.org Presentation
Max Sort Sortation Option - Letters
 Max Sort Sortation Option - Letters Western Europe Prices Product Code PS5 PS6 Austria* 0.330 7.550 0.330 7.400 Belgium* 0.370 3.700 0.370 3.540 Denmark* 0.620 5.350 0.620 4.215 Finland* 0.385 4.400 0.385
Economic Update and Outlook
 Economic Update and Outlook NAIOP Vancouver Chapter November 15, 2012 Helmut Pastrick Chief Economist Central 1 Credit Union Outline: Global, U.S., and Canadian economic conditions Canada economic and
Charts on the NZ Economy 2014
 Charts on the NZ Economy 214 These charts were prepared by Susanna McLaren. They were updated and adapted from earlier versions used by Sir Roderick Deane in a number of speeches. Susanna benefitted from
Announcement of the International Figure Skating Competition. Kuopio, Finland September (21) 22 23, 2018
 22 23, 2018") Announcement of the International Figure Skating Competition Kuopio, Finland September (21) 22 23, 2018 Figure skating club Kuopion Taitoluistelijat ry., Kuopio, Finland, has the pleasure of inviting your
Announcement of the International Figure Skating Competition Kuopio, Finland September (21) 22 23, 2018 Figure skating club Kuopion Taitoluistelijat ry., Kuopio, Finland, has the pleasure of inviting your
PREVISIONS PUBLICITAIRES MONDIALES
 PREVISIONS PUBLICITAIRES MONDIALES VINCENT.LETANG@MAGNAGLOBAL.COM ABOUT MAGNA Leader in advertising market research, since 1950. Connected to hundreds of media buyers worldwide. 40 reports a year on net
Utility Debt Securitization Authority 2013 T/TE Billed Revenues Tracking Report
 Utility Debt Securitization Authority 2013 T/TE Billed Revenues Tracking Report Billing Budgeted Billed Dollar Percent Month Revenues Revenues Variance Variance Jan 2018 11,943,180.68 12,697,662.47 754,481.79
Arms industry statistics
 BRIEFING PAPER Number CBP 7842, 21 December 2016 Arms industry statistics By Rachel Kift and Rob Page Contents: 1. Global defence export market 2. UK defence export market www.parliament.uk/commons-library
Marine fishing tourism in Norway. Structure and economic effects
 Marine fishing tourism in Norway Structure and economic effects 29.09.2015 1 Icelandic friends Claudia master thesis «Warm» friendships 29.09.2015 5 Coastal tourism in Norway Marine tourism in Norway
Beer statistics edition. The Brewers of Europe
 Beer statistics 2016 edition The Brewers of Europe Beer statistics 2016 edition The Brewers of Europe November 2016 ISBN 978-2-9601382-7-6 EAN 9782960138276 1 TABLE OF CONTENTS Foreword by President
2017/18 Corn Outlook
 217/18 Corn Outlook 217 Ag Econ In service Training Dr. S. Aaron Smith, Assistant Professor, Department of Agricultural and Resource Economics, University of Tennessee https://ag.tennessee.edu/arec/pages/cropeconomics.aspx
Mean Sea Level Pressure and Wind Climatology over the North Indian Ocean: Quality control, Validation and Biases
 Mean Sea Level Pressure and Wind Climatology over the North Indian Ocean: Quality control, Validation and Biases M. Rajeevan and S.K.Dikshit India Meteorological Department Pune. India Introduction India
Global Construction Outlook: Laura Hanlon Product Manager, Global Construction Outlook May 21, 2009
 Global Construction Outlook: Short-term term Pain, Long-term Gain Laura Hanlon Product Manager, Global Construction Outlook May 21, 2009 What This Means for You The world is set to be hit this year with
State of American Trucking
 State of American Trucking October 11, 2018 Rod Suarez Economic Analyst American Trucking Associations rsuarez@trucking.org Business Cycles U.S. Expansions Duration October 1949 - July 1953 May 1954 -
HOME OF THE GREATEST SELECTION OF LIVE MOMENTS
 HOME OF THE GREATEST SELECTION OF LIVE MOMENTS Eurosport is the number one sport destination in Europe, fuelling the passion of fans and connecting them with the greatest sports events in the world. As
Michael Vanderhurst International Update February 2018
 Michael Vanderhurst International Update February 2018 2016 International Spend: $4,925,812. 2016: 10.4% growth Y/Y Top Countries by spend($m US) Top Originating Countries by Spend Amt ($M US) Top Countries
41th meeting of the Advisory Committee
 41th meeting of the Advisory Committee Marseille, France 8 July 213 OLIVE OIL BALANCES 211/12-212/13 OLIVE OIL 211/12 (final) (thousand tonnes) 212/13 (prov.) Starting stocks 773. 1.5 Production 3377.5
The globalisation of sporting events: Myth or reality?
 Khalifa Stadium, Qatar. Photo: Igor Magic The globalisation of sporting events: Myth or reality? Søren Bang, Play the Game 203, 30 October 203 The globalisation of sporting events: Myth or reality? Photo:
Grasshoppers, Ants and Locusts: the future of the world economy
 Ralph Miliband Series on the Restructuring of World Power Grasshoppers, Ants and Locusts: the future of the world economy Martin Wolf Associate editor and chief economics commentator, Financial Times Professor
sector: recent developments VÍTOR CONSTÂNCIO
 The economy and the banking sector: recent developments VÍTOR CONSTÂNCIO January 2006 Recent performance of the economy and prospects Factors behind the period of slow growth Challenges to the Banking
2012 International report on mountain tourism
 2012 International report on mountain tourism Will it go global thanks to the web? 7 th World Congress on Snow and Mountain Tourism - Andorra 11.04.2012 LV/01/04/2015 Agenda State of the industry Recent
STATISTICS BOTSWANA. INTERNATIONAL MERCHANDISE TRADE STATISTICS Monthly Digest March 2018
 STATISTICS BOTSWANA INTERNATIONAL MERCHANDISE TRADE STATISTICS Monthly Digest March 2018 Contact Statistician: Malebogo Rakgantswana Email: mrakgantswana@statsbots.org.bw Tel: (+267) 367 1300 Statistics
I. World trade in Overview
 I. Table I.1 Growth in the volume of world merchandise exports and production by major product group, 1995-3 ( change) 1995-21 22 23 World merchandise exports 7. -.5 3. 4.5 Agricultural products 3.5 2.5
India: Can the Tiger Economy Continue to Run?
 India: Can the Tiger Economy Continue to Run? India s GDP is on the rise US$ trillions Nominal GDP (left axis) GDP growth (right axis) 3.0 2.5 2.0 1.5 1.0 0.5 0.0 1990 1992 1994 1996 1998 2000 2002 2004
Opening address for dinner-debate
 Opening address for dinner-debate Mohammed Barkindo Acting for the OPEC Secretary General European Parliament Strasbourg, France 4 July 2006 1 Outline Importance of EU-OPEC Energy Dialogue Current oil
Serving international shoppers during the holiday season. 4 th December 2018
 1 Serving international shoppers during the holiday season 4 th December 2018 Agenda 2 1 Vinod Paul, Head of Business Intelligence and Insights Sales seasonality Key nationalities Monthly arrivals 2 Said
The Australia US FTA: implications for international education
 The Australia US FTA: implications for international education Prepared for The Path to Cultural Understanding and Development 18th IDP Australian International Education Conference, Sydney 5-8 October
STATISTICS BOTSWANA INTERNATIONAL MERCHANDISE TRADE STATISTICS. Monthly Digest February 2018
 STATISTICS BOTSWANA INTERNATIONAL MERCHANDISE TRADE STATISTICS Monthly Digest February 2018 Contact Statistician: Malebogo Rakgantswana Email: mrakgantswana@statsbots.org.bw Tel: (+267) 367 1300 Statistics
Universities and the Education Revolution. Professor Richard Larkins Chair, Universities Australia VC and President Monash University
 Universities and the Education Revolution Professor Richard Larkins Chair, Universities Australia VC and President Monash University Role of Universities in Prosperity Third largest earner of export dollars
Western Health Care Systems: Under Pressure from Demography
 Western Health Care Systems: Under Pressure from Demography Nicholas Eberstadt Henry Wendt Chair in Political Economy American Enterprise Institute eberstadt@aei.org Presentation at Panel on Health Care
Chart 1 U.S. Electronic Equipment Book/Bill Ratio 3-Month Average. Jul. Jul. Jul.
 Chart 1 U.S. Electronic Equipment Book/Bill Ratio 3-Month Average 1.15 1.10 1.05 1.00 0.95 0.90 1995 1996 1997 1998 1999 2000 2001 2002 2003 2004 2005 2006 2007 2008 2009 2010 2011 2012 2013 2014 2015
IBSA Goalball World Rankings 31 December 2017 Men's Division
 IBSA Goalball World Rankings 31 December 2017 Men's Division Rank No v Oc t Se p Au g Ju l Team Region Score Goal Diff Results Gol p Gme Last Plyd Weight 1st 5 6 6 1 2 Brazil Americas 661.802 4.564 0.872
MONTHLY DIGEST May Copyrights Statistics Botswana 2017
 INTERNATIONAL MERCHANDISE TRADE STATISTICS Copyrights Statistics Botswana 2017 Contact Statistician: Zibo Albert Email: zalbert@statsbots.org.bw Tel: (+267) 3671300 Release Date: August 2017 1 Statistics
Regional Spread of Inbound Tourism
 Regional Spread of Inbound Tourism Foresight issue 157 VisitBritain Research 1 Contents Introduction Summary Key metrics by UK area Analysis by UK area Summary of growth by UK area Scotland Wales North
New rules, new opportunities: a potential for growth
 #TV year New rules, new opportunities: a potential for growth June 19th, 2015 Jacques Balducci Eurodata TV Worldwide Deputy Sales Director Worldwide TV viewing remains strong World daily viewing time Average
Fibre to the Home: Taking your life to new horizons!
 Fibre to the Home: Taking your life to new horizons! Hartwig Tauber, Director General FTTH Council Europe Press Conference - Milan, 13 January 2011 FTTH Council Europe Photo by Nicolo Baravalle FTTH Council
The Economy of Finland
 The Economy of Finland Aug 30st 2013, Finnish Ministry of Foreign Affairs Presentation for the American Fulbright Grantees Petteri Rautaporras, Economist at the Federation of Finnish Technology Industries
U.S. Civilian Unemployment Rate
 Chart 1 U.S. Civilian Unemployment Rate 11 10 9 8 % 7 6 5 4 3 2 14710147101471014710147101471014710147101471014710147101471014710147101471014710147101471014710147101471014710147101471014710147 1990 1991
Lobster Market Analysis. Policy and Economics Branch DFO Gulf Region May 2008
 Lobster Market Analysis Policy and Economics Branch DFO Gulf Region May 2008 1 Commercially landed lobster species (Volume landed in 2006 x 1,000 m.t.) LOBSTERS (251) CLAWED LOBSTERS (170) UNCLAWED LOBSTERS
Assessing Australia s Innovative Capacity in the 21 st Century
 Assessing Australia s Innovative Capacity in the 21 st Century Professor Joshua Gans MBS & IPRIA University of Melbourne November, 2003 This presentation is based on the National Innovative Capacity Project,