Global Industry Perspective Greg Tyler, Vice President of Marketing USA Poultry & Egg Export Council
|
|
|
- Erick Murphy
- 5 years ago
- Views:
Transcription


1 Global Industry Perspective Greg Tyler, Vice President of Marketing USA Poultry & Egg Export Council UNECE Meetings Atlanta, Georgia April 24 th, 2012
2 USAPEEC & its Mission The USA Poultry & Egg Export Council (USAPEEC) is a non-profit trade association whose members account for more than 95% of all U.S. poultry and egg exports. USAPEEC exists for the purpose of increasing U.S. poultry & egg exports by protecting, opening and developing markets throughout the world and by serving as the industry s voice on trade policy issues.


3 USAPEEC s Global Network
4 USAPEEC Locations Based in Stone Mountain, Georgia, USAPEEC has 14 international offices in major export markets: Mexico City Monterrey Hong Kong Singapore Moscow Beijing Central Asia Shanghai Tokyo Seoul Middle East South Africa Europe Latin America/Caribbean


5


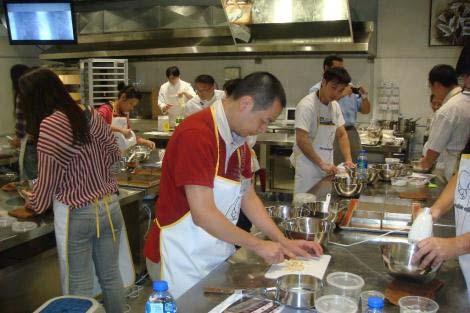
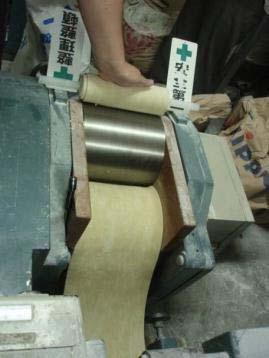
6 It s tough making poultry sexy. But we do our best!!!


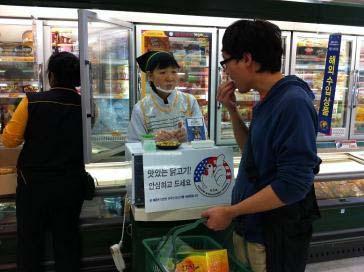
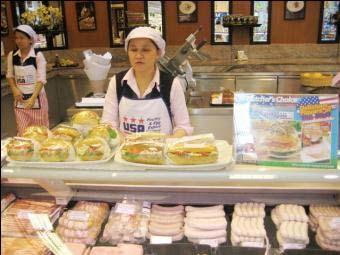

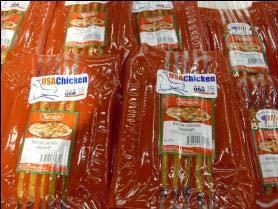
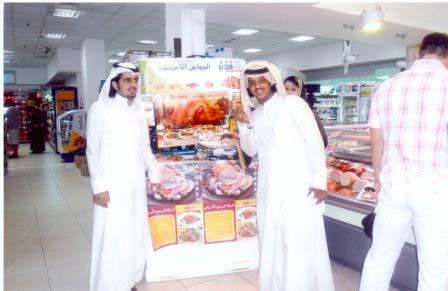

7 BAHRAIN KOREA JAPAN PANAMA THAILAND


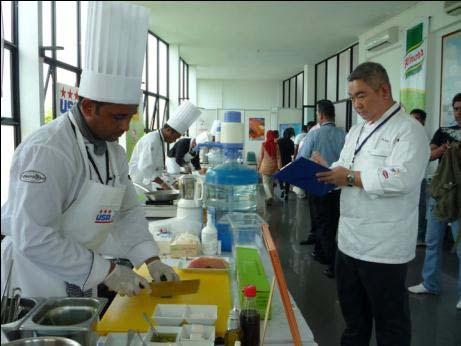


8 KOREA MEXICO PHILIPPINES MALDIVES KAZAKHSTAN


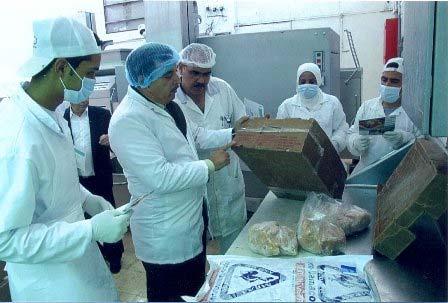

9 JAPAN MEXICO HONG KONG JORDAN


10 VIETNAM SINGAPORE RUSSIA YEMEN YEMEN


11
12
13 WORLD DEMAND FOR BROILER MEAT Billion World population (left axis) (e) Per capita consumption (right axis) kilogram Global demand for broiler meat has continued to rise as both population and per capita consumption increase. Source: USDA and U.S. Census Bureau
14 Top Poultry Producers in the World 40% 35% 30% 25% 22.4% % 20% 15% 15.6% 15.3% 13.2% 10% 5% 0% United States 3.4% Brazil China EU-27 Mexico ROW Source: USDA/FAS
15 Top Chicken Exporters in the World (In 1,000 metric tons) 4,000 3,500 3,750 3, , ,500 2,000 1,500 1, , ,421 0 Brazil USA EU27 Thailand China Argentina Canada Chile ROW Source: Global Trade Atlas
16 Top Poultry Consumers in the World (2011) USA China Brazil million tons EU-27 Mexico Russia India Japan Iran 4.0 South Africa 2.0 Argentina 0.0 Saudi Arabia Source: USDA/FAS
17 Per Capita Broiler Consumption Varies Significantly across the Countries (2010) Brazil USA Argentina 40 South Africa Mexico Kilograms Iran Russia EU-27 Japan China Indonesia 0 India Source: USDA/FAS
18 2011 Broiler Exports to Set Record in Value Quantity (left axis, million tons) Value (right axis, billion US$) $4.5 $4.0 $3.5 $3.0 $2.5 $2.0 $1.5 $1.0 $0.5 $ (e) An average annual increase of 9.8% in volume and 9.6% in value during Source: USDA/FAS
19 Share of U.S. Broiler Production Exported 30% 25% 20% 15% 21.7% 21.0% 19.8% 10% 5% 0% 3.1% 6.0% (e) Source: USDA/FAS
20 Top U.S. Broiler Export Markets ROW 36.1% Russia 20.5% ROW 52.6% Hong Kong 16.4% Cuba 4.1% = Mexico 13.2% Iraq 4.5% Hong Kong 4.6% 2009 Mexico 10.4% China 19.9% Iraq 4.0% Canada 4.0% 2011 Angola 4.7% Russia 5.1% Broiler exports in 2011 are expected to set record in value this year, despite the major losses in China and Russia.
21 Top Turkey Exporters in the World 1,000 MT USA Brazil EU-27 Canada Chile ROW Source: Global Trade Atlas
22 2011 Turkey Exports Set Record Quantity (left axis) Value (right axis) $481 $600 $700 $600 $500 1,000 MT $400 $300 $200 million US$ 100 $100 0 $ An average annual growth of 4.2% in volume and 9.3% in value in Source: USDA/FAS
23 Share of Turkey Production Exported 15% 12% 11.8% 11.0% 9% 9.6% 10.6% 6% 3% 0% 0.9% 1.6% (e) Source: USDA/FAS
24 Top U.S. Turkey Export Markets (In 1,000 metric tons) Mexico China Hong Kong Canada Dominican Republic ROW 66.0 Source: USDA/FAS
25 Egg Exports To Set New Record in Value Quantity (left axis) Value (right axis) (e) million dozen million U.S. dollars Note: include table eggs and egg products in shell egg equivalent Source: USDA/FAS
26 Share of Table Egg Production Exported 5.0% 4.0% 3.0% 2.0% 3.1% 3.0% 1.0% 0.0% Source: USDA
27 Top Table Egg Export Markets (share of export volume) 60% 50% 40% 30% 20% 10% 0% % Jan - Sep % 18.0% 12.7% 1.7% 1.6% Hong Kong Canada UAE Bahamas Israel ROW Source: USDA/FAS
28 Top Egg Product Export Markets (share of export value) 60% 50% 52.9% % % 20% 18.6% 2010 Jan - Sep % 10% 0% 6.0% 1.7% Japan EU-27 Canada Mexico South Korea 4.1% ROW Source: USDA/FAS
29 U.S. Poultry & Egg Export Value (In million U.S. dollars) $6,000 $5,000 $4,000 T able egg & egg products Other poultry Turkey Value Broiler Value $3,000 $2, (e) $1, $0 Total export value in 2011 is expected to reach 5.2 billion, up 19% from last year Source: USDA/FAS
30 World Broiler Net Exports in the Next Decade million tons Net exports is expected to increase at an average rate of 3.0 percent throughout Source: FAPRI
31
32 Challenge of High Feed Grain Prices The prolonged economic downturn is a challenge for the world poultry industry because it has led to higher unemployment, lower consumer income, and lower consumption, which translates into a weak market demand for meat protein. Our biggest challenge remains high feed grain prices. But, as the most efficient converter of feed to meat, the impact on poultry is less than other meats. Record corn and soybean prices, combined with depressed sales, have put nearly every U.S. poultry company in an unprofitable situation. The global situation is similar.
33 Animal diseases such as AI impact trade While earlier AI consumer scares have subsided, incidents of HPAI is on the rise. U.S. and Brazil remain free of HPAI. In Asia and Africa, the prevalence of backyard flocks and the inability of governments to implement appropriate control measures could spell a major production disaster. Even though OIE says trade should not be restricted on basis of LPAI.many countries still do
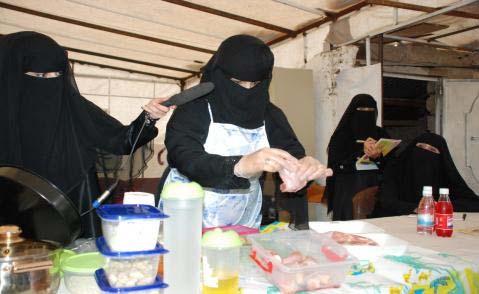
34 Religious and Cultural Barriers This sort of barriers to entry are often encountered in predominately-muslim countries. For example, entry to Malaysia and Indonesia, and Saudi Arabia must meet the halal regulations, meaning animals should be raised, slaughtered and processed in accordance with Muslim rites. But definitions, interpretations, and regulations of halal vary widely from country to country in both print and practice. The ambiguous regulations combined with costinefficient in halal production have dissuaded U.S. poultry processors from selling products to those markets.
35 Importance of Trade Descriptions to the Industry The trade standard creates better communication between buyer and seller as to product and packaging specifications for raw poultry products. The trade descriptions provide concise word and picture descriptions of product composition and define a coding system to precisely specify product and packaging characteristics. This will help to greatly reduce disputes between interested parties.


36
37 Possible Problem Areas and Miscues. Pack Style: The arrangement of product in a package or shipping container Bulk Pack Layer Pack Regular Layer Pack Honeycomb Soldier pack Flat pack
38 Possible Problem Areas and Miscues. Slaughter System Traditional Kosher Halal Other
39 Possible Problem Areas and Miscues. Production and Feeding Systems (Prod/Feed) Traditional Production and Diet Free-Range Production with Traditional Diet Pastured/Pasture-Raised Production with Traditional Diet Traditional Production with Organic and/or Antibiotic-Free Systems Free-Range Production with Organic and/or Antibiotic-Free Systems Pastured Production with Organic and/or Antibiotic-Free Systems Other
40
41 Conclusions The prolonged economic downturn leads to weak market demand. High feed and energy cost, combined with depressed sales, have put many poultry companys in an unprofitable situation. Animal diseases such as AI impact trade. Religious barriers are often encountered in predominately-muslim countries. For example, entry to Malaysia, Indonesia, and Saudi Arabia must meet the halal regulations. Trade barriers in major export markets:
42 Conclusions Despite many trade obstacles we are facing, we are still making progress on expanding export markets and our exports are continuing to grow. Biggest challenges are maintaining disease free status and persistent high feed and energy cost. In the long run, more people will eat more poultry meat as poultry efficiency in energy and feed conversion prevails. To feed the world s ever-growing population, we must Do a better job delivering our positive message to consumers and government. Support trade based on sound science, not political science.
43 Greg D. Tyler Vice President of Marketing USA Poultry & Egg Export Council
Overview. Building Demand for U.S. Poultry & Eggs Around the World 1/5/2018. Jennifer Geck Ott, Director of Allied Industry Relations, USAPEEC
 Building Demand for U.S. Poultry & Eggs Around the World Jennifer Geck Ott, Director of Allied Industry Relations, USAPEEC Kansas Soybean Expo January 10 th, 2018 Overview USAPEEC s Mission, Work, and
Global Market Trends and Challenges
 Global Market Trends and Challenges Northern Ireland Poultry Industry Conference 2 nd November 2017 Gary Millar, International Business Development Manager (Asia) Global Market Trends & Challenges: Global
STORM FORECASTS: The only independent source of animal health and animal agriculture historical market data and forecasts
 The only independent source of animal health and animal agriculture historical market data and forecasts June 2016 1 What is STORM FORECASTS? STORM FORECASTS is the only independent source of animal health
Trade Winds in Agriculture
 Trade Winds in Agriculture November 2, 2018 Dr. Scott Brown MU-CAFNR: Director of Strategic Partnerships brownsc@missouri.edu http://amap.missouri.edu Overview Trade uncertainty has increased as past trade
Outlook for the U.S. Livestock and Poultry Sectors in 2012 Presented By Shayle D. Shagam World Agricultural Outlook Board, USDA
 Outlook for the U.S. Livestock and Poultry Sectors in 2012 Presented By Shayle D. Shagam World Agricultural Outlook Board, USDA USDA Outlook Forum Washington, D.C. February 24, 2012 Situation Facing Livestock
Outlook for the U.S. Livestock and Poultry Sectors in 2011
 Outlook for the U.S. Livestock and Poultry Sectors in 2011 Presented By Shayle D. Shagam World Agricultural Outlook Board, USDA USDA Outlook Forum Washington, D.C. February 25, 2011 Situation Facing Livestock
Global Construction Outlook: Laura Hanlon Product Manager, Global Construction Outlook May 21, 2009
 Global Construction Outlook: Short-term term Pain, Long-term Gain Laura Hanlon Product Manager, Global Construction Outlook May 21, 2009 What This Means for You The world is set to be hit this year with
Market Opportunities for Irish Dairy 2025
 Market Opportunities for Irish Dairy 2025 National Dairy Conference 2014 Red Cow Moran Hotel, Dublin Aidan Cotter Chief Executive Wednesday, 19 th November, 2014 AIDAN COTTER BORD BIA CHIEF EXECUTIVE 28
I. World trade in Overview
 I. Table I.1 Growth in the volume of world merchandise exports and production by major product group, 1995-3 ( change) 1995-21 22 23 World merchandise exports 7. -.5 3. 4.5 Agricultural products 3.5 2.5
BMO Capital Markets New York Road Show New York, New York. December 5, 2013
 0 BMO Capital Markets New York Road Show New York, New York December 5, 2013 1 Forward Looking Statement Warning This presentation contains forward-looking statements about the business, financial condition
BMO Capital Markets 2013 Farm to Market Conference New York, New York. May 14, 2013
 0 BMO Capital Markets 2013 Farm to Market Conference New York, New York May 14, 2013 1 Forward Looking Statement Warning This presentation contains forward-looking statements about the business, financial
Sidoti & Company, LLC West Coast Road Show. San Francisco, California
 Sidoti & Company, LLC West Coast Road Show San Francisco, California February 4, 2015 Forward Looking Statement Warning This presentation contains forward-looking statements about the business, financial
U.S. Global Position (Imports/Exports) Dermot Hayes Iowa State University
 Dermot Hayes Iowa State University") U.S. Global Position (Imports/Exports) Dermot Hayes Iowa State University Overview Recent trade patterns Competitiveness of the US industry China 1960 1962 1964 1966 1968 1970 1972 1974 1976 1978 1980
U.S. Global Position (Imports/Exports) Dermot Hayes Iowa State University Overview Recent trade patterns Competitiveness of the US industry China 1960 1962 1964 1966 1968 1970 1972 1974 1976 1978 1980
THE WORLD COMPETITIVENESS SCOREBOARD 2011
 THE WORLD COMPETITIVENESS SCOREBOARD 2011 98.557 94.063 92.588 92.011 90.782 90.219 89.259 87.824 86.475 86.418 86.313 85.707 84.380 84.120 81.629 81.619 81.100 80.278 79.799 78.499 77.599 77.101 76.827
Goldman Sachs Eighteenth Annual Agribusiness Conference New York, New York. March 12, 2014
 0 Goldman Sachs Eighteenth Annual Agribusiness Conference New York, New York March 12, 2014 1 Forward Looking Statement Warning This presentation contains forward-looking statements about the business,
Goldman Sachs U.S. Emerging/SMID Cap Growth Conference. New York, New York
 Goldman Sachs U.S. Emerging/SMID Cap Growth Conference New York, New York November 20, 2014 Forward Looking Statement Warning This presentation contains forward-looking statements about the business, financial
BMO Capital Markets 2014 Farm to Market Conference New York, New York. May 21, 2014
 0 BMO Capital Markets 2014 Farm to Market Conference New York, New York May 21, 2014 1 Forward Looking Statement Warning This presentation contains forward-looking statements about the business, financial
Presentation from the USDA Agricultural Outlook Forum 2017
 Presentation from the USDA Agricultural Outlook Forum 2017 United States Department of Agriculture 93 rd Annual Agricultural Outlook Forum A New Horizon: The Future of Agriculture February 23-24, 2017
INTERNATIONAL STUDENT STATISTICAL SUMMARY Spring 2017 (Final)
") INTERNATIONAL STUDENT STATISTICAL SUMMARY Spring 2017 (Final) Prepared By: Mr. Jay Ward, Associate Director Office of International Programs San Francisco State University Non-Matriculated SP 17 SP 16
INTERNATIONAL STUDENT STATISTICAL SUMMARY Spring 2017 (Final) Prepared By: Mr. Jay Ward, Associate Director Office of International Programs San Francisco State University Non-Matriculated SP 17 SP 16
Beef Cattle Market Update
 Beef Cattle Market Update August 8, 2017 Dr. Scott Brown Agricultural Markets and Policy Division of Applied Social Sciences University of Missouri brownsc@missouri.edu http://amap.missouri.edu Twitter
Production, trade and supply of natural gas Terajoules
 Terajoules Table Notes Production includes quantities from other sources, which would include any quantities of biogas, LPG or manufactured gas blended with natural gas. Please refer to the Definitions
J.P. Morgan New York Non-Deal Road Show. New York, New York
 J.P. Morgan New York Non-Deal Road Show New York, New York March 2, 2018 Forward Looking Statement Warning This presentation contains forward-looking statements about the business, financial condition
Global Outlook for Agriculture Trend versus Cycle
 Global Outlook for Agriculture Trend versus Cycle Michael Swanson Ph.D. Wells Fargo October 2017 Everything is connected we just don t see how. Connection corollary: Nothing natural moves in a straight
IBSA Goalball World Rankings 31 December 2017 Men's Division
 IBSA Goalball World Rankings 31 December 2017 Men's Division Rank No v Oc t Se p Au g Ju l Team Region Score Goal Diff Results Gol p Gme Last Plyd Weight 1st 5 6 6 1 2 Brazil Americas 661.802 4.564 0.872
More than half the world lives on less than $2 a day
 More than half the world lives on less than $2 a day PRB s 2005 World Population Data Sheet reveals persisting global inequalities in health and well-being Presentation by Bill Butz, Carl Haub, Linda Jacobsen,
Three-speed economic recovery
 Three-speed economic recovery Projection after 2012 GDP growth, percent 10 8 6 4 2 0-2 Euro area -4-6 1992 1996 2000 2004 2008 2012 2016 Source: IMF WEO, April 2013. Emerging market and developing economies
Agricultural Trade Office The U.S. Embassy, Seoul
 Agricultural Trade Office The U.S. Embassy, Seoul www.atoseoul.com Data Source: Global Trade Atlas (www.gtis.com), CIF Value Basis, This presentation tracks Korea s imports of agricultural products on
October 23, 2015 FINAL STATISTICAL REPORT 2014/15
 C A L I F O R N I A D R I E D P L U M B O A R D 3840 Rosin Court Phone (916) 565-6232 Suite 170 Fax (916) 565-6237 Sacramento, CA 95834 www.californiadriedplums.org October 23, 2015 FINAL STATISTICAL REPORT
Agricultural Trade Office The U.S. Embassy, Seoul
 Agricultural Trade Office The U.S. Embassy, Seoul www.atoseoul.com Data Source: Global Trade Atlas (www.gtis.com), CIF Value Basis, This presentation tracks Korea s imports of agricultural products on
Session 4. Growth. The World Economy Share of Global GDP Year 2011 (PPP)
") Session 4. Growth Stylized Facts on Standards of Living across Countries Characterizing Growth over 1 Years: The US Economy Growth Dynamics of the G7 Countries and the OECD Economies Characterizing Growth
Session 4. Growth Stylized Facts on Standards of Living across Countries Characterizing Growth over 1 Years: The US Economy Growth Dynamics of the G7 Countries and the OECD Economies Characterizing Growth
Agricultural Outlook: Rebalancing U.S. Agriculture
 Agricultural Outlook: Rebalancing U.S. Agriculture Michael J. Swanson Ph.D. Agricultural Economist January 2018 2018 Wells Fargo Bank, N.A. All rights reserved. For public use. The U.S. Ag Sector renormalizes!
Outlook for Global Recovered Paper Markets
 Outlook for Global Recovered Paper Markets Latin American Conference August 2016 Kurt Schaefer VP, Fiber Hannah Zhao Senior Economist, Recovered Paper Copyright 2016 RISI, Inc. Proprietary Information
Elements for the Biennial Review And Assessment of the World Timber Situation SELECTED DATA AND ANALYSIS.
 Elements for the Biennial Review And Assessment of the World Timber Situation 2015-2016 SELECTED DATA AND ANALYSIS Frances Maplesden Content Results of the 2016 Joint Forest Sector Questionnaire Secondary
Sulphur Market Outlook
 Sulphur Market Outlook Meena Chauhan Head of Sulphur and Sulphuric Acid Integer Research The Fertilizer Institute Outlook and Technology conference Fort Lauderdale, Florida Founded in 2002, Integer Research
2017/18 Corn Outlook
 217/18 Corn Outlook 217 Ag Econ In service Training Dr. S. Aaron Smith, Assistant Professor, Department of Agricultural and Resource Economics, University of Tennessee https://ag.tennessee.edu/arec/pages/cropeconomics.aspx
Global Use of Plasma-Derived Medicinal Products
 Global Use of Plasma-Derived Medicinal Products Patrick Robert The Marketing Research Bureau, Inc. IPFA Workshop on Improving Access to Plasma and Plasma Products in the Southern African Region December
Goldman Sachs Agricultural Biotech Forum New York, NY. March 7, 2012
 1 Goldman Sachs Agricultural Biotech Forum New York, NY March 7, 2012 2 Forward Looking Statement Warning This presentation contains forward-looking statements about the business, financial condition and
Export market challenges and opportunities for southern grain producers. Ross Kingwell
 Export market challenges and opportunities for southern grain producers Ross Kingwell Take Home Messages In wheat, face up to even more export competition. Find sources of additional value within or outside
PEMEX PETROQUIMICA 2013 ANNUAL CONFERENCE. PCI Xylenes & Polyester Doug Rightler
 PEMEX PETROQUIMICA 2013 ANNUAL CONFERENCE PCI Xylenes & Polyester Doug Rightler Discussion Points» MEG demand growth by region.» MEG supply - China is in control or is it?» Price drivers - the Chinese
IR-Pay Go Rates. There are three pricing groups for Pay Go rates for International Roaming as follows:
 IR-Pay Go Rates A. IR Pay Go Rate Summary There are three pricing groups for Pay Go rates for International Roaming as follows: Sr IR Pay Go Rate Group 1 Rs 2 2 2 2 Rs 10 10 10 3 Rs 50 600 25 Applicable
Overview of trade and export trends in the boating industry worldwide.
 by: Mike Derrett Overview of trade and export trends in the boating industry worldwide. European Boating Industry Conference Genoa 4 th October 2013 Mike Derrett Credentials Boater and Pilot for 50 years
Global economic cycle has slowed
 Year-on-year % change Confidence index, 50= no change Global economic cycle has slowed 25% 70 20% International trade growth 65 15% 10% Industrial production growth 60 5% 55 0% 50-5% Business confidence
FAPRI 2006 Preliminary Baseline December 15-16, 2005
 FAPRI 26 Preliminary Baseline December 15-16, 25 INTERNATIONAL SUGAR Amani Elobeid (515)-294-6175 amani@iastate.edu FAPRI Food and Agricultural Policy Research Institute Center for Agricultural and Rural
CMMI Maturity Profile Report. 30 June 2017
 CMMI Maturity Profile Report 30 June 2017 Executive Summary Appraisals increased 14% 1 Jan 30 Jun 17 Companies who reappraise continue to increase, currently at 74% 10% of reported appraisals are high
2017/18 Soybean Outlook
 217/18 Soybean Outlook 217 Ag Econ In service Training Dr. S. Aaron Smith, Assistant Professor, Department of Agricultural and Resource Economics, University of Tennessee https://ag.tennessee.edu/arec/pages/cropeconomics.aspx
The Relationship of Freshwater Aquaculture Production to Renewable Freshwater Resources
 The Relationship of Freshwater Aquaculture Production to Renewable Freshwater Resources Claude E. Boyd Department of Fisheries and Allied Aquacultures Auburn University, Alabama USA Current and projected
Demand/Supply of Asian Ferrous Scrap Market
 American Metal Market EVENTS 7 th Steel Scrap Conference October 30-31, 2013 Demand/Supply of Asian Ferrous Scrap Market Kensuke KITANI SHIMABUN Corporation 1 Today s Agenda 1. Who is SHIMABUN? 2. Current
Global Containerboard Outlook
 Global Containerboard Outlook With a focus on the Asian market RISI Asian Conference May 2017 Ken Waghorne VP, Global Packaging Ken Waghorne VP Global Packaging kwaghorne@risi.com One of the original Resource
Opportunities in a Challenging Global Business Environment: Can the World Avoid a Double-Dip?
 Opportunities in a Challenging Global Business Environment: Can the World Avoid a Double-Dip? Ross DeVol Chief Research Officer (310) 570 4615 rdevol@milkeninstitute.org www.milkeninstitute.org Presentation
The globalisation of sporting events: Myth or reality?
 Khalifa Stadium, Qatar. Photo: Igor Magic The globalisation of sporting events: Myth or reality? Søren Bang, Play the Game 203, 30 October 203 The globalisation of sporting events: Myth or reality? Photo:
Car Production. Brazil Mexico. Production in thousands. Source: AMIA Asociacion Mexicana de la industria automotriz.
 Car Production Production in thousands 4000 3000 2000 1000 Brazil Mexico 0 2013 2014 2015 Source: AMIA Asociacion Mexicana de la industria automotriz. Mexico s Expanding Middle Class Percent of population
1.2. Barite Market Overview
 1.2. Barite Market Overview In 2010 primary barite production estimated 000 thousand metric tons, a 12,5% increase from that of. Table 1. World mine production of barite, 2004-2010 (thousand metric tons)
Desalination From theory to practice People, Papers, Publications. Miriam Balaban EDS Secretary General
 Desalination From theory to practice People, Papers, Publications Gulf WSTA Europe EDS Miriam Balaban EDS Secretary General Europe and the Gulf Region The collaboration between our regions has had significant
The Future of the World s International Education
 The Future of the World s International Education long-term driving forces or trends that influence almost everything at all levels of societal development. They have great importance now, and we are relatively
ISSUES AND CHALLENGES FACING THE PLASTICS INDUSTRY, An Exclusive Seminar for MPMA Members 2 nd April 2014 Venue: Conference Room, MPMA, Petaling Jaya
 ISSUES AND CHALLENGES FACING THE PLASTICS INDUSTRY, An Exclusive Seminar for MPMA Members 2 nd April 214 Venue: Conference Room, MPMA, Petaling Jaya Raw Materials Present and Future Regional/World Capacities
Top Producer Seminar Chicago Hilton January 25, 2016
 Top Producer Seminar Chicago Hilton January 25, 2016 John Nalivka President, Sterling Marketing, Inc. Companies that target their products at the circumstances in which customers find themselves rather
Corn Outlook. February, 2018
 Corn Outlook February, 2018 Corn Outlook February 2018 Historical Price Reference Fundamental Backdrop Seasonal Tendency Summary 2 Historical Price Reference Where are Corn Prices Currently, And Where
Market Report Series Oil SIEW 2017 launch - 28 March 2017
 Market Report Series Oil 2017 SIEW 2017 launch - 28 March 2017 Oil demand continues to grow but at a slower pace 2.0 Global oil demand growth 2014-2022 1.5 1.0 0.5 0.0 2014 2015 2016 2017 2018 2019 2020
Pork Outlook. Professor of Agricultural Economics. Midwest/Great Plains & Western Outlook Conference Indianapolis, August 2007
 Midwest/Great Plains & Western Outlook Conference Indianapolis, August 2007 Pork Outlook Ron Plain Professor of Agricultural Economics University of Missouri-Columbia http://web.missouri.edu/~plainr/ Long
Max Sort Sortation Option - Letters
 Max Sort Sortation Option - Letters Western Europe Prices Product Code PS5 PS6 Austria* 0.330 7.550 0.330 7.400 Belgium* 0.370 3.700 0.370 3.540 Denmark* 0.620 5.350 0.620 4.215 Finland* 0.385 4.400 0.385
Japanese Market Potential
 Growth Strategy (announced on 14 June 2013) : Japan is BACK. Overall Target: 2% Real GDP Growth in the next 10 years JPY1.5 million Increase of GNI/capita after 10 years Unleash the Potential of Private
Whither Multilateralism? Joseph W. Glauber International Food Policy Research Institute Kraft Lecture University of Manitoba 21 October 2016
 Whither Multilateralism? Joseph W. Glauber International Food Policy Research Institute Kraft Lecture University of Manitoba 21 October 2016 Or wither multilateralism Making America Great Again? 1850
Ministry of Economy and Sustainable Development of Georgia
 Ministry of Economy and Sustainable Development of Georgia Economic Growth 42,000.0 36,000.0 30,000.0 24,000.0 18,000.0 12,000.0 6,000.0 0.0 GDP AND ECONOMIC GROWTH 7.2% 6.2% 6.4% 4.6% 4.8% 3.4% 2.9% 2.8%
APPENDIX A: MIDDLE-INCOME COUNTRIES SELECTED INFORMATION
 APPENDIX A: MIDDLE-INCOME COUNTRIES SELECTED INFORMATION Table A.1: Regional Distribution of Middle-Income Countries and 2004 GNI per Capita Table A.2: Economic, Social, and Governance Indicators Table
Chart Collection for Morning Briefing
 Chart Collection for Morning Briefing September 11, 2017 Dr. Edward Yardeni 516-972-7683 eyardeni@ Mali Quintana 4-664-1333 aquintana@ Please visit our sites at blog. thinking outside the box 4.6 4.4 4.2
Full-Time Visa Enrolment by Countries
 Page 1 of 32 All Students Afghanistan Albania Algeria Andorra Antigua Argentina Armenia Australia Austria Azerbaidjan Bahamas Bahrain Bangladesh Barbados Belarus Belgium Belize Benin (Dahomey) Bermuda
GLOBAL ECONOMICS, REAL ESTATE PRICING & OUTLOOK FOR 2017 RICHARD BARKHAM GLOBAL CHIEF ECONOMIST
 GLOBAL ECONOMICS, REAL ESTATE PRICING & OUTLOOK FOR 2017 RICHARD BARKHAM GLOBAL CHIEF ECONOMIST BREXIT TRUMPISM EURO-TRUMPISM 4 ECONOMICS, PRICING & OUTLOOK FOR 2017 LET S GET GEOPOLITICS IN PERSPECTIVE
SA economic review Kevin Lings. August 2018
 SA economic review Kevin Lings August 2018 South Africa real GDP growth year-on-year %y/y 8 7 6 5 Ave 4.3% 4 Ave 2.5% 3 2 Ave 0.9% 1 0-1 -2-3 00 01 02 03 04 05 06 07 08 09 10 11 12 13 14 15 16 17 18 2
World supply and demand of tilapia
 World supply and demand of tilapia by Helga Josupeit FAO Rome, October 2010 World tilapia production World tilapia production has been booming during the last decade, with output doubling from 830000 tonnes
Stocks and Bonds Track Aging Population:
 Stocks and Bonds Track Aging Population: 1952-2008 8 85.00% 7 6 5 4 3 2 1 Correlation: 93% Stocks and Bonds as a Percentage of Household Liquid Financial Assets (left scale) Population 35 Years and Over
OUTLOOK FOR US AGRICULTURE. Rob Johansson Acting Chief Economist 19 February 2015
 OUTLOOK FOR US AGRICULTURE Rob Johansson Acting Chief Economist 19 February 2015 Fig 1 Next boost to productivity: Big Data? Index: 1948 = 1.0 $million (2006 dollars) 3.0 $12,000 2.5 2.0 $R&D Output Input
Reality Math Dot Sulock, University of North Carolina at Asheville
 Reality Math Dot Sulock, University of North Carolina at Asheville Firearm Deaths 1. Making an Excel Pie Graph Firearm Deaths in US 2000 2011 suicides 16,586 19,766 homicides 10,801 11,101 unintentional
The outlook: what we know, the known unknowns and the unknown unknowns
 The outlook: what we know, the known unknowns and the unknown unknowns 24 April 2017 Seoul Brian Pearce, Chief Economist, IATA www.iata.org/economics Airline Industry Economics Advisory Workshop 2016 1
Dry Bulk Shipping in Indonesia Opportunities & Outlook
 Dry Bulk Shipping in Indonesia Opportunities & Outlook Mare Forum, Jakarta 27 Peter Malpas 29 th November 27 Introduction Indonesia Key Facts Land Area 1,919,44 km2 = World s s 16 th Largest Population
Global Economic Indicators: Global Growth Barometer
 Global Economic Indicators: Global Growth Barometer May 9, 2018 Dr. Edward Yardeni 516-972-7683 eyardeni@ Debbie Johnson 4-664-1333 djohnson@ Mali Quintana 4-664-1333 aquintana@ Please visit our sites
The 11th Korea Prime Minister Cup International Amateur Baduk Championship
 The 11th Korea Prime Minister Cup International Amateur Baduk Championship Buan County, South Korea We are pleased to announce that the 11 th Korea Prime Minister Cup (KPMC) will be held on the 3rd-9th
UK Trade Statistics 2016
 Value ( million) Rate of Exchange (USD against GBP) ORNAMENTAL AQUATIC TRADE ASSOCIATION LTD. "The Voice of the Ornamental Fish Industry" 1 st Floor Office Suite, Wessex House 4 Station Road, Westbury,
Global Economic Indicators: Emerging Markets Trade
 Global Economic Indicators: Emerging Markets Trade February 4, 218 Dr. Edward Yardeni 516-972-7683 eyardeni@yardeni.com Debbie Johnson 48-664-1333 djohnson@yardeni.com Please visit our sites at blog.yardeni.com
Student Nationality Mix for BAT Bath
 Student Nationality Mix for BAT Bath Country Total Saudi Arabia 16. Oman 11.8% Spain 10. China 10. Libya 7. Thailand 6. Korea (South) 6. France 3.9% Venezuela 3. Italy 2.9% Brazil 2. Turkey 2. Switzerland
US TRADE POLICY Retrenchment or Resurgence?
 US TRADE POLICY Retrenchment or Resurgence? Joe Glauber International Food Policy Research Institute Farmers Cooperative Conference Minneapolis, MN 3 November 2016 Support for trade liberalization falters
AREA TOTALS OECD Composite Leading Indicators. OECD Total. OECD + Major 6 Non Member Countries. Major Five Asia. Major Seven.
 Reference series Composite leading indicators OECD Composite Leading Indicators AREA TOTALS 7-03- 19 OECD Total 19 OECD + Major 6 Non Member Countries 19 Major Seven 19 Major Five Asia 19 Euro area 19
Major Issues and Trends Facing the Port and Marine Transportation Industry
 Major Issues and Trends Facing the Port and Marine Transportation Industry Presented to: AAPA Marine Terminal Management Training Program April 24, 2006 Charleston Riverview Hotel Charleston, SC - USA
Swine Market Outlook
 2018 IOWA PORK REGIONAL CONFERENCES NASHUA, CARROLL, LE MARS, & WASHINGTON, IA FEBRUARY 19-22, 2018 Swine Market Outlook Lee Schulz, Department of Economics, Iowa State University (515) 294-3356; lschulz@iastate.edu
Global Containerboard Outlook
 Global Containerboard Outlook European Conference March 2018 Gleb Sinavskis Economist, European Paper Packaging Copyright 2018 RISI, Inc. Proprietary Information Gleb Sinavskis Economist, European Paper
USDA Grains & Oilseeds Outlook
 USDA Grains & Oilseeds Outlook 3 rd Ukrainian Grain Congress 2012 Edward W. Allen U.S. Department of Agriculture Economic Research Service 202-694-5288 ewallen@ers.usda.gov U.S. Producer Prices Are High
Percent
 Outline Outline Growth is picking up Percent 6 Advanced economies Emerging and developing economies 5 4 4.9 5.0 4.3 4.4 4.6 4.7 4.7 3.7 3.7 3 2 2.0 2.3 1.6 2.2 2.3 1.9 1.7 1 1.1 1.3 0 2012 2013 2014 2015
DG AGRI DASHBOARD: CITRUS FRUIT Last update:
 8.000 7.000 6.000 5.000 4.000 3.000 2.000 1.000 0 1996 1997 1998 1999 2000 2001 2002 2003 2004 2005 2006 2007 2008 2009 2010 2011 2012 2013 2014 2015 2016 2017 Small citrus (group mandarines): clementines,
Corn Outlook. December, 2017
 Corn Outlook December, 2017 Corn Outlook December, 2017 Historical Price Reference Fundamental Backdrop Seasonal Tendency Summary Commodity & Ingredient Hedging 2 Historical Price Reference Where are Corn
The Changing Global Economy Impacts on Seaports and Trade Dr. Walter Kemmsies
 The Changing Global Economy Impacts on Seaports and Trade Dr. Walter Kemmsies Chief Economist, PAGI Group, JLL (Port, Airport & Global Infrastructure) Agenda Where are we in the cycle? What are the barriers
2 Bivalves: Global production and trade trends
 2 Bivalves: Global production and trade trends S. Pawiro The international trade in bivalves (shellfish) is very much regionalized. Few countries are able to penetrate distant markets outside their regions,
Some Facts About Output
 Some Facts About Output GNP as a Percentage of GDP in 2009 Country % Kuwait 110,38 United Kingdom 102 Japan 103,14 United States 99,24 China 100,87 Germany 101,41 Mexico 98,34 Poland 96,76 Ireland 81,19
PRESENTED BY HOP GROWERS OF AMERICA
 2007 STATISTICAL REPORT FINAL REPORT RELEASED JUNE 2008 PRESENTED BY HOP GROWERS OF AMERICA TABLE OF CONTENTS Page U.S. HOP ACREAGE BY STATE AND VARIETY 2003-2007 4 U.S. HOP YIELDS BY STATE AND VARIETY
FAPRI agricultural commodity outlook
 FAPRI agricultural commodity outlook By William H. Meyers Howard Cowden Professor of Agricultural and Applied Economics FAPRI at MU UN DESA Expert Group Meeting on the World Economy 21 October 2013 New
2016 Grains & Oilseeds Outlook. The global outlook remains positive. 12/7/2015. Matthew C. Roberts
 12/7/215 216 Grains & Oilseeds Outlook Matthew C. Roberts Roberts.628@osu.edu The global outlook remains positive. www.matthewcroberts.com 2 www.matthewcroberts.com 3 www.matthewcroberts.com 4 www.matthewcroberts.com
SUMMARY. Natural Gas In The World 2017 Edition
 CEDIGAZ, the International Association for Natural Gas SUMMARY Natural Gas In The World 217 Edition CEDIGAZ, October 217 NATURAL GAS IN THE WORLD 217 SUMMARY Worldwide proven natural gas reserves grew
Cattle Market Outlook & Important Profit Factors for Cattle Producers
 Cattle Market Outlook & Important Profit Factors for Cattle Producers Dr. Scott Brown Agricultural Markets and Policy Division of Applied Social Sciences brownsc@missouri.edu http://amap.missouri.edu $
European Values Study & World Values Study - Participating Countries ( )
") GESIS Data Archive for the Social Sciences http://www.gesis.org/en/home/ ASEP/JD Data Archive http://www.jdsurvey.net/jds/jdsurvey.jsp European Values Study & World Values Study - Participating Countries
GESIS Data Archive for the Social Sciences http://www.gesis.org/en/home/ ASEP/JD Data Archive http://www.jdsurvey.net/jds/jdsurvey.jsp European Values Study & World Values Study - Participating Countries
China at a glance 2011
 China at a glance 2011 GDP PPP Growth rate Per capita Value US$11.29 trillion 9.2% US$8,400 Ranking 3 7 119 Labor force Imports Exports Value 816.2 million US$1.74 trillion US$1.90 trillion Ranking 1 3
KINGDOM OF CAMBODIA NATION RELIGION KING 3
 KINGDOM OF CAMBODIA NATION RELIGION KING 3 TOURISM STATISTICS REPORT February 2018 MINISTRY OF TOURISM Statistics and Tourism Information Department No. A3, Street 169, Sangkat Veal Vong, Khan 7 Makara,
BUILDING EXPORTS FOR WHEY INGREDIENTS
 BUILDING EXPORTS FOR WHEY INGREDIENTS Once a waste product in need of disposal, whey products have become a valuable component of the milk stream. The domestic market can consume just two-thirds of the