Vancouver Demographic Report Victoria-Fraserview
|
|
|
- Dwight Sherman
- 5 years ago
- Views:
Transcription


1 January 2019 Vancouver Demographic Report Victoria-Fraserview The Vancouver Early Years Partnership (VEYP) and the Human Early Partnership (HELP) collaborated on a research project to produce detailed demographic profiles for all 21 Vancouver Neighbourhoods. These profiles have gathered the key data that we know about children and families in our city into one place. The intention of these profiles is to encourage thought, reflection, conversation and the desire to know more and do more. Our hope is that this information provides local planning tables, service providers, government, funders and others the data needed to work collaboratively to make changes that will improve the lives of children and their families. Thank you to Barry Forer, our lead researcher, and Pippa Rowcliffe from HELP; Peter Marriott from the City of Vancouver; Claire Gram and Lianne Carley from Vancouver Coastal Health for your advice and support! Finally, many thanks to the Ministry of Children and Family Development, Children First, for funding this project. Together we can make a difference for children! Sincerely, on behalf of the Vancouver Early Years Partnership, Sandra Menzer Kim Adamson Community Developer Chair: Steering Committee Our Mission: To Strengthen the Early Years though Collaboration, Education and Research 1
2 Table of Contents (click below to navigate to a particular page) Neighbourhoods... 5 Local Health Areas (aka Community Health Areas)... 5 POPULATION TRENDS... 6 Victoria-Fraserview: Number of Children by Age Group, 2006 to Victoria-Fraserview: Population Density (People per Hectare), by Age Group, 2006 to Percent of population aged 0 to 5, 6 to 12, and 13 to 18, 2006 to Population Projections, by Vancouver Community Health Areas... 7 FAMILY AND HOUSEHOLD STRUCTURE... 8 Marital Status... 8 Family Types, 2006 to Families by Number of Children, 2006 to Lone Parent Families Victoria-Fraserview: Number of Lone Parent Families, 2006 to Percent lone parent families, overall and female-led, 2006 to FAMILY INCOME Median total family income (2015 dollars), all families with children under 18 and with children under 6, 2005 to Median total family income (2015 dollars), lone parent families with children under 18 and with children under 6, 2005 to Families Receiving Social Assistance Percent of families with at least one person receiving social assistance, all families with children under 18 and with children under 6, 2005 to Percent of families receiving social assistance, lone parent families with children under 18 and with children under 6, 2005 to Families Receiving Employment Insurance Income Percent of families with at least one person with Employment Insurance income, all families with children under 18 and with children under 6, 2005 to Percent of families with Employment Insurance income, lone parent families with children under 18 and with children under 6, 2005 to GENDER-RELATED INCOME PATTERNS IN OPPOSITE-SEX COUPLES Percent female contribution to total income, opposite-sex couples with children under 18, and with children under 6, 2005 to Employment income by gender, opposite-sex couples with children under 18, 2005 to Employment income by gender, opposite-sex couples with children under 6, 2005 to POVERTY / LOW INCOME Percent of families below the after-tax Low Income Measure, all families with children under 18 and with children under 6, 2005 to
3 Percent of families below the after-tax Low Income Measure, lone parent families with children under 18 and with children under 6, 2005 to Percent of families below half of the after-tax Low Income Measure, all families with children under 18 and with children under 6, 2005 to Percent of families below half of the after-tax Low Income Measure, lone parent families with children under 18 and with children under 6, 2005 to INCOME INEQUALITY Gini Coefficient Gini Coefficient, all families with children under 18 and with children under 6, 2005 to Gini Coefficient, lone parent families with children under 18 and with children under 6, 2005 to LANGUAGE Percent with a non-english mother tongue, 2006 to Victoria-Fraserview: Top Ten * Non-English Mother Tongues, 2006 to Percent not speaking English at home, 2006 to Victoria-Fraserview: Top Ten * Non-English Languages Spoken at Home, 2006 to Percent with conversational knowledge of official languages, 2006 to Victoria-Fraserview: Top Ten * Languages, Ability to Hold a Conversation, 2006 to VISIBLE MINORITIES Percent visible minorities overall, 2006 to Percent various visible minorities, IMMIGRATION Percent of population that are immigrants, 2006 to Number of Immigrants, All Vancouver Neighbourhoods, 2006 to Victoria-Fraserview: Top Ten * Immigrants Place of Birth, Percent of All Immigrants, 2011 and Immigrants, by generation status, 2011 and Immigrants: Percent by admission category, INDIGENOUS POPULATION Victoria-Fraserview: Number with Indigenous Identity, Overall and by Category Percent with Indigenous identity, 2006 to EDUCATION Victoria-Fraserview: Number, by Highest Educational Attainment for Those Aged 25 to Percent by highest educational attainment for those aged 25 to 64, 2006 to OCCUPATIONS Victoria-Fraserview: Number, Each National Occupation Classification (NOC) Category, 2006 to Victoria-Fraserview: Percent, Each National Occupation Classification (NOC) Category, 2006 to
4 SHELTER Dwelling Types, 2006 to Home ownership and housing stress *, 2006 to Average monthly costs of renting and owning (2016 dollars), 2006 to Average home value (2016 dollars), 2006 to LABOUR FORCE PARTICIPATION AND UNEMPLOYMENT Labour force participation, age 15 plus, 2006 to Unemployment rate, age 15 plus, 2006 to RESIDENTIAL MOBILITY Percent who have moved in the past year, and in the past five years, 2006 to HELP SES INDEX Victoria-Fraserview: Components of the HELP SES Index, 2006 to HELP SES Index, 2006 to EDI TRENDS MDI TRENDS MDI Grade 4 (2014) MDI Grade 7 (2018) HEALTH-RELATED DATA FOR VANCOUVER My Health, My Community Births and Low Birth Rate Number and Percent of Births in Vancouver by Age of Mother, 2015/16 to 2017/ Number and Rate of Live Births and Low Birth Weight, 2011 to 2015, by Community Health Areas 50 Immunization Two-year-old Immunization Coverage Rates, Vancouver, 2003 to FAMILY-FRIENDLY RESOURCES IN VANCOUVER Early Childhood Education and Care Number of Licensees by Type Details for All Centre-based Licensees Child Care Need in City of Vancouver, as of December Community Centres Family Resource Programs Neighbourhood Houses StrongStart Centres Public Libraries Parks Public Schools City of Vancouver Neighbourhood Profile


5 MAPS OF VANCOUVER NEIGHBOURHOODS AND COMMUNITY HEALTH AREAS Neighbourhoods Local Health Areas (aka Community Health Areas) 5
6 Percent of population POPULATION TRENDS Victoria-Fraserview: Number of Children by Age Group, 2006 to Aged 0 to 5 1,480 1,409 1,416 Aged 6 to 12 2,112 2,009 1,810 Aged 13 to 18 1,768 2,330 2,076 Total Population 28,795 30,715 31,065 Victoria-Fraserview: Population Density (People per Hectare), by Age Group, 2006 to Aged 0 to Aged 6 to Aged 13 to Total Population Percent of population aged 0 to 5, 6 to 12, and 13 to 18, 2006 to % aged 0 to 5 % aged 6 to 12 % aged 13 to 18 Victoria-Fraserview Vancouver
7 Population Projections, by Vancouver Community Health Areas Community Health Area Age Group Year 2020 Year 2025 Year 2030 Under age City Centre Age 1 to Age 5 to Age 10 to Under age Downtown Eastside Age 1 to Age 5 to Age 10 to Under age North East Age 1 to Age 5 to Age 10 to Under age West Side Age 1 to Age 5 to Age 10 to Under age Midtown Age 1 to Age 5 to Age 10 to Under age South Vancouver Age 1 to Age 5 to Age 10 to Source: BC Stats, Based on the Component/Cohort-Survival method, 2017 base year estimate 7
8 Percent of population age 15 plus FAMILY AND HOUSEHOLD STRUCTURE Marital Status % married or living common-law % single (never married) % separated or divorced % widowed Victoria-Fraserview Vancouver
9 Percent of families with children Percent of families Family Types, 2006 to % couples without children % couples with children % lone parent families Victoria-Fraserview Vancouver Families by Number of Children, 2006 to % families with 1 child % families with 2 children % families with 3+ children Victoria-Fraserview Vancouver
10 Percent of population Lone Parent Families Victoria-Fraserview: Number of Lone Parent Families, 2006 to Total Number 1,520 1,630 1,585 Female lone parents 1,275 1,315 1,310 Male lone parents Percent lone parent families, overall and female-led, 2006 to % lone parent families % female lone parent families Victoria-Fraserview Vancouver
11 FAMILY INCOME Median total family income (2015 dollars), all families with children under 18 and with children under 6, 2005 to 2015 Victoria-Fraserview Vancouver $100,000 $90,000 $80,000 $70,000 $60,000 $50,000 $40,000 $30,000 $20,000 $10,000 $0 $90,755 $83,845 $75,092 $55,530 $65,685 $62,930 $57,162 $51,561 $53,046 $61,100 $46,920 $45, Median total income, all families with children under 18 Median total income, all families with children under 6 Source: Taxfiler Median total family income (2015 dollars), lone parent families with children under 18 and with children under 6, 2005 to 2015 Victoria-Fraserview Vancouver $40,000 $35,000 $30,000 $25,000 $20,000 $15,000 $10,000 $5,000 $0 $33,769 $29,504 $27,282 $30,850 $25,356 $23,000 $28,114 $20,240 $24,972 $25,990 $21,733 $18, Median total income, lone parent families with children under 18 Median total income, lone parent families with children under 6 Source:Taxfiler 11
12 Percent of families Percent of families Families Receiving Social Assistance Percent of families with at least one person receiving social assistance, all families with children under 18 and with children under 6, 2005 to Victoria-Fraserview % families with at least one person receiving social assistance, all families with children under 18 Vancouver % families with at least one person receiving social assistance, all families with children under 6 Source: Taxfiler Percent of families receiving social assistance, lone parent families with children under 18 and with children under 6, 2005 to Victoria-Fraserview % families receiving social assistance, lone parent families with children under 18 Vancouver % families receiving social assistance, lone parent families with children under 6 Source: Taxfiler 12
13 Percent of families Percent of families Families Receiving Employment Insurance Income Percent of families with at least one person with Employment Insurance income, all families with children under 18 and with children under 6, 2005 to Victoria-Fraserview % families with at least one person with Employment Insurance income, all families with children under 18 Vancouver % families with at least one person with Employment Insurance income, all families with children under 6 Source: Taxfiler Percent of families with Employment Insurance income, lone parent families with children under 18 and with children under 6, 2005 to 2015 Victoria-Fraserview Vancouver % families with Employment Insurance income, lone parent families with children under 18 % families with Employment Insurance income, lone parent families with children under 6 Source: Taxfiler 13
14 Percent of couples GENDER-RELATED INCOME PATTERNS IN OPPOSITE-SEX COUPLES Percent female contribution to total income, opposite-sex couples with children under 18, and with children under 6, 2005 to 2015 Victoria-Fraserview Vancouver % female contribution to total income, opposite-sex couples with children under 18 % female contribution to total income, opposite-sex couples with children under 6 Source: Taxfiler 14
15 Percent of couples Percent of couples Employment income by gender, opposite-sex couples with children under 18, 2005 to no employment income male only employment income female only employment income both with employment income Victoria-Fraserview Vancouver Source: Taxfiler Employment income by gender, opposite-sex couples with children under 6, 2005 to no employment income male only employment income female only employment income both with employment income Victoria-Fraserview Vancouver Source: Taxfiler 15
16 Percent of families Percent of families POVERTY / LOW INCOME Percent of families below the after-tax Low Income Measure, all families with children under 18 and with children under 6, 2005 to 2015 Victoria-Fraserview Vancouver % families below the after-tax Low Income Measure, all families with children under 18 % families below the after-tax Low Income Measure, all families with children under 6 Source: Taxfiler Percent of families below the after-tax Low Income Measure, lone parent families with children under 18 and with children under 6, 2005 to 2015 Victoria-Fraserview Vancouver % families below the after-tax Low Income Measure, lone parent families with children under 18 % families below the after-tax Low Income Measure, lone parent families with children under 6 Source: Taxfiler 16
17 Percent of families Percent of families Percent of families below half of the after-tax Low Income Measure, all families with children under 18 and with children under 6, 2005 to 2015 Victoria-Fraserview Vancouver % families below half of the aftertax Low Income Measure, all families with children under 18 % families below half of the aftertax Low Income Measure, all families with children under 6 Source: Taxfiler Percent of families below half of the after-tax Low Income Measure, lone parent families with children under 18 and with children under 6, 2005 to 2015 Victoria-Fraserview Vancouver % families below half of the after-tax Low Income Measure, lone parent families with children under 18 % families below half of the after-tax Low Income Measure, lone parent families with children under 6 Source: Taxfiler 17
18 INCOME INEQUALITY Gini Coefficient One common way of measuring distribution of income in a population is the Gini Coefficient, named after the Italian statistician who developed it in The values of the Gini Coefficient range from 0 to 1, where 0 represents the situation where everyone in the population has exactly the same income, and 1 represents the situation where only one person in the population has all of the income. Therefore, the higher the Gini Coefficient, the more income inequality there is in the population. People who live in places with higher levels of income inequality tend to have higher rates of poor health and social outcomes. Gini Coefficient, all families with children under 18 and with children under 6, 2005 to 2015 Victoria-Fraserview Vancouver Gini Coefficient, all families with children under 18 Gini Coefficient, all families with children under 6 Source: Taxfiler 18
19 Gini Coefficient, lone parent families with children under 18 and with children under 6, 2005 to 2015 Victoria-Fraserview Vancouver Gini Coefficient, lone parent families with children under 18 Gini Coefficient, lone parent families with children under 6 Source: Taxfiler 19
20 Percent of population LANGUAGE Percent with a non-english mother tongue, 2006 to % non-english mother tongue Victoria-Fraserview Vancouver Victoria-Fraserview: Top Ten * Non-English Mother Tongues, 2006 to Cantonese 25% 28% 38% Tagalog 4% 5% 6% Punjabi 6% 5% 5% Mandarin 4% 4% 5% Vietnamese 3% 3% 3% Spanish 2% 1% 1% Hindi 1% 2% 1% Chinese, not specified 20% 16% 1% Japanese <1% <1% 1% Italian 1% 1% 1% *Top ten as of
21 Percent of population Percent not speaking English at home, 2006 to % not speaking English at home Victoria-Fraserview Vancouver Victoria-Fraserview: Top Ten * Non-English Languages Spoken at Home, 2006 to Cantonese 21% 25% 29% Mandarin 3% 3% 4% Punjabi 4% 4% 3% Tagalog 3% 3% 3% Vietnamese 2% 3% 2% Spanish 1% 1% 1% Chinese, not specified 15% 11% <1% Hindi 1% 1% <1% Portuguese <1% <1% <1% Min Nan <1% <1% <1% *Top ten as of
22 Percent of population Percent with conversational knowledge of official languages, 2006 to English French Non-official language only Victoria-Fraserview Vancouver Victoria-Fraserview: Top Ten * Languages, Ability to Hold a Conversation, 2006 to English 87% 84% 84% Cantonese 27% 34% 43% Mandarin 10% 9% 13% Tagalog 5% 7% 9% Punjabi 7% 6% 7% Vietnamese 3% 3% 4% French 4% 4% 3% Hindi 4% 3% 3% Spanish 3% 2% 2% Italian 1% 1% 1% Chinese, not specified 21% 13% 1% *Top ten as of 2016 Chinese, not specified category less used in 2016 than previously 22
23 South Asian Chinese Black Filipino Latin American Arab Southeast Asian West Asian Korean Japanese Other Multiple Percent of population Percent of population VISIBLE MINORITIES Percent visible minorities overall, 2006 to Victoria-Fraserview Vancouver Percent various visible minorities, 2016 Victoria-Fraserview Vancouver
24 Percent of population IMMIGRATION Percent of population that are immigrants, 2006 to Victoria-Fraserview Vancouver Number of Immigrants, All Vancouver Neighbourhoods, 2006 to 2016 Neighbourhood University Lands 5,080 6,205 6,870 West Point Grey 4,000 4,380 4,785 Kitsilano 10,695 10,520 11,580 Mount Pleasant 8,495 8,030 9,095 Strathcona 5,305 4,030 3,875 Grandview-Woodland 8,905 8,035 7,715 Hastings-Sunrise 16,930 16,160 15,305 Renfrew-Collingwood 29,555 29,175 28,710 Kensington-Cedar Cottage 24,230 23,710 22,535 Cambie-Riley Park 11,420 11,120 10,270 Shaughnessy/Arbutus-Ridge 11,625 12,120 11,265 Dunbar-Southlands 6,955 7,250 7,960 Kerrisdale 6,520 6,785 6,675 Oakridge 7,715 7,930 7,715 Sunset 21,415 21,405 20,160 Victoria-Fraserview 17,965 17,725 18,160 Killarney 15,345 14,795 15,120 Fairview 8,705 8,890 9,560 Marpole 13,610 13,365 13,105 Downtown 19,315 22,530 26,380 West End 12,350 11,005 13,155 Vancouver Total 266, , ,995 24
25 Percent of immigrants Victoria-Fraserview: Top Ten * Immigrants Place of Birth, Percent of All Immigrants, 2011 and China 39% 37% Hong Kong 19% 15% Philippines 12% 15% India 6% 7% Viet Nam 6% 6% Taiwan 1% 2% Italy 2% 1% United Kingdom 1% 1% El Salvador 1% 1% Japan 1% 1% *Top ten as of 2016 Immigrants, by generation status, 2011 and % first generation immigrants % second generation immigrants % third or more generation immigrants Victoria-Fraserview Vancouver Note: 2006 not included, since the reference population in 2006 (those aged 15 plus) was different than later censuses 25
26 Immigrants: Percent by admission category, % 20% 40% 60% 80% 100% Victoria-Fraserview Vancouver Vancouver Victoria-Fraserview Economic Family-sponsored Refugee Other
27 Percent of population INDIGENOUS POPULATION Victoria-Fraserview: Number with Indigenous Identity, Overall and by Category Overall First Nations Métis Inuk/Inuit Multiple Indigenous identities Other identities Percent with Indigenous identity, 2006 to Victoria-Fraserview 2.1 Vancouver
28 Percent of population aged 25 to 64 EDUCATION Victoria-Fraserview: Number, by Highest Educational Attainment for Those Aged 25 to 64 Number No high school graduation 2,570 2,895 2,590 High school graduation or equivalent 4,440 4,225 5,005 Post-secondary credential 8,510 9,560 9,210 Percent by highest educational attainment for those aged 25 to 64, 2006 to %, no high school graduation % high school graduation % post-secondary credential Victoria-Fraserview Vancouver
29 OCCUPATIONS Victoria-Fraserview: Number, Each National Occupation Classification (NOC) Category, 2006 to Management 1,130 1,475 1,225 Business, finance and administration 2,835 2,785 2,450 Natural and applied sciences 1, Health ,000 Education, law, social, community & gov t services 850 1,040 1,250 Art, culture, recreation and sport Sales and service 4,450 4,940 5,505 Trades, transport and equipment operators 1,615 1,470 2,010 Natural resources, agriculture and related Manufacturing and utilities 1, Victoria-Fraserview: Percent, Each National Occupation Classification (NOC) Category, 2006 to Management Business, finance and administration Natural and applied sciences Health Education, law, social, community & gov t services Art, culture, recreation and sport Sales and service Trades, transport and equipment operators Natural resources, agriculture and related Manufacturing and utilities
30 Percent of dwellings SHELTER Dwelling Types, 2006 to % detached houses % apartments 5+ floors % apartments under 5 floors % duplexes Victoria-Fraserview Vancouver Note: Some relatively rare dwelling types not included (e.g., row housing) Home ownership and housing stress *, 2006 to % dwellings that are owned % owners with housing stress % tenants with housing stress Victoria-Fraserview Vancouver *Housing stress means that an owner or tenant spends 30% or more of income on shelter costs 30
31 Home value (2016 $) Average monthly costs of renting and owning (2016 dollars), 2006 to 2016 $1,800 $1,600 $1,400 $1,200 $1,000 $800 $600 $400 $200 $ Average monthly costs of renting Average monthly costs of owning Victoria-Fraserview $993 $921 $1,064 $1,195 $1,232 $1,456 Vancouver $1,065 $1,174 $1,317 $1,414 $1,538 $1,681 Average home value (2016 dollars), 2006 to 2016 Victoria-Fraserview Vancouver $1,600,000 $1,400,000 $1,200,000 $1,441,615 $1,278,340 $1,000,000 $800,000 $600,000 $700,389 $890,907 $680,526 $907,522 $400,000 $200,000 $
32 Percent of population aged 15 plus Percent of population aged 15 plus LABOUR FORCE PARTICIPATION AND UNEMPLOYMENT Labour force participation, age 15 plus, 2006 to Victoria-Fraserview Vancouver Unemployment rate, age 15 plus, 2006 to Victoria-Fraserview 9.4 Vancouver Percent of Working Population with Full-Year, Full-Time Employment, 2016 Victoria-Fraserview: 46.1% Vancouver: 48.8% Percent of Working Population Who Work in the City of Vancouver, 2016 Victoria-Fraserview: 56.4% Vancouver: 68.7% 32
33 Percent of population RESIDENTIAL MOBILITY Percent who have moved in the past year, and in the past five years, 2006 to % moved in past 1 year % moved in the past 5 years Victoria-Fraserview Vancouver
34 HELP SES INDEX The HELP SES Index is a composite of seven census and taxfiler variables (see below) that together are particularly strong in accounting for the differences in EDI vulnerability rates across the province. The Index is set to an arbitrary value of 100 for the province in The HELP SES Index provides one overall SES number that can be used to show changes in SES over time, or to compare neighbourhoods at one point in time. Victoria-Fraserview: Components of the HELP SES Index, 2006 to % without a high school diploma % not speaking either English or French at home % lone parent families % below after-tax Low Income measure, families with children under % reporting investment income, families with children under % with total incomes at least twice the provincial median, families with children under % below after-tax Low Income measure, lone parent families with children under and Taxfiler HELP SES Index, 2006 to SES Index Victoria-Fraserview Vancouver British Columbia and Taxfiler 34

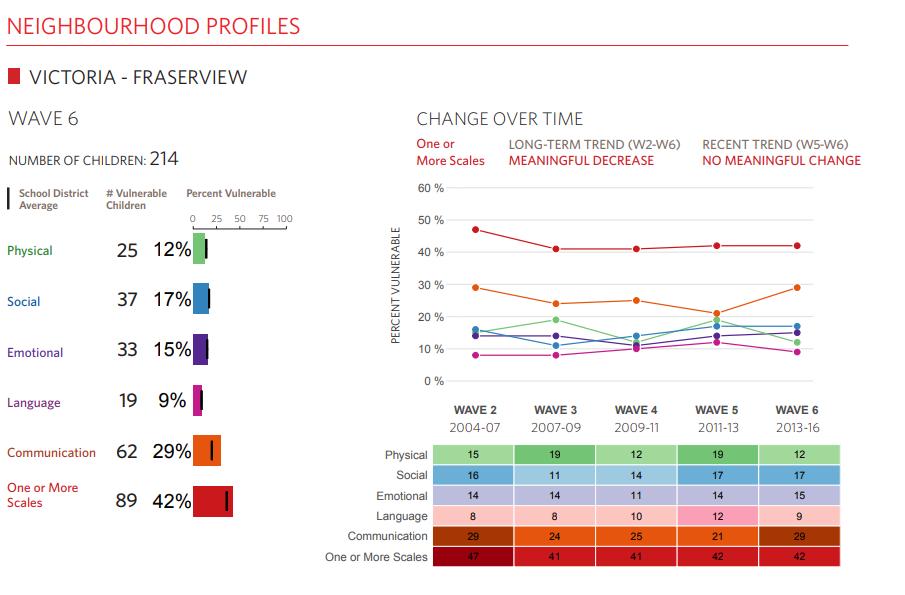
35 EDI TRENDS Links: Vancouver Community Profile Vancouver Subscales Report Data Library page with Excel file with all EDI scales for Waves 2 to 6 35
36 36
37 37
38 38
39 39
40 40
41 41
42 42
")
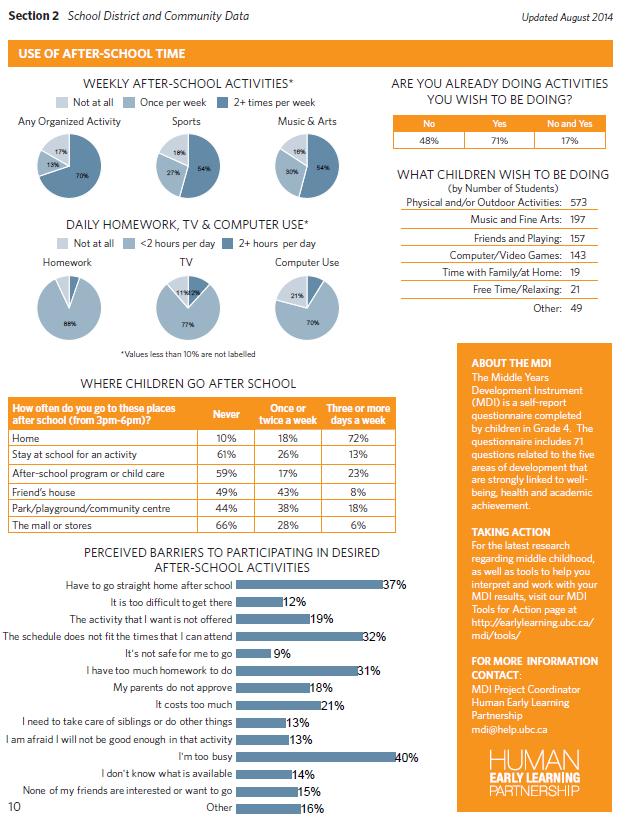
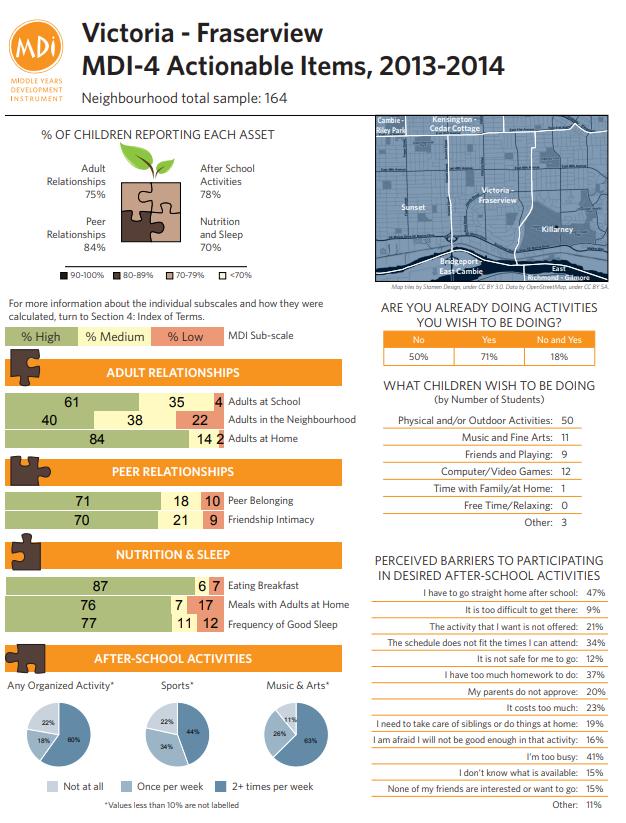
43 MDI TRENDS MDI Grade 4 (2014) Link: Vancouver Grade 4 MDI Report (2014) 43
44 44
45 45
46 MDI Grade 7 (2018) Link: Vancouver Grade 7 MDI Report (2018) 46
47 47
48 48
49 HEALTH-RELATED DATA FOR VANCOUVER My Health, My Community My Health My Community is a web-based health and wellness survey that gives residents the opportunity to help influence their community s health priorities. This innovative new initiative was created through a joint partnership between Vancouver Coastal Health, Fraser Health and the UBC Faculty of Medicine ehealth Strategy Office. The survey asks people, aged 18 and up who live in the Vancouver Coastal Health and Fraser Health regions, to provide information about their health, lifestyle choices, community involvement and neighbourhood characteristics. This information will help us improve future community programs and services that are more relevant to your health and wellness needs. Link to My Health, My Community Link to Vancouver Community Health Profile Births and Low Birth Rate Number and Percent of Births in Vancouver by Age of Mother, 2015/16 to 2017/18 Age of mother 2015/ / /18 Number Percent Number Percent Number Percent Total Source: BC Vital Statistics Agency 49
50 Number and Rate of Live Births and Low Birth Weight, 2011 to 2015, by Community Health Areas Live Births Low Birth Weight Number Rate 1 Number Rate 2 City Centre Downtown Eastside North East West Side Midtown South Vancouver Vancouver Overall Source: BC Vital Statistics Agency 1 Per 1,000 in the population 2 Per 1,000 live births Immunization Two-year-old Immunization Coverage Rates, Vancouver, 2003 to 2012 Up-to-date for age: % % % % Source: Vancouver Coastal Health Authority 50
51 FAMILY-FRIENDLY RESOURCES IN VANCOUVER Early Childhood Education and Care Victoria-Fraserview: Child Care Facilities (as of December 2018) Number of Licensees by Type Licence Type Number Group Care, Infant/Toddler 0 Group Care, 30 months to school age 4 Group Care, School age 7 Preschool 7 Occasional care 1 Licensed family child care 12 Registered licence-not-required child care 3 In-home multi-age child care 3 Details for All Centre-based Licensees Name Licence Type Legal Status Licensed Capacity Brain-Bridge Asian Learning Centre Preschool (30mths - School Age) For Profit 20 Brainbridge Bilingual Education & Fine Arts Preschool (30mths - School Centre Age) For Profit 20 Douglas YMCA Kids Club Group Care School Age Non-Profit 48 Fraserview Montessori Preschool and Preschool (30mths - School Kindergarten Age) For Profit 20 Good Shepherd Day Care Group Daycare (30mths - School Age) Non-Profit 20 Jasper Crescent Day Care Centre Group Daycare (30mths - School Age) Non-Profit 25 Jasper Crescent Out of School Care Group Care School Age Non-Profit 30 Kids Care Preschool Preschool (30mths - School Age) Non-Profit 30 Language Program - Collingwood Neighbourhood House Occasional Child Care Non-Profit 24 New Hope Childcare (3-5 Program) Group Daycare (30mths - School Age) Non-Profit 20 New Hope Out of School Care Group Care School Age Non-Profit 30 Pomme d' Api Preschool Preschool (30mths - School Age) Non-Profit 20 Poppins Preschool Preschool (30mths - School Age) Non-Profit 20 51
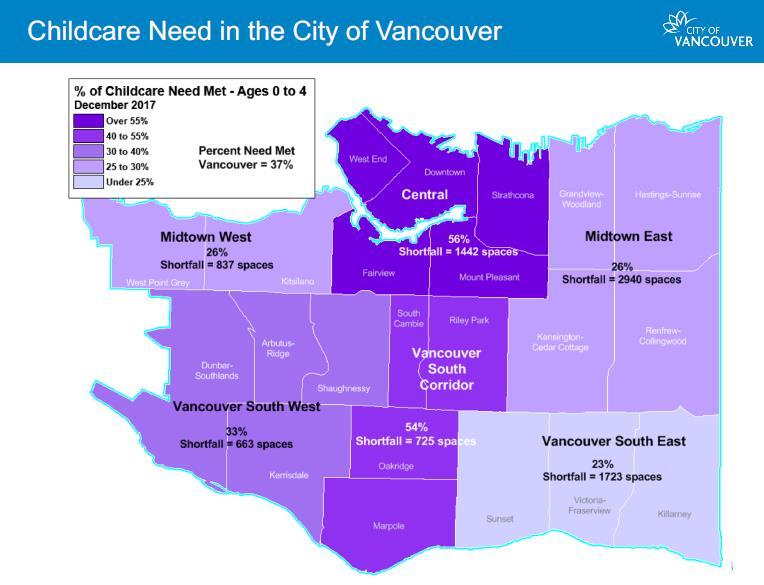
52 South Van NBH House Out of School Care Group Care School Age Non-Profit 40 South Vancouver Community Montessori Group Daycare (30mths - Daycare School Age) For Profit 20 Spare Time Bobolink Group Care School Age Non-Profit 92 Spare Time Challenge Club Group Care School Age Non-Profit 60 Twinkle Stars Preschool Preschool (30mths - School Age) For Profit 20 Waverley School-Age Care Group Care School Age Non-Profit 20 Child Care Need in City of Vancouver, as of December
53 53
54 54
55 55

56 Community Centres None in Victoria-Fraserview Link to All Community Centres in Vancouver 56

57 Family Resource Programs South Vancouver Family Place 7710 Nanaimo Street Link to All Family Resource Programs in Vancouver Neighbourhood Houses South Vancouver Neighbourhood House 6470 Victoria Drive All Neighbourhood Houses in Vancouver 57

58 StrongStart Centres Douglas Elementary Room Brigadoon Avenue Waverley Elementary Room Elliott Street Link to All StrongStart Centres in Vancouver 58

59 Public Libraries VPL, Fraserview Branch 1950 Argyle Drive Link to All Public Libraries in Vancouver 59

60 Parks Bobolink Park 2510 Hoylake Avenue Fraserview Park 7595 Victoria Drive Gladstone-Riverside Park 2500 East Kent Street South Gordon Park 6675 Commercial Street Humm Park 7250 Humm Street Nanaimo Park 2390 East 46 th Avenue Tecumseh Park 1751 East 45 th Avenue Link to All Parks in Vancouver 60

61 Public Schools All Schools and Catchment Areas Link to Map Below 61
62 City of Vancouver Neighbourhood Profile Link to Profile for Victoria-Fraserview Neighbourhood 62
Vancouver Demographic Report Shaughnessy/Arbutus-Ridge
 Vancouver Demographic Report Shaughnessy/Arbutus-Ridge January 2019 The Vancouver Early Years Partnership (VEYP) and the Human Early Partnership (HELP) collaborated on a research project to produce detailed
Stoney Creek Neighbourhood Profile
 Stoney Creek Profile For further information contact: John-Paul Sousa Planning Research Analyst Direct: (519) 661-2500 ext. 5989 I email: jpsousa@london.ca Page 1 Page 2 Population Characteristics & Age
Huron Heights Neighbourhood Profile
 Huron Heights Neighbourhood Profile For further information contact: John-Paul Sousa Planning Research Analyst Direct: (519) 661-2500 ext. 5989 I email: jpsousa@london.ca Page 1 Page 2 Population Characteristics
Jackson Neighbourhood Profile
 Jackson Profile For further information contact: John-Paul Sousa Planning Research Analyst Direct: (519) 661-2500 ext. 5989 I email: jpsousa@london.ca Page 1 Page 2 Population Characteristics & Age Distribution
Westminster Neighbourhood Profile
 Westminster Profile For further information contact: John-Paul Sousa Planning Research Analyst Direct: (519) 661-2500 ext. 5989 I email: jpsousa@london.ca Page 1 Page 2 Population Characteristics & Age
Southcrest Neighbourhood Profile
 Southcrest Neighbourhood Profile For further information contact: John-Paul Sousa Planning Research Analyst Direct: (519) 661-2500 ext. 5989 I email: jpsousa@london.ca Page 1 Page 2 Population Characteristics
Central London Neighbourhood Profile
 Central London Neighbourhood Profile For further information contact: John-Paul Sousa Planning Research Analyst Direct: (519) 661-2500 ext. 5989 I email: jpsousa@london.ca Page 1 Page 2 Population Characteristics
Hamilton Road Neighbourhood Profile
 Hamilton Road Neighbourhood Profile For further information contact: John-Paul Sousa Planning Research Analyst Direct: (519) 661-2500 ext. 5989 I email: jpsousa@london.ca Page 1 Page 2 Population Characteristics
East London Neighbourhood Profile
 East London Neighbourhood Profile For further information contact: John-Paul Sousa Planning Research Analyst Direct: (519) 661-2500 ext. 5989 I email: jpsousa@london.ca Page 1 Page 2 Population Characteristics
Fox Hollow Neighbourhood Profile
 Fox Hollow Profile For further information contact: John-Paul Sousa Planning Research Analyst Direct: (519) 661-2500 ext. 5989 I email: jpsousa@london.ca Page 1 Page 2 Population Characteristics & Age
University Of Maryland
 2000 Census Census Data 200 Census Change 2000 to 200 SUBJECT Number Percent SUBJECT Number Percent Number Percent TOTAL POPULATION 437 TOTAL POPULATION 246-9 -43.7 White 283 64.8 White 65 67. -8-4.7 Black
Five Ways the 2016 Census Affects Marketers
 Five Ways the 2016 Census Affects Marketers February 15, 2018 Dr. Doug Norris Senior Vice President and Chief Demographer Rupen Seoni Senior Vice President and Practice Leader Today s presenters Dr. Doug
Community Social Profile Wellesley, Wilmot and Woolwich
 Community Trends for 2013 in Cambridge, North Dumfries, Wellesley, Wilmot and Woolwich Community Social Profile - Wellesley, Wilmot and Woolwich Published December 2014 Community Social Profile Wellesley,
nipigon.net Township of Nipigon 2018 Community Profile
 nipigon.net Township of Nipigon V 1.0 February 2018 2018 Nipigon nipigon.net nipigon.net Township of Nipigon nipigon.net Township of Nipigon nipigon.net Township of Nipigon nipigon.net Township of Nipigon
2011 Census Profile for Loxley CP with Stratford included as a comparison geography
 Demography Number Percentage Rank () Number Percentage Rank (5) Demography Number Percentage Rank () Number Percentage Rank (5) Total Population 399 N/A 120,485 3 Males 198 49.6% N/A 58,497 48.6% 5 Females
Joint Strategic Needs Assessment (JSNA) Picture of Lewisham 2018
 Picture of Lewisham 2018") Joint Strategic Needs Assessment (JSNA) Picture of Lewisham 2018 Lewisham s Population Lewisham is the 13 th largest borough in London by population size and the 5 th largest in Southwark Inner London
Joint Strategic Needs Assessment (JSNA) Picture of Lewisham 2018 Lewisham s Population Lewisham is the 13 th largest borough in London by population size and the 5 th largest in Southwark Inner London
Oakmont: Who are we?
 Oakmont: Who are we? A Snapshot of our community from the April 2010 US Census Contents Age and Gender... 1 Marital Status... 2 Home Ownership and Tenure... 3 Past Demographic Characteristics... 5 Income
WOMEN IN THE NWT - SUMMARY
 In 16, 44,469 people lived in the Northwest Territories (NWT) with females accounting for just under half (49%) of the population. The NWT population consists of almost equal numbers of Indigenous (First
An Overview of the Canadian Labour Market
 An Overview of the Canadian Labour Market ECO339Y Department of Economics University of Toronto 2006/2007 Table 1 Percentage of Selected Groups in Low Income, After Tax (92 LICOs Base), Canada 1980-2003
GOV ER N ME NT OF BE RMUDA Cabinet Office Department of Statistics BERMUDA DIGEST OF STATISTICS
 GOV ER N ME NT OF BE RMUDA Cabinet Office Department of Statistics 017 BERMUDA DIGEST OF STATISTICS BERMUDA DIGEST OF STATISTICS 2017 No. 40 (figures up to and including 2016 when available) Cedar Park
2016 Census of Agriculture Results
 5.2 2016 Census of Agriculture Results Theresa Duynstee REGIONAL PLANNER, PARKS, PLANNING AND ENVIRONMENT Regional Planning Committee September 8, 2017 2016 Census of Agriculture Products 2 Census of Agriculture
Not For Sale. An American Profile: The United States and Its People
 An American Profile: The United States and Its People Not For Sale 1 759_EM_AmPro_ptg1.indd 1 Not For Sale 759_EM_AmPro_ptg1.indd 2 An American Profile: The United States and Its People 3 Table 1 Population,
Community Outreach Resource Center
 Community Outreach Resource Center Tier 1 Report: Gillespie County Child & Adolescent Health Child Abuse Rates in Gillespie County 23 7 Gillespie County Children Living in Poverty 23 7 Rate per 1, 14.
In 2018 a total of 56,127 students received an ATAR, 934 fewer than in The gender balance was similar to 2017.
 ATAR 2018 Preliminary report on the Scaling of the 2018 NSW Higher School Certificate This preliminary report has been prepared to provide some information on the calculation of the Australian Tertiary
2018 Citizen Perspectives Survey Report
 ISC: UNRESTRICTED ATTACHMENT 2 OPC2018-0977 2018 Citizen Perspectives Survey Report August 21, 2018 Presented by the Corporate Research Team Customer Service & Communications The City of Calgary Methodology
May 5, 2009 File:
 MMM Group Limited Suite 600 1455 West Georgia Street Vancouver, BC V6G 2T3 t: 604-685-9381 f: 604-683-8655 www.mmm.ca May 5, 2009 File: 50-09001-007 1420 1055 West Hastings Street Vancouver, BC V6E 2E9
FULL PROFILE Census, 2018 Estimates with 2023 Projections Calculated using Weighted Block Centroid from Block Groups Realm Realty Lat/Lon: 3
 FULL PROFILE 2000-2010 Census, 2018 Estimates with 2023 Projections Calculated using Weighted Block Centroid from Block Groups Realm Realty Lat/Lon: 30.0027/-90.1613 RF1 Lakeside Shopping Center Metairie,
An American Profile: The United States and Its People
 An American Profile: The United States and Its People 1 153641_EM_AmPro.indd 1 12/16/8 11:1:32 PM An American Profile: The United States and Its People 3 Table 1 Population, Percentage Change, and Racial
Residential Demographic Multipliers
 Rutgers University, Center for Urban Policy Research Residential Demographic Multipliers Estimates of the Occupants of New Housing (Residents, School-Age Children, Public School-Age Children) by State,
Key Ward Information - Cowes South and Northwood (part of the Cowes cluster of wards)
") Key Ward Information - Cowes South and Northwood - 2017 (part of the Cowes cluster of wards) This report has been designed to support provide data and information about Cowes South and Northwood and compare
Key Ward Information - Cowes South and Northwood - 2017 (part of the Cowes cluster of wards) This report has been designed to support provide data and information about Cowes South and Northwood and compare
Social Development Index 2018 ( )
") Social Development Index 2018 (23-5-2018) Social Development Index 2018 Introduction to Social Development Index Introduction to Social Development Index (SDI) A system of objective indicators including:
Social Development Index 2018 (23-5-2018) Social Development Index 2018 Introduction to Social Development Index Introduction to Social Development Index (SDI) A system of objective indicators including:
The Quality of Life of the People in Norway
 1 Example Report The Quality of Life of the People in Norway The Management Institute for Quality-of-Life Studies December 2018 2 Introduction This report provides a detailed picture of the quality of
CLOSED. The draft concept design has been broken down into 5 categories for the purpose of this survey:
 Old Strathcona s neighbourhood renewal process is now at the draft concept design phase. Over the last several months, the city has been gathering local knowledge and resident input that has been used
REPORT OF THE ENGINEERING & PLANNING DEPARTMENT PLANNING DIVISION
 REPORT OF THE ENGINEERING & PLANNING DEPARTMENT PLANNING DIVISION 2008 09 22 TO: Mayor John Rowswell and Members of City Council SUBJECT: Official Plan Review 2008 Part 1 - Population and Household Projections
2009 Master Plan & Reexamination Report Verona, New Jersey
 2009 Master Plan & Reexamination Report Verona, New Jersey MASTER PLAN TOWNSHIP OF VERONA, NEW JERSEY PREPARED FOR THE PLANNING BOARD OF THE TOWNSHIP OF VERONA, NJ PREPARED BY KASLER ASSOCIATES, PA 34
Pocatello Regional Transit Master Transit Plan Draft Recommendations
 Pocatello Regional Transit Master Transit Plan Draft Recommendations Presentation Outline 1. 2. 3. 4. What is the Master Transit Plan? An overview of the study Where Are We Today? Key take-aways from existing
Michigan Population Trends: The School Age Population
 Michigan Population Trends: The School Age Population Eric Guthrie Michigan s State Demographer January 16, 2018 State Demographer Michigan s liaison with the U.S. Census Bureau for most programs including
Re: Algae/Cyanobacteria Bloom in St. Lucie, Martin, Palm Beach and Lee Counties.
 July 18, 2016 Richard L. Scott Governor, State of Florida 400 S Monroe St Tallahassee, FL 32399 Re: Algae/Cyanobacteria Bloom in St. Lucie, Martin, Palm Beach and Lee Counties. Dear Governor Scott: I am
Canton, Carrolton & Wooster Seventh-day Adventist Churches. A survey report from Monte Sahlin Ohio Conference March 2013
 Canton, Carrolton & Wooster Seventh-day Adventist Churches A survey report from Monte Sahlin Ohio Conference March 2013 Goals of this Study n Profile the spiritual life and vitality of each congregation
NYC Pedestrian Safety Study & Action Plan. Research, Implementation & Safety Division of Traffic Operations
 NYC Pedestrian Safety Study & Action Plan Research, Implementation & Safety Division of Traffic Operations 1 Introduction DOT Safety GOAL Strategic Plan: Reduce Fatalities by 50% by 2030 From 274 (2007)
FOR LEASE HARMS ROAD INDUSTRIAL PARK Harms Road, Houston Texas 77041
 FOR LEASE HARMS ROAD INDUSTRIAL PARK 7206-7214 Harms Road, Houston Texas 77041 Property Statistics: Single-tenant Industrial Park Tilt wall construction with stone facade Crane ready Heavy power, grade
OAKRIDGE CENTRE RETAIL IMPACT ASSESSMENT
 OAKRIDGE CENTRE RETAIL IMPACT ASSESSMENT Coriolis Consulting Corp. and Site Economics Ltd. June 2013 Objectives 1. Evaluate risk of material decline in viability of existing commercial locations in City
2017 Nebraska Profile
 2017 Nebraska Profile State, 9 NEW Regions, 93 Counties, plus 31 Cities Three Volumes Demographic Change in the State Economic Influences at Work Housing Statistics and Trends Summary of Findings Discuss
Copyright 2014 April 2-14, Interviews Rockefeller Millennials Survey 5802 Margin of Error: +/- 3.7%
 Copyright 2014 April 2-14, 2014 703 Interviews Rockefeller Millennials Survey 5802 Margin of Error: +/- 3.7% S1. Are you at least 18 years old? Yes... 100% No/Don't know/refused... - D101. What is your
UNITED NATIONS MALAWI DELIVERING TOGETHER FOR MALAWI
 UNITED NATIONS MALAWI DELIVERING TOGETHER FOR MALAWI Resident Entities (Agencies, Funds and Programmes) Foreword... 2 Introduction... 4 United Nations in Malawi... 5 United Nations Development Assistance
WORLD. Geographic Trend Report for GMAT Examinees
 2012 WORLD Geographic Trend Report for GMAT Examinees WORLD Geographic Trend Report for GMAT Examinees The World Geographic Trend Report for GMAT Examinees identifies mobility trends among candidates applying
Town of Whitby Official Plan Review OVERVIEW
 Town of Whitby Official Plan Review Presentation at Special Meeting of Council Whitby (Municipal Building) November 28 th, 2007 Brooklin (St. Thomas Anglican Church) December 6 th, 2007 OVERVIEW What is
2016 Census: Release 2 Age, Sex, Dwelling types
 2016 Census: Release 2 Age, Sex, Dwelling types Dr. Doug Norris Senior Vice President and Chief Demographer May 11, 2017 Agenda A look at major age sex trends National Provincial/territorial Urban and
A Profile of Plaistow South Big Local Area
 A Profile of Plaistow South Big Local Area DRAFT2 GENERAL DESCRIPTION Plaistow South Big Local is situated in the London Borough of Newham, in east London. It is comprised of 5 of the 8 Local Super Output
Characteristics of the Labor Force - Poteau Area
 Not Not Number of respondents 275 42 614 71 543 391 55 Estimated Adults 21,257 2,956 47,302 5,554 41,747 29,188 3,881 Males 54.5 30.2 54.1 51.6 54.4 38.8 29.4 Females 45.5 69.8 45.9 48.4 45.6 61.2 70.6
Figure 1a. Top 1% income share: China vs USA vs France
 22% 20% 18% 16% Figure 1a. Top 1% income share: China vs USA vs China USA 14% 12% 10% 8% 6% 4% 1978 1982 1986 1990 1994 1998 2002 2006 2010 2014 Distribution of pretax national income (before taxes and
2020 K Street NW, Suite 410 Washington, DC (202)
") 2020 K Street NW, Suite 410 Washington, DC 20006 (202) 463-7300 Interview dates: October 24 25, 2013 Interviews: 1,008 adults CONDUCTED BY IPSOS PUBLIC AFFAIRS These are findings of an Ipsos online poll
2020 K Street NW, Suite 410 Washington, DC 20006 (202) 463-7300 Interview dates: October 24 25, 2013 Interviews: 1,008 adults CONDUCTED BY IPSOS PUBLIC AFFAIRS These are findings of an Ipsos online poll
Distributional National Accounts: Methods and Estimates for the United States
 Distributional National Accounts: Methods and Estimates for the United States Thomas Piketty (PSE) Emmanuel Saez (UC Berkeley) Gabriel Zucman (UC Berkeley) November 2016 There is a large disconnect today
HEALTH INSURANCE COVERAGE STATUS American Community Survey 1-Year Estimates
 S2701 HEALTH INSURANCE COVERAGE STATUS 2014 American Community Survey 1-Year Estimates Supporting documentation on code lists, subject definitions, data accuracy, and statistical testing can be found on
Synthetic Turf Playing Field New Site Options. Park Board Committee Meeting October 2, 2017
 Synthetic Turf Playing Field New Site Options Park Board Committee Meeting October 2, 2017 Index 1. Recommendation 2. Background: Strategic Alignment 3. Background: Synthetic Turf Field Facts 4. Background:
Texas Housing Markets: Metropolitan vs. Border Communities. September 22, 2014
 Texas Housing Markets: Metropolitan vs. Border Communities Luis Bernardo Torres Ruiz, Ph.D. Research Economist El Paso Branch Dallas Federal Rio Grande Economic Association September 22, 2014 Contents
Ector County I.S.D. Demographic Update
 Ector County I.S.D. Demographic Update April 2017 E.C.I.S.D. Demographic Trends Employment Trends Housing Projections Ratios: Students per Household Projected Student Enrollment 2 1 Numeric Change in Student
Rochester Area Bike Sharing Program Study
 roc bike share Rochester Area Bike Sharing Program Study Executive Summary ~ January 2015 JANUARY 2015 8484 Georgia Avenue, Suite 800 Silver Spring, MD 20910 3495 Winton Pl., Bldg E, Suite 110 Rochester,
Physical activity has a number of benefits
 Health Policy Brief September 2018 Walking Among California Adults Susan H. Babey, Joelle Wolstein, and Allison L. Diamant SUMMARY: This policy brief describes two types of walking among California adults:
Bicycle Helmet Use Among Winnipeg Cyclists January 2012
 Bicycle Helmet Use Among Winnipeg Cyclists January 2012 By: IMPACT, the injury prevention program Winnipeg Regional Health Authority 2 nd Floor, 490 Hargrave Street Winnipeg, Manitoba, R3A 0X7 TEL: 204-940-8300
Lewisham Pharmaceutical Needs Assessment Appendix B - Lewisham The Place
 Lewisham Pharmaceutical Needs Assessment 2018 Appendix B - Lewisham The Place Lewisham is the 13 th largest borough in London by population size and the 5 th largest in Southwark Inner London Source: MYE
Gambling Involvement and Problem Gambling in Manitoba. April 2002
 Gambling Involvement and Problem Gambling in Manitoba April 2002 Gambling Involvement and Problem Gambling in Manitoba April 2002 Addictions Foundation of Manitoba David Patton, PhD David Brown, PhD Jastej
Kävlinge. Fjelie. Flädie. Bjärred. Lund. Lommabukten. Staýanstorp. Lomma. Burlöv. Malmö
 Kävlinge Flädie Fjelie Bjärred Lund Lommabukten Lomma Staýanstorp Burlöv Malmö 18 MUNICIPAL FACTS 1 GENERAL DESCRIPTION The municipal district of Lomma is located on the Öresund coast, north of the city
THE PHILIPPINE ECONOMY: Recent Performance and Long-Term Outlook. Undersecretary Rolando G. Tungpalan 17 February 2016
 THE PHILIPPINE ECONOMY: Recent Performance and Long-Term Outlook Undersecretary Rolando G. Tungpalan 17 February 2016 Favorable Macroeconomic Trends The Philippines has been on a higher growth trajectory
WHERE ARE ARIZONA DEMOGRAPHICS TAKING US? HOW GROWING SLOWER, OLDER AND MORE DIVERSE AFFECTS REAL ESTATE
 WHERE ARE ARIZONA DEMOGRAPHICS TAKING US? HOW GROWING SLOWER, OLDER AND MORE DIVERSE AFFECTS REAL ESTATE March 2017 Tom Rex Office of the University Economist and Center for Competitiveness and Prosperity
Student Population Projections By Residence. School Year 2016/2017 Report Projections 2017/ /27. Prepared by:
 Student Population Projections By Residence School Year 2016/2017 Report Projections 2017/18 2026/27 Prepared by: Revised October 31, 2016 Los Gatos Union School District TABLE OF CONTENTS Introduction
1. Add your input. Share your ideas on. these Open House boards by using dots or stickies. 2. Talk to us. Park Board staff and the
 Welcome This Open House The Vancouver Board is undertaking public consultation to captu the ideas and thoughts of local sidents, park users and stakeholders. Understanding public values helps the Board
National Association of REALTORS National Smart Growth Frequencies
 September 520, 2017 3,000 Weighted Online Respondents National Association of REALTORS National Smart Growth Frequencies Q.2 The first question is about the quality of life in your community. How satisfied
NYC Pedestrian Safety Study & Action Plan. NYTMC Brown Bag Lunch Presentation December 15, 2010
 NYC Pedestrian Safety Study & Action Plan NYTMC Brown Bag Lunch Presentation December 15, 2010 1 Introduction DOT Safety Goal Strategic Plan: Reduce Fatalities by 50% by 2030 From 274 (2007) to 137 (2030)
Population & Demographics
 Population & Demographics Conditions and Trends When looking at trends in the total number of people living in Windham (population) and at the characteristics of the people who live here by factors such
Content. Research Objectives. A Survey on Gambling Behaviours: Will you become a gambler?
 A Survey on Gambling Behaviours: Will you become a gambler? Prof. Leo Sin Yat-min Prof. Stella So Lai-man Dr. Susanna Kwok Betting Turnover ($million) 2005/06 2004/05 Horse racing 600.5 626.6 Football
Bowling Green, KY Technical Appendices
 Bowling Green, KY Technical Appendices 2018 2955 Valmont Road Suite 300 777 North Capitol Street NE Suite 500 Boulder, Colorado 80301 Washington, DC 20002 n-r-c.com 303-444-7863 icma.org 800-745-8780 Contents
OAKRIDGE + AMENITIES OAKRIDGE CENTRE - ISSUES AND DIRECTIONS
 OAKRIDGE + AMENITIES OAKRIDGE CENTRE - ISSUES AND DIRECTIONS Council Presentation May 29 th, 2013 OAKRIDGE CENTRE REZONING Introduction PURPOSE Awareness of issues related to Oakridge Centre Rezoning Receive
January 2018 Office of Institutional Research and Sponsored Programs 0
 January 2018 Office of Institutional Research and Sponsored Programs 0 Table of Contents Table of Contents... 1 STUDENTS... 2 FTE & HEADCOUNT... 2 Headcount: Undergraduate & Graduate... 3 Headcount: Full
B. Single Taxpayers (122,401 obs.) A. Married Taxpayers Filing jointly (266,272 obs.) Density Distribution. Density Distribution
 A. Married Taxpayers Filing jointly (266,272 obs.) Density Distribution. Density Distribution") A. Married Taxpayers Filing jointly (266,272 obs.) Kink 15/28% at $43,850 B. Single Taxpayers (122,401 obs.) Kink 15/28% at $26,250 Density Distribution Density Distribution $0 $20,000 $40,000 $60,000
A. Married Taxpayers Filing jointly (266,272 obs.) Kink 15/28% at $43,850 B. Single Taxpayers (122,401 obs.) Kink 15/28% at $26,250 Density Distribution Density Distribution $0 $20,000 $40,000 $60,000
PARKS, RECREATION AND CULTURE. Your ad here. Sixteen Mile Sports Complex Video Scoreboard Advertising
 PARKS, RECREATION AND CULTURE Your ad here Sixteen Mile Sports Complex Video Scoreboard Advertising Last updated February 2016 About Oakville Vision: To be the most livable town in Canada According to
1999 On-Board Sacramento Regional Transit District Survey
 SACOG-00-009 1999 On-Board Sacramento Regional Transit District Survey June 2000 Sacramento Area Council of Governments 1999 On-Board Sacramento Regional Transit District Survey June 2000 Table of Contents
Situational Analysis (Final)
") Situational Analysis (Final) City of Kawartha Lakes Office of Economic Development April-17 Table of Contents Kawartha Lakes at a Glance... - 1 - Statistical Highlights... - 3 - Demographics Analysis...
Situational Analysis (Final) City of Kawartha Lakes Office of Economic Development April-17 Table of Contents Kawartha Lakes at a Glance... - 1 - Statistical Highlights... - 3 - Demographics Analysis...
Puget Sound Regional Forecast Chris Mefford Community Attributes
 2015 Puget Sound Regional Forecast Chris Mefford Community Attributes 3 1,000s The Regional Economy has added jobs consistently for nearly 5 full years. In a few months, this will be the longest streak
RANDWICK CITY COUNCIL Residential Discussion Paper SUMMARY DOCUMENT
 RANDWICK CITY COUNCIL Residential Discussion Paper SUMMARY DOCUMENT Residential Discussion Paper Summary Sheet Background Randwick City Council is reviewing our local planning and development controls
2014 Economic Indicators, Trends & Observations. 51 South Main Street Janesville, WI P F RockCountyAlliance.
 2014 Economic Indicators, Trends & Observations 51 South Main Street Janesville, WI 53545 P.608.757.5598 F.608.757.5586 RockCountyAlliance.com Indicators, Trends & Observations National Level State of
Walking in New Zealand May 2013
 May 2013 Walking makes up 13 percent of total time travelled and 16 percent of the number of trip legs. On average women spend more time walking than men, walking 57 minutes per person per week, compared
Bike Share Social Equity and Inclusion Target Neighborhoods
 Bike Share Social Equity and Inclusion Target Neighborhoods Target Neighborhoods West End/Visitation Park/Academy/Hamilton Heights Wellsgoodfellow/Kingsway West The Ville/Greater Ville Kingsway East/Fountain
GOV ER N ME NT OF BE RMUDA Cabinet Office Department of Statistics BERMUDA DIGEST OF STATISTICS
 GOV ER N ME NT OF BE RMUDA Cabinet Office Department of Statistics 015 BERMUDA DIGEST OF STATISTICS BERMUDA DIGEST OF STATISTICS 2015 No. 38 (figures up to and including 2014 when available) Cedar Park
More of the Same; Or now for Something Completely Different?
 More of the Same; Or now for Something Completely Different? C2ER Place cover image here Richard Wobbekind Chief Economist and Associate Dean for Business and Government Relations June 14, 2017 Real GDP
Telling Canada s story in numbers Elizabeth Richards Analytical Studies Branch April 20, 2017
 Recent Developments in the Canadian Economy: How have the decline in oil prices and a weaker Canadian dollar affected Canada s economy? www.statcan.gc.ca Telling Canada s story in numbers Elizabeth Richards
The National Citizen Survey. Bowling Green, KY. Technical Appendices
 The National Citizen Survey Bowling Green, KY Technical Appendices 2014 National Research Center, Inc. Boulder, CO International City/County Management Association Washington, DC Contents Appendix A: Complete
College/high school median annual earnings gap,
 College/high school median annual earnings gap, 1979 2012 In constant 2012 dollars 70,000 dollars Household gap $30,298 to $58,249 60,000 50,000 40,000 Male gap $17,411 to $34,969 30,000 20,000 10,000
Bicycle Helmet Use Among Winnipeg Cyclists 2010
 Bicycle Helmet Use Among Winnipeg Cyclists 2010 IMPACT, the injury prevention program Winnipeg Regional Health Authority NA335-700 McDermot Avenue Winnipeg, Manitoba, R3E 0T2 Phone: (204) 787-1873 September
U.S. Overview. Gathering Steam? Tuesday, October 1, 2013
 U.S. Overview Gathering Steam? Tuesday, October 1, 2013 Uneven global economic recovery Annual real GDP growth projections (%) Projections 2013 2014 World 3.1 3.1 3.8 United States 2.2 1.7 2.7 Euro Area
Housing Market Update
 Housing Market Update Keith Stewart, Senior Market Analyst September 2017 Agenda Economic Fundamentals The Rental Market The Ownership Market 2 New Households drive housing demand 5,000 4,000 3,000 2,000
The TRUTH IN NUMBERS Rennie Group 1 November 2017 Andrew Ramlo, VP Market Intelligence
 The TRUTH IN NUMBERS Rennie Group 1 November 2017 Andrew Ramlo, VP Market Intelligence aramlo@rennie.com Ryan Berlin, Senior Economist rberlin@rennie.com Demographic 2016 The People Growth & Change 100
Developing Regional Solutions In Southeast Michigan
 Developing Regional Solutions In Southeast Michigan Presentation to Metropolitan Detroit Medical Library Group March 15, 2018 Membership Map 171 Total Members Including education members: Livingston Educational
The GRPS Cultural Landscape GRPS Office of Equity and Inclusion
 The GRPS Cultural Landscape GRPS Office of Equity and Inclusion We Welcome You! Our Cultural Landscape Background Nationally, the U.S. population is becoming more racially/ethnically diverse. Source: Pew
Maximizing Tourism Marketing Investments A Canadian Perspective
 Maximizing Tourism Marketing Investments A Canadian Perspective Understanding the potential of markets Economics: GDP; Inflation; Unemployment; Employment; Disposable Income; Private Consumption; Consumer
Joint Plan for Orderly Annexation of Gainesville s Urban Reserve Area
 Legislative File #: 080404 ORDERLY ANNEXATION TEAM Joint Plan for Orderly Annexation of Gainesville s Urban Reserve Area September 29 th, 2008 ORDERLY ANNEXATION TEAM Presentation Overview I. Background
Economic Outlook: fear over fundamentals
 ECONOMICS I RESEARCH Economic Outlook: fear over fundamentals April 2016 Craig Wright (SVP & Chief Economist) (416) 974-7457 craig.wright@rbc.com Volatility index Market volatility index, (VIX) 90 80 70
Nebraska Births Report: A look at births, fertility rates, and natural change
 University of Nebraska Omaha DigitalCommons@UNO Publications since 2000 Center for Public Affairs Research 7-2008 Nebraska Births Report: A look at births, fertility rates, and natural change David J.
2014 peterborough city and county. active. transportation. & health. indicators primer
 2014 city and county active transportation & health indicators primer executive summary Walking, cycling and transit are good for our personal health, our local economies, and the environment. Understanding
MANITOBA'S ABORIGINAL COMMUNITY: A 2001 TO 2026 POPULATION & DEMOGRAPHIC PROFILE
 MANITOBA'S ABORIGINAL COMMUNITY: A 2001 TO 2026 POPULATION & DEMOGRAPHIC PROFILE MBS 2005-4 JULY 2005 TABLE OF CONTENTS I. Executive Summary 3 II. Introduction.. 9 PAGE III. IV. Projected Aboriginal Identity