Business opportunities in Turkish Maritime Industry Marco Rensma Director MEYS Emerging Markets Research Istanbul, 24 May 2012
|
|
|
- Estella Summers
- 5 years ago
- Views:
Transcription

1 Business opportunities in Turkish Maritime Industry Marco Rensma Director MEYS Emerging Markets Research Istanbul, 24 May 2012
2 Content presentation 1. Introduction MEYS Emerging Markets Research 2. Global trends seaborne trade and shipbuilding 3. Economic developments Turkey 4. Turkish maritime industry: 4.1 Developments seaborn trade Turkey 4.2 Trends in Turkish shipbuilding 4.3 Market of tankers and bulk carriers 4.4 Market of mega yachts 4.5 Market of naval ships 4.6 Market of offshore supply vessels 5. Outlook maritime industry Turkey
3 1. Introduction MEYS Emerging Markets Research
4 What we do International market research and advisory for Dutch companies Focus on the emerging markets of: Romania Turkey Hungary Morocco Czech Republic Vietnam Business clients from industry, construction, trade & logistics, transport Official partner TurkeyDesk - Fenedex Writing articles on emerging markets for: Fenedexpress, monthly magazine Fenedex Romania Magazine, quarterly magazine Dutch Romanian Network Presentations for companies, business associations, and universities on emerging markets and globalisation Parttime lecturer Global Marketing, The Hague University of Applied Sciences

5 2. Global trends seaborne trade and shipbuilding
6 Increased volume world seaborne trade International developments seaborne trade (millions of tons loaded) Source: UNCTAD Note: (*) Iron ore, grain, coal, bauxite/alumnia and phosphate Oil Main bulks* Other dry cargo Container
7 f 2013f 2014f Growth rate (%) USD/barrel Growth rate world seaborne trade could become lower after Source: UNCTAD, IMF, own calculations Seaborne trade Global economy Oil prices (R-axis)
8 Declining world volume new orders and order books World volume (million GT) Source: SAJN New orders Order books
9 Declining demand tankers and bulk carriers; small increase container ships 160 World order book (mill. DWT) World order book container ships (mill. TEU) Source: RS Platou Tanker < DWT Tanker > DWT Capesize
10 2008M M M M M M M M M M M M M M M M M M04 Million USD Falling prices for new tankers, bulk carriers and container vessels Suezmax Capesize TEU Source: RS Platou
11 Numbers Lower demand mega yachts * New orders Note: (*) Jan. - April Source: Camper and Nicholson, Boat International, SuperYacht Times Deliveries
12 2007okt 2008jan 2008apr 2008jul 2008okt 2009jan 2009mei 2009aug 2009nov 2010feb 2010mei 2010aug 2010nov 2011feb 2011mei 2011aug 2011nov 2012feb 900 Increasing demand for offshore supply vessels (excl. tugboats) Volume world order books OSVs (number) Source: Marcon International
13 e 2012e 2013e 2014e 2015e Million CGT Increasing overcapacity at shipyards worldwide Completions Shipbuilding capacity Overcapacity Source: POSCO Research Institute

14 3. Economic developments Turkey
15 Turkey higher economic growth rate than EU-27 10,0 Economic growth rate (GDP, %) 8,0 6,0 4,0 2,0 0,0-2,0-4,0-6,0 Source: IMF EU-27 the Netherlands Turkey
16 Strong increase total foreign trade 300,0 Total foreign trade Turkey (billion euro) 250,0 200,0 Economic liberalisation 150,0 100,0 50,0 Source: Turkstat
17 Turkey relatively small export sector Ireland Malta Hungary Estonia Slovakia Netherlands Belgium Czech Republic Lithuania Slovenia Bulgaria Latvia Austria Switzerland Denmark Sweden Germany Poland EU-27 Croatia Norway Finland Romania Portugal United Kingdom Spain Italy France Greece Turkey Source: Eurostat Exports, 2011 (% of GDP) 0% 20% 40% 60% 80% 100% 120%
18 Turkey large deficit current account Current account balance, 2011 (% GDP) Norway Switzerland Netherlands Sweden Denmark Germany Estonia Korea Japan Austria Slovak Republic Ireland Israel Belgium Finland Slovenia United Kingdom Australia France Canada Czech Republic United States Italy Spain New Zealand Portugal Iceland Greece Turkey Source: IMF
19 2009M M M M M M M M M M M M M M M M M M M M03 30,0 High inflationary pressure Inflation Turkey (%) 25,0 20,0 15,0 10,0 5,0 0,0-5,0 Source: Eurostat Total Food Energy
20 Weak Turkish Lira 105 Real effective exchange rate TRY (2010 = 100) Source: Bank International Settlements
21 2010M M M M M M M M M M M M M M M M M M M M M M M M04 Turkey Central Bank (still) holds interest rate relatively low 7,50 Policy rate (%) 7,00 6,50 6,00 5,50 5,00 Source: Central Bank Turkey
22 Economic outlook Turkey positive 10,0 Growth rates for Turkey (%) 8,0 6,0 4,0 2,0 0,0 Source: EIU GDP Private consumption Exports Government consumption
23 Turkish current account deficit remains high after ,0 Balance current account Turkey (% GDP) ,0-4,0-6,0-8,0-10,0 Source: IMF

24 4. Turkish Maritime Industry

25 4.1 Developments seaborne trade Turkey


26 Turkey strategically located for international seaborne trade

27 Ports are located all along Turkish coast 175 Ports 90 per cent private operated Source: ISPAT
28 Busy times at Turkish seaports 400 Volume goods handled at Turkish seaports (million tons) Cabotage Source: UMA Total volume Export/import
29 2009M M M M M M M M M M M M M M M M M M M M03 60% Slowing down growth rate seaborne trade Growth rate seaborne trade Turkey(%) 40% 20% 0% -20% -40% -60% Source: Turkish customs Exports Imports
30 Turkey relatively large merchant fleet Greece Japan Germany China excl. Hong Kong Republic of Korea US Norway China, Hong Kong SAR Denmark Taiwan Singapore Bermuda Italy UK Turkey Russia Canada India Malaysia Belgium Iran Saudi Arabia Brazil Indonesia Cyprus UAE Netherlands France Viet Nam Sweden Total DWT merchant fleet as a percentage in world total, (%) (a) Source: UNCTAD Note: (a) Vessels of 1,000 GT and above operating under national and foreign flag
31 Relatively young merchant fleet Age merchant fleet Turkey, % in total DWT (December 2011) 30+ years Mainly smaller vessels < DWT years years 0-9 years Source: Turkey Chamber of Shipping
32 Strong increase container handling Volume container handling Turkish ports (x TEU) Source: UMA, TURKLIM
33 Turkish ports relatively small globally China United States Singapore Hong Kong Japan Korea, Republic of Malaysia UAE Germany Spain Taiwan Netherlands Belgium Italy India Indonesia United Kingdom Brazil Egypt Australia Thailand Viet Nam France Panama Turkey in container handling Container throughput, 2009 (x TEU) Source: UNCTAD

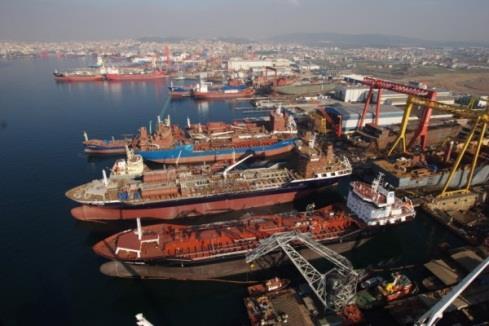
34 4.2 Trends in Turkish shipbuilding
 Canakkale (2) Izmit (6) Sakarva (1) 71 shipyards as of 1-1-2012 (1) Hatay (1) Source:")
35 Concentration of shipyards in Istanbul (Tuzla Bay) and Yalova (27) (8) (1) (1) (1) (1) Yalova (21) Canakkale (2) Izmit (6) Sakarva (1) 71 shipyards as of (1) Hatay (1) Source: UMA
36 Turkey among the best of the rest Top 20 economies for shipbuilding, 2010 deliveries (% in world total DWT) China Republic of Korea Japan Philippines Romania Viet Nam Denmark Taiwan Croatia Germany Turkey US Russia Spain Indonesia Netherlands India Italy Poland Bulgaria 1,24% 0,60% 0,56% 0,50% 0,44% 0,35% 0,35% 0,33% 0,22% 0,17% 0,15% 0,12% 0,12% 0,09% 0,08% 0,08% 0,07% 21,77% 31,34% 41,07% Source: UNCTAD 0% 10% 20% 30% 40% 50%
37 Large overcapacity at Turkish shipyards Number of ships built at Turkish shipyards Ship deliveries and max. production capacity (x DWT) Ship deliveries Production capacity Source: Turkey Chamber of Shipping, UMA
38 Order books Turkish shipyards are under pressure. Focus primarily on tanker building Total order books Turkish shipyards (x GT) Order books by type of ship 2010 (%) 71% 9% 17% 1% 2% - Container General cargo RO-RO Bulk Carrier Tanker Source: Turkey Chamber of Shipping, SAJN
39 4.3 Market of tankers and bulk carriers
40 Tankers and bulk carriers most used vessels in Turkish merchant fleet Note: (*) ships over 150 GT Source: UMA Merchant fleet Turkey (DWT)* Tankers Bulk carriers Total
41 Tankers and bulk carriers main shipbuilding marketsegments Ship deliveries Turkey 2010 (percentage of built tonnage) 4,6 1,2 16,8 18,7 58,6 Source: OECD Tankers Other dry cargo/passenger Others Bulk carriers Offshore
42 Since 2007 domestic demand for tankers higher than foreign demand Tanker deliveries Turkish shipyards (number) Source: OECD, Turkey Chamber of Shipping Export Domestic
43 Decreasing volume order books, particular for tankers Order books Turkey (number) jan 2009feb 2009dec 2010dec 2011mei 2011okt Source: OECD, Turkey Chamber of Shipping, Clarkson tanker bulk dry cargo container

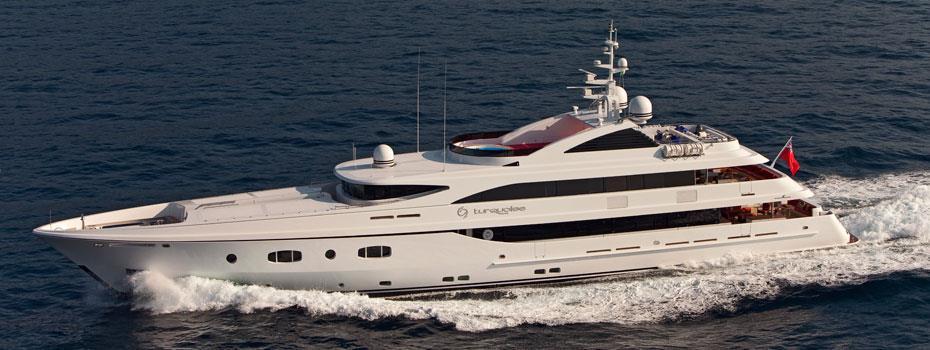
44 4.4 Market of mega yachts
45 Strong increase international tourism Foreigners arriving (persons) Source: Turkstat
46 Others China UAE Taiwan New Zealand UK US Germany Turkey Netherlands Italy Turkey third largest builder of mega yachts Source: Camper and Nicholson Mega yachts builders 2010 (% in total boat length)
47 * Lower demand mega yachts from Turkish shipyards Market of mega yachts Turkey (number) Completed New orders Note: (*) Jan. April Source: SuperYacht Times, Camper and Nicholson
48 Euro Lower prices 2012Q1 after records in and * Note: (*) Jan. - April Source: Boat International, Super Yacht Times, The Yacht Market Average asking prices mega yachts Turkey (Loa per metre)
: 37.")

49 Examples of mega yachts built in Turkey Boat: Peri 37M Builder: Peri Yachts Boat length (Loa): metres Asking price: euro Boat: Aegean Yacht Ketch Builder: Aegean Yacht Boat length (Loa): metres Asking price: euro

50 4.5 Market of naval ships
51 Strong increase turnover Turkish defense industry Defense industry Turkey (x USD) Source: SaSad Turnover Exports
52 Million USD Strong increase in expenditures on military equipment Development Defense Industry Support Fund Income Expenditures Source: Undersecretary Defense Industry (SSM)
 Patrol and Anti-Submarine")


53 Large investment programs Turkish navy MILGEM Investment program of 2 billion dollars over a period of 15 years Building of twelve (four optional) Patrol and Anti-Submarine Warfare Ships GENESIS Upgrading weapons systems on board 8 frigates Submarines Building of 6 submarines Value of the contract 2 billion dollars Cooperation between HDW from Germany and several Turkish companies, among others Aselan and Havelsan TF-2000 Building of 6 anti-air frigates Value of the contract 3 billion dollars First delivery 2018

54 4.6 Market of Offshore Supply Vessels
55 2007okt 2008jan 2008apr 2008jul 2008okt 2009jan 2009mei 2009aug 2009nov 2010feb 2010mei 2010aug 2010nov 2011feb 2011mei 2011aug 2011nov 2012feb Turkey small builder in global market of OSVs Volume order books OSVs Turkish shipyards (number) Turkey 1% of global market Source: Marcon International


56 Examples Turkish built OSVs RMK Shipyard Offshore multi-purpose ship DWT Delivery 2009 North Sea Shipping (Norway) CEMRE Shipyard Offshore support vessel LOA 86 metres Delivery September 2011 Havyard (Norway)


57 5. Outlook maritime industry Turkey
58 Market segment Outlook Market opportunities Market threats Tankers ++ Increasing demand oil and gas transport Strong domestic base Partly replacement merchant fleet Regional energy hub Relatively low labour costs Bulk carriers + Growing economy Turkey Partly replacement merchant fleet Relatively low labour costs Container ships + Growing economy Turkey Regional trading hub Relative low labour costs Mega yachts ++ Strong increase international tourism Higher incomes in Turkey Naval ships +++ High government expenditures Increase foreign demand OSVs ++ Investments by oil and gas industry Increasing energy demand Turkey Falling newbuilding prices -> excess capacity Strong competition Asia High investments costs Falling newbuilding prices -> excess capacity Strong competition Asia Lower growth rate global economy Falling newbuilding prices -> excess capacity Strong competition Asia Lower growth rate global economy Strong competition from Europe Volatile and small global market Political developments Difficult market to enter for new foreign companies Strong global competition High investments in R&D Strong dependence on foreign imports
59 Thank you for your attention! Marco Rensma Mobile: +31(0)
Max Sort Sortation Option - Letters
 Max Sort Sortation Option - Letters Western Europe Prices Product Code PS5 PS6 Austria* 0.330 7.550 0.330 7.400 Belgium* 0.370 3.700 0.370 3.540 Denmark* 0.620 5.350 0.620 4.215 Finland* 0.385 4.400 0.385
THE WORLD COMPETITIVENESS SCOREBOARD 2011
 THE WORLD COMPETITIVENESS SCOREBOARD 2011 98.557 94.063 92.588 92.011 90.782 90.219 89.259 87.824 86.475 86.418 86.313 85.707 84.380 84.120 81.629 81.619 81.100 80.278 79.799 78.499 77.599 77.101 76.827
AREA TOTALS OECD Composite Leading Indicators. OECD Total. OECD + Major 6 Non Member Countries. Major Five Asia. Major Seven.
 Reference series Composite leading indicators OECD Composite Leading Indicators AREA TOTALS 7-03- 19 OECD Total 19 OECD + Major 6 Non Member Countries 19 Major Seven 19 Major Five Asia 19 Euro area 19
I. World trade in Overview
 I. Table I.1 Growth in the volume of world merchandise exports and production by major product group, 1995-3 ( change) 1995-21 22 23 World merchandise exports 7. -.5 3. 4.5 Agricultural products 3.5 2.5
Ministry of Economy and Sustainable Development of Georgia
 Ministry of Economy and Sustainable Development of Georgia Economic Growth 42,000.0 36,000.0 30,000.0 24,000.0 18,000.0 12,000.0 6,000.0 0.0 GDP AND ECONOMIC GROWTH 7.2% 6.2% 6.4% 4.6% 4.8% 3.4% 2.9% 2.8%
Global Construction Outlook: Laura Hanlon Product Manager, Global Construction Outlook May 21, 2009
 Global Construction Outlook: Short-term term Pain, Long-term Gain Laura Hanlon Product Manager, Global Construction Outlook May 21, 2009 What This Means for You The world is set to be hit this year with
The economic value of the EU shipping industry. Andrew P Goodwin
 The economic value of the EU shipping industry Andrew P Goodwin 2 nd April 2014 Introduction Shipping is a vital facilitator of world trade 135 % Increase in world GDP in the last two decades 180 % Increase
Stockholm s tourism industry. November 2016
 Stockholm s tourism dustry. November 2016 Durg the month of November ca 1.1 million guest were recorded at commercial accommodations the county of Stockholm. This was an crease of 5 compared to November
Stockholm s tourism industry. December 2016
 Stockholm s tourism dustry. December 2016 Durg the month of December ca 0.9 million guest were recorded at commercial accommodations the county of Stockholm. This was an crease of 12 compared to December
OECD employment rate increases to 68.4% in the third quarter of 2018
 Paris, 17th January 2019 News Release: 3rd Quarter 2018 OECD employment rate increases to 68.4% in the third quarter of 2018 The OECD area employment rate the share of the working-age population with jobs
STORM FORECASTS: The only independent source of animal health and animal agriculture historical market data and forecasts
 The only independent source of animal health and animal agriculture historical market data and forecasts June 2016 1 What is STORM FORECASTS? STORM FORECASTS is the only independent source of animal health
The globalisation of sporting events: Myth or reality?
 Khalifa Stadium, Qatar. Photo: Igor Magic The globalisation of sporting events: Myth or reality? Søren Bang, Play the Game 203, 30 October 203 The globalisation of sporting events: Myth or reality? Photo:
Desalination From theory to practice People, Papers, Publications. Miriam Balaban EDS Secretary General
 Desalination From theory to practice People, Papers, Publications Gulf WSTA Europe EDS Miriam Balaban EDS Secretary General Europe and the Gulf Region The collaboration between our regions has had significant
NEW COMMERCIAL VEHICLE REGISTRATIONS EUROPEAN UNION 1. July and August 2017
 PRESS EMBARGO: NEW COMMERCIAL VEHICLE REGISTRATIONS EUROPEAN UNION 1 July and August 2017 Next press release: Tuesday 24 October 2017 1 Data for Malta unavailable Page 1 of 12 Commercial vehicle registrations:
January Deadline Analysis: Domicile
 January Deadline Analysis: Domicile Applicants by domicile at the 15 January deadline D.1.1 Applicants by domicile group UK EU (excluding UK) Not EU All domiciles 20% 10% -0% -10% -20% -30% -40% -50% 2009
Lithuanian export: is it time to prepare for changes? Aleksandr Izgorodin Expert
 Lithuanian export: is it time to prepare for changes? Aleksandr Izgorodin Expert Export is the main locomotive behind growth in LT economy Lithuania: change in real GDP and its components, % 78,2 71,8
IBSA Goalball World Rankings 31 December 2017 Men's Division
 IBSA Goalball World Rankings 31 December 2017 Men's Division Rank No v Oc t Se p Au g Ju l Team Region Score Goal Diff Results Gol p Gme Last Plyd Weight 1st 5 6 6 1 2 Brazil Americas 661.802 4.564 0.872
Update of trade weights data underlying the EERs and HCIs
 August 2017 Update of trade weights data underlying the EERs and HCIs The trade weights underlying the calculation of the effective exchange rates (EERs) of the euro and the harmonised competitiveness
Portuguese, English, and. Bulgarian, English, French, or
 Country Language Fiber Content Algeria Arabic Angola Portuguese, English, and French (optional) Optional Argentina Spanish Armenia Armenian Optional Australia English Austria German Bahrain Arabic or English
KINGDOM OF CAMBODIA NATION RELIGION KING 3
 KINGDOM OF CAMBODIA NATION RELIGION KING 3 TOURISM STATISTICS REPORT February 2018 MINISTRY OF TOURISM Statistics and Tourism Information Department No. A3, Street 169, Sangkat Veal Vong, Khan 7 Makara,
European Values Study & World Values Study - Participating Countries ( )
") GESIS Data Archive for the Social Sciences http://www.gesis.org/en/home/ ASEP/JD Data Archive http://www.jdsurvey.net/jds/jdsurvey.jsp European Values Study & World Values Study - Participating Countries
GESIS Data Archive for the Social Sciences http://www.gesis.org/en/home/ ASEP/JD Data Archive http://www.jdsurvey.net/jds/jdsurvey.jsp European Values Study & World Values Study - Participating Countries
The Baltic economies: Current situation and future trends, possibilities and pitfalls
 The Baltic economies: Current situation and future trends, possibilities and pitfalls Riga, 15 October 2015 Morten Hansen Head of Economics Department, Stockholm School of Economics in Riga Member of the
June Deadline Analysis: Domicile
 June Deadline Analysis: Domicile Applicants by domicile at the 30 June deadline I.1.1 Applicants by domicile group Difference between cycle and 2017 cycle UK EU (excluding UK) Not EU All domiciles 10%
DEVELOPMENT AID AT A GLANCE
 DEVELOPMENT AID AT A GLANCE STATISTICS BY REGION 5. EUROPE 2018 edition All the data in this report are available at: http://www.oecd.org/dac/financing-sustainable-development/ 5.1. ODA TO EUROPE - SUMMARY
Table I. NET CALORIFIC VALUES OF ENERGY PRODUCTS GJ/ton
 Table I PRODUCTION, EXPORTS AND CHANGES IN STOCKS HARD COAL 2011 2012 2013 2014 Standard factor 25.8 25.8 25.8 25.8 Argentina 24.7 24.7 24.7 24.7 Australia 27.1 27.0 26.9 26.9 Bangladesh 20.9 20.9 20.9
Japanese Market Potential
 Growth Strategy (announced on 14 June 2013) : Japan is BACK. Overall Target: 2% Real GDP Growth in the next 10 years JPY1.5 million Increase of GNI/capita after 10 years Unleash the Potential of Private
DG AGRI DASHBOARD: CITRUS FRUIT Last update:
 14 000 12 000 10 000 8 000 6 000 4 000 2 000 0 1996 1997 1998 1999 2000 2001 2002 2003 2004 2005 2006 2007 2008 2009 2010 2011 2012 2013 2014 2015 2016 Small citrus (group mandarines): clementines, satsumas
USTA Player Development 2017 Excellence Grant Criteria Jr Girls, Collegiate & Professional Players
 USTA Player Development 2017 Excellence Grant Criteria Jr Girls, Collegiate & Professional Players In order to encourage the development of U.S. players we have designed USTA Player Development Excellence
DG AGRI DASHBOARD: CITRUS FRUIT Last update:
 8.000 7.000 6.000 5.000 4.000 3.000 2.000 1.000 0 1996 1997 1998 1999 2000 2001 2002 2003 2004 2005 2006 2007 2008 2009 2010 2011 2012 2013 2014 2015 2016 2017 Small citrus (group mandarines): clementines,
The Economy of Finland
 The Economy of Finland Aug 30st 2013, Finnish Ministry of Foreign Affairs Presentation for the American Fulbright Grantees Petteri Rautaporras, Economist at the Federation of Finnish Technology Industries
Dry Bulk Shipping in Indonesia Opportunities & Outlook
 Dry Bulk Shipping in Indonesia Opportunities & Outlook Mare Forum, Jakarta 27 Peter Malpas 29 th November 27 Introduction Indonesia Key Facts Land Area 1,919,44 km2 = World s s 16 th Largest Population
Big data analytics for enrichment of rural area content tourism in Okhotsk sub-prefecture of Japan
 Big data analytics for enrichment of rural area content tourism in Okhotsk sub-prefecture of Japan Ali Bakdur, Fumito Masui, Michal Ptaszynski Kitami Institute of Technology, Dept. of Computer Science,
Table I. NET CALORIFIC VALUES OF ENERGY PRODUCTS GJ/ton
 Table I PRODUCTION, EXPORTS AND CHANGES IN STOCKS HARD COAL 2009 2010 2011 2012 Standard factor 25.8 25.8 25.8 25.8 Argentina 24.7 24.7 24.7 24.7 Australia 28.7 27.2 27.1 27.0 Bangladesh 20.9 20.9 20.9
New rules, new opportunities: a potential for growth
 #TV year New rules, new opportunities: a potential for growth June 19th, 2015 Jacques Balducci Eurodata TV Worldwide Deputy Sales Director Worldwide TV viewing remains strong World daily viewing time Average
TABLE 1: NET OFFICIAL DEVELOPMENT ASSISTANCE FROM DAC AND OTHER DONORS IN 2012 Preliminary data for 2012
 TABLE 1: NET OFFICIAL DEVELOPMENT ASSISTANCE FROM DAC AND OTHER DONORS IN 2012 DAC countries: 2012 2011 2012 ODA ODA/GNI ODA ODA/GNI ODA Percent change USD million % USD million % USD million (1) 2011
CMMI Maturity Profile Report. 30 June 2017
 CMMI Maturity Profile Report 30 June 2017 Executive Summary Appraisals increased 14% 1 Jan 30 Jun 17 Companies who reappraise continue to increase, currently at 74% 10% of reported appraisals are high
TV MEDIA ANALYSIS END SEASON Expertise by Nielsen Sports Your contact person(s): Marco Nazzari, Pamela Delmiglio
: Marco Nazzari, Pamela Delmiglio") TV MEDIA ANALYSIS END SEASON 2016 Expertise by Nielsen Sports Your contact person(s): Marco Nazzari, Pamela Delmiglio CONTENTS OBJECT OF ANALYSIS 3 CHANNEL MONITORED 4 TOP MANAGEMENT REPORT 5 CHAMPIONSHIP
TV MEDIA ANALYSIS END SEASON 2016 Expertise by Nielsen Sports Your contact person(s): Marco Nazzari, Pamela Delmiglio CONTENTS OBJECT OF ANALYSIS 3 CHANNEL MONITORED 4 TOP MANAGEMENT REPORT 5 CHAMPIONSHIP
THE ICELANDIC ECONOMY AN IMPRESSIVE RECOVERY BUT WHAT CHALLENGES LIE AHEAD?
 THE ICELANDIC ECONOMY AN IMPRESSIVE RECOVERY BUT WHAT CHALLENGES LIE AHEAD? FROM BUST TO BOOM. AN EPIC BUST After 16 years of growth with a short pause for breath in 2002, the Icelandic economy entered
Monthly Digest February 2016 No. 2016/04. Copyrights Statistics Botswana 2016
 STATISTICS BOTSWANA BOTSWANA INTERNATIONAL MERCHANDISE TRADE STATISTICS Monthly Digest February 2016 No. 2016/04 Copyrights Statistics Botswana 2016 Contact Statistician: Malebogo Rakgantswana Email: mrakgantswana@gov.bw
sector: recent developments VÍTOR CONSTÂNCIO
 The economy and the banking sector: recent developments VÍTOR CONSTÂNCIO January 2006 Recent performance of the economy and prospects Factors behind the period of slow growth Challenges to the Banking
Better in than out? Economic performance inside and outside the European monetary union. Roma, Rapporto Europa 2015
 Better in than out? Economic performance inside and outside the European monetary union Rapporto Europa 2015 Roma, 9.7.2015 1 Table of Content I. The political threat Why European monetary union? II. Europe
Production, trade and supply of natural gas Terajoules
 Terajoules Table Notes Production includes quantities from other sources, which would include any quantities of biogas, LPG or manufactured gas blended with natural gas. Please refer to the Definitions
October 23, 2015 FINAL STATISTICAL REPORT 2014/15
 C A L I F O R N I A D R I E D P L U M B O A R D 3840 Rosin Court Phone (916) 565-6232 Suite 170 Fax (916) 565-6237 Sacramento, CA 95834 www.californiadriedplums.org October 23, 2015 FINAL STATISTICAL REPORT
The 11th Korea Prime Minister Cup International Amateur Baduk Championship
 The 11th Korea Prime Minister Cup International Amateur Baduk Championship Buan County, South Korea We are pleased to announce that the 11 th Korea Prime Minister Cup (KPMC) will be held on the 3rd-9th
Predicting the Markets: Chapter 15 Charts: Predicting Currencies
 Predicting the Markets: Chapter 15 Charts: March 3, 217 Dr. Edward Yardeni 516-972-7683 eyardeni@ Mali Quintana 48-664-1333 aquintana@ Please visit our sites at www. blog. thinking outside the box Table
TEGMA Fall Transportation Symposium
 TEGMA 2017 Fall Transportation Symposium John Wilson Senior Vice President Dairy industry trends 1997 1998 1999 2000 2001 2002 2003 2004 2005 2006 2007 2008 2009 2010 2011 2012 2013 2014 2015 2016 Million
Firearms & parts firearms & parts firearms & parts rocket launcher components
 Table 3 Exports of Military Goods by Component Categories Export Period 01 January to 31 December 1997 Destination ECL Andorra 2001 5 434 2 058 Firearms & parts Argentina 2001 54 498 468 firearms & parts
German Machine Tool Industry - Key Figures
 German Machine Tool Industry - Key Figures Mill. EUR %-Change 1-2Q 1-2Q 1-2Q 2014 2015 2016 2017 2017 2018 2016 2017 2018 Production total 14.486 15.087 15.007 16.006 7.062 7.820-1 +7 +11 Metal working
IR-Pay Go Rates. There are three pricing groups for Pay Go rates for International Roaming as follows:
 IR-Pay Go Rates A. IR Pay Go Rate Summary There are three pricing groups for Pay Go rates for International Roaming as follows: Sr IR Pay Go Rate Group 1 Rs 2 2 2 2 Rs 10 10 10 3 Rs 50 600 25 Applicable
Predicting the Markets: Chapter 12 Charts: Predicting Currencies
 Predicting the Markets: Chapter 12 Charts: October 5, 218 Dr. Edward Yardeni Chief Investment Strategist Mali Quintana Senior Economist info@yardenibook.com Please visit our sites at www. blog. thinking
Selection statistics
 Selection statistics ERASMUS+ Sport Call for proposals EAC-A05-2017 Selection year 2018 Collaborative Partnerships Small Collaborative Partnerships Not-for-profit European Sport Events Applications received
Architecture - the Market
 2 Architecture - the Market Architect: Ibelings van Tilburg architecten Project: De Karel Doorman Winner of the BNA Building of the Year 2013 Public Prize Photographer: Ossip van Duivenbode Place: Rotterdam
World real GDP growth in 2010 Annual percent change
 World real GDP growth in 2010 Annual percent change 1 or more 6-1 3-6% 0-3% Less than No data Source: International Monetary Fund. World real GDP growth in 2011 Annual percent change 1 or more 6-1 3-6%
41th meeting of the Advisory Committee
 41th meeting of the Advisory Committee Marseille, France 8 July 213 OLIVE OIL BALANCES 211/12-212/13 OLIVE OIL 211/12 (final) (thousand tonnes) 212/13 (prov.) Starting stocks 773. 1.5 Production 3377.5
Turkey: Recent Developments and Future Prospects. ISBANK Economic Research Division November 2018
 Turkey: Recent Developments and Future Prospects ISBANK Economic Research Division November 2018 Macroeconomic Outlook Strong Economic Growth Cycle GDP of 851 bn USD (2017), 10.6k USD (2017) per capita
Global Cable: Market trends & business models
 Global Cable: Market trends & business models Guy Bisson, Ampere Analysis January 2018 1 Cable TV penetration 2005: Cable TV drove market with multiple high penetration/low ARPU markets 90 80 70 Netherlands
Freshwater fish. Carp, Perch, Pike, Burbot, Barb, Milkfish. Extract from GLOBEFISH Databank Prices - Exports - Imports - Production
 Commodity Update Freshwater fish Carp, Perch, Pike, Burbot, Barb, Milkfish Extract from GLOBEFISH Databank Prices - Exports - Imports - Production November 2012 Freshwater fish - Carp, Perch, Pike, Burbot,
Guy Bisson, Ampere Analysis
 Global Cable Trends: Poland s place in the world of cable Guy Bisson, Ampere Analysis October 2017 1 Multi-play RGUs (m) Globally, cable leads in multi-play subscriptions with over 800m multi-play RGUs
Confidence through experience. Track record as of 30 June 2012
 Confidence through experience Track record as of 30 June 2012 Harvesting the full potential of wind Confidence is built through experience. During more than 30 years in the wind industry we have installed
Selection statistics
 Selection statistics ERASMUS+ Sport Call for proposals EAC-A03-2016 Selection year 2017 Collaborative Partnerships Small Collaborative Partnerships Not-for-profit European Sport Events Erasmus+ Applications
Value Exported (CDN$) Support Systems ,165 firearms ,389 firearms ,465 firearms ,500 rocket launchers
 Support Systems ,165 firearms ,389 firearms ,465 firearms ,500 rocket launchers") Table 3 Exports of Military Goods by Component Categories Export Period 01 January to 31 December 1998 Value Exported (CDN$) Andorra Argentina Australia Austria Bahrain 2001 2,165 firearms 2001 137,389
Table 3 Exports of Military Goods by Component Categories Export Period 01 January to 31 December 1998 Value Exported (CDN$) Andorra Argentina Australia Austria Bahrain 2001 2,165 firearms 2001 137,389
LOCAL BROADCASTER DUBAI DUBAI SPORTS CHANNEL 01-Nov-13 01:00 02:00 Hlts Day 1 01:00 EUROPE DURATION HH:MM
 A. HIGHLIGHTS LOCAL BROADCASTER DUBAI DUBAI SPORTS CHANNEL 01-Nov-13 01:00 02:00 Hlts Day 1 01:00 02-Nov-13 01:00 02:00 Hlts Day 2 01:00 03-Nov-13 01:00 02:00 Hlts Day 3 01:00 04-Nov-13 01:00 02:00 Hlts
Economic Outlook March Economic Policy Division
 Economic Outlook March 212 Economic Policy Division Real GDP Outlook Percent Change, Annual Rate 2 1 1 - -1 197 197 198 198 199 199 2 2 21 U.S. GDP Actual and Potential Quarterly, Q1 197 to Q4 211 Real
Post Show Report April 2015, Moscow, Russia. #ipheb
 Post Show Report 2015 27-29 April 2015, Moscow, Russia Join the pharma community @cphiww #cphirussia #ipheb Contents 1. Show Profile 3 2. Visitor: 2015 Facts & Figures 4 2.1 Top visitor countries 4 2.2
2018 Hearthstone Wild Open. Official Competition Rules
 2018 Hearthstone Wild Official Competition Rules 1 TABLE OF CONTENTS INTRODUCTION 3 APPLICABILITY OF RULES 3 PLAYER ELIGIBILITY 4 TOURNAMENT STRUCTURE 4 PRIZING 9 PLAYER CONDUCT 9 MISCELLANEOUS 9 2 1.
The Herzliya Indices. National Security Balance The Civilian Quantitative Dimension. Herzliya Conference Prof. Rafi Melnick, IDC Herzliya
 The Herzliya Indices National Security Balance The Civilian Quantitative Dimension Herzliya Conference 2015 Prof. Rafi Melnick, IDC Herzliya 1990 1991 1992 1993 1994 1995 1996 1997 1998 1999 2000 2001
Introductions, Middle East, Israel, Jordan, Yemen, Oman Week 1: Aug Sept. 1
 Introductions, Middle East, Israel, Jordan, Yemen, Oman Week 1: Aug. 28 - Sept. 1 ASSIGNMENT Monday Tuesday Wednesday Thursday Friday Due Wednesday pgs. 6-11 Do not start the workbook or study sheet assignments
Assessing Australia s Innovative Capacity in the 21 st Century
 Assessing Australia s Innovative Capacity in the 21 st Century Professor Joshua Gans MBS & IPRIA University of Melbourne November, 2003 This presentation is based on the National Innovative Capacity Project,
Global economic cycle has slowed
 Year-on-year % change Confidence index, 50= no change Global economic cycle has slowed 25% 70 20% International trade growth 65 15% 10% Industrial production growth 60 5% 55 0% 50-5% Business confidence
Elements for the Biennial Review And Assessment of the World Timber Situation SELECTED DATA AND ANALYSIS.
 Elements for the Biennial Review And Assessment of the World Timber Situation 2015-2016 SELECTED DATA AND ANALYSIS Frances Maplesden Content Results of the 2016 Joint Forest Sector Questionnaire Secondary
Shipbuilding Market Overview
 Shipbuilding Market Overview Cargotec Capital Markets Day, Helsinki, 17 th November 2011. Steve Gordon, Clarkson Research Services Limited (CRSL) The information supplied herewith is believed to be correct
Session 4. Growth. The World Economy Share of Global GDP Year 2011 (PPP)
") Session 4. Growth Stylized Facts on Standards of Living across Countries Characterizing Growth over 1 Years: The US Economy Growth Dynamics of the G7 Countries and the OECD Economies Characterizing Growth
Session 4. Growth Stylized Facts on Standards of Living across Countries Characterizing Growth over 1 Years: The US Economy Growth Dynamics of the G7 Countries and the OECD Economies Characterizing Growth
Table 34 Production of heat by type Terajoules
 Table 34 Production of heat by type Table Notes geo represents heat used directly for district heating, agriculture etc. without a commercial transaction taking place. represents heat used for the production
STATISTICS BOTSWANA INTERNATIONAL MERCHANDISE TRADE STATISTICS. Monthly Digest February 2018
 STATISTICS BOTSWANA INTERNATIONAL MERCHANDISE TRADE STATISTICS Monthly Digest February 2018 Contact Statistician: Malebogo Rakgantswana Email: mrakgantswana@statsbots.org.bw Tel: (+267) 367 1300 Statistics
EUROPEAN RIDERS, HORSES AND SHOWS AT THE FEI 2012
 EUROPEAN RIDERS, HORSES AND SHOWS AT THE FEI 2012 Presentation to the EEF Sports Forum Essen, 21 st March 2013 1 Introduction In 2010 the Small Nations Working Group started this study, to know exactly
Chart Collection for Morning Briefing
 Chart Collection for Morning Briefing September 11, 2017 Dr. Edward Yardeni 516-972-7683 eyardeni@ Mali Quintana 4-664-1333 aquintana@ Please visit our sites at blog. thinking outside the box 4.6 4.4 4.2
Full-Time Visa Enrolment by Countries
 Page 1 of 32 All Students Afghanistan Albania Algeria Andorra Antigua Argentina Armenia Australia Austria Azerbaidjan Bahamas Bahrain Bangladesh Barbados Belarus Belgium Belize Benin (Dahomey) Bermuda
DEVELOPMENT AID AT A GLANCE
 DEVELOPMENT AID AT A GLANCE STATISTICS BY REGION 6. OCEANIA 2018 edition All the data in this report are available at: http://www.oecd.org/dac/financing-sustainable-development/ 6.1. ODA TO OCEANIA - SUMMARY
Worst economic crisis since WWII and lack of funds posing internal and external barriers to internationalisation
 Hot Topics Dr Janet Ilieva International Education Intelligence Unit Setting the context Worst economic crisis since WWII and lack of funds posing internal and external barriers to internationalisation
FINAL REPORT for Sports Tourism Report For the Year 2013
 FINAL REPORT for Sports Tourism Report For the Year 2013 Prepared for The Cyprus Tourism Orgaization September 201 CONTENTS Page 1. Main Findings 2 2. Appointment and Methodology 3. General Indicators:
Infrastructure Financing for Sustainable Development in Georgia. NATIONAL WORKSHOP June 6, Tbilisi David Lezhava
 Infrastructure Financing for Sustainable Development in Georgia NATIONAL WORKSHOP June 6, Tbilisi David Lezhava 2 Part I Infrastructure Financing Needs 3 Infrastructure investment needs globally McKinsey
Common Market Organisation (CMO) Fruit and vegetables sector Evolution of EU prices of certain F&V
 Fruit and vegetables sector Evolution of EU prices of certain F&V") Common Market Organisation (CMO) Fruit and vegetables sector Evolution of EU prices of certain F&V Unit C.2. - Wine, spirits, horticultural products, specialised crops DG Agriculture and Rural Development
Common Market Organisation (CMO) Fruit and vegetables sector Evolution of EU prices of certain F&V Unit C.2. - Wine, spirits, horticultural products, specialised crops DG Agriculture and Rural Development
Beer statistics edition. The Brewers of Europe
 Beer statistics 2016 edition The Brewers of Europe Beer statistics 2016 edition The Brewers of Europe November 2016 ISBN 978-2-9601382-7-6 EAN 9782960138276 1 TABLE OF CONTENTS Foreword by President
Architect: Dekleva Gregoric Architects Project: Compact Karst House Photo: James Maroti Place: Vrhovlje, Slovenia
 Architect: Dekleva Gregoric Architects Project: Compact Karst House Photo: James Maroti Place: Vrhovlje, Slovenia 4.1 EARNINGS Average architects earnings are 32 068 (adjusted for PPP). This is 10 per
Wednesday 13 June 2012 Afternoon
 Wednesday 13 June 2012 Afternoon A2 GCE GEOGRAPHY F763/I/2 Global Issues INSERT 2 RESOURCE BOOKLET *F721790612* Duration: 2 hours 30 minutes INFORMATION FOR CANDIDATES This document consists of 10 pages.
Student Nationality Mix for BAT Bath
 Student Nationality Mix for BAT Bath Country Total Saudi Arabia 16. Oman 11.8% Spain 10. China 10. Libya 7. Thailand 6. Korea (South) 6. France 3.9% Venezuela 3. Italy 2.9% Brazil 2. Turkey 2. Switzerland
OCEAN2012 Fish Dependence Day - UK
 OCEAN2012 Fish Dependence Day - UK Europeans are now so dependent on fish products originating from external waters that half the fish they consume are sourced outside the EU Fish dependence: The EU s
Economic potential of Agriculture and Pig production in Baltic region. Mindaugas Jurgelis, analyst 30 May, 2012
 Economic potential of Agriculture and Pig production in Baltic region Mindaugas Jurgelis, analyst 30 May, 2012 1 Global tendencies of food production 2 Food prices near historical peak level FAO food price
Invitation to. The 36th World Amateur Go Championship in Bangkok. Outline
 Invitation to The 36th World Amateur Go Championship in Bangkok Outline 1. Tournament name : The 36th World Amateur Go Championship in Bangkok 2. Main Sponsor : CP ALL PUBLIC COMPANY LIMITED 3. Co-organizers
CURRENT DEMOGRAPHIC SITUATION IN LATVIA
 CURRENT DEMOGRAPHIC SITUATION IN LATVIA Peteris Zvidrins University of Latvia Workshop Very old people s housing and housing and health situation in Latvia 21 May, 2013 Population and its change in 10
Beer statistics edition. The Brewers of Europe
 Beer statistics 2015 edition The Brewers of Europe Beer statistics 2015 edition The Brewers of Europe Editor: Marlies Van de Walle October 2015 ISBN 978-2-9601382-5-2 EAN 9782960138252 1 TABLE OF CONTENTS
Market Insights. June 30, 2018
 June 30, 2018 Economic Overview 2 Global & Regional Growth Forecasts IMF GDP Forecasts (% change YoY) 2010 2011 2012 2013 2014 2015 2016 2017 2018 Advanced Economies 1.7% 1.2% 1.3% 2.1% 2.3% 1.7% 2.3%
Market Insights. March 29, 2019
 March 29, 2019 Economic Overview 2 Global & Regional Growth Forecasts IMF GDP Forecasts (% change YoY) 2010 2011 2012 2013 2014 2015 2016 2017 2018 Advanced Economies 1.2% 1.4% 2.1% 2.3% 1.7% 2.4% 2.3%
Key Figures and Trends for the Agricultural Machinery Industry
 Key Figures and Trends for the Agricultural Machinery Industry Update: November 2015 (monthly) Contact: Philip Nonnenmacher VDMA Agricultural Machinery Association philip.nonnenmacher@vdma.org Subject
GREEN BOATS IN PRACTICE. Green Dream Boats Ltd.
 GREEN BOATS IN PRACTICE Green Dream Boats Ltd. 1 Yacht industry POLAND 2 Yacht industry Polish perspective Domestic boat production (units) - 2012 Country Sailboats Inboard/ sterndrive motor boats Other
Peter Ch. Löschl, ABA Invest in Austria June Austria Investment Climate Reasons to Invest in Austria - Perspectives
 Peter Ch. Löschl, ABA Invest in Austria June 2016 Austria Investment Climate Reasons to Invest in Austria - Perspectives Strong Economy in the Heart of Europe Area: 83,872 km² People: 8.5 m. GDP growth:
Lecture 3 The Lisbon Strategy
 Lecture 3 The Lisbon Strategy Outline The Lisbon European Council held in March 2000 recognized the need of reforming labour,, product, and financial markets in order the performance of the EU economy
Traits of a Global Market for Advanced Human Capital How can the Global Demand for Post-secondary Education be met...
 Traits of a Global Market for Advanced Human Capital How can the Global Demand for Post-secondary Education be met... Washington D.C. May 23, 2002 .why are we here? Economic and social development are
Fibre to the Home: Taking your life to new horizons!
 Fibre to the Home: Taking your life to new horizons! Hartwig Tauber, Director General FTTH Council Europe Press Conference - Milan, 13 January 2011 FTTH Council Europe Photo by Nicolo Baravalle FTTH Council
Demography Series: China
 Demography Series: China April 9, 212 Dr. Edward Yardeni 16-972-7683 eyardeni@ Sailesh S Radha 83-786-1368 sradha@ Please visit our sites at www. blog. thinking outside the box Table Of Contents Table