Zions Bank Municipal Conference Economic Overview August 13, 2015
|
|
|
- Denis Hunt
- 5 years ago
- Views:
Transcription

1 Zions Bank Municipal Conference Economic Overview August 13, 2015
2 Overview National Economic Conditions Utah Economic Conditions
3 Utah is One of the Fastest Growing CA 0.9% States in the Country Percent Change in Population for States: 2012 to 2013 WA 1.1% OR 0.8% NV 1.3% AK 0.7% ID National U.S. Rate = 0.7% VT ND Economic MT 3.1% MN 0.8% SD WI 1.3% MI WY PA IA NE 0.5% OH 0.7% IL IN 0.2% UT Conditions 0.5% WV 1.6% VA CO MO KY - KS 0.9% 1.5% 0.4% NC TN 0.6% AZ OK SC AR NM 1.2% 0.9% 1.1% MS AL GA 0.2% 0.8% HI TX 1.5% LA 0.5% 1.15% or more.075% to 1.10% 0.5% to 0.9% 0% to 0.4% Population Loss FL 1.2% NH NY 0.4% ME -0.01% DC 2.1% CT DE 0.9% MD 0.7% MA 0.7% RI NJ 0.4% Source: U.S Census Bureau
4 Utah is One of the Fastest Growing CA 0.9% States in the Country How long will interest Percent Change in Population for States: 2012 to 2013 U.S. Rate = 0.7% NH rates stay so low?... WA ME 1.1% VT -0.01% ND MT 3.1% MN OR 0.8% NY 0.8% 0.4% NV 1.3% ID WY SD 1.3% NE OH 0.7% IL IN 0.2% UT 0.5% WV 1.6% VA CO MO KY - KS 0.9% 1.5% 0.4% It s up to the Fed NC TN 0.6% AZ OK SC AR NM 1.2% 0.9% 1.1% DC 2.1% AK 0.7% HI TX 1.5% IA 0.5% WI LA 0.5% MS 0.2% MI AL 1.15% or more.075% to 1.10% 0.5% to 0.9% 0% to 0.4% Population Loss GA 0.8% PA FL 1.2% CT DE 0.9% MD 0.7% MA 0.7% RI NJ 0.4% Source: U.S Census Bureau
5 Contribution to GDP Growth Consumption Drives Growth 6% 5% Total GDP Growth 4% 3% 2% 1% 0% -1% -2% -3% -4% -5% Fixed Investment Inventories Net Exports Government Personal Consumption Source: Bureau of Economic Analysis
6 Payroll Change 000 s National Job Growth Improving Million Jobs Lost Million Jobs Recovered Source: Bureau of Labor Statistics


7 U.S. Unemployment Rates Dropping % in July 3.0 Sources: U.S. Bureau of Labor Statistics, Utah Department of Workforce Services
8 Feb 2012 Jun 2012 Oct 2012 Feb 2013 Jun 2013 Oct 2013 Feb 2014 Jun 2014 Oct 2014 Feb 2015 Jun 2015 Consumer Confidence is Rising, but Not Robust Source: U.S. CCI from The Conference Board and Utah CAI from Cicero Group
9 Growth in Consumer Spending Remains Low 5.0 Personal Consumption Expenditure Yearly Percent Change Sources: Bureau of Economic Analysis
10 Jul 2011 Oct 2011 Jan 2012 Apr 2012 Jul 2012 Oct 2012 Jan 2013 Apr 2013 Jul 2013 Oct 2013 Jan 2014 Apr 2014 Jul 2014 Oct 2014 Jan 2015 Apr 2015 Inflation Remains Very Low 4.5% 4.0% 3.5% 3.0% 2.5% 2.0% 1.5% 0.5% 0.0% -0.5% US Consumer Price Index Year Over Change Source: U.S. CPI from National Bureau of Labor Statistics
11 Euro compared to U.S. Dollar $1.60 $1.50 $1.40 $1.37 $1.30 $1.20 $1.10 $1.00 PARITY $1.11 $0.90 $ Source: Investing.com


12 $6.00 $6.50 $7.00 $7.50 $8.00 US Dollar Compared to Chinese Yuan Inverted Scale 2008 China stops the yuan s rise 2001 China joins WTO 2005 China allows the yuan to rise 2010 China allows the yuan to rise Aug 2015 China devalues the yuan by largest amount in 20 years $ Source: Federal Reserve Bank of St Louis, Wall Street Journal
13 Jan-06 Jul-06 Jan-07 Jul-07 Jan-08 Jul-08 Jan-09 Jul-09 Jan-10 Jul-10 Jan-11 Jul-11 Jan-12 Jul-12 Jan-13 Jul-13 Jan-14 Jul-14 Jan-15 Jul-15 $ Per Barrel Oil Prices Much Below Long Term Trend $ $ Source: U.S. Federal Reserve
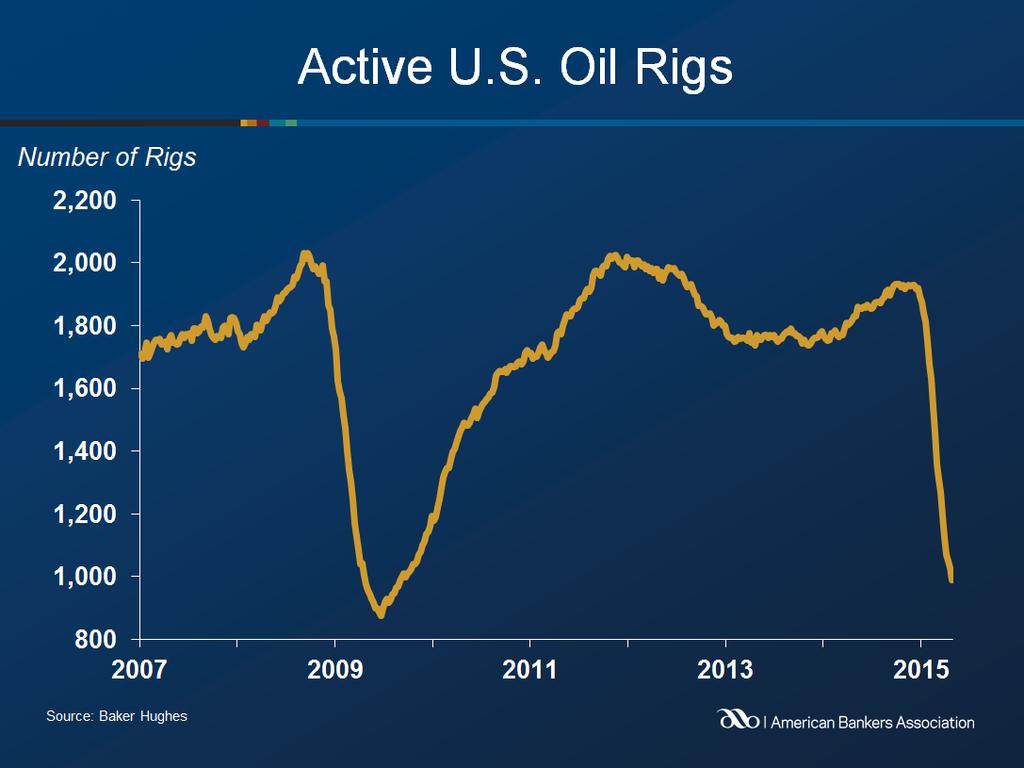
14
15 U.S. vs. Utah Oil Production Crude Oil Production: Barrels in Thousands Utah U.S. Source: U.S. Energy Information Administration
16 Year Mortgage Rate, Fed Rate and CPI Effective Fed Rate 30 Year Fixed Mortgage CPI Year Over Change Rate - Unadjusted Source: U.S. Federal Reserve and National Bureau of Labor Statistics
17 Federal Funds Rate Outlook Median FOMC Forecast 1.875% 0.25% 2 moves 25 bps 0.625% 4 moves 25 bps $0 $0 $0 Mar Jun Sep Dec Mar Jun Sep Dec Source: Source: American Bankers Association Analysis of Data from the Federal Reserve
18 Utah is One of the Fastest Growing CA 0.9% States in the Country Percent Change in Population for States: 2012 to 2013 U.S. Rate = 0.7% NH Utah Economic WA ME 1.1% VT -0.01% ND MT 3.1% MN OR 0.8% NY 0.8% ID SD WI 0.4% NV 1.3% AK 0.7% WY PA IA Conditions NE 0.5% OH 0.7% IL IN 0.2% UT 0.5% WV 1.6% VA CO MO KY - KS 0.9% 1.5% 0.4% NC AZ 1.2% HI NM 1.3% TX 1.5% OK 0.9% AR LA 0.5% MS 0.2% MI TN 0.6% AL 1.15% or more.075% to 1.10% 0.5% to 0.9% 0% to 0.4% Population Loss SC 1.1% GA 0.8% FL 1.2% DC 2.1% CT DE 0.9% MD 0.7% MA 0.7% RI NJ 0.4% Source: U.S Census Bureau
19 Utah Population Seventh Fastest Growing in U.S. CA OR 1.1% WA 1.3% NV 1.7% ID 1.3% UT 1.4% AZ 1.5% AK - MT 0.9% WY 0.2% CO 1.6% NM - HI 0.8% Percent Change: 2013 to 2014 U.S. Rate = 0.7% ND 2.2% SD 0.9% NE 0.7% TX 1.7% KS OK 0.6% MN 0.6% IA 0.5% MO AR WI LA 0.4% IL - MS MI IN 0.4% TN 0.8% AL or more OH 0.2% KY 0.7% to 0.9% (at or above U.S. rate) 0.4% to 0.6% 0.0% to Population Loss WV -0.2% VT 0.0% PA 0.0% NC SC 1.3% GA VA 0.7% FL 1.5% NH NY ME DC 1.5% CT - DE 1.1% MD 0.6% MA 0.5% RI 0.2% NJ Source: U.S Census Bureau
20 Utah Population Growth Rates By County 2013 to 2014 Box Elder 1.3% Tooele 1.4% Davis 2.1% Cache 0.9% Weber 0.9% Morgan 4.0% Salt Lake Utah 1.6% Rich 0.7% Summit 1.7% Wasatch 4.3% Duchesne 1.4% Daggett -1.2% Uintah 3.3% State Average = 1.4% Juab 1.5% Carbon -1.3% Increase of 2.0% or Greater Millard -0.2% Sanpete 0.8% Sevier - Emery -0.8% Grand 0.7% Increase of 1.5% to 1.9% Beaver 0.0% Piute -2.6% Wayne - Increase of to 1.4% Iron 1.2% Garfield -0.8% Increase of 0.0% to 0.9% San Juan 1.7% Population Loss Washington 2.9% Kane 0.2% Source: U.S. Census Bureau
21 Utah Components of Population Change 80,000 70,000 60,000 50,000 40,000 30,000 20,000 10, ,000-20,000 Population Change Natural Increase Net Migration Source: Utah Population Estimates Committee, U.S. Census Bureau, State of Utah Revenue Assumptions Working Group
22 Employment Growth by State CA 3.0% OR 3.2% WA 3.5% NV 3.5% AK 0.2% ID 2.6% UT 4.3% AZ 2.0% Percent Change in Employment for States: June 2014 to June 2015 U.S. Rate = 2.1% MT 0.5% WY -0.7% HI 1.5% CO 2.7% NM 1.3% ND 0.5% SD 2.3% NE 0.4% KS 0.8% TX 2.3% OK 0.6% MN 1.3% IA 1.5% MO 0.8% AR 2.0% WI 1.3% LA 0.7% IL 0.8% MS MI 2.2% IN 2.0% TN 2.2% AL 1.4% 2.7% or more OH 1.3% KY 2.2% GA 2.6% WV -1.2% VT 1.5% PA NC 2.4% SC 2.9% VA 1.3% FL 3.4% NH 1.1% NY 1.7% 2.1% to 2.6% (at or above the U.S. rate) 1.3% to 2.0% 0.8% to 1.2% ME 0.6% DC 1.2% CT 1.6% DE 1.7% MD 1.5% MA 2.1% RI 1.2% NJ Note: Seasonally Adjusted Source: Bureau of Labor Statistics 0.7% and below
23 Top States for Employment Growth June 2014 vs. June 2015 Top 10 June 2014 June 2015 Ranking 1. North Dakota 46th 2. Nevada 2nd 3. Utah 1st 4. Texas 13th 5. Florida 4th 6. Colorado 8th 7. Oregon 5th 8. Delaware 21st 9. California 6th 10. Washington 3rd 38. Idaho 9th Source: Bureau of Labor Statistics


24 Thousands of Jobs Utah Total Employment at New Highs 1,600 1,500 1,400 Gain of 189,000 jobs 1,300 1,200 1,100 1,000 Loss of 91,000 jobs Source: U.S. Bureau of Labor Statistics Note: January 2015 (prediction)

25 f 2016f Annual Rate of Change in Utah Nonagricultural Employment 8.0% 6.0% Average 2.6% 4.0% 2.0% 0.0% -2.0% -4.0% -6.0% Source: Utah Department of Work Force Services e = Estimate, f = Forecast
26 Utah Employment Change Rates By County June 2014 to June 2015 Box Elder 2.0% Tooele Davis 3.8% Cache 2.5% Rich 2.0% Weber 4.0% Morgan 3.9% Salt Lake 3.5% Utah 6.0% Summit 2.5% Wasatch 7.0% Duchesne -9.4% Daggett 1.5% Uintah -5.7% State Rate = 4.5% Juab 5.9% Carbon 3.1% 4.5% or more Millard 2.3% Sanpete 3.0% Sevier 2.4% Emery -9.1% Grand 1.9% 3.1% to 4.4% Beaver 4.9% Piute 0.6% Wayne 2.2% 2.1% to 3.0% 0.0% to 2.0% Iron 3.4% Garfield 2.2% San Juan 2.2% Below 0.0% Washington 5.4% Kane 1.4% Source: Utah Department of Workforce Services, Not seasonally adjusted

27 UT Industries - Employment Gains Ntl. Res. & Mining Construction Manufacturing Trade, Trans., Utilities Information Financial Activity Prof. & Bus. Serv. Ed. & Health Serv. Leisure & Hospitality Other Services Government Percent Change in Utah Employment by Industry -7.3% Total: 4.5% 3.3% 4.0% 3.5% 7.2% 5.7% 6.7% 5.0% 1 1.8% -13% -8% -3% 2% 7% 12% Source: Utah Department of Workforce Services

28 UT Industries Seeing Growth Ntl. Res. & Mining Construction Manufacturing Trade, Trans., Utilities Information Financial Activity Prof. & Bus. Serv. Ed. & Health Serv. Leisure & Hospitality Other Services Government -900 Total Change in Utah Employment by Industry Total: 59,200 2,700 4,900 8,900 2,400 4,200 12,300 8,500 13, ,300-2, ,000 4,000 6,000 8,000 10,000 12,000 14,000 Source: Utah Department of Workforce Services
29 Utah Has 3 rd Lowest Unemployment Rate in the Country OR 5.5% CA 6.3% WA 5.3% NV 6.9% ID 4.0% UT 3.5% AZ 5.9% MT 3.9% WY 4.1% CO 4.4% NM 6.4% July 2015 U.S. Rate = 5.3% ND 3.1% SD 3.8% NE 2.6% KS 4.5% OK 4.5% MN 3.9% IA 3.7% MO 5.8% AR 5.7% WI 4.6% IL 5.9% MS 6.6% MI 5.5% IN 4.9% TN 5.7% AL 6.1% OH 5.2% KY 5.1% GA 6.1% WV 7.4% VT 3.6% PA 5.4% NC 5.8% SC 6.6% VA 4.9% NH 3.8% NY 5.5% ME 4.7% DC 7.0% CT 5.7% DE 4.7% MD 5.2% MA 4.6% RI 5.9% NJ 6.1% AK 6.8% TX 4.2% LA 6.4% 4.0% or less FL 5.5% 4.1% to 4.6% HI 4.0% 4.7% to 5.5% (at or below the U.S. rate) 5.6% to 6.0% 6.1% or more Note: Seasonally Adjusted Source: Bureau of Labor Statistics
30 Utah vs. U.S. Unemployment Rates U.S. Utah Sources: U.S. Bureau of Labor Statistics, Utah Department of Workforce Services
31 Utah Unemployment Rates By County June 2015 Box Elder 3.6% Tooele 3.9% Cache 2.9% Weber 3.9% Davis 3.3% Salt Lake 3.2% Morgan 3.2% Utah 3.1% Rich 3.3% Summit 3.2% Wasatch 3.2% Duchesne 6.7% Daggett 4.6% Uintah 5.8% Juab 3.8% Carbon 5.4% State Rate = 3.5% 3.2% or lower Millard 3.4% Sanpete 4.0% Sevier 4.2% Emery 5.8% Grand 5.6% 3.3% to 3.5% Beaver 3.8% Piute 6.0% Wayne 8.7% 3.6% to 4.5% Iron 4.2% Garfield 8.3% 4.6% to 5.9% Washington 4.0% Kane 4.2% San Juan 6.9% 6.0% or greater Source: Utah Department of Workforce Services


32 f 2016f Slow Growth in Utah Average Annual Pay 6.0% 5.3% 5.4% 5.5% 5.0% 4.0% 4.0% 3.7% 4.8% 4.8% 4.4% 4.1% 3.7% 3.8% 3.5% 3.6% Average Growth 3.0% 3.0% 3.2% 2.6% 2.3% 2.4% 2.8% 2.6% 2.2% 2.4% 3.1% 2.4% 2.0% 1.6% 1.6%1.6% 1.6%1.6% 1.6% 1.2% 0.0% Source: Utah Department of Workforce Services e = estimate f = forecast
33 Underemployment Remains High Sources: Bureau of Labor Statistics, Macrotrends.net
34 Feb 2012 May 2012 Aug 2012 Nov 2012 Feb 2013 May 2013 Aug 2013 Nov 2013 Feb 2014 May 2014 Aug 2014 Nov 2014 Feb 2015 May-15 US Consumer Confidence Index vs. UT Consumer Attitude Index Zions Bank Utah Consumer Attitude Index United States Consumer Confidence Index 50.0 Source: U.S. CCI from The Conference Board and Utah CAI from Cicero Group
35 Jul 2011 Jan 2012 Jul 2012 Jan 2013 Jul 2013 Jan 2014 Jul 2014 Jan 2015 Consumer Price Index Change Rate Wasatch Front vs. United States 4.5% 4.0% 3.5% 3.0% 2.5% 2.0% 1.5% 0.5% 0.0% -0.5% - Year Over Year Change United States CPI Zions Bank Wasatch Front CPI Source: U.S. CPI from National Bureau of Labor Statistics and Wasatch Front CPI from Cicero Group
36 National Housing Starts New Housing Units by Permit Type 1,800 1,600 1,400 1,200 1, Single-Family Units Multifamily Source: U.S. Department of Commerce and U.S. Census Bureau
37 f Utah Residential Construction Activity 25,000 20,000 15,000 10,000 5,000 0 Single-Family Units Multifamily Source: University of Utah, David Eccles School of Business, Bureau of Economic and Business Research
38 Thousands U.S. vs. UT Median Existing Home Prices $240 $220 $200 $180 $160 $140 $120 Utah United States Source: Moody s Analytics
39 f 2016f Millions UT Value of New Construction $8,000 $7,000 $6,000 $5,000 $4,000 $3,000 $2,000 $1,000 $0 Residential Nonresidential Renovations Total Source: University of Utah, David Eccles School of Business, Bureau of Economic and Business Research f = forecast
40 Utah Below National Average Foreclosure Rates CA 1.10% WA 2.04% OR 2.74% NV 3.33% AK 0.89% ID 1.32% UT 1.06% AZ 0.85% Note: Seasonally Adjusted, Second Quarter 2014 Source: Moody s Economy.com MT 0.87% WY 0.52% HI 3.88 % CO 0.86% NM 2.92% U.S. 2.49%, Utah 1.06% ND 0.68% SD 0.87% NE 0.72% KS 1.50% TX 1.01% OK 2.40% MN 0.94% IA 1.63% MO 1.08% AR 1.69 % WI 1.71% LA 2.11% IL 3.68% MS 1.73% MI 1.22% IN 2.54% TN 1.25% OH 2.88% KY 2.24% AL 1.43%.99% or lower 1.00% to 1.48% 1.49% to 2.48% 4.00% or more WV 1.12% VT 2.96% PA 2.81% VA 0.91% NC 1.44% SC 2.41% GA 1.46% FL 6.91% NH 1.35% NY 5.89% ME 4.51% DC 2.59% 2.49% to 3.99% (at or above national average) CT 3.96% DE 2.95% MD 3.24% MA 1.95% RI 2.80% NJ 8.10%
41 Foreclosure Rates Dropping United States Utah Nevada Source: Federal Housing Finance Agency and Economy.com

42 Utah Has One of Most Diverse Economies in Nation Ten Most Diversified Economies in the Country 2012 Missouri 98.4 North Carolina Illinois Utah Arizona 97.2 Georgia Kansas Maine Nebraska Minnesota Source: DWS - Workforce Research and Analysis Division
43 Three-Year Average Annual Population Growth Rate % 1.4% 1.2% 1.1% 1.1% 1.4% Average Population Growth Rate 1.5% 1.1% 0.8% 0.7% 0.9% 0.8% 0.6% 0.4% 0.2% 0.0% United States Mountain States Arizona Colorado Idaho Montana Nevada New Mexico Utah Wyoming Source: U.S. Census Bureau
44 Average Annual Employment Growth Rate % 3.0% 2.5% 2.3% Average Employment Growth Rate 1.7% 2.9% 2.0% 1.6% 1.9% 1.8% 1.9% 1.6% 1.7% 1.5% 0.5% 0.0% United States Mountain States Arizona Colorado Idaho Montana Nevada New Mexico Utah Wyoming Source: U.S. Bureau of Labor Statistics
45 Average Annual GDP Growth Rate % 4.0% 3.9% 3.5% 3.0% 2.8% 2.9% Average Annual GDP Growth Rate 2.2% 2.5% 2.4% 2.3% 2.0% 2.0% 2.0% 1.5% 1.4% 1.3% 1.3% 0.5% 0.0% United States Mountain States Arizona Colorado Idaho Montana Nevada New Mexico Utah Wyoming Source: U.S. Bureau of Economic Analysis

46 Utah Economic Indicators Population Nonfarm Employment Unemployment Rate Personal Income Home Prices Retail Sales e 2015f 2016f Source: State of Utah Revenue Assumptions Working Group e = estimate f = forecast
47 Robert Spendlove Economic and Public Policy Officer Phone: Presentations are offered for informational purposes only and should not be construed as tax, legal, financial or business advice. Please contact a professional about your specific needs and advice. Presentations may contain trademarks or trade names owned by parties who are not affiliated with Zions Bank. Use of such marks does not imply any sponsorship by or affiliation with third parties, and Zions Bank does not claim any ownership of or make representations about products and services offered under or associated with such marks.
Zions Bank Economic Overview. March 14, 2017
 Zions Bank Economic Overview March 14, 2017 National Economic Conditions Dow 20,000 The Trump Bump Dow Reaches New Heights Following U.S. Presidential Election Source: Wall Street Journal 120.0 110.0 100.0
Zions Bank Economic Overview Cache Valley Home Builders Association. April 12, 2017
 Zions Bank Economic Overview Cache Valley Home Builders Association April 12, 2017 National Economic Conditions Dow 20,000 The Trump Bump Dow Reaches New Heights Following U.S. Presidential Election Source:
Zions Bank Economic Overview Logan Rotary Club. March 16, 2017
 Zions Bank Economic Overview Logan Rotary Club March 16, 2017 National Economic Conditions Dow 20,000 The Trump Bump Dow Reaches New Heights Following U.S. Presidential Election Source: Wall Street Journal
Zions Bank Economic Overview West Point Economic Summit. March 30, 2017
 Zions Bank Economic Overview West Point Economic Summit March 30, 2017 National Economic Conditions Dow 20,000 The Trump Bump Dow Reaches New Heights Following U.S. Presidential Election Source: Wall Street
Zions Bank Economic Overview Utah Bankers Association Emerging Bank Leaders Conference. November 9, 2017
 Zions Bank Economic Overview Utah Bankers Association Emerging Bank Leaders Conference November 9, 2017 National Economic Conditions Dow Breaks 23,000 The Trump Bump Dow Reaches New Heights Following U.S.
Zions Bank Economic Overview Coldwell Banker Commercial Group. November 6, 2017
 Zions Bank Economic Overview Coldwell Banker Commercial Group November 6, 2017 National Economic Conditions Dow Breaks 23,000 The Trump Bump Dow Reaches New Heights Following U.S. Presidential Election
Zions Bank Economic Overview
 Zions Bank Economic Overview Utah Bankruptcy Lawyers Forum March 20, 2018 National Economic Conditions When Good News is Bad News Is Good News?? Dow Tops 26,000 Up 44% Since 2016 Election Source: Wall
Zions Bank Economic Overview Utah Government Finance Officers Assoc. April 21, 2017
 Zions Bank Economic Overview Utah Government Finance Officers Assoc. April 21, 2017 National Economic Conditions Dow 20,000 The Trump Bump Dow Reaches New Heights Following U.S. Presidential Election Source:
Zions Bank Economic Overview. December 5, 2017
 Zions Bank Economic Overview December 5, 2017 National Economic Conditions Dow Breaks 24,000 The Trump Bump Dow Reaches New Heights Following U.S. Presidential Election Source: Federal Reserve Bank of
Zions Bank Economic Overview
 Zions Bank Economic Overview National Assoc of Credit Managers Member Seminar December 12, 2017 National Economic Conditions Dow Breaks 24,000 The Trump Bump Dow Reaches New Heights Following U.S. Presidential
Zions Bank Economic Overview
 Zions Bank Economic Overview Utah Manufacturers Association & Associated General Contractors Utah Finance and Economic Summit September 26, 2017 National Economic Conditions Dow Breaks 22,000 The Trump
Zions Bank Economic Overview
 Zions Bank Economic Overview UAFS & NAIB Convention September 14, 2017 National Economic Conditions Dow Breaks 22,000 The Trump Bump Dow Reaches New Heights Following U.S. Presidential Election Source:
Economic Forecast to Professional Republican Women Association. January 5, 2017
 Economic Forecast to Professional Republican Women Association January 5, 2017 Economic Headwinds National and international uncertainty Continued low energy prices Depressed business investment Unstable
Understanding the New Trump Economy Economic Overview. November 17, 2016
 Understanding the New Trump Economy Economic Overview November 17, 2016 Uncertainty at the Na@onal and Interna@onal Level Source: Bureau of Labor Statistics The Trump Bump Why? National Job Growth 500
Zions Bank Economic Overview
 Zions Bank Economic Overview Utah Valley University Business and Economic Forum May 18, 2017 National Economic Conditions Dow 20,000 The Trump Bump Dow Reaches New Heights Following U.S. Presidential Election
Zions Bank Economic Overview
 Zions Bank Economic Overview Intermountain Credit Education League May 10, 2018 Dow Tops 26,000 Up 48% Since 2016 Election Jan 26, 2018 26,616 Oct 30, 2016 17,888 Source: Wall Street Journal Dow Around
Zions Bank Economic Overview
 Zions Bank Economic Overview Kenworth National Dealers Conference November 8, 2018 1 National Economic Conditions 2 Volatility Returns to the Stock Market 27,000 Dow Jones Industrial Average October 10,
Zions Bank Economic Overview
 Zions Bank Economic Overview Veteran Owned Business Conference May 11, 2018 Dow Tops 26,000 Up 48% Since 2016 Election Jan 26, 2018 26,616 Oct 30, 2016 17,888 Source: Wall Street Journal Dow Around Correction
Zions Bank Economic Overview
 Zions Bank Economic Overview Logan Rotary Club June 28, 2018 Dow Tops 26,000 Up 48% Since 2016 Election Jan 26, 2018 26,616 Oct 30, 2016 17,888 Source: Wall Street Journal Dow Around Correction Territory
Zions Bank Economic Overview
 Zions Bank Economic Overview WIB Education Summit September 19, 2017 National Economic Conditions Dow Breaks 22,000 The Trump Bump Dow Reaches New Heights Following U.S. Presidential Election Source: Federal
Zions Bank Economic Overview Meridian Chamber of Commerce. May 2, 2017
 Zions Bank Economic Overview Meridian Chamber of Commerce May 2, 2017 National Economic Conditions Dow 20,000 The Trump Bump Dow Reaches New Heights Following U.S. Presidential Election Source: Wall Street
Rotary Club of Pocatello Economic Overview. April 28, 2016
 Rotary Club of Pocatello Economic Overview April 28, 2016 Economic Headwinds National and international uncertainty Continued low energy prices Depressed business investment Unstable inflation outlook
More of the Same; Or now for Something Completely Different?
 More of the Same; Or now for Something Completely Different? C2ER Place cover image here Richard Wobbekind Chief Economist and Associate Dean for Business and Government Relations June 14, 2017 Real GDP
Colorado Counties Treasurers Association
 Colorado Counties Treasurers Association Place cover image here Richard Wobbekind Executive Director, Business Research Division June 21, 2016 Real GDP Growth Quarterly and Annualized Real GDP 1990-2016
Cement & Construction Outlook
 Cement & Construction Outlook Minnesota Concrete Council November 17, 2011 Dave Zwicke, PCA Analytics Manager, Sr. Economist Bottom Line Economy in a slow growth period characterized by tepid job gains.
The 2019 Economic Outlook Forum The Outlook for MS
 The 2019 Economic Outlook Forum The Outlook for MS February 2019 Mississippi University Research Center Mississippi Institutions of Higher Learning Darrin Webb, State Economist dwebb@mississippi.edu (601)432-6556
2016 River Use Statistics -by Steve Sullivan
 Grand Canyon River Office 2016 River Use Statistics -by Steve Sullivan Topics River Use Statistics Overview Commercial River Use Statistics Noncommercial River Use Statistics Noncommercial River Lottery
Regional Economic Conditions
 Regional Economic Conditions Jason Bram, Research Officer Community Advisory Group Meeting June 27, 2017 The views expressed here are those of the presenter and do not necessarily represent those of the
SEASON FINAL REGISTRATION REPORTS
 Materials Included: 2015-2016 SEASON FINAL REGISTRATION REPORTS 2014-15 & 2015-16 Comparison by Group 2 2015-16 USA Hockey Member Counts 3 2015-16 8 and Under Report 4 2015-16 Players & Girls/Women by
Overview of the Regional Economy
 Overview of the Regional Economy Jason Bram, Research Officer Presentation to the Community Depository Institutions Advisory Council (CDIAC) October 13, 2017 The views expressed here are those of the presenter
Education Committee Economic Background and Issue Review
 Education Committee Economic Background and Issue Review Montpelier, Vermont January 22, 2014 Thomas E. Kavet State Economist and Principal Economic Advisor to the Vermont State Legislature Since 1996
Understanding the Regional Divergence in Adult Mortality in the United States
 Understanding the Regional Divergence in Adult Mortality in the United States Andrew Fenelon, PhD University of Maryland, College Park American Life Expectancy 77 76 75 Life Expectancy in Years 74 73 72
Traffic Safety Facts. State Traffic Data Data. Overview
 Traffic Safety Facts 2015 Data June 2017 DOT HS 812 412 State Traffic Data Key Findings Traffic fatalities increased by 7 percent from 2014 to 2015 (32,744 to 35,092) for the United States. The fatality
Target Shooting by Hunters and Their Use of Shooting Ranges: 1975, 1991, and 2011
 U.S. Fish & Wildlife Service Target Shooting by Hunters and Their Use of Shooting Ranges: 1975, 1991, and 2011 Addendum to the 2011 National Survey of Fishing, Hunting, and Wildlife-Associated Recreation
Overview of the Regional Economy
 Overview of the Regional Economy Jason Bram, Research Officer Presentation to the Community Depository Institutions Advisory Council (CDIAC) March 5, 2019 The views expressed here are those of the presenter
States. Postal Abbreviations LEARN THE. AND. by Joy A. Miller
 1 States LEARN THE AND Postal Abbreviations by Joy A. Miller http://fivejs.com Learn the States and Postal Abbreviations Copyright 2009 Published by Joy A. Miller http://fivejs.com All rights reserved.
Anatomy of a Jackpot: Characteristics of Purchasers of Large Jackpot Lottery Tickets
 Anatomy of a Jackpot: Characteristics of Purchasers of Large Jackpot Lottery Tickets The 15 th International Conference on Gambling & Risk Taking May 27-31, 2013 Todd Maki & Don Feeney 1 Although not shown
Babson Capital/UNC Charlotte Economic Forecast. May 13, 2014
 Babson Capital/UNC Charlotte Economic Forecast May 13, 2014 Outline for Today Myths and Realities of this Recovery Positive Economic Signs Negative Economic Signs Outlook for 2014 The Employment Picture
U.S. and Colorado Economic Outlook National Association of Industrial and Office Parks. Business Research Division Leeds School of Business
 U.S. and Colorado Economic Outlook National Association of Industrial and Office Parks Presented by the Business Research Division Leeds School of Business University of Colorado at Boulder U.S. Economic
Economic Growth in the Trump Economy
 Economic Growth in the Trump Economy Presented to State Data Center Conference William F. Fox, Director November 18, 2016 GDP Grows, Though Slowly 10.0 8.0 Percentage Change, Previous Qtr, SAAR 6.0 4.0
2012 Payne County Economic Outlook
 2012 Payne County Economic Outlook by Dan Rickman Regents Professor of Economics and Oklahoma Gas and Electric Services Chair in Regional Economic Analysis http://economy.okstate.edu/ 20,000 U.S. Real
2019 Economic Outlook: Will the Recovery Ever End?
 2019 Economic Outlook: Will the Recovery Ever End? Advantage Bank Place cover image here Richard Wobbekind Senior Economist and Associate Dean for Business and Government Relations November 15 th, 2018
2009 National Pharmacist Workforce Study. Visual Data
 2009 National Pharmacist Workforce Study Visual Data Figure 1.1: National Aggregate g Demand Index Values http://www.pharmacymanpower.com/ 5 4 3 4.28 4.07 Shortage Surplus 4.19 4.07 4.02 3.97 3.92 4.21
CREATIVE DESTRUCTION AND THE KNOWLEDGE ECONOMY
 CREATIVE DESTRUCTION AND THE KNOWLEDGE ECONOMY Where people work and how it has changed. Creative Destruction & the Process of Change The Second Industrial Revolution & Agriculture Miracle. The Third Revolution
17t h Ann u a l Re p o r t on th e ( ) POLICY STUDY
 POLICY STUDY") July 2008 17t h Ann u a l Re p o r t on th e Per f o r m a n c e of Stat e Hi g h w a y Sy s t e m s (1984 2006) By David T. Hartgen, Ph.D., P.E., and Ravi K. Karanam Project Director: Adrian T. Moore,
July 2008 17t h Ann u a l Re p o r t on th e Per f o r m a n c e of Stat e Hi g h w a y Sy s t e m s (1984 2006) By David T. Hartgen, Ph.D., P.E., and Ravi K. Karanam Project Director: Adrian T. Moore,
Wenlin Liu, Senior Economist. Stateof Wyoming. Economic Analysis Division State of Wyoming 1
 WYOMING DEMOGRAPHIC AND ECONOMIC TREND LCCC LIFE Program April 7, 2012 Cheyenne, Wyoming Wenlin Liu, Senior Economist Economic Analysis Division Stateof Wyoming Economic Analysis Division State of Wyoming
SECTION SEVEN. Characteristics of People with IDD and Staff in Large Public Residential Facilities
 SECTION SEVEN Characteristics of People with IDD and Staff in Large Public Residential Facilities FY Section 7: Characteristics of People with IDD and Staff in Large State-Operated IDD Facilities This
Federal Regulatory Update WTBA/WisDOT Contractor/Engineer Conference
 Federal Regulatory Update 2019 WTBA/WisDOT Contractor/Engineer Conference by Nick Goldstein ARTBA Vice President of Regulatory & Legal Issues January 17, 2019 How the Public Feels Regulations and Transportation
Kevin Thorpe Financial Economist & Principal Cassidy Turley
 Kevin Thorpe Financial Economist & Principal Cassidy Turley Economic & Commercial Real Estate Outlook Kevin Thorpe, Chief Economist 2012 Another Year Of Modest Improvement 2006Q1 2006Q3 2007Q1 2007Q3 2008Q1
Naples, Marco Island, Everglades Convention and Visitors Bureau May 2018 Visitor Profile
 RESEARCH DATA SERVICES, INC. 777 SOUTH HARBOUR ISLAND BOULEVARD SUITE 260 TAMPA, FLORIDA 33602 TEL (813) 254-2975 FAX (813) 223-2986 Naples, Marco Island, Everglades Convention and Visitors Bureau May
The MS Economic Outlook The Fall Forum
 The Economic Outlook The Fall Forum Darrin Webb, State Economist University Research Center Mississippi Institutions of Higher Learning dwebb@mississippi.edu (601)432 6556 September 2016 University Research
National and Regional Economic Outlook. Central Southern CAA Conference
 National and Regional Economic Outlook Central Southern CAA Conference Dr. Mira Farka & Dr. Adrian R. Fleissig California State University, Fullerton April 13, 2011 The Painfully Slow Recovery The Painfully
Minimum Wages By State, Municipality and County
 Compliance Alert January 21 st, 2019 Minimum Wages By State, Municipality and County AL N/A N/A AK $9.89 AZ $11.00 $12.00 - January 1, 2020 Flagstaff $12.00 $13.00 - January 1, 2020 $15.00 - January 1,
Gay Gilbert, Administrator Unemployment Insurance USDOL/ETA June 22, 2016
 Gay Gilbert, Administrator Unemployment Insurance USDOL/ETA June 22, 2016 Where is Our Program Today? Most Critical Challenges A Program in Transition Using our Valuable Resources What s Important for
USA TRIATHLON MEMBERSHIP REPORT TABLE OF CONTENTS
 USA TRIATHLON MEMBERSHIP REPORT This report has been prepared by the Membership Services staff based on active memberships on December 31, 2015. Media requests can be addressed to communications@usatriathlon.org.
Legislative Economic Briefing
 Legislative Economic Briefing February 16, 2017 Mississippi University Research Center Mississippi Institutions of Higher Learning Darrin Webb, State Economist dwebb@mississippi.edu (601)432-6556 To subscribe
Agricultural Weather Assessments World Agricultural Outlook Board
 Texas (8) Missouri (7) South Dakota (6) Kansas (5) Nebraska (5) North Dakota (5) Oklahoma (5) Kentucky (4) Montana (4) California (3) Minnesota (3) New York (3) Pennsylvania (3) Tennessee (3) Wisconsin
Agricultural Weather Assessments World Agricultural Outlook Board
 Texas (8) Missouri (7) South Dakota (6) Kansas () Nebraska () North Dakota () Oklahoma () Kentucky (4) Montana (4) California (3) Minnesota (3) New York (3) Pennsylvania (3) Tennessee (3) Wisconsin (3)
Your Texas Economy. Current through: Tuesday, Nov 20, 2018
 Your Texas Economy Current through: Tuesday, Nov 20, 2018 Overview of Texas Economy The Texas economy is growing robustly in 2018 2018 job growth through October is 2.9 percent annualized compared to 2.1
Are Highways Crumbling? State Performance Summaries,
 Policy Summary 407 February 2013 Are Highways Crumbling? State Performance Summaries, 1989 2008 by David T. Hartgen, Ph.D., P.E., M. Gregory Fields and Elizabeth San José Project Director: Adrian T. Moore,
MAINTAINING MOMENTUM:
 MAINTAINING MOMENTUM: 2018 National Economic Update September 12, 2018 noun mo men tum \ mō-ˈmen-təm, mə- \ 1 b : the strength or force that allows something to continue or to grow stronger or faster as
Bob Costello Chief Economist & Vice President American Trucking Associations. Economic & Motor Carrier Industry Trends. September 10, 2013
 Bob Costello Chief Economist & Vice President American Trucking Associations Economic & Motor Carrier Industry Trends September 10, 2013 The Freight Economy Washington continues to be a headwind on economic
SUMMARY MEMBERSHIP ANALYSIS FOR THE STATE OF. Trends of first-time 4 to 8 year-old male ice hockey players to
 SUMMARY MEMBERSHIP ANALYSIS FOR THE STATE OF New York Trends of first-time 4 to 8 year-old male ice hockey players 1997-98 to 27-8 p.2 -Background and Methodology p.3 -National Acquisition and Retention
SUMMARY MEMBERSHIP ANALYSIS FOR THE STATE OF. Trends of first-time 4 to 8 year-old male ice hockey players to
 SUMMARY MEMBERSHIP ANALYSIS FOR THE STATE OF New Mexico Trends of first-time 4 to 8 year-old male ice hockey players 1997-98 to 27-8 p.2 -Background and Methodology p.3 -National Acquisition and Retention
SUMMARY MEMBERSHIP ANALYSIS FOR THE STATE OF. Trends of first-time 4 to 8 year-old male ice hockey players to
 SUMMARY MEMBERSHIP ANALYSIS FOR THE STATE OF Rhode Island Trends of first-time 4 to 8 year-old male ice hockey players 1997-98 to 27-8 p.2 -Background and Methodology p.3 -National Acquisition and Retention
Wisconsin Concrete Pavement Association. Ed Sullivan, SVP & Chief Economist
 Wisconsin Concrete Pavement Association Ed Sullivan, SVP & Chief Economist February 2018 I Pewaukee, Wisconsin Labor Markets Net Job Creation Monthly Gain 500 7.0% Unemployment Rate U3 Measurement 400
How Much Wind Is in the Sails?
 How Much Wind Is in the Sails? Erie Chamber of Commerce Place cover image here Richard Wobbekind Senior Economist and Associate Dean for Business and Government Relations September 20, 2017 Real GDP Growth
Population of Puerto Rico (Millions of people)
") Dr. Mario Marazzi-Santiago Instituto de Estadísticas Executive Director August 15, 2015 Population of Puerto Rico (Millions of people) 4.5 4 3.5 3 2.5 2 1.5 1 0.5 1950 1955 1960 1965 1970 1975 1980 1985
Dr. Mario Marazzi-Santiago Instituto de Estadísticas Executive Director August 15, 2015 Population of Puerto Rico (Millions of people) 4.5 4 3.5 3 2.5 2 1.5 1 0.5 1950 1955 1960 1965 1970 1975 1980 1985
Your Texas Economy. Last updated: January 30, 2018
 Your Texas Economy Last updated: January 30, 2018 Texas economy strong in 2017 2017 job growth was 2.4% Overview 2015/2016 job growth was much weaker due to the oil bust (1.3% and 1.2%, respectively) 2014
SHOOTING IN AMERICA. An Economic Force for Conservation 2018 EDITION
 TARGET SHOOTING IN AMERICA An Economic Force for Conservation 2018 EDITION INTRODUCTION Target shooting is enjoyed by millions of Americans each year. It is so popular, in fact: More people participate
Conduent EDI Solutions, Inc. Eligibility Gateway 270/271 Payer Guide Medicaid
 Conduent EDI Solutions, Inc. Eligibility Gateway 270/271 Payer Guide Medicaid Version 4010 Technical Support: egateway@conduent.com May 10, 2017 2017 Conduent Business Services, LLC. All rights reserved.
Bikes Belong Survey: The Size & Impact of Road Riding Events
 Bikes Belong Survey: The Size & Impact of Road Riding Events November 2009 Recreational road bicycling events are popular all across the United States. Participants are inspired by the opportunities to
SUMMARY MEMBERSHIP ANALYSIS FOR THE STATE OF. New Hampshire. Trends of first-time 4 to 8 year-old male ice hockey players to
 SUMMARY MEMBERSHIP ANALYSIS FOR THE STATE OF New Hampshire Trends of first-time 4 to 8 year-old male ice hockey players 1997-98 to 27-8 p.2 -Background and Methodology p.3 -National Acquisition and Retention
Riverside Rising Economic Outlook for the Region April 2015
 Analysis. Answers Riverside Rising Economic Outlook for the Region April 2015 Beacon Economics, LLC California fact versus fiction Looking back a few years (2009 / 2010) everyone was saying that CA would
Economic Overview. Melissa K. Peralta Senior Economist April 27, 2017
 Economic Overview Melissa K. Peralta Senior Economist April 27, 2017 TTX Overview TTX functions as the industry s railcar cooperative, operating under pooling authority granted by the Surface Transportation
 www.colorado.edu/leeds/brd CAREER ADVANCING DEGREES FROM LEEDS EVENING MBA PROGRAM FOR WORKING PROFESSIONALS #1 PART-TIME MBA Program in Colorado according to U.S. News & World Report Engage in a collaborative
8:00 am 5:00 pm NASRO Basic Course Music Road Resort Hotel. 8:00 am 5:00 pm NASRO Basic Course - ** Music Road Resort Hotel
 NASRO NATIONAL SCHOOL SAFETY CONFERENCE Smoky Mountains, TN June 23 28, 2019 This event has been approved for UASI reimbursement. Travel, Per Diem, Tuition reimbursement, Backfill and Overtime is at the
Produce Safety Alliance Course and Trainer Totals through September 19, 2018
 Course and Trainer Totals through 19, 218 Totals: 216 218 Train-the-Trainer Courses Domestic 58 Total TTT Courses since Sept. 216 International 12 Total 7 2,27 Total Trainer Participants 1,716 (Domestic)
Beyond Bullet Points: Statistics, Trends and Analysis
 Beyond Bullet Points: Statistics, Trends and Analysis Vail R. Brown VP, Global Business Development & Marketing Vail@str.com @vail_str 5 THINGS TO KNOW www.hotelnewsnow.com Click on Data Presentations
President and Chief Executive Officer Federal Reserve Bank of New York Washington and Lee University H. Parker Willis Lecture in Political Economics
 The U.S. Economic Outlook Chartspresented by WilliamC Dudley Charts presented by William C. Dudley President and Chief Executive Officer Federal Reserve Bank of New York Washington and Lee University H.
Southern California Economic Forecast & Industry Outlook
 2016-17 Southern California Economic Forecast & Industry Outlook Robert A. Kleinhenz, Ph.D. Sr. VP/Chief Economist, LAEDC February 17, 2016 Outline U.S. Economy California Economy Southern California Economy
The U.S. Economy How Serious A Downturn? Nigel Gault Group Managing Director North American Macroeconomic Services
 The U.S. Economy How Serious A Downturn? Nigel Gault Group Managing Director North American Macroeconomic Services Growth Is Cooling; But a Soft Landing Is Likely (Real GDP, annualized rate of growth)
Analyzing the Energy Economy Michael Plante Senior Research Economist
 Federal Reserve Bank of Dallas Analyzing the Energy Economy Michael Plante Senior Research Economist Disclaimer Disclaimer: The statements in this presentation do not represent the official views of the
Briefing on the State of the State. presented to the. SCAA Schuyler Center for Analysis and Advocacy
 Briefing on the State of the State presented to the SCAA Schuyler Center for Analysis and Advocacy Rae D. Rosen Assistant Vice President Federal Reserve Bank of New York November 16, 2006 Key Points: Economic
Larry Kessler, Ph.D. Boyd Center for Business & Economic Research University of Tennessee
 Larry Kessler, Ph.D. Boyd Center for Business & Economic Research University of Tennessee The U.S. economy has now enjoyed 7 years of economic growth since the Great Recession Real GDP grew by 1.2% in
Current Hawaii Economic Conditions. Eugene Tian
 Current Hawaii Economic Conditions Eugene Tian Department of Business, Economic Development & Tourism At the PATA/TTRA 2016 Annual Outlook & Economic Forecast Forum February 3, 2016 Positive Signs in the
Economy On The Rebound
 Economy On The Rebound Robert Johnson Associate Director of Economic Analysis November 17, 2009 robert.johnson@morningstar.com (312) 696-6103 2009, Morningstar, Inc. All rights reserved. Executive
Habit Formation in Voting: Evidence from Rainy Elections Thomas Fujiwara, Kyle Meng, and Tom Vogl ONLINE APPENDIX
 Habit Formation in Voting: Evidence from Rainy Elections Thomas Fujiwara, Kyle Meng, and Tom Vogl ONLINE APPENDIX Figure A1: Share of Counties with Election-Day Rainfall by Year Share of counties with
What s Ahead for The Colorado Economy?
 What s Ahead for The Colorado Economy? Colorado Counties Inc. Place cover image here Richard Wobbekind Senior Economist and Associate Dean for Business and Government Relations November 28, 2017 Real GDP
Warm Mix Asphalt in the United States: From Evolution to Revolution
 Warm Mix Asphalt in the United States: From Evolution to Revolution Matthew Corrigan, P.E. Asphalt Pavement Engineer Mobile Asphalt Testing Trailer Technical Manager U.S. DOT Federal Highway Administration
Xerox EDI Eligibility Gateway 270/271 Payer Guide
 Xerox EDI Eligibility Gateway 270/271 Payer Guide Medicaid Version 4010 Technical Support: egateway@xerox.com Updated March 25, 2016 2015 Xerox Corporation. All rights reserved. XEROX and XEROX and Design
Big Changes, Unknown Impacts
 Big Changes, Unknown Impacts Boulder Economic Forecast Place cover image here Richard Wobbekind Senior Economist and Associate Dean for Business and Government Relations January 17, 2018 Real GDP Growth
Hotel Industry Overview
 Hotel Industry Overview Lodging Conference Ali Hoyt Senior Director, Consulting and Analytics ahoyt@str.com 2018 STR, Inc. All Rights Reserved. Any reprint, use or republication of all or a part of this
Featured Fish-Week ofjuly 16th
 Featured Fish-Week ofjuly 16th 5-6 Premium GradeKoi 25% O f,only$8.21each! 5-6 GinRinMixKoi 15% O f,only$10.41each! 6-8 StandardGradeButerflyKoi Buy1FulCount,Get1FulCount50% O f! 3-4 Yelow CometGoldfish
Economic Update and Outlook
 Economic Update and Outlook NAIOP Vancouver Chapter November 15, 2012 Helmut Pastrick Chief Economist Central 1 Credit Union Outline: Global, U.S., and Canadian economic conditions Canada economic and
Northwest Economic Research Center College of Urban and Public Affairs Forecast Breakfast Economic Outlook
 Northwest Economic Research Center College of Urban and Public Affairs 2019 Forecast Breakfast Economic Outlook 1/10/2019 2 U.S. ECONOMY 1/10/2019 3 1980 1982 1984 1986 1988 1990 1992 1994 1996 1998 2000
WORKFORCE LOCAL AREA EMPLOYMENT STATISTICS (LAUS)
") AUGUST 2018 WORKFORCE LOCAL AREA EMPLOYMENT STATISTICS (LAUS) 1,200,000 1,100,000 1,000,000 900,000 Labor Force Employment 1,152,626 1,116,938 800,000 700,000 600,000 500,000 2016 to 2017: 35957 (3.1%)
AUGUST 2018 WORKFORCE LOCAL AREA EMPLOYMENT STATISTICS (LAUS) 1,200,000 1,100,000 1,000,000 900,000 Labor Force Employment 1,152,626 1,116,938 800,000 700,000 600,000 500,000 2016 to 2017: 35957 (3.1%)
WORKFORCE LOCAL AREA EMPLOYMENT STATISTICS (LAUS)
") AUGUST 2016 WORKFORCE LOCAL AREA EMPLOYMENT STATISTICS (LAUS) 1,150,000 1,100,000 1,050,000 1,000,000 950,000 900,000 850,000 800,000 750,000 700,000 Labor Force Employment June 2015 to June 2016: 36,504
AUGUST 2016 WORKFORCE LOCAL AREA EMPLOYMENT STATISTICS (LAUS) 1,150,000 1,100,000 1,050,000 1,000,000 950,000 900,000 850,000 800,000 750,000 700,000 Labor Force Employment June 2015 to June 2016: 36,504
Texas Economic Outlook: Recovery in 2010 Keith Phillips Federal Reserve Bank of Dallas San Antonio Office
 Texas Economic Outlook: Recovery in 2010 Keith Phillips Federal Reserve Bank of Dallas San Antonio Office The views expressed in this presentation are strictly those of the author and do not necessarily
Dr. James P. Gaines Research Economist recenter.tamu.edu
 Texas Uncertain Economy in a World of Uncertain Oil Prices Dr. James P. Gaines Research Economist recenter.tamu.edu National Economic Recovery still Going 2 U.S. Outlook Expected GDP growth still modest: