SQUID, OCTOPUS, HERRING & MACKEREL PANEL
|
|
|
- Dorothy Lynch
- 5 years ago
- Views:
Transcription

1 SQUID, OCTOPUS, HERRING & MACKEREL PANEL January 19, 2016 Miami, FL


2 THE SQUID, OCTOPUS, HERRING & MACKEREL PANEL Ruth Levy Jim Kenny Mike Daniels Ferran Pauner Egil Sundheim Brady Schofield 2
3 OVERVIEW Global Cephalopod Production (MT) Global Landings Million Tons 4.2% of Total Wild Landings Squid 2,920,000 tons Octopus 347,000 tons Cuttlefish 322,000 tons NSPF 430,000 tons Source: FAO 3
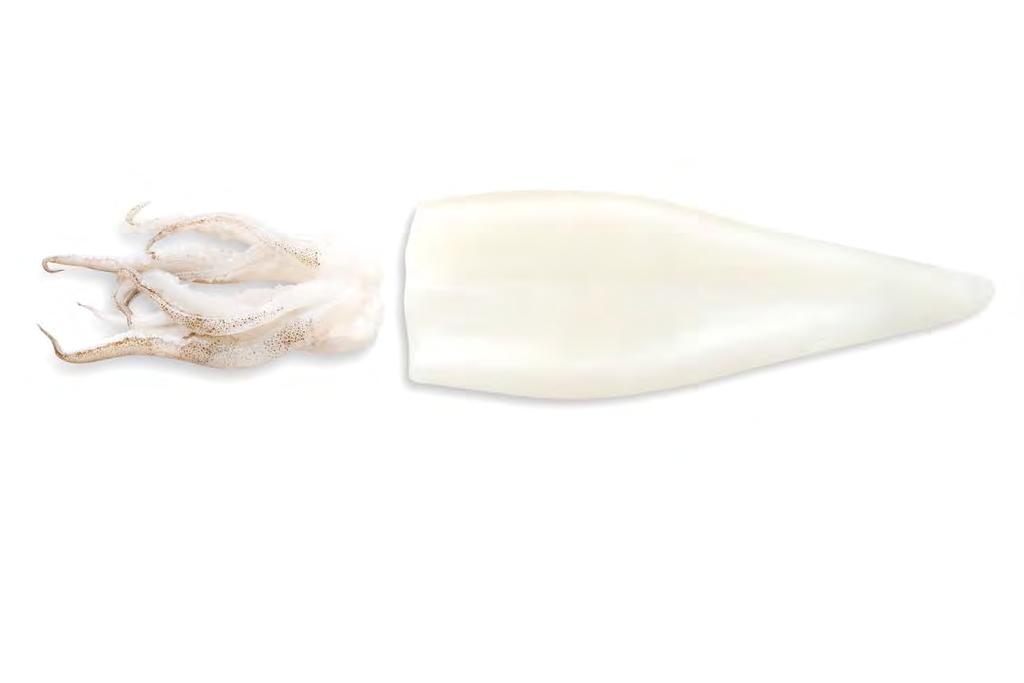
4 SQUID OVERVIEW 4
5 SQUID OVERVIEW Global Squid Production (MT) 4,000,000 World Squid Production (MT) 3,500,000 3,000,000 2,500,000 2,000,000 1,500,000 1,000, , *2014 *2015 Source: FAO and Urner Barry; *Estimates 5
6 SQUID OVERVIEW Global Squid Production (MT) World Squid Production by Country (MT) 1,000, , , , , , , , , , CHINA PERU KOREA, REPUBLIC OF JAPAN ARGENTINA INDONESIA TAIWAN PROVINCE OF CHINA UNITED STATES OF AMERICA THAILAND CHILE RUSSIAN FEDERATION MALAYSIA PHILIPPINES SPAIN FALKLAND IS.(MALVINAS) MOROCCO Source: FAO 6
7 SQUID OVERVIEW Global Production by Species DOSIDICUS GIGAS VARIOUS SQUIDS NEI ILLEX ARGENTINUS TODARODES PACIFICUS COMMON SQUIDS NEI LOLIGO OPALESCENS BERRYTEUTHIS MAGISTER LOLIGO GAHI NOTOTODARUS SLOANI ILLEX ILLECEBROSUS LOLIGO PEALEII SEPIOTEUTHIS LESSONIANA OMMASTREPHES BARTRAMII ILLEX COINDETII LOLIGO REYNAUDII TODARODES SAGITTATUS INDIAN SQUID LOLIGO FORBESII LOLIGO VULGARIS ONYKIA INGENS Source: FAO 7


8 SQUID OVERVIEW Dosidicus gigas Illex argentinus Loligo edulis Loligo gahi Loligo opalescens Loligo pealei Ommastrephes bartramii Todarodes pacificus 8
9 SQUID OVERVIEW US Squid Production (MT) 180, , , , ,000 80,000 60,000 40,000 20, *2015 Source: NOAA, NMFS and Urner Barry 9
10 SQUID OVERVIEW US Squid Imports (MT) 80,000 70,000 60,000 50,000 40,000 30,000 20,000 10, *2015 Source: US Census and Urner Barry s Foreign Trade Data; *Estimate 10
11 SQUID OVERVIEW US Imports by Country (MT) 45,000 40,000 35,000 30,000 25,000 20,000 15,000 10,000 CHINA (MAINLAND) KOREA, REPUBLIC OF ARGENTINA CHINA (TAIWAN) INDIA OTHERS PERU THAILAND 5, *2015 Source: US Census and Urner Barry s Foreign Trade Data; *Estimate 11
12 SQUID OVERVIEW US Squid Exports (MT) 160, , , ,000 80,000 60,000 40,000 20, *2015 Source: US Census and Urner Barry s Foreign Trade Data; *Estimate 12
13 SQUID OVERVIEW US Exports by Country (MT) 100,000 90,000 80,000 70,000 60,000 50,000 40,000 30,000 20,000 10,000 CHINA (MAINLAND) SPAIN PHILIPPINES JAPAN ITALY UNITED KINGDOM MEXICO AUSTRALIA GREECE CANADA FRANCE NETHERLANDS OTHERS *2015 Source: US Census and Urner Barry s Foreign Trade Data 13
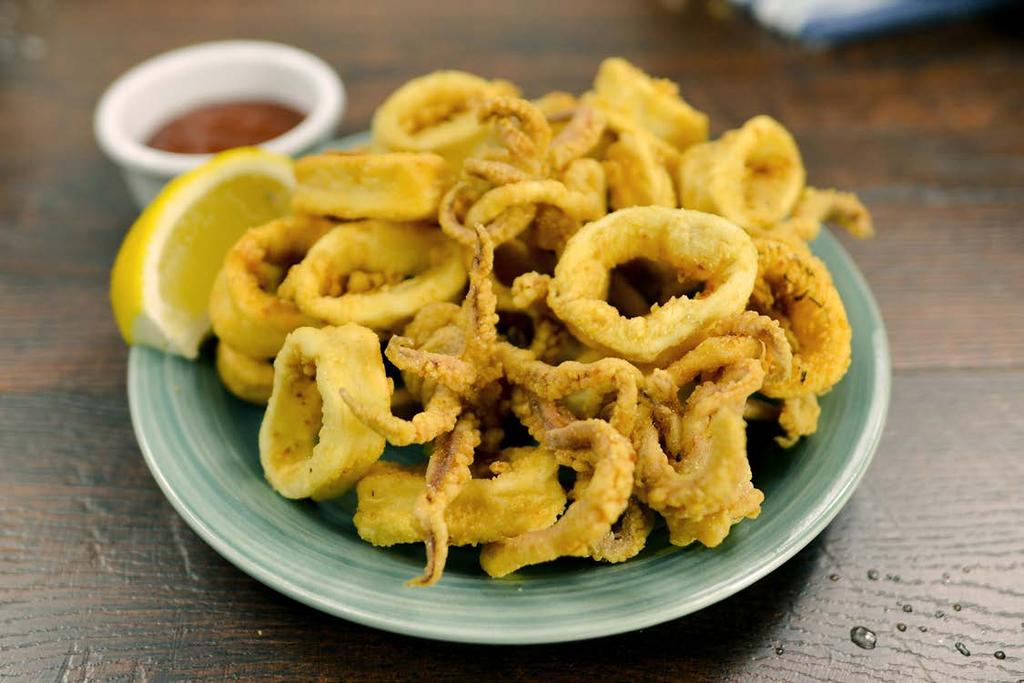
14 SQUID OVERVIEW U.S. Net Supply Domestic Landings MT MILLION LBS MT MILLION LBS 153, , US Consumption (LB) Exports 136, , Imports 66, , NET SUPPLY 73, , We don t eat squid, we eat Calamari.24 lb. per capita estimated consumption Source: US Census, NMFS, and Urner Barry s Foreign Trade Data 14

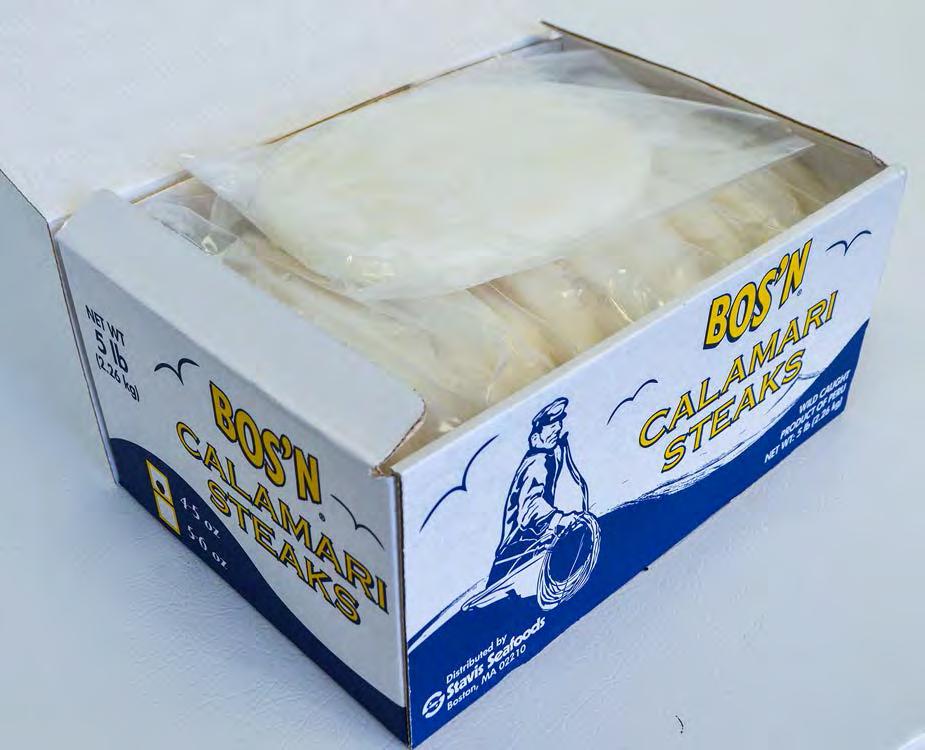
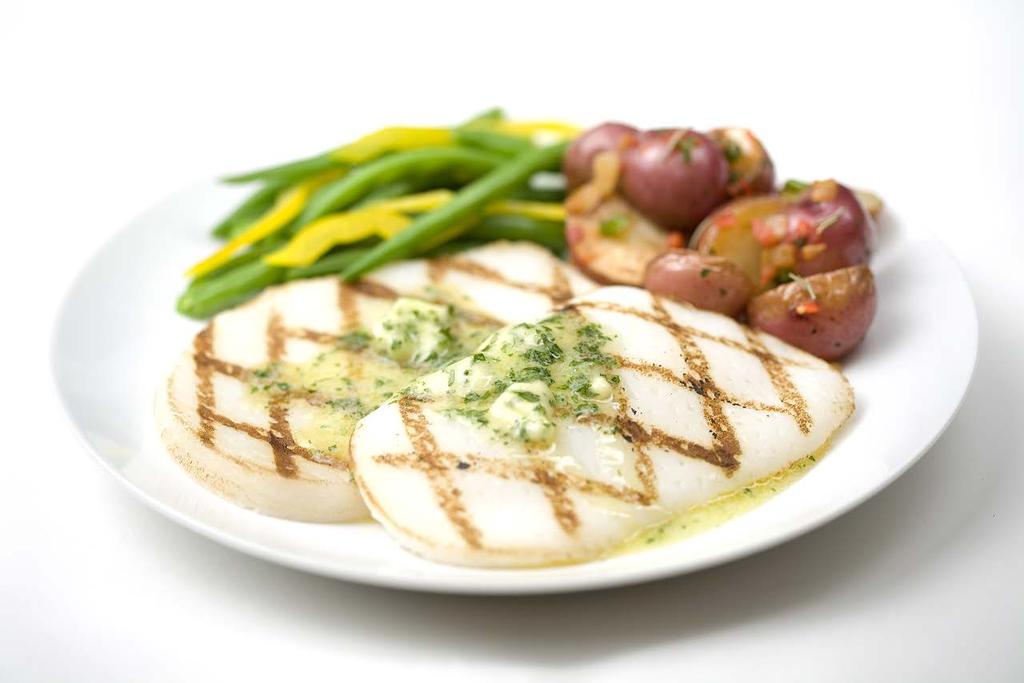
15 SQUID OVERVIEW Market Price Study $4.00 T&T TUBES RINGS R&T STEAKS $3.60 $3.20 $2.80 $2.40 $2.00 $1.60 $1.20 Mar 10 Sep 10 Mar 11 Sep 11 Mar 12 Sep 12 Mar 13 Sep 13 Mar 14 Sep 14 Mar 15 Sep 15 Source: Urner Barry 15
16 SQUID OVERVIEW Market Price Study T&T, THAILAND, 3-5 IN T&T, CHINA, 3-5 IN. $3.50 $3.00 $2.50 $2.00 $1.50 $1.00 Jan-10 Mar-10 May-10 Jul-10 Sep-10 Nov-10 Jan-11 Mar-11 May-11 Jul-11 Sep-11 Nov-11 Jan-12 Mar-12 May-12 Jul-12 Sep-12 Nov-12 Jan-13 Mar-13 May-13 Jul-13 Sep-13 Nov-13 Jan-14 Mar-14 May-14 Jul-14 Sep-14 Nov-14 Jan-15 Mar-15 May-15 Jul-15 Sep-15 Source: Urner Barry 16
17 SQUID OVERVIEW 25.8% 0.5% Growth rate (relative % change) CALAMARI Overview -2.3% 1 year 4 year MenuTrends PENETRATION vs vs Historic Penetration Growth 22.6% 23.8% 25.9% 25.7% 25.9% 26.4% 26.6% 26.1% 25.6% 25.8% Restaurant Type 7.9% 3.8% 22.5% 39.1% 52.1% 5.7% 21.5% 30.9% 19.8% QSR Midscale Fine Dining National Chains Indep. 20.4% Midwest 31.1% Northeast Region 23.1% West 21.9% South
18 SQUID OVERVIEW CALAMARI Cuisines & Applications Menu Types % of menu items served at Applications Top Paired Flavors % of menu items that are % of menu items that also include Italian American Pizza Seafood Chinese Thai Mixed Ethnicity Japanese Mexican Steakhouse Other Asian Mediterranean Sandwich Central & So America Southern French 12.3% 11.2% 8.1% 5.6% 5.4% 4.5% 4.1% 3.3% 2.7% 2.4% 1.8% 1.3% 1.2% 0.8% 0.7% 32.1% Fried Protein App 43.6% Shellfish Main Entrée 13.5% Combos/ Multi Protein 7.9% Pasta 7.0% Non-Fried Protein App 4.7% Sampler 4.4% Salad Entrée 4.1% Entrée Stew / Soup / Chili 3.5% Other Entrée 2.3% Protein Side 2.0% Rice Entrée 1.8% Deli Salad Appetizer 0.9% Pizza 0.6% Appetizer Salad 0.5% Other App 0.5% Mexican 0.5% Fried 62.5% Fried calamari 61.5% Sauce 58.3% Red sauce 34.0% Shrimp 33.5% Pepper 26.1% Marinara 26.0% Spicy 25.3% Lemon 21.0% Garlic 20.8% Crispy 18.5% Noodle 18.0% Tomato 17.7% Mussel 17.3% Lightly 17.2% Fresh 17.2% Other European 0.5% Fish Main Entrée 0.4% Scallop 17.0% Caribbean 0.5% Hot Sandwich 0.3% Clam 16.6% 18 Other 1.3% Other 1.3% Seafood 16.4%
19 SQUID OVERVIEW Growth rate (relative % change) 10.5% -0.4% SQUID Overview 2.4% 1 year 4 year MenuTrends PENETRATION vs vs Historic Penetration Growth 10.3% 11.1% 10.6% 10.7% 10.2% 10.5% 10.6% 10.5% 10.5% Restaurant Type 3.3% 1.6% 13.8% 13.6% 19.4% 0.0% QSR Midscale Fine Dining National Chains 5.0% 16.3% Indep. 9.8% 9.6% 6.6% Midwest 11.9% Northeast Region 9.5% West 6.7% South
20 SQUID OVERVIEW SQUID Cuisines & Applications Menu Types % of menu items served at Applications Top Paired Flavors % of menu items that are % of menu items that also include Thai Chinese Japanese Italian Other Asian Mexican Central & So America Korean Seafood American Mediterranean Mixed Ethnicity Other European Indian Pizza Caribbean Steakhouse Coffee & Bakery 20 Other 11.6% 9.5% 8.0% 3.3% 2.7% 2.2% 1.5% 1.5% 1.3% 1.3% 0.9% 0.9% 0.7% 0.6% 0.4% 0.3% 1.0% 26.3% 25.9% Shellfish Main Entrée 39.6% Fried Protein App 9.5% Pasta 9.4% Entrée Stew / Soup / Chili 7.9% Other Entrée 6.7% Salad Entrée 5.6% Rice Entrée 5.3% Non-Fried Protein App 5.3% Combos/ Multi Protein 4.3% Deli Salad Appetizer 1.4% Protein Side 1.2% Other App 1.1% Fish Main Entrée 0.4% Veggie Main Entrée 0.4% Sampler 0.3% Mexican 0.2% Appetizer Soup / Chili 0.2% Appetizer Salad 0.2% Other 1.0% Sauce 47.2% Shrimp 44.8% Fried 40.3% Spicy 35.8% Scallop 33.0% Seafood 29.7% Calamari 25.0% Pepper 24.6% Noodle 23.0% Garlic 22.4% Hot 21.6% Onion 20.4% Sauteed 19.6% Vegetable 19.3% Mussel 18.9% Fried squid 18.7% Salad 18.5% Fresh 17.5% Fish 16.5%
21 21
22 22
23 23
24 24

25 SQUID OVERVIEW Squid Discussion 25
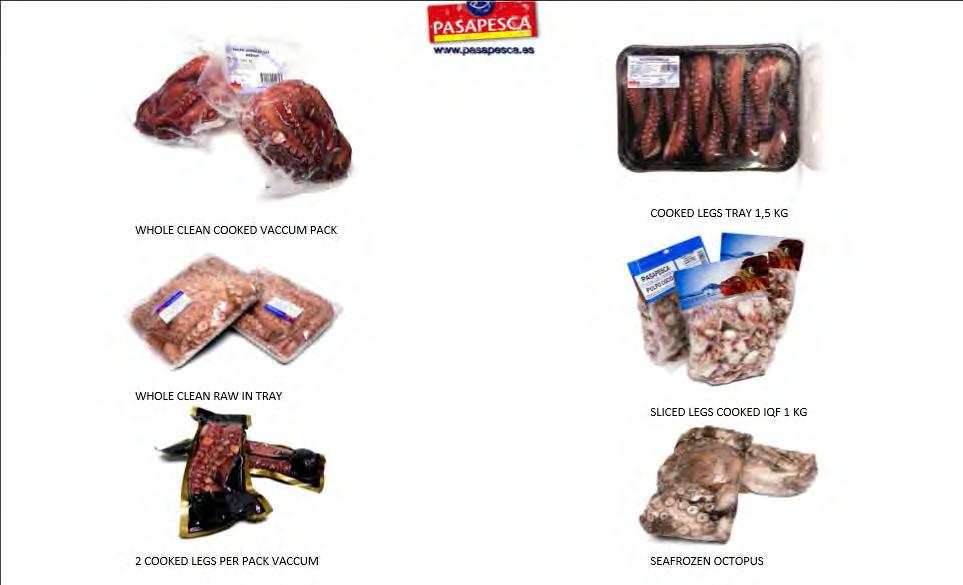
26 OCTOPUS 26
27 OCTOPUS OVERVIEW Global Octopus Production (MT) 400, , , , , , ,000 50, *2014 *2015 Source: FAO and Urner Barry 27
28 OCTOPUS OVERVIEW Global Octopus Production (MT) 160, , , ,000 80,000 60,000 40,000 20, CHINA MOROCCO JAPAN MEXICO MAURITANIA KOREA, REPUBLIC OF SPAIN PORTUGAL INDONESIA THAILAND ITALY PHILIPPINES TUNISIA SENEGAL GREECE FRANCE BRAZIL MALAYSIA CHILE TANZANIA, UNITED REP. OF OTHERS Source: FAO 28
 / FAO Area")
29 OCTOPUS OVERVIEW Global Octopus Distribution Octopus Landings in 2013: Geographic View Total Octopus Landings (Tons) / FAO Area 29
30 OCTOPUS OVERVIEW US Octopus Imports (MT) 24,000 22,000 20,000 18,000 16,000 14,000 12,000 10,000 8,000 6,000 4,000 2, *2015 Source: US Census and Urner Barry s Foreign Trade Data 30
31 OCTOPUS OVERVIEW US Imports by Country (MT) 6,000 5,000 4,000 PHILIPPINES SPAIN CHINA (MAINLAND) INDONESIA THAILAND INDIA 3,000 PORTUGAL MEXICO 2,000 VIETNAM JAPAN 1,000 MALAYSIA *2015 PERU OTHERS Source: US Census and Urner Barry s Foreign Trade Data 31
32 OCTOPUS OVERVIEW Morocco Octopus 32
33 OCTOPUS OVERVIEW Market Price Study PHILIPPINES SPAIN INDIA INDONESIA THAILAND $4.50 $4.00 $3.50 $3.00 $2.50 $2.00 $1.50 $1.00 $0.50 Mar 10 Sept 10 Mar 11 Sept 11 Mar 12 Sept 12 Mar 13 Sept 13 Mar 14 Sept 14 Mar 15 Sep 15 Source: US Census and Urner Barry s Foreign Trade Data 33

34 OCTOPUS OVERVIEW Growth rate (relative % change) 7.5% 2.2% OCTOPUS Overview 28.6% 1 year 4 year MenuTrends PENETRATION vs vs Historic Penetration Growth 4.5% 5.0% 5.0% 5.4% 5.4% 5.5% 5.9% 5.9% 6.3% 7.4% 7.5% Restaurant Type 1.5% 1.3% 6.3% 10.5% 24.1% 0.0% QSR Midscale Fine Dining National Chains 4.0% 11.4% Indep. 4.3% Midwest 8.9% Northeast Region 6.8% West 5.4% South
35 OCTOPUS OVERVIEW OCTOPUS Cuisines & Applications Menu Types % of menu items served at Japanese Italian 16.5% Mexican 13.1% Chinese 9.6% Mediterranean 5.0% American 4.7% Other Asian 4.5% Mixed Ethnicity 4.4% Thai 3.0% Seafood 2.0% Pizza 1.6% Korean 1.5% Steakhouse 1.4% Central & So America 1.1% French 1.1% Sandwich 1.0% Other European 0.6% Coffee & Bakery 0.5% 35 Other 0.4% 27.9% Applications Top Paired Flavors % of menu items that are % of menu items that also include Shellfish Main Entrée 32.3% Sushi 28.1% Non-Fried Protein App 26.4% Shrimp 27.3% Combos/ Multi Protein 9.6% Salad 25.1% Salad Entrée 7.4% Grilled 24.3% Deli Salad Appetizer 4.2% Sauce 18.9% Entrée Stew / Soup / Chili 3.5% Baby 16.9% Pasta 2.9% Sashimi 15.8% Other App 2.5% Tomato 15.3% Other Entrée 1.8% Potato 14.2% Rice Entrée 1.4% Lemon 13.9% Fried Protein App 1.3% Fish 13.9% Sampler 1.1% Grilled octopus 12.6% Appetizer Salad 0.9% Onion 12.0% Fish Main Entrée 0.9% Spicy 11.5% Mexican 0.9% Red 11.2% Protein Side 0.9% Clam 11.2% Fried Other App 0.8% Scallop 11.2% Appetizer Soup / Chili 0.4% Pepper 11.2% Other 1.0% Vinaigrette 10.9%
36 36
37 37

38 OCTOPUS OVERVIEW Octopus Discussion 38
39 HERRING 39

40 HERRING OVERVIEW Global Herring Production (MT) 3,000,000 Atlantic and Pacific 2,500,000 2,000,000 1,500,000 1,000, ,000 0 Source: FAO and Norwegian Seafood Council 40
41 HERRING OVERVIEW Herring Trade Import Nations - MT 1,400,000 1,200,000 1,000, , , , ,000 LITHUANIA UKRAINE EGYPT POLAND DENMARK NETHERLANDS RUSSIAN FEDERATION CHINA, PEOPLE'S REPUBLIC OF GERMANY NIGERIA Source: Norwegian Seafood Council 41
42 HERRING OVERVIEW Herring Trade Supplying Nations - MT 1,800,000 1,600,000 1,400,000 1,200,000 1,000, , , ,000 OTHERS CANADA FAROES ICELAND USA CHINA RUSSIA NORWAY EU27 200, Source: Norwegian Seafood Council 42
43 HERRING OVERVIEW Herring Market Price Study (Atlantic) Average Import Price USD/KILO FROZEN FILLET FROZEN WHOLE $2.80 $2.40 $2.00 $1.60 $1.20 $0.80 $0.40 Mar 11 Sep 11 Mar 12 Sep 12 Mar 13 Sep 13 Mar 14 Sep 14 Mar 15 Sep 15 Source: Norwegian Seafood Council 43

44 HERRING OVERVIEW US Landings Herring (MT) 160, , , ,000 80,000 60,000 40,000 20, Source: NOAA, NMFS 44
45 HERRING OVERVIEW US Herring Imports (MT) 50,000 45,000 40,000 35,000 30,000 25,000 20,000 15,000 10,000 5, *2015 Source: US Census and Urner Barry s Foreign Trade Data; *Estimate 45
46 HERRING OVERVIEW US Imports by Type % 3% 12% FRESH OR CHILLED FISH 8% FROZEN FISH CURED OR SMOKED FISH CANNED OR PREPARED FISH NOT FOR HUMAN CONSUMPTION 62% Source: US Census and Urner Barry s Foreign Trade Data 46
47 HERRING OVERVIEW US Herring Exports (MT) 70,000 60,000 50,000 40,000 30,000 20,000 HERRING ROE, CURED HERRING FILLET, FROZEN HERRING ROE, FROZEN HERRING, FROZEN HERRING, FRESH 10, *2015 Source: US Census and Urner Barry s Foreign Trade Data; * Estimated 47
48 HERRING OVERVIEW US Herring Exports (MT) JAPAN CHINA (MAINLAND) CANADA OTHERS 70,000 60,000 50,000 40,000 30,000 20,000 10, *2015 Source: US Census and Urner Barry s Foreign Trade Data; * Estimated 48

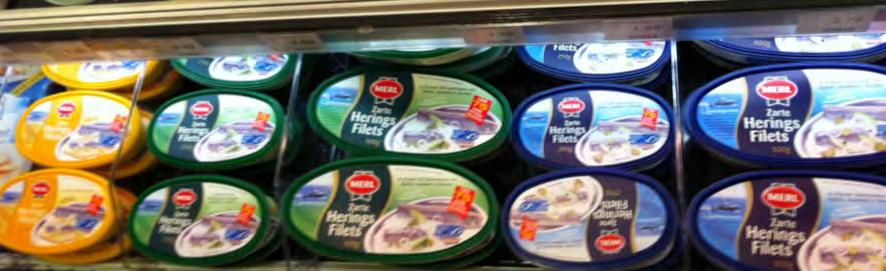
49 HERRING GERMANY 49

50 HERRING RUSSIA 50


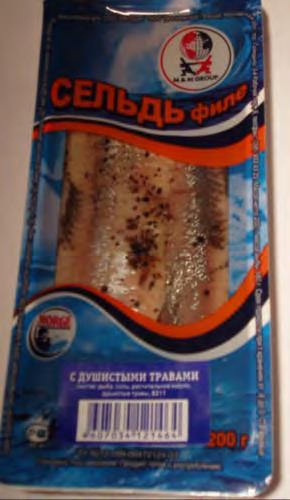
51 HERRING RUSSIA 51
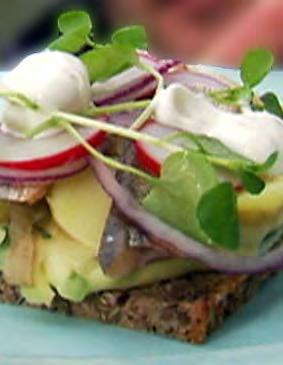
52 HERRING SCANDINAVIA 52

53 HERRING AND OTHER FISH DELICACIES IN LATVIA 53

54 HERRING OVERVIEW Herring Discussion 54

55 MACKEREL 55
56 MACKEREL OVERVIEW Global Production (MT) Chub and Atlantic 3,500,000 3,000,000 2,500,000 2,000,000 1,500,000 1,000, , *2014 *2015 *2016 Source: FAO and Norwegian Seafood Council 56
57 MACKEREL OVERVIEW Mackerel Trade Import Nations - MT 1,200,000 1,000, , , , ,000 UNITED KINGDOM POLAND INDONESIA THAILAND JAPAN EGYPT RUSSIAN FEDERATION CHINA, PEOPLE'S REPUBLIC OF NETHERLANDS NIGERIA Source: Norwegian Seafood Council 57
58 MACKEREL OVERVIEW Mackerel Trade Supplying Nations - MT 2,000,000 1,800,000 1,600,000 1,400,000 1,200,000 1,000, , , ,000 OTHERS JAPAN FAROES ICELAND CHINA NORWAY EU27 200, Source: Norwegian Seafood Council 58
59 $2.40 MACKEREL OVERVIEW Mackerel Market Price Study Average Import Price USD/KILO $2.20 $2.00 $1.80 $1.60 $1.40 $1.20 $1.00 Mar 11 Sep 11 Mar 12 Sep 12 Mar 13 Sep 13 Mar 14 Sep 14 Mar 15 Sep 15 Source: Norwegian Seafood Council 59

60 MACKEREL OVERVIEW US Landings Mackerel (MT) 80,000 70,000 60,000 50,000 40,000 30,000 20,000 10, Source: NOAA, NMFS 60

61 MACKEREL OVERVIEW US Mackerel Imports (MT) 25,000 20,000 15,000 10,000 5, *2015 Source: US Census and Urner Barry s Foreign Trade Data; *Estimate 61
62 MACKEREL OVERVIEW US Mackerel Imports by Type 1% % 37% FRESH OR CHILLED WHOLE FISH FROZEN WHOLE FISH CURED OR SMOKED FISH CANNED OR PREPARED FISH 6% Source: US Census and Urner Barry s Foreign Trade Data 62
63 MACKEREL OVERVIEW US Mackerel Exports (MT) FRESH FROZEN PREPARED/PRESERVED 60,000 50,000 40,000 30,000 20,000 10, *2015 Source: US Census and Urner Barry s Foreign Trade Data; *Estimated 63
64 MACKEREL OVERVIEW US Mackerel Exports (MT) CANADA PERU GHANA OTHERS MEXICO 60,000 50,000 40,000 30,000 20,000 10, *2015 Source: US Census and Urner Barry s Foreign Trade Data; * Estimated 64

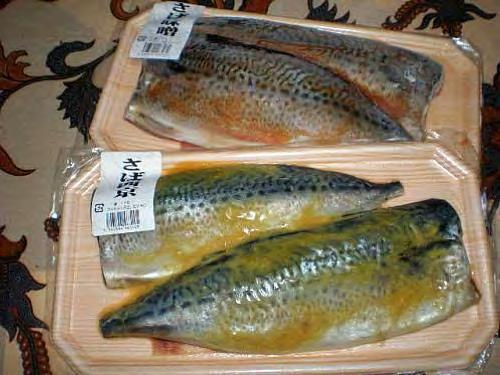
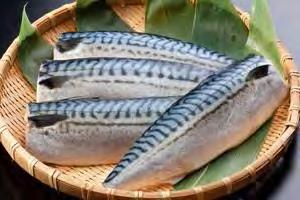

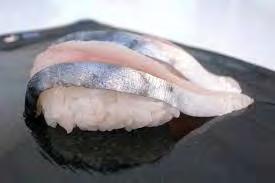
65 MACKEREL JAPAN 65
66 MACKEREL SCANDINAVIA 66

67 Smoked Mackerel Latvia 67

68 HOT SMOKED MACKEREL WITH TOPPINGS IN LATVIA 68

69 MACKEREL OVERVIEW Mackerel Discussion 69
THE WORLD COMPETITIVENESS SCOREBOARD 2011
 THE WORLD COMPETITIVENESS SCOREBOARD 2011 98.557 94.063 92.588 92.011 90.782 90.219 89.259 87.824 86.475 86.418 86.313 85.707 84.380 84.120 81.629 81.619 81.100 80.278 79.799 78.499 77.599 77.101 76.827
FAO Global Capture Production database updated to 2015 Summary information Fisheries and Aquaculture Department
 FAO Global Capture Production database updated to Summary information Fisheries and Aquaculture Department Table 1. World capture production in and million million Inland capture 11.3 11.5 1.1% Marine
I. World trade in Overview
 I. Table I.1 Growth in the volume of world merchandise exports and production by major product group, 1995-3 ( change) 1995-21 22 23 World merchandise exports 7. -.5 3. 4.5 Agricultural products 3.5 2.5
2 Bivalves: Global production and trade trends
 2 Bivalves: Global production and trade trends S. Pawiro The international trade in bivalves (shellfish) is very much regionalized. Few countries are able to penetrate distant markets outside their regions,
Portuguese, English, and. Bulgarian, English, French, or
 Country Language Fiber Content Algeria Arabic Angola Portuguese, English, and French (optional) Optional Argentina Spanish Armenia Armenian Optional Australia English Austria German Bahrain Arabic or English
FAO Global Capture Production database updated to 2012 Summary information
 FAO Global Capture Production database updated to 2012 Summary information Table 1. World capture production in 2011 and 2012 2011 2012 million million Inland capture 11.1 11.6 4.5% Marine capture (excluding
Agricultural Trade Office The U.S. Embassy, Seoul
 Agricultural Trade Office The U.S. Embassy, Seoul www.atoseoul.com Data Source: Global Trade Atlas (www.gtis.com), CIF Value Basis, This presentation tracks Korea s imports of agricultural products on
KINGDOM OF CAMBODIA NATION RELIGION KING 3
 KINGDOM OF CAMBODIA NATION RELIGION KING 3 TOURISM STATISTICS REPORT February 2018 MINISTRY OF TOURISM Statistics and Tourism Information Department No. A3, Street 169, Sangkat Veal Vong, Khan 7 Makara,
European Values Study & World Values Study - Participating Countries ( )
") GESIS Data Archive for the Social Sciences http://www.gesis.org/en/home/ ASEP/JD Data Archive http://www.jdsurvey.net/jds/jdsurvey.jsp European Values Study & World Values Study - Participating Countries
GESIS Data Archive for the Social Sciences http://www.gesis.org/en/home/ ASEP/JD Data Archive http://www.jdsurvey.net/jds/jdsurvey.jsp European Values Study & World Values Study - Participating Countries
Agricultural Trade Office The U.S. Embassy, Seoul
 Agricultural Trade Office The U.S. Embassy, Seoul www.atoseoul.com Data Source: Global Trade Atlas (www.gtis.com), CIF Value Basis, This presentation tracks Korea s imports of agricultural products on
Salmon Market Analysis 2007
 Salmon Market Analysis 2007 April 2008 Systemizing the World of Aquaculture and Fisheries Industriveien 18, NO-6517 Kristiansund N Norway Tel.: +47 71 68 33 00 Fax: +47 71 68 33 01 E-mail: mail@kontali.no
INTERNATIONAL STUDENT STATISTICAL SUMMARY Spring 2017 (Final)
") INTERNATIONAL STUDENT STATISTICAL SUMMARY Spring 2017 (Final) Prepared By: Mr. Jay Ward, Associate Director Office of International Programs San Francisco State University Non-Matriculated SP 17 SP 16
INTERNATIONAL STUDENT STATISTICAL SUMMARY Spring 2017 (Final) Prepared By: Mr. Jay Ward, Associate Director Office of International Programs San Francisco State University Non-Matriculated SP 17 SP 16
Ragnar Tveteras. University of Stavanger Norway
 Ragnar Tveteras University of Stavanger Norway Professor Ragnar Tveteras is a business economist at the University of Stavanger s Department for Industrial Economics, Risk Management and Planning. His
IBSA Goalball World Rankings 31 December 2017 Men's Division
 IBSA Goalball World Rankings 31 December 2017 Men's Division Rank No v Oc t Se p Au g Ju l Team Region Score Goal Diff Results Gol p Gme Last Plyd Weight 1st 5 6 6 1 2 Brazil Americas 661.802 4.564 0.872
DG AGRI DASHBOARD: CITRUS FRUIT Last update:
 8.000 7.000 6.000 5.000 4.000 3.000 2.000 1.000 0 1996 1997 1998 1999 2000 2001 2002 2003 2004 2005 2006 2007 2008 2009 2010 2011 2012 2013 2014 2015 2016 2017 Small citrus (group mandarines): clementines,
AREA TOTALS OECD Composite Leading Indicators. OECD Total. OECD + Major 6 Non Member Countries. Major Five Asia. Major Seven.
 Reference series Composite leading indicators OECD Composite Leading Indicators AREA TOTALS 7-03- 19 OECD Total 19 OECD + Major 6 Non Member Countries 19 Major Seven 19 Major Five Asia 19 Euro area 19
Feeding fish to fish is this a responsible practice?
 Feeding fish to fish is this a responsible practice? Andrew Jackson Technical Director International Fishmeal & Fish Oil Organisation Humber Seafood Summit 15 July 2010 IFFO International Fishmeal and
Freshwater fish. Carp, Perch, Pike, Burbot, Barb, Milkfish. Extract from GLOBEFISH Databank Prices - Exports - Imports - Production
 Commodity Update Freshwater fish Carp, Perch, Pike, Burbot, Barb, Milkfish Extract from GLOBEFISH Databank Prices - Exports - Imports - Production November 2012 Freshwater fish - Carp, Perch, Pike, Burbot,
Production, trade and supply of natural gas Terajoules
 Terajoules Table Notes Production includes quantities from other sources, which would include any quantities of biogas, LPG or manufactured gas blended with natural gas. Please refer to the Definitions
Elements for the Biennial Review And Assessment of the World Timber Situation SELECTED DATA AND ANALYSIS.
 Elements for the Biennial Review And Assessment of the World Timber Situation 2015-2016 SELECTED DATA AND ANALYSIS Frances Maplesden Content Results of the 2016 Joint Forest Sector Questionnaire Secondary
IR-Pay Go Rates. There are three pricing groups for Pay Go rates for International Roaming as follows:
 IR-Pay Go Rates A. IR Pay Go Rate Summary There are three pricing groups for Pay Go rates for International Roaming as follows: Sr IR Pay Go Rate Group 1 Rs 2 2 2 2 Rs 10 10 10 3 Rs 50 600 25 Applicable
FAPRI 2006 Preliminary Baseline December 15-16, 2005
 FAPRI 26 Preliminary Baseline December 15-16, 25 INTERNATIONAL SUGAR Amani Elobeid (515)-294-6175 amani@iastate.edu FAPRI Food and Agricultural Policy Research Institute Center for Agricultural and Rural
Big data analytics for enrichment of rural area content tourism in Okhotsk sub-prefecture of Japan
 Big data analytics for enrichment of rural area content tourism in Okhotsk sub-prefecture of Japan Ali Bakdur, Fumito Masui, Michal Ptaszynski Kitami Institute of Technology, Dept. of Computer Science,
Fishery Products EU Fishery Marketing Report 2008
 GAIN Report Global Agriculture Information Network Template Version 2.09 Required Report - public distribution NL8009 Netherlands Date: 5/6/2008 GAIN Report Number: NL8009 Fishery Products EU Fishery Marketing
Student Nationality Mix for BAT Bath
 Student Nationality Mix for BAT Bath Country Total Saudi Arabia 16. Oman 11.8% Spain 10. China 10. Libya 7. Thailand 6. Korea (South) 6. France 3.9% Venezuela 3. Italy 2.9% Brazil 2. Turkey 2. Switzerland
CMMI Maturity Profile Report. 30 June 2017
 CMMI Maturity Profile Report 30 June 2017 Executive Summary Appraisals increased 14% 1 Jan 30 Jun 17 Companies who reappraise continue to increase, currently at 74% 10% of reported appraisals are high
Max Sort Sortation Option - Letters
 Max Sort Sortation Option - Letters Western Europe Prices Product Code PS5 PS6 Austria* 0.330 7.550 0.330 7.400 Belgium* 0.370 3.700 0.370 3.540 Denmark* 0.620 5.350 0.620 4.215 Finland* 0.385 4.400 0.385
Stockholm s tourism industry. November 2016
 Stockholm s tourism dustry. November 2016 Durg the month of November ca 1.1 million guest were recorded at commercial accommodations the county of Stockholm. This was an crease of 5 compared to November
Inside Germany Seafood Trade
 International Markets Bureau MARKET INDICATOR REPORT AUGUST 2012 Inside Germany Seafood Trade Inside Germany Seafood Trade TRADE SUMMARY Fish and seafood in Germany is an expanding market that relies heavily
DG AGRI DASHBOARD: CITRUS FRUIT Last update:
 14 000 12 000 10 000 8 000 6 000 4 000 2 000 0 1996 1997 1998 1999 2000 2001 2002 2003 2004 2005 2006 2007 2008 2009 2010 2011 2012 2013 2014 2015 2016 Small citrus (group mandarines): clementines, satsumas
STORM FORECASTS: The only independent source of animal health and animal agriculture historical market data and forecasts
 The only independent source of animal health and animal agriculture historical market data and forecasts June 2016 1 What is STORM FORECASTS? STORM FORECASTS is the only independent source of animal health
January Deadline Analysis: Domicile
 January Deadline Analysis: Domicile Applicants by domicile at the 15 January deadline D.1.1 Applicants by domicile group UK EU (excluding UK) Not EU All domiciles 20% 10% -0% -10% -20% -30% -40% -50% 2009
Stockholm s tourism industry. December 2016
 Stockholm s tourism dustry. December 2016 Durg the month of December ca 0.9 million guest were recorded at commercial accommodations the county of Stockholm. This was an crease of 12 compared to December
GLOBAL BAROMETER OF HOPE AND DESPAIR FOR 2011
 GLOBAL BAROMETER OF HOPE AND DESPAIR FOR 2011 Volume 1: Statistical Report Findings based on responses from more than 64,000 scientifically selected cross-section of Men and Women from all socioeconomic
October 23, 2015 FINAL STATISTICAL REPORT 2014/15
 C A L I F O R N I A D R I E D P L U M B O A R D 3840 Rosin Court Phone (916) 565-6232 Suite 170 Fax (916) 565-6237 Sacramento, CA 95834 www.californiadriedplums.org October 23, 2015 FINAL STATISTICAL REPORT
New rules, new opportunities: a potential for growth
 #TV year New rules, new opportunities: a potential for growth June 19th, 2015 Jacques Balducci Eurodata TV Worldwide Deputy Sales Director Worldwide TV viewing remains strong World daily viewing time Average
Full-Time Visa Enrolment by Countries
 Page 1 of 32 All Students Afghanistan Albania Algeria Andorra Antigua Argentina Armenia Australia Austria Azerbaidjan Bahamas Bahrain Bangladesh Barbados Belarus Belgium Belize Benin (Dahomey) Bermuda
Inside the United Kingdom Seafood Trade
 International Markets Bureau MARKET INDICATOR REPORT JULY 2012 Inside the United Kingdom Seafood Trade Inside the United Kingdom Seafood Trade TRADE SUMMARY The United Kingdom (U.K.) is the eighth-largest
Fact sheet on elections and membership
 Commission on Narcotic Drugs Commission on Crime Prevention and Criminal Justice Fact sheet on elections and membership States members of the CCPCJ and CND (and other functional commissions of the Economic
USTA Player Development 2017 Excellence Grant Criteria Jr Girls, Collegiate & Professional Players
 USTA Player Development 2017 Excellence Grant Criteria Jr Girls, Collegiate & Professional Players In order to encourage the development of U.S. players we have designed USTA Player Development Excellence
June Deadline Analysis: Domicile
 June Deadline Analysis: Domicile Applicants by domicile at the 30 June deadline I.1.1 Applicants by domicile group Difference between cycle and 2017 cycle UK EU (excluding UK) Not EU All domiciles 10%
Desalination From theory to practice People, Papers, Publications. Miriam Balaban EDS Secretary General
 Desalination From theory to practice People, Papers, Publications Gulf WSTA Europe EDS Miriam Balaban EDS Secretary General Europe and the Gulf Region The collaboration between our regions has had significant
OVERVIEW OF FISH PRODUCTION, UTILIZATION, CONSUMPTION AND TRADE
 FISHERY INFORMATION, DATA AND STATISTICS UNIT OVERVIEW OF FISH PRODUCTION, UTILIZATION, CONSUMPTION AND TRADE BASED ON 21 DATA by STEFANIA VANNUCCINI Fishery Statistician (Commodities) FAO, Fishery Information,
Table I. NET CALORIFIC VALUES OF ENERGY PRODUCTS GJ/ton
 Table I PRODUCTION, EXPORTS AND CHANGES IN STOCKS HARD COAL 2011 2012 2013 2014 Standard factor 25.8 25.8 25.8 25.8 Argentina 24.7 24.7 24.7 24.7 Australia 27.1 27.0 26.9 26.9 Bangladesh 20.9 20.9 20.9
2016 River Use Statistics -by Steve Sullivan
 Grand Canyon River Office 2016 River Use Statistics -by Steve Sullivan Topics River Use Statistics Overview Commercial River Use Statistics Noncommercial River Use Statistics Noncommercial River Lottery
The globalisation of sporting events: Myth or reality?
 Khalifa Stadium, Qatar. Photo: Igor Magic The globalisation of sporting events: Myth or reality? Søren Bang, Play the Game 203, 30 October 203 The globalisation of sporting events: Myth or reality? Photo:
UK Trade Statistics 2016
 Value ( million) Rate of Exchange (USD against GBP) ORNAMENTAL AQUATIC TRADE ASSOCIATION LTD. "The Voice of the Ornamental Fish Industry" 1 st Floor Office Suite, Wessex House 4 Station Road, Westbury,
Global Supply Conditions
 Species Calamari Global Supply Conditions Market Activity Loligo Chinensis. Catch volumes are down 25-30% this season, producers are not taking on any new business and are having dificulty finding raw
Bristol Bay and World Salmon Markets in 2016
 Bristol Bay and World Salmon Markets in 2016 Gunnar Knapp Professor Emeritus of Economics Institute of Social and Economic Research University of Alaska Anchorage Gunnar.Knapp@gmail.com January 24, 2017
08 / Industriveien 18 Phone: N Kristiansund Fax:
 Aquaculture Bulletin HEADLINES 08 / 2006 - a guideline for investors in the aquaculture business * Still high prices on the wholesale markets in the EU, with total supply of Atlantic salmon up with 4.6
Facts and figures on the CFP. Basic data on the Common Fisheries Policy
 Facts and figures on the CFP Basic data on the Common Fisheries Policy Edition 2004 Statistics were provided by Eurostat. A great deal of additional information on the European Union is available on the
Confidence through experience. Track record as of 30 June 2012
 Confidence through experience Track record as of 30 June 2012 Harvesting the full potential of wind Confidence is built through experience. During more than 30 years in the wind industry we have installed
Demography Series: China
 Demography Series: China April 9, 212 Dr. Edward Yardeni 16-972-7683 eyardeni@ Sailesh S Radha 83-786-1368 sradha@ Please visit our sites at www. blog. thinking outside the box Table Of Contents Table
Office of Institutional Research
 ri a l C ty Consistency Sim p li c it y Office of Institutional Research Place of Residence for International Students by Gender: Published October 2012 OIR Staff: Peggy Johnson - Associate Director Miriam
Update of trade weights data underlying the EERs and HCIs
 August 2017 Update of trade weights data underlying the EERs and HCIs The trade weights underlying the calculation of the effective exchange rates (EERs) of the euro and the harmonised competitiveness
Mobarakeh Steel Company (MSC) Can Iranian slabs & HRC support SE Asian steel industries?
 Can Iranian slabs & HRC support SE Asian steel industries?") (MSC) Can Iranian slabs & HRC support SE Asian steel industries? JAKARTA June 2018 Iranian slab, an opportunity for SE Asia flat producers Overview of global slab trade Slab trade in SE Asia (MSC) An overview
(MSC) Can Iranian slabs & HRC support SE Asian steel industries? JAKARTA June 2018 Iranian slab, an opportunity for SE Asia flat producers Overview of global slab trade Slab trade in SE Asia (MSC) An overview
Predicting the Markets: Chapter 12 Charts: Predicting Currencies
 Predicting the Markets: Chapter 12 Charts: October 5, 218 Dr. Edward Yardeni Chief Investment Strategist Mali Quintana Senior Economist info@yardenibook.com Please visit our sites at www. blog. thinking
GLOBAL SALMON PRODUCTION
 GLOBAL SALMON PRODUCTION Trends in Production and Market Development By Ragnar Nystoyl, Head of Analysis Kontali Analyse Vigo October 1st 2018 Agenda Supply Development Farmed Salmonids Wild-caught Salmon
Table I. NET CALORIFIC VALUES OF ENERGY PRODUCTS GJ/ton
 Table I PRODUCTION, EXPORTS AND CHANGES IN STOCKS HARD COAL 2009 2010 2011 2012 Standard factor 25.8 25.8 25.8 25.8 Argentina 24.7 24.7 24.7 24.7 Australia 28.7 27.2 27.1 27.0 Bangladesh 20.9 20.9 20.9
The 11th Korea Prime Minister Cup International Amateur Baduk Championship
 The 11th Korea Prime Minister Cup International Amateur Baduk Championship Buan County, South Korea We are pleased to announce that the 11 th Korea Prime Minister Cup (KPMC) will be held on the 3rd-9th
Sector Trend Analysis Fish and Seafood Trends In China
 MARKET ACCESS SECRETARIAT Global Analysis Report Sector Trend Analysis Fish and Seafood Trends In China March 2017 REPORT CONTENT SUMMARY This report looks to highlight the fish and seafood imports into
Worst economic crisis since WWII and lack of funds posing internal and external barriers to internationalisation
 Hot Topics Dr Janet Ilieva International Education Intelligence Unit Setting the context Worst economic crisis since WWII and lack of funds posing internal and external barriers to internationalisation
Ministry of Economy and Sustainable Development of Georgia
 Ministry of Economy and Sustainable Development of Georgia Economic Growth 42,000.0 36,000.0 30,000.0 24,000.0 18,000.0 12,000.0 6,000.0 0.0 GDP AND ECONOMIC GROWTH 7.2% 6.2% 6.4% 4.6% 4.8% 3.4% 2.9% 2.8%
Firearms & parts firearms & parts firearms & parts rocket launcher components
 Table 3 Exports of Military Goods by Component Categories Export Period 01 January to 31 December 1997 Destination ECL Andorra 2001 5 434 2 058 Firearms & parts Argentina 2001 54 498 468 firearms & parts
Global Construction Outlook: Laura Hanlon Product Manager, Global Construction Outlook May 21, 2009
 Global Construction Outlook: Short-term term Pain, Long-term Gain Laura Hanlon Product Manager, Global Construction Outlook May 21, 2009 What This Means for You The world is set to be hit this year with
UK Trade Statistics 2017
 Value ( million) Rate of Exchange (USD against GBP) ORNAMENTAL AQUATIC TRADE ASSOCIATION LTD. "The Voice of the Ornamental Fish Industry" 1 st Floor Office Suite, Wessex House 4 Station Road, Westbury,
TEGMA Fall Transportation Symposium
 TEGMA 2017 Fall Transportation Symposium John Wilson Senior Vice President Dairy industry trends 1997 1998 1999 2000 2001 2002 2003 2004 2005 2006 2007 2008 2009 2010 2011 2012 2013 2014 2015 2016 Million
German Machine Tool Industry - Key Figures
 German Machine Tool Industry - Key Figures Mill. EUR %-Change 1-2Q 1-2Q 1-2Q 2014 2015 2016 2017 2017 2018 2016 2017 2018 Production total 14.486 15.087 15.007 16.006 7.062 7.820-1 +7 +11 Metal working
SALMON PANEL. PANEL LEADER Trond Valderhaug ANALYST Georg Liasjø. Mike Cusack, Troy Enz, Sebastian Goycoolea, Patrice Flanagan, Egil Ove Sundheim
 SALMON PANEL PANEL LEADER Trond Valderhaug ANALYST Georg Liasjø Mike Cusack, Troy Enz, Sebastian Goycoolea, Patrice Flanagan, Egil Ove Sundheim THE SALMON PANEL Trond Valderhaug Georg Liasjø Mike Cusack
Composition of the UNICEF Executive Board
 The dates reflect years of membership in the Executive Board and not necessarily terms of office. 1 Afghanistan 1960 1963; 1965 1967; 1977 1980 Albania 2012 2014 Algeria 1971 1974; 1982 1985; 2004 2006
Sector Trend Analysis Crustaceans Trends In Spain
 MARKET ACCESS SECRETARIAT Global Analysis Report Sector Trend Analysis Crustaceans Trends In Spain June 2017 Executive summary According to the Market Assessment of Opportunities and Challenges in the
Session 4. Growth. The World Economy Share of Global GDP Year 2011 (PPP)
") Session 4. Growth Stylized Facts on Standards of Living across Countries Characterizing Growth over 1 Years: The US Economy Growth Dynamics of the G7 Countries and the OECD Economies Characterizing Growth
Session 4. Growth Stylized Facts on Standards of Living across Countries Characterizing Growth over 1 Years: The US Economy Growth Dynamics of the G7 Countries and the OECD Economies Characterizing Growth
41th meeting of the Advisory Committee
 41th meeting of the Advisory Committee Marseille, France 8 July 213 OLIVE OIL BALANCES 211/12-212/13 OLIVE OIL 211/12 (final) (thousand tonnes) 212/13 (prov.) Starting stocks 773. 1.5 Production 3377.5
Table 34 Production of heat by type Terajoules
 Table 34 Production of heat by type Table Notes geo represents heat used directly for district heating, agriculture etc. without a commercial transaction taking place. represents heat used for the production
CONTRIBUTING OIL RECEIVED IN THE CALENDAR YEAR 2016
 CONTRIBUTING OIL RECEIVED IN THE CALENDAR YEAR 2016 (as reported by ) INTRODUCTION The 1992 Fund Convention and the Supplementary Fund Protocol require that all s report each year to the Director of the
2018 Hearthstone Wild Open. Official Competition Rules
 2018 Hearthstone Wild Official Competition Rules 1 TABLE OF CONTENTS INTRODUCTION 3 APPLICABILITY OF RULES 3 PLAYER ELIGIBILITY 4 TOURNAMENT STRUCTURE 4 PRIZING 9 PLAYER CONDUCT 9 MISCELLANEOUS 9 2 1.
OECD employment rate increases to 68.4% in the third quarter of 2018
 Paris, 17th January 2019 News Release: 3rd Quarter 2018 OECD employment rate increases to 68.4% in the third quarter of 2018 The OECD area employment rate the share of the working-age population with jobs
2018 FIFA World Cup Russia
 2018 FIFA World Cup Russia Global broadcast and audience summary Continue 2018 FIFA World Cup Russia Global broadcast and audience summary Click to select Methodology Match audience Global overview Consumption
Chart Collection for Morning Briefing
 Chart Collection for Morning Briefing September 11, 2017 Dr. Edward Yardeni 516-972-7683 eyardeni@ Mali Quintana 4-664-1333 aquintana@ Please visit our sites at blog. thinking outside the box 4.6 4.4 4.2
COMMODITY UPDATE. Freshwater fish
 COMMODITY UPDATE Freshwater fish August 2015 Tilapia, Pangasius, Nile Perch COMMODITY update The COMMODITY UPDATE reports contain information on prices, imports, exports and production by commodity. The
World Cup Trumps. Talk through the meaning of each piece of information displayed on the cards:
 World Cup Trumps Talk through the meaning of each piece of information displayed on the cards: Oxfam Education FIFA rankings How well FIFA rate the team depending on past performance. A low number means
LOCAL BROADCASTER DUBAI DUBAI SPORTS CHANNEL 01-Nov-13 01:00 02:00 Hlts Day 1 01:00 EUROPE DURATION HH:MM
 A. HIGHLIGHTS LOCAL BROADCASTER DUBAI DUBAI SPORTS CHANNEL 01-Nov-13 01:00 02:00 Hlts Day 1 01:00 02-Nov-13 01:00 02:00 Hlts Day 2 01:00 03-Nov-13 01:00 02:00 Hlts Day 3 01:00 04-Nov-13 01:00 02:00 Hlts
Facts and figures on the CFP. Basic data on the Common Fisheries Policy
 E D I T I O N 2 0 0 6 Facts and figures on the CFP Basic data on the Common Fisheries Policy Statistics were provided by Eurostat. A great deal of additional information on the European Union is available
OCTOBER 2008 BLUEFIN TUNA SUPPLY, DEMAND, AND MARKET OF JAPAN
 OCTOBER 2008 BLUEFIN TUNA SUPPLY, DEMAND, AND MARKET OF JAPAN by Sunee C. Sonu TABLE OF CONTENTS Page LIST OF TABLES....................... ii LIST OF FIGURES....................... iii APPENDIX..........................
I N T E R N A T I O N A L S K A T I N G U N I O N
 I N T E R N A T I O N A L S K A T I N G U N I O N Communication No. 2033 Entries ISU Championships 2017 I. SPEED SKATING All entry quotas are subject to entered Skaters having achieved applicable qualifying
Predicting the Markets: Chapter 15 Charts: Predicting Currencies
 Predicting the Markets: Chapter 15 Charts: March 3, 217 Dr. Edward Yardeni 516-972-7683 eyardeni@ Mali Quintana 48-664-1333 aquintana@ Please visit our sites at www. blog. thinking outside the box Table
2018 FIFA World Cup Schedule
 2018 FIFA World Cup Schedule All times and dates are in Australian Eastern Standard Time (AEST). While we at The Roar go to every effort to ensure this information is correct, you should always consult
TILAPIA AQUACULTURE 2016 AND WHERE WILL WE BE IN 2026
 TILAPIA AQUACULTURE 2016 AND WHERE WILL WE BE IN 2026 Kevin Fitzsimmons, Ph.D. University of Arizona, Professor of Environmental Science World Aquaculture Society, Past-President Aquaculture without Frontiers,
European Research Council
 European Research Council ERC Starting Grants 217 Outcome: Indicative statistics Reproduction is authorised provided the source 'ERC' is acknowledged. NB: In these graphs, 'grantee' refers to a candidate
Traits of a Global Market for Advanced Human Capital How can the Global Demand for Post-secondary Education be met...
 Traits of a Global Market for Advanced Human Capital How can the Global Demand for Post-secondary Education be met... Washington D.C. May 23, 2002 .why are we here? Economic and social development are
INTERNATIONAL SKATING UNION
 INTERNATIONAL SKATING UNION Communication No. 2103 Entries ISU Championships 2018 I. SPEED SKATING All entry quotas are subject to entered Skaters having achieved applicable qualifying times, as specified
AWARDED PROJECTS 2015, 2016, 2017, Countries awarded through the Sport Grant Programme
 AWARDED PROJECTS,,, Countries awarded through the Sport Grant Programme AWARDED PROJECTS BARBADOS Improving rally safety BELGIUM Purchase of officials safety equipment COLOMBIA Officials and drivers safety
Global Economic Briefing: Industrial Production
 Global Economic Briefing: Industrial Production November 27, 2017 Dr. Edward Yardeni 516-972-7683 eyardeni@ Debbie Johnson 4-664-1333 djohnson@ Mali Quintana 4-664-1333 aquintana@ Please visit our sites
Facts and figures on the CFP BASIC DATA ON THE COMMON FISHERIES POLICY
 Facts and figures on the CFP BASIC DATA ON THE COMMON FISHERIES POLICY EDITION 2008 Statistics provided by Eurostat. Data on fleet, jobs and Community aid provided by the Directorate-General for Maritime
Global growth forecasts Key countries/regions,
 Global growth forecasts Key countries/regions, 2014-2018 Percent 7 6 5 4 3 2 1 0 Developing Asia Sub-Saharan Africa Middle East and North Africa Latin America and the Caribbean United States Euro area
More than half the world lives on less than $2 a day
 More than half the world lives on less than $2 a day PRB s 2005 World Population Data Sheet reveals persisting global inequalities in health and well-being Presentation by Bill Butz, Carl Haub, Linda Jacobsen,
STATISTICS
 DGAGRI-G2 23 Novembre 2017 W O R K I N G D O C U M E N T Horticultural Products FLOWERS AND ORNAMENTAL PLANTS STATISTICS 2006-2016 This statistical document has been prepared by Unit G.2 of DG AGRI, in
Value Exported (CDN$) Support Systems ,165 firearms ,389 firearms ,465 firearms ,500 rocket launchers
 Support Systems ,165 firearms ,389 firearms ,465 firearms ,500 rocket launchers") Table 3 Exports of Military Goods by Component Categories Export Period 01 January to 31 December 1998 Value Exported (CDN$) Andorra Argentina Australia Austria Bahrain 2001 2,165 firearms 2001 137,389
Table 3 Exports of Military Goods by Component Categories Export Period 01 January to 31 December 1998 Value Exported (CDN$) Andorra Argentina Australia Austria Bahrain 2001 2,165 firearms 2001 137,389
Export market challenges and opportunities for southern grain producers. Ross Kingwell
 Export market challenges and opportunities for southern grain producers Ross Kingwell Take Home Messages In wheat, face up to even more export competition. Find sources of additional value within or outside
Provide a brief introduction to the U.S. seafood industry
 Provide a brief introduction to the U.S. seafood industry Participants will gain a better understanding of the large variety of seafood products available. 3 Increase knowledge of the following: What is