The Erie Economy: Performance, Opportunities, and Challenges
|
|
|
- Preston Camron McCormick
- 5 years ago
- Views:
Transcription
1 The Erie Economy: Performance, Opportunities, and Challenges Eggs n Issues Manufacturer and Business Association December 2015 Dr. Kenneth Louie The Economic Research Institute of Erie Sam and Irene Black School of Business Penn State Behrend
2 Overview Employment, Unemployment, & Labor Force Participation Output (GDP) Income per Capita Cost of Living Components of Personal Income Erie in the Global Economy 2016 Economic Outlook The Erie Leading Index (ELI) Highlights of Some of Our Work at the Economic Research Institute of Erie in the Black School of Business at Penn State Behrend 1

3 Erie Employment (SA*) 127,000 *SA = seasonally adjusted, not South America. Source: Bureau of Labor Statistics, Local Area Unemployment Statistics 2
4 Unemployment Rate (%) Erie & US Unemployment (SA) Erie U.S. Latest: October Source: Bureau of Labor Statistics, Local Area Unemployment Stats 3
5 Difference in Erie - US Unemployment Rates (SA) Average difference Jan April 2008: +.53 Average difference May April 2015: Latest: September Source: Bureau of Labor Statistics, Local Area Unemployment Stats 4
6 % Change in Employment The U.S. s 9 Recessions since / Months after Peak Latest: November 2014, Peak = Jan 2008 Source: Bureau of Labor Statistics, Current Employment Survey 5
7 % Change in Employment Erie s 9 Recessions since / Months after Peak Latest: October 2014, Peak = May 2008 Source: Bureau of Labor Statistics, Current Employment Survey 6
8 Number of Jobs Erie Gross Job Losses During the Recession 4,000 2,000 1,400 Gain 0-2,000-4,000-6,000-8,000-2,300-6,100-3, ,600-2, ,000-12,000-14,000-16,000-13,400 Note: Industry detail does not add to total due to use of different peak & trough dates for each industry. Source: Bureau of Labor Statistics, LAUS 7
9 Jobs Lost and Regained 14,000 12,000 10,000 13,400 10,700 Latest: October ,000 6,000 6,100 4,000 2, ,000 2,300 1,400 3,600 3,100 2, ,600 2,700 1, , Source: Bureau of Labor Statistics, LAUS 8
10 Percent Labor Force Participation Rate (SA) U.S. LFPR Size of Erie Year Labor Force , , , , , , , , , , Latest: July 2014 Source: Bureau of Labor Statistics 9
11 % Change from Peak Value U.S. LFPR in 11 Cycles Months Past Cycle Peak Nov 1948 Jul 1953 Aug 1957 Apr 1960 Dec 1969 Nov 1973 Jan 1980 Jul 1981 Jul 1990 Mar 2001 Dec 2007 Source: Bureau of Labor Statistics 10

12 Indexed GDP (2001 = 100) Erie & US Output (GDP, GMP) GDP: Erie: $10,856,000,000 U.S.: $17,316,314,000,000 %DRGDP ( ): Erie: +0.2% U.S.: +1.7% U.S Erie 100 Latest: Source: Bureau of Economic Analysis, REIS 11
13 Erie GMP by Industry, 2014 Erie U.S. Erie Erie to to Industry GMP % of GDP %% of of U.S. U.S. (in millions) GMP (in billions) GDP LQ LQ All All industry total $10,856 $10, $16,701,415.0 $15,678, Private industries 9,432 9, ,613, ,795, Agriculture, forestry, fishing, and hunting , , Mining , , Utilities , , Construction , , Manufacturing 2,851 2, ,079, ,797, Durable goods 1,953 1, ,096, , Nondurable goods , , Wholesale trade , , Retail trade , , Transportation and warehousing , , Information , , Finance and and insurance 1, ,293, ,206, Real Real estate estate and and rental and leasing ,178, ,161, Professional, Professional, scientific, and and technical technical services services ,172, ,180, Management Management of of companies companies and and enterprises enterprises , , Administrative Administrative and and waste waste management management services services , , Educational services , Educational services , Health care and social assistance 1, ,200, Health care and social assistance 1, ,133, Arts, entertainment, and recreation , Arts, entertainment, and recreation , Accommodation and food services , Accommodation and food services , Other services, except government , Other services, except government , Government 1, ,087, Government 1, ,883, Source: Bureau of Economic Analysis, REIS 12
14 Annual % Change Growth Rate of Real GDP Annual Average: Erie 0.25%, U.S. 1.70% Erie U.S Latest: Source: Bureau of Economic Analysis, REIS 13
15 Millions (2009$s) Erie Goods and Services Production 6,500 6,000 5,500 5,000 4,500 4,000 5,152 Services 5,682 3,500 3,000 2,500 3,215 Goods 2,992 2,000 1,500 Latest: 2014 Source: Bureau of Economic Analysis, REIS 14
16 Index Value (2001=100) Goods and Services Indexes U.S. Services Erie Services Erie Goods U.S. Goods Latest: 2013 Source: Bureau of Economic Analysis, REIS 15
17 Millions of Dollars (Chained 2009$) Erie Goods Production 3,000 Manufacturing Total 2,790 2,500 2,663 2,000 Durable Goods 2,065 2,202 1,852 1,500 1,442 1,000 Non-Durables 500 Ag., Min., & Const Latest: 2014 Source: Bureau of Economic Analysis, REIS 16
18 Millions of Dollars (Chained 2005$) Erie Services Production 3,000 Latest: 2013 Info, Prof, Mgmt, Admin, Other Services 2,500 2,338 2,000 1,500 Government Healthcare & Education 1,000 Real Estate Retail 500 Wholesale & Transportation Utilities 0 1,399 1,297 Finance & Insurance Arts & Accom Source: Bureau of Economic Analysis, REIS 17
19 Per Capita Income ($) Income Per Capita 50,000 40,000 30,000 20,000 % Increase ( ): Erie: 959.9% US: 1,071.7% US Erie 46,049 40,873 39,379 33,518 38,200 33,225 10,000 3,930-3,604 Latest: Source: Bureau of Economic Analysis, REIS 18
20 Real Per Capita Income (2000$) Real Income Per Capita 50,000 45,000 40,000 35,000 % Increase ( ): Erie: 64.3% US: 87.8% US 44,721 42,760 36,567 36,078 46,855 37,590 30,000 25,000 20,000 24,946 22,877 Erie 15,000 10,000 5,000 - Latest: Source: Bureau of Economic Analysis, REIS 19
21 Percentage of U.S. (%) 100 Erie Real Income Per Capita as a % of U.S Latest: Source: Bureau of Economic Analysis, REIS 20
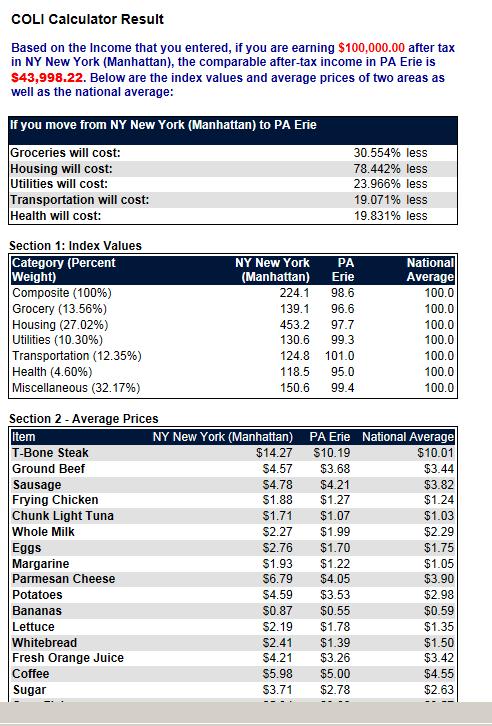
22 Cost of Living Index, 2014 (Annual Averages) Erie, PA Composite Index: = average of 264 U.S. urban areas Components: Grocery Items Housing 83.6 Utilities 91.5 Transportation 95.7 Health care 92 Miscellaneous Source: C2ER, Cost of Living Index Annual Averages
23 % of Total Income of Erie Residents Erie Personal Income Breakdown Earnings Latest: Div, Int, & Rent Proprietorship s Transfers Source: Bureau of Economic Analysis, Local Area Personal Income 22
24 % of Total Income Earnings as a % of Total Income Erie Earnings U.S. Earnings Latest: 2014 Source: Bureau of Economic Analysis, Local Area Personal Income 23
25 % of Total Income Transfers as a % of Total Income Erie Transfers U.S. Transfers 0 Latest: 2014 Source: Bureau of Economic Analysis, Local Area Personal Income 24
26 Transfer Receipts in $ Millions Types of Transfer Payments: Erie 1,400 Latest: ,200 Medical 1, Retirement and Disability Unemployment Insurance Compensation Income Maintenance Other Source: Bureau of Economic Analysis, Local Area Personal Income 25
27 Transfer Receipts in $ Millions Types of Transfer Payments: U.S. 1,200,000 Latest: ,000, ,000 Medical 600,000 Retirement and Disability 400, ,000 Unemployment Insurance Compensation Income Maintenance Other Source: Bureau of Economic Analysis, Local Area Personal Income 26
28 Increasing Global Interdependence 27
29 Jobs Supported by Total Goods Exports, Top 10 States, 2014 Rank State Jobs Supported Share of U.S. All States 7,123, % 1 Texas 1,117, % 2 California 775, % 3 Washington 390, % 4 New York 389, % 5 Illinois 345, % 6 Michigan 270, % 7 Florida 270, % 8 Ohio 263, % 9 Georgia 209, % 10 Pennsylvania 191,779 (3% of PA Empl) 2.7% Source: U.S. Dept. of Commerce, International Trade Administration 28
30 Millions of Jobs Jobs Supported by Exports is Increasing Year Source: U.S. Dept. of Commerce, International Trade Administration 29
31 Exports (In Millions of Chained 2009$) Erie Merchandise Exports 2,000 1,800 1,600 1,400 1,200 Erie 1,305 1,000 1, Latest: Source: International Trade Administration 30
32 Exports (In Millions of Chained 2009$) Merchandise Exports 16,600 Latest: ,600 12,600 10,600 8,600 7,785 Pittsburgh Cleveland 9,782 9,151 7,579 6,600 4,600 2,600 Buffalo 3,795 4,384 1,028 Erie 1, Source: International Trade Administration 31
33 Exports as a % of RGDP Erie Exports as a % of Real GDP Erie Latest: Source: International Trade Administration, Bureau of Economic Analysis 32
34 Top 10 Exporting MSAs, 2014 Rank *Out of 362 MSAs MSA Source: International Trade Administration Exports (in $ millions) 1 Houston; TX 108, New York; NY 96, Los Angeles-Long Beach-Anaheim; CA 68, Seattle; WA 56, Detroit; MI 45, Chicago; IL 43, Miami; FL 34, New Orleans; LA 31, Dallas; TX 26, San Francisco; CA 24, Erie; PA 130 1,
35 The Future 34
36 Growth in Real GDP (%) IMF Forecasts of Growth in Real GDP Ave RGDP growth in G-7 Countries: : 2.14% : 1.38% China U.S. U.K. Euro area Germany G-7 Ave France Canada Italy Japan Source: International Monetary Fund 35
 Home price (% change) Single-Fam permits (% change) Mult-Fam permits (% change) 30-Year Fixed Mortgage (%) 2014 (Actual) 2.4 1.9 6.2 53.1 6.6 4.3 14.8 4.")
37 U.S. Forecast PNC Bank, Northwest Pennsylvania Market Outlook (October 2015) U.S. Forecast Real GDP Growth (% change) Job Growth (% change) Unemployment Rate (%) Median HH Income (Ths. $) Home price (% change) Single-Fam permits (% change) Mult-Fam permits (% change) 30-Year Fixed Mortgage (%) 2014 (Actual) Annual Data (Forecast) (Forecast) Source: PNC Bank 36
38 Erie, PA Forecast PNC Bank, Northwest Pennsylvania Market Outlook (2015 Q3) Erie Forecast Job Growth (% change) Unemployment Rate (%) Median HH Income (Ths. $) Home price (% change) Single-Fam permits (% change) Mult-Fam permits (% change) 2014 (Actual) Annual Data 2015 (Forecast) (Forecast) Source: PNC Bank 37
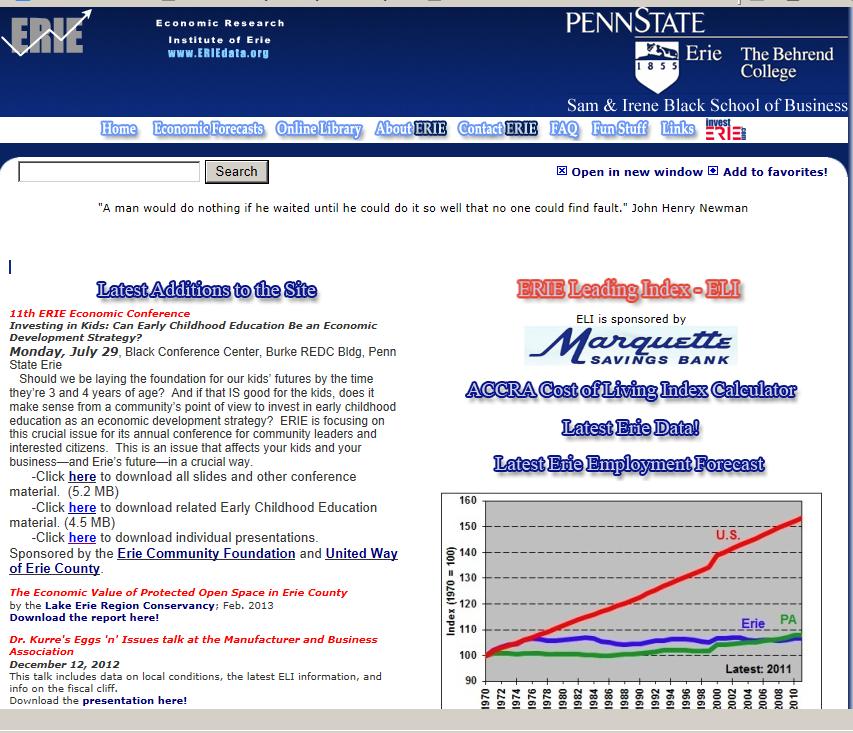
39 Issue #18: Fourth Quarter 2015 (data through September 2015) 5/07 2/10 ELI Takes a Break, But Manages to Spread a Little Holiday Cheer Will ELI be naughty or nice after the holiday season? Though it has been rising fairly consistently since 2010 as Erie recovered from the Great Recession along with the national economy, the Erie Leading Index (ELI) has apparently decided to take a holiday break this season from its steady five-year upward climb. ELI has remained stable through the past few quarters and is currently hovering at just below 105. Overall, ELI grew by only 0.11% through the third quarter and even dipped slightly in August before picking back up again. Although this represents a slight improvement compared to the 0.05% growth that ELI saw in the previous quarter, it unfortunately is much less than the 2.0% growth that ELI enjoyed over the course of
40 ERIE Leading Index (2004 = 100) ERIE Leading Index (ELI) /91 6/00 7/03 Erie Total Employment ERIE Leading Index ELI Turning Points Erie Recessions 5/07 2/ Latest: September

41 ELI Components: Manufacturing PA Avg. Weekly Mfg. Hours (SA) Latest: September 2015 Source: Bureau of Labor Statistics, Local Area Unemployment Stats 40
 Latest: September 2015 Source: Bureau of Labor Statistics,")
42 ELI Components: Manufacturing Erie County Mfg. Employment (SA) Latest: September 2015 Source: Bureau of Labor Statistics, Local Area Unemployment Stats 41
43 A big THANK YOU to 42
44 43
 Change from Change from As of September, 2015: Latest (NSA)* Previous Month Latest (SA)* Previous Month")

45 Latest Erie Data! Last updated November 19, 2015 (All data are for Erie County unless otherwise indicated) Change from Change from As of September, 2015: Latest (NSA)* Previous Month Latest (SA)* Previous Month Unemployment Rate (Erie County) 4.8% 0.8% 5.5% 0.0% -Erie City 5.5% 0.9% Millcreek Township 4.2% 0.6% U.S. 4.9% 0.3% 5.1% 0.0% -Pennsylvania 4.9% 0.6% 5.3% 0.1% Labor Force 135, , Employment 128,500 1, , Unemployment 6,500 1,000 7,400 0 *NSA: Not Seasonally Adjusted; SA: Seasonally Adjusted. SA data for Erie City and Millcreek Township are unavailable. Erie, Pennsylvania, and U.S. data provided by PA Department of Labor and Industry. Note: Latest Erie Data are preliminary and subject to revision next month As of September, 2015 Change from Previous Month Manufacturing Employment (NSA) 22,400 0 Change from Prior Year Population, , % from 279,760 Total Personal Income, 2014 $10,636,535, % from $10,428,430,000 Income Per Capita, 2014 $38, % from $37,276 -U.S., 2014 $46, % from $44,438 44
46 45
47 5/07 2/10 Issue #18: Fourth Quarter 2015 (data through September 2015) I invite you to sign up for the s at klouie@psu.edu, or at the bottom of ELI Takes a Break, But Manages to Spread a Little Holiday Cheer Will ELI be naughty or nice after the holiday season? Though it has been rising fairly consistently since 2010 as Erie recovered from the Great Recession along with the national economy, the Erie Leading Index (ELI) has apparently decided to take a holiday break this season from its steady five-year upward climb. ELI has remained stable through the past few quarters and is currently hovering at just below 105. Overall, ELI grew by only 0.11% through the third quarter and even dipped slightly in August before picking back up again. Although this represents a slight improvement compared to the 0.05% growth that ELI saw in the previous quarter, it unfortunately is much less than the 2.0% growth that ELI enjoyed over the course of ELI s anemic performance reflects the recent sluggish pace of growth in Erie total nonfarm employment, which rose on a seasonally adjusted basis by only 1.5% (2,000 jobs) year-on-year in September, and by only 0.54% (700 jobs) in the third quarter. While the rate of employment growth has been less robust than we would have liked to see, the modest improvement means that ELI is still managing to spread a little holiday cheer! However, if the recently announced plans by G.E. and Lord Corp. for possible job reductions locally are realized, Erie manufacturing as well as total employment are expected to decrease in the next several months, unless those anticipated job losses are offset by job gains in other parts of the local economy. We will therefore need to pay careful attention to see if ELI will be naughty or nice next quarter. Of course, our holiday wish is for ELI to hold its ground, based on the strength of its other input components, and continue to point to growth (or at least stability) in overall local employment. Erie s seasonally adjusted unemployment rate in September remained at 5.5%, unchanged since June, and was just slightly higher than the unemployment rate in Pennsylvania (5.3%) and the nation as a whole (5.1%). Economic Research Institute of Erie, Sam and Irene Black School of Business, Penn State Behrend 46
48 47
49 48
50 49

51 Contact Info Dr. Kenneth Louie, Director Dr. Jim Kurre, Director Emeritus 50
2015 Economic Forecast & Industry Outlook. Robert A. Kleinhenz, Ph.D. Chief Economist, Kyser Center for Economic Research, LAEDC October 8, 2014
 2015 Economic Forecast & Industry Outlook Robert A. Kleinhenz, Ph.D. Chief Economist,, LAEDC October 8, 2014 Outline U.S. Economy California Economy Southern California Economy & Industries Five-Year Outlook
Southern California Economic Forecast & Industry Outlook
 2016-17 Southern California Economic Forecast & Industry Outlook Robert A. Kleinhenz, Ph.D. Sr. VP/Chief Economist, LAEDC February 17, 2016 Outline U.S. Economy California Economy Southern California Economy
Riverside Rising Economic Outlook for the Region April 2015
 Analysis. Answers Riverside Rising Economic Outlook for the Region April 2015 Beacon Economics, LLC California fact versus fiction Looking back a few years (2009 / 2010) everyone was saying that CA would
Briefing on the State of the State. presented to the. SCAA Schuyler Center for Analysis and Advocacy
 Briefing on the State of the State presented to the SCAA Schuyler Center for Analysis and Advocacy Rae D. Rosen Assistant Vice President Federal Reserve Bank of New York November 16, 2006 Key Points: Economic
Dr. Richard Wobbekind Executive Director, Business Research Division and Senior Associate Dean for Academic Programs University of Colorado Boulder
 Dr. Richard Wobbekind Executive Director, Business Research Division and Senior Associate Dean for Academic Programs University of Colorado Boulder Member FDIC VectraBank.com Economic Outlook 2015 Richard
Big Changes, Unknown Impacts
 Big Changes, Unknown Impacts Boulder Economic Forecast Place cover image here Richard Wobbekind Senior Economist and Associate Dean for Business and Government Relations January 17, 2018 Real GDP Growth
Babson Capital/UNC Charlotte Economic Forecast. May 13, 2014
 Babson Capital/UNC Charlotte Economic Forecast May 13, 2014 Outline for Today Myths and Realities of this Recovery Positive Economic Signs Negative Economic Signs Outlook for 2014 The Employment Picture
WORKFORCE LOCAL AREA EMPLOYMENT STATISTICS (LAUS)
") AUGUST 2018 WORKFORCE LOCAL AREA EMPLOYMENT STATISTICS (LAUS) 1,200,000 1,100,000 1,000,000 900,000 Labor Force Employment 1,152,626 1,116,938 800,000 700,000 600,000 500,000 2016 to 2017: 35957 (3.1%)
AUGUST 2018 WORKFORCE LOCAL AREA EMPLOYMENT STATISTICS (LAUS) 1,200,000 1,100,000 1,000,000 900,000 Labor Force Employment 1,152,626 1,116,938 800,000 700,000 600,000 500,000 2016 to 2017: 35957 (3.1%)
WORKFORCE LOCAL AREA EMPLOYMENT STATISTICS (LAUS)
") AUGUST 2016 WORKFORCE LOCAL AREA EMPLOYMENT STATISTICS (LAUS) 1,150,000 1,100,000 1,050,000 1,000,000 950,000 900,000 850,000 800,000 750,000 700,000 Labor Force Employment June 2015 to June 2016: 36,504
AUGUST 2016 WORKFORCE LOCAL AREA EMPLOYMENT STATISTICS (LAUS) 1,150,000 1,100,000 1,050,000 1,000,000 950,000 900,000 850,000 800,000 750,000 700,000 Labor Force Employment June 2015 to June 2016: 36,504
ORLANDO MSA MARKET OVERVIEW LAST UPDATED: MAY 2018
 ORLANDO MSA MARKET OVERVIEW LAST UPDATED: MAY 2018 Orlando MSA Market Overview Labor Market Payroll Employment Commercial Real Estate Residential Real Estate Consumer Spending Visitor Industry Labor Market
Current Hawaii Economic Conditions. Eugene Tian
 Current Hawaii Economic Conditions Eugene Tian Department of Business, Economic Development & Tourism At the PATA/TTRA 2016 Annual Outlook & Economic Forecast Forum February 3, 2016 Positive Signs in the
Economic Update and Outlook
 Economic Update and Outlook NAIOP Vancouver Chapter November 15, 2012 Helmut Pastrick Chief Economist Central 1 Credit Union Outline: Global, U.S., and Canadian economic conditions Canada economic and
Texas Economic Outlook: Recovery in 2010 Keith Phillips Federal Reserve Bank of Dallas San Antonio Office
 Texas Economic Outlook: Recovery in 2010 Keith Phillips Federal Reserve Bank of Dallas San Antonio Office The views expressed in this presentation are strictly those of the author and do not necessarily
International Trade Economic Forecasts An Overview of Orange County and Southern California Exports
 International Trade Economic Forecasts An Overview of Orange County and Southern California Exports Mira Farka Adrian R. Fleissig Institute for Economic and Environmental Studies Orange County / Inland
2018 Annual Economic Forecast Dragas Center for Economic Analysis and Policy
 2018 Annual Economic Forecast Dragas Center for Economic Analysis and Policy PRESENTING SPONSOR EVENT PARTNERS 2 The forecasts and commentary do not constitute an official viewpoint of Old Dominion University,
Economic Overview. Melissa K. Peralta Senior Economist April 27, 2017
 Economic Overview Melissa K. Peralta Senior Economist April 27, 2017 TTX Overview TTX functions as the industry s railcar cooperative, operating under pooling authority granted by the Surface Transportation
From Recession to Recovery
 From Recession to Recovery Monday, April 26, 2010 8:00 AM - 9:15 AM Moderator Michael Klowden, President and CEO, Milken Institute Speakers Mohamed El-Erian, CEO and Co-Chief Investment Officer, Pacific
MAINTAINING MOMENTUM:
 MAINTAINING MOMENTUM: 2018 National Economic Update September 12, 2018 noun mo men tum \ mō-ˈmen-təm, mə- \ 1 b : the strength or force that allows something to continue or to grow stronger or faster as
Nevada County Population Projections 2015 to 2034
 Nevada County Population Projections 2015 to 2034 Prepared By: Jeff Hardcastle, AICP Nevada State Demographer Nevada Department of Taxation Reno Office: 4600 Kietzke Lane, Building L Suite 235 Reno, NV
2018 Annual Economic Forecast Dragas Center for Economic Analysis and Policy
 2018 Annual Economic Forecast Dragas Center for Economic Analysis and Policy PRESENTING SPONSOR EVENT PARTNERS 2 The forecasts and commentary do not constitute an official viewpoint of Old Dominion University,
National and Regional Economic Outlook. Central Southern CAA Conference
 National and Regional Economic Outlook Central Southern CAA Conference Dr. Mira Farka & Dr. Adrian R. Fleissig California State University, Fullerton April 13, 2011 The Painfully Slow Recovery The Painfully
U.S. Overview. Gathering Steam? Tuesday, October 1, 2013
 U.S. Overview Gathering Steam? Tuesday, October 1, 2013 Uneven global economic recovery Annual real GDP growth projections (%) Projections 2013 2014 World 3.1 3.1 3.8 United States 2.2 1.7 2.7 Euro Area
2018 Economic Outlook Forum Daraius Irani, Ph.D. Chief Economist, Regional Economic Studies Institute VP, Division of Strategic Partnerships and
 2018 Economic Outlook Forum Daraius Irani, Ph.D. Chief Economist, Regional Economic Studies Institute VP, Division of Strategic Partnerships and Applied Research Towson University November 29, 2018 $19,000
President and Chief Executive Officer Federal Reserve Bank of New York Washington and Lee University H. Parker Willis Lecture in Political Economics
 The U.S. Economic Outlook Chartspresented by WilliamC Dudley Charts presented by William C. Dudley President and Chief Executive Officer Federal Reserve Bank of New York Washington and Lee University H.
colorado.edu/business/brd
 colorado.edu/business/brd Big Changes, Unknown Impacts Southwest Business Forum Place cover image here Richard Wobbekind Senior Economist and Associate Dean for Business and Government Relations January
Your Texas Economy. Current through: Tuesday, Nov 20, 2018
 Your Texas Economy Current through: Tuesday, Nov 20, 2018 Overview of Texas Economy The Texas economy is growing robustly in 2018 2018 job growth through October is 2.9 percent annualized compared to 2.1
2018 Annual Economic Forecast Dragas Center for Economic Analysis and Policy
 2018 Annual Economic Forecast Dragas Center for Economic Analysis and Policy PRESENTING SPONSOR EVENT PARTNERS 2 The forecasts and commentary do not constitute an official viewpoint of Old Dominion University,
The 2019 Economic Outlook Forum The Outlook for MS
 The 2019 Economic Outlook Forum The Outlook for MS February 2019 Mississippi University Research Center Mississippi Institutions of Higher Learning Darrin Webb, State Economist dwebb@mississippi.edu (601)432-6556
Texas Housing Markets: Metropolitan vs. Border Communities. September 22, 2014
 Texas Housing Markets: Metropolitan vs. Border Communities Luis Bernardo Torres Ruiz, Ph.D. Research Economist El Paso Branch Dallas Federal Rio Grande Economic Association September 22, 2014 Contents
Inland Empire International Trade Economic Forecast
 Inland Empire International Trade Economic Forecast Mira Farka Adrian Fleissig Institute for Economic and Environmental Studies Orange County / Inland Empire Regional SBDC Network California State University,
2014 Economic Forecast: Boulder & Beyond. Keynote Presentation
 2014 Economic Forecast: Boulder & Beyond Keynote Presentation Business Research Division Richard Wobbekind Executive Director Business Research Division & Senior Associate Dean Leeds School of Business
More of the Same; Or now for Something Completely Different?
 More of the Same; Or now for Something Completely Different? C2ER Place cover image here Richard Wobbekind Chief Economist and Associate Dean for Business and Government Relations June 14, 2017 Real GDP
2019 Economic Outlook: Will the Recovery Ever End?
 2019 Economic Outlook: Will the Recovery Ever End? Advantage Bank Place cover image here Richard Wobbekind Senior Economist and Associate Dean for Business and Government Relations November 15 th, 2018
Economic Update and Outlook
 The Building Industry Association Of Okaloosa-Walton Counties Economic Update and Outlook Rick Harper, PhD February 1, 2018 The Economic Outlook 3rd longest postwar expansion for U.S., marked 103 months
The Houston Economy Jesse Thompson Regional Business Economist The Federal Reserve Bank of Dallas, Houston Branch June 2016
 The Houston Economy Jesse Thompson Regional Business Economist The Federal Reserve Bank of Dallas, Houston Branch June 2016 Image from http://peoplesguidetohouston.wordpress.com/category/uncategorized/
2017 Nebraska Profile
 2017 Nebraska Profile State, 9 NEW Regions, 93 Counties, plus 31 Cities Three Volumes Demographic Change in the State Economic Influences at Work Housing Statistics and Trends Summary of Findings Discuss
Larry Kessler, Ph.D. Boyd Center for Business & Economic Research University of Tennessee
 Larry Kessler, Ph.D. Boyd Center for Business & Economic Research University of Tennessee The U.S. economy has now enjoyed 7 years of economic growth since the Great Recession Real GDP grew by 1.2% in
Zions Bank Municipal Conference Economic Overview August 13, 2015
 Zions Bank Municipal Conference Economic Overview August 13, 2015 Overview National Economic Conditions Utah Economic Conditions Utah is One of the Fastest Growing CA 0.9% States in the Country Percent
The U.S. Economy How Serious A Downturn? Nigel Gault Group Managing Director North American Macroeconomic Services
 The U.S. Economy How Serious A Downturn? Nigel Gault Group Managing Director North American Macroeconomic Services Growth Is Cooling; But a Soft Landing Is Likely (Real GDP, annualized rate of growth)
Economic Update and Prospects for 2019 Professor Robert M. McNab Dragas Center for Economic Analysis and Policy Strome College of Business
 Economic Update and Prospects for 2019 Professor Robert M. McNab Dragas Center for Economic Analysis and Policy Strome College of Business January 3, 2019 The forecasts and commentary do not constitute
Federal Reserve Bank of Dallas, FIRM (Financial Institution Relationship Management)
") The Economic Roller Coaster: Where Have We Been? And Where Are We Going? Thomas F. Siems, Ph.D. Senior Economist and Director of Economic Outreach Federal Reserve Bank of Dallas Economic Summit Dallas
The Economic Roller Coaster: Where Have We Been? And Where Are We Going? Thomas F. Siems, Ph.D. Senior Economist and Director of Economic Outreach Federal Reserve Bank of Dallas Economic Summit Dallas
Kevin Thorpe Financial Economist & Principal Cassidy Turley
 Kevin Thorpe Financial Economist & Principal Cassidy Turley Economic & Commercial Real Estate Outlook Kevin Thorpe, Chief Economist 2012 Another Year Of Modest Improvement 2006Q1 2006Q3 2007Q1 2007Q3 2008Q1
Northwest Economic Research Center College of Urban and Public Affairs Forecast Breakfast Economic Outlook
 Northwest Economic Research Center College of Urban and Public Affairs 2019 Forecast Breakfast Economic Outlook 1/10/2019 2 U.S. ECONOMY 1/10/2019 3 1980 1982 1984 1986 1988 1990 1992 1994 1996 1998 2000
State of American Trucking
 State of American Trucking October 11, 2018 Rod Suarez Economic Analyst American Trucking Associations rsuarez@trucking.org Business Cycles U.S. Expansions Duration October 1949 - July 1953 May 1954 -
Your Texas Economy. Last updated: January 30, 2018
 Your Texas Economy Last updated: January 30, 2018 Texas economy strong in 2017 2017 job growth was 2.4% Overview 2015/2016 job growth was much weaker due to the oil bust (1.3% and 1.2%, respectively) 2014
Telling Canada s story in numbers Elizabeth Richards Analytical Studies Branch April 20, 2017
 Recent Developments in the Canadian Economy: How have the decline in oil prices and a weaker Canadian dollar affected Canada s economy? www.statcan.gc.ca Telling Canada s story in numbers Elizabeth Richards
Economic & Financial Market Outlook
 Economic & Financial Market Outlook BC Pension Forum March 1, 2013 Chris Lawless, Chief Economist Overview Global forces Recent economic performance ~ US, Europe, Japan, China ~ Other emerging markets
10 County Conference. Richard Wobbekind. Executive Director Business Research Division & Senior Associate Dean Leeds School of Business
 10 County Conference Richard Wobbekind Executive Director Business Research Division & Senior Associate Dean Leeds School of Business Hmm... (http://myfallsemester.blogspot.com) Real GDP Growth Percent
Bob Costello Chief Economist & Vice President American Trucking Associations. Economic & Motor Carrier Industry Trends. September 10, 2013
 Bob Costello Chief Economist & Vice President American Trucking Associations Economic & Motor Carrier Industry Trends September 10, 2013 The Freight Economy Washington continues to be a headwind on economic
U.S. Economic and Apartment Market Overview and Outlook. July 15, 2014
 2014 U.S. Economic and Apartment Market Overview and Outlook July 15, 2014 U.S. Economic Overview U.S. GDP Growth Persistent Despite 1Q Polar Vortex Annualized Quarterly Percent Change 10% 5% 0% -5% -10%
Economic Growth in the Trump Economy
 Economic Growth in the Trump Economy Presented to State Data Center Conference William F. Fox, Director November 18, 2016 GDP Grows, Though Slowly 10.0 8.0 Percentage Change, Previous Qtr, SAAR 6.0 4.0
An Agricultural Update
 An Agricultural Update May 22, 2018 Indianapolis, IN David Oppedahl Senior Business Economist 312-322-6122 david.oppedahl@chi.frb.org Personal consumption shares 40% 30% 20% 10% 0% 1950 1960 1970 1980
Economic Recovery Has Stalled, Recession in the Cards by Year End
 Economic Indicators to Watch for Signs of Recovery Economic Recovery Has Stalled, Recession in the Cards by Year End New York, NY Monday, June 27, 2011 Richard Yamarone Author of The Trader s Guide to
Nevada County Population Projections 2013 to 2032 Based On The Last Estimate Year of 2012
 Nevada County Population Projections 2013 to 2032 Based On The Last Estimate Year of 2012 Prepared By: The Nevada State Demographer s Office Jeff Hardcastle, AICP NV State Demographer University of NV
Zions Bank Economic Overview
 Zions Bank Economic Overview Intermountain Credit Education League May 10, 2018 Dow Tops 26,000 Up 48% Since 2016 Election Jan 26, 2018 26,616 Oct 30, 2016 17,888 Source: Wall Street Journal Dow Around
2019 ECONOMIC FORECAST AND FINANCIAL MARKET UPDATE
 2019 ECONOMIC FORECAST AND FINANCIAL MARKET UPDATE January 14, 2019 Scott Colbert, CFA Executive Vice President Director of Fixed Income & Chief Economist scott.colbert@commercebank.com GLOBAL GROWTH EXPECTATIONS
Hotel InduSTRy Overview What Lies Ahead
 Hotel InduSTRy Overview What Lies Ahead Vail R. Brown Vice President, Global Business Development & Marketing www.hotelnewsnow.com Click on Hotel Data Presentations U.S. In Review Demand Growth Strong.
U.S. and Colorado Economic Outlook National Association of Industrial and Office Parks. Business Research Division Leeds School of Business
 U.S. and Colorado Economic Outlook National Association of Industrial and Office Parks Presented by the Business Research Division Leeds School of Business University of Colorado at Boulder U.S. Economic
Dr. James P. Gaines Research Economist recenter.tamu.edu
 Texas Uncertain Economy in a World of Uncertain Oil Prices Dr. James P. Gaines Research Economist recenter.tamu.edu National Economic Recovery still Going 2 U.S. Outlook Expected GDP growth still modest:
Zions Bank Economic Overview
 Zions Bank Economic Overview Kenworth National Dealers Conference November 8, 2018 1 National Economic Conditions 2 Volatility Returns to the Stock Market 27,000 Dow Jones Industrial Average October 10,
Noah Williams. University of Wisconsin-Madison Center for Research On the Wisconsin Economy (CROWE) Outlook for the Wisconsin Economy
 Outlook for the Wisconsin Economy") An Noah University of Wisconsin-Madison Center for Research On the Wisconsin Economy (CROWE) CROWE: Brief Introduction Center for Research on the Wisconsin Economy (CROWE) recently established in the Department
An Noah University of Wisconsin-Madison Center for Research On the Wisconsin Economy (CROWE) CROWE: Brief Introduction Center for Research on the Wisconsin Economy (CROWE) recently established in the Department
Global economy maintaining solid growth momentum. Canada leading the pack
 Global economy maintaining solid growth momentum Canada leading the pack Dawn Desjardins (Deputy Chief Economist) (416) 974-6919 dawn.desjardins@rbc.com September 2017 Brighter global outlook gains traction
Economy On The Rebound
 Economy On The Rebound Robert Johnson Associate Director of Economic Analysis November 17, 2009 robert.johnson@morningstar.com (312) 696-6103 2009, Morningstar, Inc. All rights reserved. Executive
RBC Economics Financial Update Dawn Desjardins
 RBC Economics Financial Update Dawn Desjardins CICA/RBC Q4 2011 Business Monitor Economic Results Overview Business and Economic Optimism Begin to Stablize 100 % 80 % 60 % 40 % 20 % 0 % National Optimism
Colorado Economic Update
 Colorado Economic Update Steamboat Economic Summit Place cover image here Brian Lewandowski Associate Director, Business Research Division October 21, 2016 Recession 8 Months Recession 18 Months Real GDP
How Much Wind Is in the Sails?
 How Much Wind Is in the Sails? Erie Chamber of Commerce Place cover image here Richard Wobbekind Senior Economist and Associate Dean for Business and Government Relations September 20, 2017 Real GDP Growth
The Economy: A View from the (Atlanta) Fed (Staff)
 Fed (Staff)") The Economy: A View from the (Atlanta) Fed (Staff) 2018 Alabama Economic Outlook Montgomery, AL January 11, 2018 2 The new supply-side economics? In their discussion of monetary policy, participants saw
The Economy: A View from the (Atlanta) Fed (Staff) 2018 Alabama Economic Outlook Montgomery, AL January 11, 2018 2 The new supply-side economics? In their discussion of monetary policy, participants saw
Carol Tomé CFO and Executive Vice President, Corporate Services
 Carol Tomé CFO and Executive Vice President, Corporate Services Financial Overview December 6, 2017 1 Discussion Overview Fiscal 2017 Financial Guidance Our View of the Economy and State of the U.S. Housing
A comment on recent events, and...
 A comment on recent events, and... where we are in the current economic cycle November 15, 2016 Mark Schniepp Director Likely Trump Policies $4 to $5 Trillion in tax cuts over 10 years to corporations,
The Israeli Economy 2009 The Caesarea Center Conference
 The Israeli Economy 2009 The Caesarea Center Conference Provost, Interdisciplinary Center (IDC) Herzliya The Big Issues The broken crystal ball A crisis that happens once in 100 years From a country oriented
Economic Update Edward Seiler NH&RA
 Economic Update Edward Seiler NH&RA 2 Annual Real GDP Growth (%) 5.0 4.0 Actual (BEA) Forecast (CBO in red, OMB red + orange) 3.0 2.0 1.0 0.0-1.0 1990 1991 1992 1993 1994 1995 1996 1997 1998 1999 2000
Outline. Overview of globalization. Global outlook for real economic activity & inflation. Risks to the outlook
 2017 International Economic Outlook Everett Grant Research Economist Globalization & Monetary Policy Institute Federal Reserve Bank of Dallas October 2017 The views expressed are those of the author and
NYU International Hospitality Industry Investment Conference. Amanda W. Hite STR President & COO
 NYU International Hospitality Industry Investment Conference Amanda W. Hite STR President & COO Supply Middle East Leads in Development 6 5.9 4 3.8 2.5 2 1.0 1.2 1.1 0 Central- South America Europe Middle
Economic Outlook March Economic Policy Division
 Economic Outlook March 212 Economic Policy Division Real GDP Outlook Percent Change, Annual Rate 2 1 1 - -1 197 197 198 198 199 199 2 2 21 U.S. GDP Actual and Potential Quarterly, Q1 197 to Q4 211 Real
Beyond Bullet Points: Statistics, Trends and Analysis
 Beyond Bullet Points: Statistics, Trends and Analysis Vail R. Brown VP, Global Business Development & Marketing Vail@str.com @vail_str 5 THINGS TO KNOW www.hotelnewsnow.com Click on Data Presentations
The Wisconsin and Minnesota Economies: What can we learn from each other? Noah Williams
 The Economies: What can we learn from each other? Noah University of Wisconsin - Madison Future Wisconsin Summit 2016 Economies Location, size, demographics, and history make Wisconsin and Minnesota natural
THE MOST INFORMATIVE EVENT COVERING REAL ESTATE INVESTMENTS
 THE MOST INFORMATIVE EVENT COVERING REAL ESTATE INVESTMENTS 2014 U.S. Economic, Capital Markets, and Retail Market Overview and Outlook Retail Trends 2014 U.S. Economic Overview and Outlook Total Employment
Partnerships with Purpose: Housing for Texans
 Partnerships with Purpose: Housing for Texans 25th Annual TALHFA Educational Conference October 25-27, 2017 Fort Worth, Texas Dr. James P. Gaines Chief Economist 2 Outlook Since November 10, 2017: Rising
The Global Economy: Sustaining Momentum
 The Global Economy: Sustaining Momentum David J. Stockton Senior Fellow Peterson Institute for International Economics Chief Economist Monetary Policy Analytics October 5, 2017 What s Driving the Global
Investing in Real Estate. The smart choice for today s investor
 Investing in Real Estate The smart choice for today s investor Real Estate is preferred over stocks Real estate out performs stocks http://blog.863katy.com/category/national-housing-news/page/2/ Real Estate
CALIFORNIA STATE UNIVERSITY LONG BEACH. Southern California Regional Economic Forecast
 CALIFORNIA STATE UNIVERSITY LONG BEACH Southern California Regional Economic Forecast Lisa M. Grobar, Ph.D. Director, CSULB Economic Forecast Project Office of Economic Research 2009: A terrible year for
Global Hotel Industry Outlook
 Global Hotel Industry Outlook NYU 2011 Mark V. Lomanno CEO STR www.hotelnewsnow.com Click on Industry Presentations Agenda Global Hotel Performance US Hotel Performance Chain Scales Group/Transient Distribution
Will 2016 Be the Last Hurrah for Commercial Real Estate? Presented By: John Chang First Vice-President Marcus & Millichap Research Services
 Will 2016 Be the Last Hurrah for Commercial Real Estate? Presented By: John Chang First Vice-President Marcus & Millichap Research Services Rising Uncertainty Creating Headwinds for Commercial Real Estate
Global growth prospects
 Global growth prospects Percent 6 Advanced Economies Emerging Markets and Developing Economies 5 4.9 5.0 4.7 4.7 4.5 4 4.3 4.3 3.7 3.7 3 2 2.3 2.3 2.2 2.0 2.0 1.7 1.7 1 1.1 1.3 0 2012 2013 2014 2015 2016
De-Globalization: Does That Word Mean What You Think it Means?
 De-Globalization: Does That Word Mean What You Think it Means? Presentation to 35 Annual Monetary & Trade Conference Mykyta Vesselovsky, Ph.D. Office of the Chief Economist Global Affairs Canada April
JOINT INDUSTRY FORECAST
 JOINT INDUSTRY FORECAST January 2018 10-YEAR GOALS NET NEW JOBS CAPITAL INVESTMENT PER CAPITA INCOME Current: 144,599 Current: $8.9B Current: 24.4% Goal: 150,000 Pace: 184,594 Goal: $8B Pace: $11.1B Goal:
Market Insights. June 30, 2018
 June 30, 2018 Economic Overview 2 Global & Regional Growth Forecasts IMF GDP Forecasts (% change YoY) 2010 2011 2012 2013 2014 2015 2016 2017 2018 Advanced Economies 1.7% 1.2% 1.3% 2.1% 2.3% 1.7% 2.3%
Charting a Path to Lift Off? Understanding the Shifting Economic Winds
 Charting a Path to Lift Off? Understanding the Shifting Economic Winds Thomas F. Siems, Ph.D. Assistant Vice President and Senior Economist Federal Reserve Bank of Dallas Government Finance Officers Arlington,
Market Insights. March 29, 2019
 March 29, 2019 Economic Overview 2 Global & Regional Growth Forecasts IMF GDP Forecasts (% change YoY) 2010 2011 2012 2013 2014 2015 2016 2017 2018 Advanced Economies 1.2% 1.4% 2.1% 2.3% 1.7% 2.4% 2.3%
BC Pension Forum. Economic Outlook. Presented by: Ben Homsy, CFA Portfolio Manager
 BC Pension Forum Economic Outlook Presented by: Ben Homsy, CFA Portfolio Manager 1694 1704 1713 1723 1732 1741 1751 1760 1770 1779 1788 1798 1807 1817 1826 1836 1845 1854 1864 1873 1883 1892 1901 1911
The Cairns Economy Recent Trends and Prospects
 MINING, AGRICULTURE, TOURISM, TRANSPORT, CONSTRUCTION, MANUFACTURING, DEFENCE, EDUCATION, ADMINISTRATION, SERVICES The Cairns Economy Recent Trends and Prospects WS (Bill) Cummings PRESENTATION TO Ref:
Global Economic Outlook
 Global Economic Outlook Mark A. Wynne Vice President & Associate Director of Research Director, Globalization & Monetary Policy Institute Federal Reserve Bank of Dallas Presentation to Vistas Conference
Regional Economic Conditions
 Regional Economic Conditions Jason Bram, Research Officer Community Advisory Group Meeting June 27, 2017 The views expressed here are those of the presenter and do not necessarily represent those of the
Vision - Britain's Ocean City One of Europe's most vibrant waterfront cities where an outstanding quality of life is enjoyed by everyone
 PLYMOUTH Economy Nina Sarlaka, Enterprise & Inward Investment Manager Vision - Britain's Ocean City One of Europe's most vibrant waterfront cities where an outstanding quality of life is enjoyed by everyone
National and Virginia Economic Outlook Professor Robert M. McNab Dragas Center for Economic Analysis and Policy Strome College of Business
 National and Virginia Economic Outlook Professor Robert M. McNab Dragas Center for Economic Analysis and Policy Strome College of Business October 24, 2018 The forecasts and commentary do not constitute
PROVINCE OF SASKATCHEWAN INVESTOR PRESENTATION
 PROVINCE OF SASKATCHEWAN INVESTOR PRESENTATION May 2018 THE SASKATCHEWAN DIFFERENCE Economic Stability Diversified economy balances cyclicality of resources Growing population Majority government with
The World and U.S. Economy and San Pedro Bay Container Trade Outlook Forecast Review
 The World and U.S. Economy and San Pedro Bay Container Trade Outlook Forecast Review Michael Keenan Harbor Planning and Economic Analyst Port of Los Angeles October 5, 2009 Review of 2007 Container Trade
Southwest Ohio Regional Economy in Context. Richard Stock, PhD. Business Research Group
 Southwest Ohio Regional Economy in Context Richard Stock, PhD. Business Research Group State of the Metro Area (in January Each Year) Total Employment has slowly increased in the last three years after
The Changing Global Economy Impacts on Seaports and Trade Dr. Walter Kemmsies
 The Changing Global Economy Impacts on Seaports and Trade Dr. Walter Kemmsies Chief Economist, PAGI Group, JLL (Port, Airport & Global Infrastructure) Agenda Where are we in the cycle? What are the barriers
The Houston Economy Jesse Thompson Regional Business Economist The Federal Reserve Bank of Dallas, Houston Branch January 2017
 The Houston Economy Jesse Thompson Regional Business Economist The Federal Reserve Bank of Dallas, Houston Branch January 2017 Image from http://peoplesguidetohouston.wordpress.com/category/uncategorized/