Patuxent Green Golf Course
|
|
|
- Martha Norris
- 5 years ago
- Views:
Transcription
1 Patuxent Green Golf Course Laurel, Maryland February 23, 2018 Traffic Impact Analysis Prepared for: ADC Builders Alan Cohen 2701 Tower Oaks Boulevard, Suite 200 Rockville, Maryland 20852
2 TABLE OF CONTENTS INTRODUCTION and SUMMARY OF FINDINGS... 1 EXISTING TRAFFIC CONDITIONS Location Map of Study Intersections Existing Lane Use Existing Peak Hour Traffic Volumes... 6 BACKGROUND TRAFFIC CONDITIONS Regional Traffic Growth (1.5% Annual Rate for 3 Years) Base Peak Hour Traffic Volumes Trip Generation Totals for Approved Development Trips Generated by Approved Development Background Peak Hour Traffic Volumes TOTAL TRAFFIC CONDITIONS Trip Generation Totals for Subject Site Trip Assignment for Subject Site Total Peak Hour Traffic Volumes Results of Intersection Capacity Analyses (CLV) A Results of Intersection Capacity Analyses (HCM) Results of Queuing Analysis Recommended Future Lane Use RESULTS, RECOMMENDATIONS, AND CONCLUSIONS... 23
3 APPENDICES APPENDIX A Intersection Turning Movement Counts, Condition Diagrams and Photographs and SHA Comment Letter APPENDIX B Intersection Capacity Analysis Worksheets Prepared by: Wes Guckert, PTP Glenn Cook Qiang Tian, P.E., P.T.O.E. GEC:smb (F:\2017\ _Patuxent Greens Golf Club\DOCS\REPORTS\REV1\TIS-REV2.docx) CORPORATE OFFICE The Traffic Group, Inc Franklin Square Drive, Suite H Traffic Engineers & Transportation Planners Baltimore, Maryland Fax: Merging Innovation and Excellence
4 INTRODUCTION AND SUMMARY OF FINDINGS Study Purpose The primary purpose of this analysis was to determine what impact the proposed redevelopment of the Patuxent Green Golf Course would have on the adjacent road network in Laurel, Maryland. Study Criteria/Methodology This Traffic Impact Analysis has been conducted in accordance with requirements used by the Maryland State Highway Administration. Intersection capacity analyses were conducted using the Critical Lane Volume (CLV) Methodology for the signalized intersections and the Highway Capacity Methodology (HCM) for the unsignalized intersections. The trip generation determinations used for this report are based on the Institute of Transportation Engineers (ITE) Trip Generation Report (9 th Edition). The Synchro/SimTraffic software package was used to develop the traffic simulation model for MD 197. Scope of Services The principal Scope of Services undertaken as part of this report were as follows: Field investigation to collect information concerning the nearby road network. Conduct intersection turning movement counts from 6:30-9:30 AM and 4-7 PM, on a weekday, when schools were in session at the seven (7) study area intersections (September, 2017). Review historic traffic growth data obtained from the Maryland State Highway Administration for the major roadways in the study area. Obtain information relative to other approved developments planned in the vicinity of the subject site. Conduct a trip generation and trip distribution analysis for the other nearby developments. Conduct a trip generation and trip distribution analysis for the proposed redevelopment of the golf course property.
5 Conduct intersection capacity analyses to determine existing and projected levels of service at the study area intersections. Recommend off-site roadway improvements in order to maintain acceptable levels of service at the study area intersections or to mitigate the impact of the traffic to be generated by the redevelopment of the subject property. Summary of Findings and Recommendations This Traffic Impact Analysis has shown that two (2) intersections in the study area are currently or are projected to operate at unsatisfactory levels of service during the peak periods with or without the redevelopment of the subject site. Mitigating improvements have been recommended for both of the intersections and will be discussed later in this report. The methodology used to undertake our analysis is contained in the sections that follow.
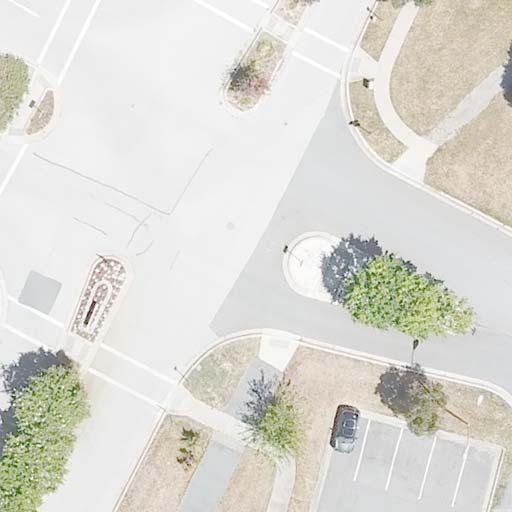
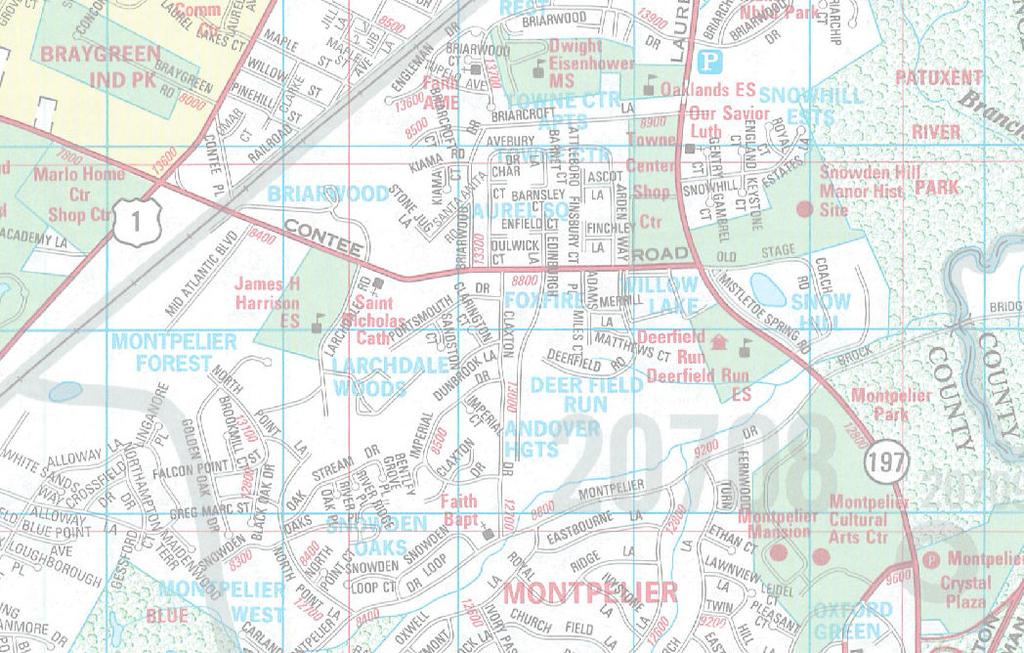
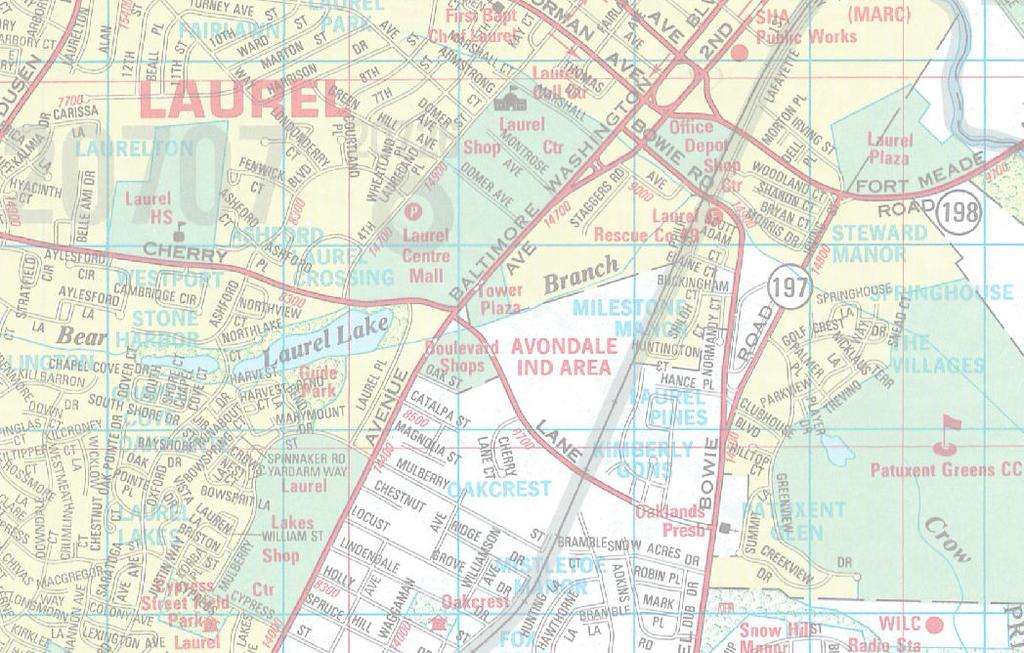
6 EXISTING TRAFFIC CONDITIONS Site Information The subject property is located along the east side of MD 197 at the intersection with Clubhouse Boulevard as shown on Exhibit 1. Access to the property is currently along Clubhouse Boulevard. Study Area Based on the location of the subject property, seven (7) intersections were identified along MD 197, between MD 198 to the north and Contee Road to the south to be within a one-mile radius of the site and included in this analysis. MD 197, in this area, is generally a six-lane, divided roadway with a posted speed limit of 40 MPH. Auxiliary left turn lanes are provided at the major intersections. All of the study area intersections are presently controlled by traffic signals with the exception of the Clubhouse Boulevard/Greenview Drive and MD 197/Greenview Drive intersections. Exhibit 2 has been prepared to show the existing lane use and the existing traffic control at each of the study area intersections. An aerial photo of each intersection is contained in Appendix A to this report. Traffic Volumes Intersection turning movement counts were conducted from 6:30-9:30 AM and 4-7 PM at each of the study area intersections (September, 2017). The total vehicles observed during these counts are shown on the summary sheets contained in Appendix A to this report. The existing peak hour volumes are shown on Exhibit 3. Analysis of Existing Traffic Conditions Intersection capacity analyses were conducted for each of the study area intersections and the results are shown on Exhibits 12 and 12A. Copies of the capacity worksheets are contained in Appendix B. The results of the analysis indicate that all of the study area intersections are currently operating at satisfactory levels of service with the exception of the MD 197/MD 198 intersection. This intersection is presently operating at an unsatisfactory Levels of Service during the evening peak periods.
7 BACKGROUND TRAFFIC CONDITIONS Design Year(s) For the purposes of this analysis, it has been assumed that the subject property would be redeveloped by the year In order to establish the base traffic conditions for the year 2020, we have consulted the Maryland State Highway Administration s Average Daily Traffic Maps to determine the historic trends in traffic along the major roadways in this area. This information has been summarized and is contained in Appendix A. A review of this information indicates that traffic has increased at a rate of approximately 1.5% per year over the past 10 years. Therefore, in order to establish the base conditions for this study, we have increased the existing volumes to reflect a 1.5% growth per year for a three-year period. The incremental increase in traffic as a result of the regional growth is shown on Exhibit 4. Combining this increase with the existing traffic, results in the 2020 base peak hour traffic volumes as shown on Exhibit 5. Nearby Developments In addition to regional growth, traffic projected to be generated by other nearby approved developments has also been taken into consideration. The only development identified was the Montpelier Ridge development, which is planned to consist of 130 single family detached dwelling units. We have prepared Exhibit 6 to show the trip generation rates and the peak hour trips projected to be generated by this development. These trips were then distributed and assigned to the road system as shown on Exhibit 7. Combining the trips for the nearby development, with the 2020 base peak hour volumes, results in the 2020 background peak hour volumes shown on Exhibit 8. Analysis of Background Traffic Conditions Intersection capacity analyses were conducted for the 2020 background peak hour volumes and the results are shown on Exhibits 12 and 12A. Copies of the capacity worksheets are contained in Appendix B. The results of the analysis show that in addition to the intersection of MD 197/MD 198 that is currently operating at an unsatisfactory level of service, the intersection of MD 197 and Contee Road would also operate at an unsatisfactory level of service based on the background traffic conditions with or without the redevelopment of the subject property.
8 TOTAL TRAFFIC CONDITIONS Site Information The Patuxent Golf Course is presently in operation. It is proposed that this property would be redeveloped to consist of approximately 175 single family detached dwelling units and 275 townhouse units. As part of the development of this property, Clubhouse Boulevard will be reconstructed east of Greenview Drive, through a portion of the existing parking area, to a divided boulevard-type roadway to serve as the entry way into the community. Trip Generation/Distribution for Golf Course Property We consulted the Institute of Transportation Engineers Trip Generation Report (9 th Edition) to prepare Exhibit 9 which shows the trip generation rates and the peak hour trips projected to be generated by the proposed redevelopment of the subject property. As previously discussed, this property is presently being utilized as an 18-hole golf course. Therefore, in order to compensate for the traffic presently being generated by the property, the trip generation rates and the peak hour trips that would be anticipated to be generated by an 18-hole golf course are also shown on Exhibit 9. The peak hour trips projected to be generated by the proposed site were then reduced by the trips that would currently be generated by the subject property. The net difference is the additional traffic that would be anticipated to be added to the road network as a result of the redevelopment of this property. The increase in traffic projected to be generated by the subject property was then distributed and assigned to the road network as shown on Exhibit 10. Combining the trips projected to be generated by the redevelopment of the subject property with the 2020 background peak hour volumes will result in the 2020 total peak hour traffic volumes shown on Exhibit 11. Analysis of Total Traffic Conditions Intersection capacity analyses were conducted for the total peak hour volumes and the results are shown on Exhibits 12 and 12A. Copies of the capacity worksheets are contained in Appendix B. The results of the analysis of the total peak hour volumes indicate that the increase in traffic associated with the proposed redevelopment of the Patuxent Green Golf Course would not result in any of the other intersections in the study area operating at unsatisfactory levels of
9 service other than the two (2) identified to be deficient even without the redevelopment of this site. In order to mitigate the impact of the site at the two intersections that are currently or projected, under background traffic conditions to operate at unsatisfactory levels of service, the following improvements would be needed: MD 197 & MD 198 Construct a third northbound left turn lane along MD 197 at MD 198. MD 197 & Contee Road Construct a second eastbound right turn lane along Contee Road at MD 197. Restripe the westbound approach of Old Stagecoach Road to provide an exclusive left turn lane and a combination thru/right turn lane. No widening would be necessary to implement this improvement. The above improvements are illustrated on Exhibit 14. With the implementation of the above improvements, the additional traffic resulting from the redevelopment of the subject site would be mitigated. In addition to the CLV analysis, we have also prepared a Synchro/SimTraffic Traffic Simulation for the entire length of MD 197, between the MD 198 and the Contee Road intersection. Copies of the Synchro worksheets are contained in Appendix C to this report. The results of the queuing analysis resulting from the SimTraffic analysis are shown on Exhibit 13.
10 RESULTS, RECOMMENDATIONS, AND CONCLUSIONS Study Purpose The primary purpose of this analysis was to determine what impact the proposed redevelopment of the Patuxent Green Golf Course would have on the adjacent road network in Laurel, Maryland. Study Criteria/Methodology This Traffic Impact Analysis has been conducted in accordance with requirements used by the Maryland State Highway Administration. Intersection capacity analyses were conducted using the CLV Methodology. The trip generation determination used for this report is based on the ITE Trip Generation Report (9 th Edition). The Synchro/SimTraffic software package was used to develop the traffic simulation for MD 197. Summary of Findings and Recommendations This Traffic Impact Analysis has shown that two (2) intersections in the study area are currently or are projected to operate at unsatisfactory levels of service during the peak periods with or without the redevelopment of the site. In order to mitigate the sites impact at the two intersections that are currently or projected, under background traffic conditions, to operate at unsatisfactory levels of service, the following improvements would be needed: MD 197 & MD 198 Construct a third northbound left turn lane along MD 197 at MD 198. MD 197 & Contee Road Construct a second eastbound right turn lane Contee Road at MD 197. Restripe the westbound approach of Old Stagecoach Road to provide an exclusive left turn lane and a combination thru/right turn lane. This improvement will not require are widening.
11 These improvements are shown on Exhibit 14. Based on the findings of this report, it is our opinion that with the improvements discussed above, the proposed redevelopment of the Patuxent Green Golf Course property would not have an adverse impact on the adjacent road network.

12 September 5, 2018 City of Laurel 8103 Sandy Spring Road Laurel, Maryland A SERVICE DISABLED VETERAN-OWNED SMALL BUSINESS RE: Patuxent Green City of Laurel Prince George's County, Maryland Our Job No.: CORPORATE OFFICE Baltimore, MD Suite H 9900 Franklin Square Drive Baltimore, Maryland fax: ARIZONA OFFICE DELMARVA OFFICE FIELD LOCATIONS Arkansas Arizona Georgia Maryland New York North Carolina Ohio South Carolina Texas Utah Virginia Washington State West Virginia As requested by the City of Laurel, we have prepared this Addendum to our Traffic Study that covers the following issues: 1. Design of the mini traffic circle at the intersection of Clubhouse Blvd & Greenview Drive. 2. Revise the overall Traffic Impact Study assuming 50% of the traffic to the north and 50% of the site generated traffic to the south. 3. Include, in the revised Traffic Study, the intersection of MD 198 at the Laurel Plaza Shopping Center. 4. Based upon the revised analysis (attached), we have determined that, with the changes noted above, there is no additional impact created by the Patuxent Green residential community. We have attached a copy of the mini traffic circle that details a single lane approach from all four approaches. For purposes of this analysis, we assume the area would be restriped but, ultimately, it could be modified with curb and gutter instead of striping after it has been in operation for at least 12 months. The intersection of MD 198 at the entrance to the shopping center will operate at a satisfactory level of service even including the Wawa Store in the northeast quadrant of MD 197 & MD 198. In summary, the changes and additional analysis requested by the City of Laurel have been made and the results are shown on the attachments and will not create an adverse impact. Sincerely, John W. Guckert, PTP President JWG:smb:mlj (F:\2017\ _Patuxent Greens Golf Club\DOCS\CORRESP\ANALYST\Addendum to TIS_Cohen.docx) Merging Innovation and Excellence
13
14
15
16
17
18
 Morning Trips = 41.98 x ksf 50/50 Evening Trips = 49.")
19 TRIP RATES / FORMULAE LAND USE FORMULAE DISTRIBUTION Single-Family Detached (ITE-210, Units) Morning Trips = 0.70 x (Units) /75 Ln(Evening Trips) = 0.90 x Ln(Units) /37 Convenience Market w/gas (ksf, ITE-853) Morning Trips = x ksf 50/50 Evening Trips = x ksf 50/50 TRIP GENERATION TOTAL MORNING PEAK HOUR EVENING PEAK HOUR IN OUT TOTAL IN OUT TOTAL 1. Montpelier Ridge 130 Single Family Detached Units Wawa 4,670 sq. ft. Convenience Market w/gas Less Pass-by Trips (AM: 63%; PM: 66%) Net New Trips: Background development information obtained from PGAtlas. EXHIBIT 6 TRIP GENERATION TOTALS FOR APPROVED DEVELOPMENT Qt, \REV1\Addendum\Trips.XLS-Back, F08/15/18
20
21
22
23 TRIP RATES / FORMULAE LAND USE FORMULAE DISTRIBUTION Single-Family Detached (ITE-210, Units) Morning Trips = 0.70 x (Units) /75 Ln(Evening Trips) = 0.90 x Ln(Units) /37 Townhouse/Condo Units (ITE-230, Units) Ln(Morning Trips) = 0.80 x Ln(Units) /83 Ln(Evening Trips) = 0.82 x Ln(Units) /33 Golf Course (Holes, ITE-430) Morning Trips = 2.06 x Holes 79/21 Evening Trips = 2.92 x Holes 51/49 TRIP GENERATION TOTALS MORNING PEAK HOUR EVENING PEAK HOUR IN OUT TOTAL IN OUT TOTAL Patuxent Greens Golf Club 175 Single-Family Detached Units Townhouse Units Total: Existing 18 Hole Golf Course Net Difference: Trip generation rates derived from ITE Trip Generation, 9th Edition, 2012 EXHIBIT 9 TRIP GENERATION TOTALS FOR SUBJECT SITE qt, \rev1\trips.xls-site (2), f10/04/17
24
25
26 CLV Method Existing Traffic Background Traffic Total Traffic Morning Peak Hour Traffic LOS / CLV LOS / CLV LOS / CLV 1. MD 197 & MD 198 D / 1442 E / 1539 E / 1573 w. Improvement D / MD 197 & Morris Drive A / 720 A / 762 A / MD 197 & Greenview Drive A / 531 A / 568 A / MD 197 & Clubhouse Blvd A / 985 B / 1045 B / Clubhouse Blvd & Greenview Drive A / 160 A / 167 A / MD 197 & Cherry Lane B / 1007 B / 1066 B / MD 197 & Contee Road D / 1444 E / 1520 E / 1553 w. Improvement D / MD 198 & Laurel Plaza Entrance A / 744 A / 784 A / 786 Evening Peak Hour Traffic 1. MD 197 & MD 198 F / 1663 F / 1776 F / 1833 w. Improvement F / MD 197 & Morris Drive A / 701 A / 746 A / MD 197 & Greenview Drive A / 568 A / 606 A / MD 197 & Clubhouse Blvd A / 888 A / 949 A / Clubhouse Blvd & Greenview Drive A / 167 A / 174 A / MD 197 & Cherry Lane B / 1102 C / 1170 C / MD 197 & Contee Road C / 1231 D / 1316 D / 1340 w. Improvement D / MD 198 & Laurel Plaza Entrance A / 969 B / 1018 B / 1027 Note: Proposed improvements are to mitigate site impact. Qt, \REV1\Addendum\LOS.xls-Results (CLV), F08/16/18 EXHIBIT 12 RESULTS OF INTERSECTION CAPACITY ANALYSES (CLV)
27 Synchro - HCM Method Existing Traffic Background Traffic Total Traffic Morning Peak Hour Traffic LOS / Delay (sec.) 1. MD 197 & MD 198 D / 45.5 D / 51.5 D / 54.0 w. Improvement D/ MD 197 & Morris Drive A / 7.3 A / 7.5 A / MD 197 & Greenview Drive WB Greenview Drive right turn: C / 17.0 C / 18.3 C / MD 197 & Clubhouse Blvd B / 11.7 B / 12.0 B / Clubhouse Blvd & Greenview Drive EB Clubhouse Blvd left/thru: B / 10.5 B / 10.5 B / 11.6 EB Clubhouse Blvd right turn: A / 8.5 A / 8.5 A / 8.5 WB Clubhouse Blvd approach: A / 9.3 A / 9.3 B / 11.1 NB Greenview Drive approach: A / 5.6 A / 5.5 A / 5.5 SB Greenview Drive left turn: A / 0.0 A / 0.0 A / MD 197 & Cherry Lane B / 18.1 B / 18.5 C / MD 197 & Contee Road D / 38.5 D / 43.0 D / 46.8 w. Improvement D/ MD 198 & Laurel Plaza Entrance A / 4.1 A / 4.2 A / 4.3 Evening Peak Hour Traffic 1. MD 197 & MD 198 E / 64.5 E / 77.8 F / 85.8 w. Improvement E/ MD 197 & Morris Drive A / 9.6 A / 9.9 A / MD 197 & Greenview Drive WB Greenview Drive right turn: C / 17.3 C / 18.4 C / MD 197 & Clubhouse Blvd B / 12.6 B / 12.7 B / Clubhouse Blvd & Greenview Drive EB Clubhouse Blvd left/thru: A / 10.0 B / 10.1 B / 12.7 EB Clubhouse Blvd right turn: A / 8.6 A / 8.6 A / 8.6 WB Clubhouse Blvd approach: A / 9.5 A / 9.5 A / 10.0 NB Greenview Drive approach: A / 5.4 A / 5.4 A / 5.4 SB Greenview Drive left turn: A / 0.0 A / 0.0 A / MD 197 & Cherry Lane B / 19.8 C / 20.3 C / MD 197 & Contee Road C / 31.8 C / 33.0 C / 33.6 w. Improvement C/ MD 198 & Laurel Plaza Entrance A / 8.4 A / 8.9 A / 9.0 Qt, \REV1\Addendum\LOS.xls-Results (Synchro), F08/16/18 EXHIBIT 12A RESULTS OF INTERSECTION CAPACITY ANALYSES (HCM)
28 SimTraffic Morning Peak Hour Traffic Available Storage Length (ft.) Existing Traffic Background Traffic Total Traffic 95th Percentile Queue (ft.) Total Traffic w. Improvement 1. MD 197 & MD 198 EB MD 198 left turn: EB MD 198 thru/right: WB MD 198 left turn: 450 1/ WB MD 198 thru/right: NB MD 197 left/thru: NB MD 197 right turn: SB Irving St approach: MD 197 & Morris Drive EB Morris Drive left/thru: EB Morris Drive right turn: 70 1/ WB Morris Drive left/thru: WB Morris Drive right turn: NB MD 197 left turn: NB MD 197 thru/right: SB MD 197 left turn: SB MD 197 thru/right: MD 197 & Greenview Drive WB Greenview Drive right turn: MD 197 & Clubhouse Blvd WB Clubhouse Blvd left/thru: WB Clubhouse Blvd right turn: 300 <25 <25 <25 NB MD 197 left turn: NB MD 197 thru/right: SB MD 197 left turn: SB MD 197 thru: SB MD 197 right turn: <25 <25 <25 5. Clubhouse Blvd & Greenview Drive EB Clubhouse Blvd left/thru: EB Clubhouse Blvd right turn: <25 WB Clubhouse Blvd approach: 100 <25 < NB Greenview Drive approach: 100 <25 <25 <25 <25 SB Greenview Drive left turn: 150 <25 <25 <25 <25 6. MD 197 & Cherry Lane EB Cherry Lane left turn: EB Cherry Lane right turn: NB MD 197 left turn: NB MD 197 thru: SB MD 197 U-turn: SB MD 197 thru/right: MD 197 & Contee Road / Old Stagecoach Rd EB Contee Road left/thru: EB Contee Road right turn: WB Old Stagecoach Rd left/thru: WB Old Stagecoach Rd right turn: NB MD 197 left turn: NB MD 197 thru: NB MD 197 right turn: 200 <25 <25 <25 <25 SB MD 197 left turn: SB MD 197 thru/right: MD 198 & Laurel Plaza Entrance EB MD 198 left turn: EB MD 198 thru/right: WB MD 198 left turn: WB MD 198 thru/right: NB Access left turn: NB Access thru/right: SB Laurel Plaza Entrance left turn: 3/ SB Laurel Plaza Entrance thru/right: 3/ 100 <25 <25 <25 1. Site impact is either minimal or mitigated by improvements. 2. Traffic is filtered by upstream traffic. 3. in parking lot. EXHIBIT 13 RESULTS OF INTERSECTION QUEUING ANALYSES (SIMTRAFFIC) Qt, \REV1\Addendum\LOS.xls-Results (SimTraffic-am), F08/16/18
29 SimTraffic Evening Peak Hour Traffic Available Storage Length (ft.) Existing Traffic Background Traffic Total Traffic 95th Percentile Queue (ft.) Total Traffic w. Improvement 1. MD 197 & MD MD 197 & Morris Drive 3. MD 197 & Greenview Drive EB MD 198 left turn: 400 1/ EB MD 198 thru/right: WB MD 198 left turn: 450 1/ WB MD 198 thru/right: 850 1, 2/ NB MD 197 left/thru: NB MD 197 right turn: SB Irving St approach: EB Morris Drive left/thru: EB Morris Drive right turn: WB Morris Drive left/thru: WB Morris Drive right turn: NB MD 197 left turn: NB MD 197 thru/right: SB MD 197 left turn: SB MD 197 thru/right: WB Greenview Drive right turn: MD 197 & Clubhouse Blvd WB Clubhouse Blvd left/thru: WB Clubhouse Blvd right turn: 300 <25 <25 <25 5. Clubhouse Blvd & Greenview Drive NB MD 197 left turn: NB MD 197 thru/right: SB MD 197 left turn: SB MD 197 thru: SB MD 197 right turn: <25 <25 <25 EB Clubhouse Blvd left/thru: EB Clubhouse Blvd right turn: WB Clubhouse Blvd approach: NB Greenview Drive approach: 100 <25 <25 <25 <25 6. MD 197 & Cherry Lane SB Greenview Drive left turn: 150 <25 <25 <25 <25 EB Cherry Lane left turn: EB Cherry Lane right turn: NB MD 197 left turn: NB MD 197 thru: SB MD 197 U-turn: 250 <25 <25 <25 SB MD 197 thru/right: MD 197 & Contee Road / Old Stagecoach Rd EB Contee Road left/thru: EB Contee Road right turn: WB Old Stagecoach Rd left/thru: WB Old Stagecoach Rd right turn: MD 198 & Laurel Plaza Entrance NB MD 197 left turn: NB MD 197 thru: NB MD 197 right turn: 200 <25 <25 <25 <25 SB MD 197 left turn: SB MD 197 thru/right: EB MD 198 left turn: EB MD 198 thru/right: , 4/ WB MD 198 left turn: WB MD 198 thru/right: NB Access left turn: NB Access thru/right: SB Laurel Plaza Entrance left turn: 3/ SB Laurel Plaza Entrance thru/right: 3/ <25 1. Site impact is either minimal or mitigated by improvements. 2. Traffic is filtered by upstream traffic. 3. in parking lot. EXHIBIT 13 CONT'D RESULTS OF INTERSECTION QUEUING ANALYSES (SIMTRAFFIC) Qt, \REV1\Addendum\LOS.xls-Results (SimTraffic-pm), F08/16/18
30
31 APPENDIX Intersection Capacity Analysis Worksheets
32 CRITICAL LANE VOLUME (CLV) METHODOLOGY for MSHA E/W Road: MD 198 Date of Count: 9/12/2017 N/S Road: Irving Street/Md 197 Day of Count: Tuesday Conditions: Existing Traffic Analyst: Qiang Tian qt, \rev1\addendum\clv\1.xls-clv, f08/15/18 IRVING STREET Peak: 7:15-8:15 Peak: 5:15-6: PM AM R T L LTR L MD 198 TR R T T T L L AM PM PM AM L L T T T R TR MD 198 L LT R L L T R AM PM MD 197 Capacity Analysis - North/South Split Morning Peak Hour Evening Peak Hour Thru Volumes + Opposing Lefts AM Thru Volumes + Opposing Lefts PM Dir VOL x LUF = Total VOL x LUF = Total CLV Dir VOL x LUF = Total VOL x LUF = Total CLV NB NB SB SB EB EB WB WB CLV TOTAL= 1,442 CLV TOTAL= 1,663 Level of Service (LOS )= D Level of Service (LOS )= F Scenario ID - EXIST1 AM V/C =0.9 PM V/C =1.04
33 CRITICAL LANE VOLUME (CLV) METHODOLOGY for MSHA E/W Road: MD 198 Date of Count: 9/12/2017 N/S Road: Irving Street/Md 197 Day of Count: Tuesday Conditions: Background Traffic Analyst: Qiang Tian qt, \rev1\addendum\clv\1.xls-clv, f08/15/18 IRVING STREET Peak: 7:15-8:15 Peak: 5:15-6: PM AM R T L LTR L MD 198 TR R T T T L L AM PM PM AM L L T T T R TR MD 198 L LT R L L T R AM PM MD 197 Capacity Analysis - North/South Split Morning Peak Hour Evening Peak Hour Thru Volumes + Opposing Lefts AM Thru Volumes + Opposing Lefts PM Dir VOL x LUF = Total VOL x LUF = Total CLV Dir VOL x LUF = Total VOL x LUF = Total CLV NB NB SB SB EB EB WB WB CLV TOTAL= 1,539 CLV TOTAL= 1,776 Level of Service (LOS )= E Level of Service (LOS )= F Scenario ID - BACK1 AM V/C =0.96 PM V/C =1.11
34 CRITICAL LANE VOLUME (CLV) METHODOLOGY for MSHA E/W Road: MD 198 Date of Count: 9/12/2017 N/S Road: Irving Street/Md 197 Day of Count: Tuesday Conditions: Total Traffic Analyst: Qiang Tian qt, \rev1\addendum\clv\1.xls-clv, f08/15/18 IRVING STREET Peak: 7:15-8:15 Peak: 5:15-6: PM AM R T L LTR L MD 198 TR R T T T L L AM PM PM AM L L T T T R TR MD 198 L LT R L L T R AM PM MD 197 Capacity Analysis - North/South Split Morning Peak Hour Evening Peak Hour Thru Volumes + Opposing Lefts AM Thru Volumes + Opposing Lefts PM Dir VOL x LUF = Total VOL x LUF = Total CLV Dir VOL x LUF = Total VOL x LUF = Total CLV NB NB SB SB EB EB WB WB CLV TOTAL= 1,573 CLV TOTAL= 1,833 Level of Service (LOS )= E Level of Service (LOS )= F Scenario ID - TOT1 AM V/C =0.98 PM V/C =1.15
35 qt, \rev1\addendum\clv\1.xls-clv (imp), f08/15/18 CRITICAL LANE VOLUME (CLV) METHODOLOGY for MSHA E/W Road: MD 198 Date of Count: 9/12/2017 N/S Road: Irving Street/Md 197 Day of Count: Tuesday Conditions: Total Traffic Analyst: Qiang Tian w. Improvement IRVING STREET Peak: 7:15-8:15 Peak: 5:15-6: PM AM R T L LTR L MD 198 TR R T T T L L AM PM PM AM L L T T T R TR MD 198 L L LT R L L T R AM PM Capacity Analysis - North/South Split Morning Peak Hour MD 197 Evening Peak Hour Thru Volumes + Opposing Lefts AM Thru Volumes + Opposing Lefts PM Dir VOL x LUF = Total VOL x LUF = Total CLV Dir VOL x LUF = Total VOL x LUF = Total CLV NB NB SB SB EB EB WB WB CLV TOTAL= 1,442 CLV TOTAL= 1,723 Level of Service (LOS )= D Level of Service (LOS )= F Scenario ID - TOT1 AM V/C =0.9 PM V/C =1.08
36 qt, \rev1\addendum\clv\2.xls-clv, f08/15/18 CRITICAL LANE VOLUME (CLV) METHODOLOGY for MSHA E/W Road: Morris Drive Date of Count: 9/12/2017 N/S Road: MD 197 Day of Count: Tuesday Conditions: Existing Traffic Analyst: Qiang Tian MD 197 Peak: 7:15-8:15 Peak: 5:30-6: PM AM R T L TR T T L MORRIS DRIVE R R LT T 3 7 L AM PM adjusted lefts adjusted lefts PM AM L 2 3 T LT R R MORRIS DRIVE L T T TR L T R AM PM Capacity Analysis Morning Peak Hour MD 197 Evening Peak Hour Thru Volumes + Opposing Lefts AM Thru Volumes + Opposing Lefts PM Dir VOL x LUF = Total VOL x LUF = Total CLV Dir VOL x LUF = Total VOL x LUF = Total CLV NB NB SB SB EB EB WB WB CLV TOTAL= 720 CLV TOTAL= 701 Level of Service (LOS )= A Level of Service (LOS )= A Scenario ID - EXIST2 AM V/C =0.45 PM V/C =0.44
37 qt, \rev1\addendum\clv\2.xls-clv, f08/15/18 CRITICAL LANE VOLUME (CLV) METHODOLOGY for MSHA E/W Road: Morris Drive Date of Count: 9/12/2017 N/S Road: MD 197 Day of Count: Tuesday Conditions: Background Traffic Analyst: Qiang Tian MD 197 Peak: 7:15-8:15 Peak: 5:30-6: PM AM R T L TR T T L MORRIS DRIVE R R LT T 3 7 L AM PM adjusted lefts adjusted lefts PM AM L 2 3 T LT R R MORRIS DRIVE L T T TR L T R AM PM Capacity Analysis Morning Peak Hour MD 197 Evening Peak Hour Thru Volumes + Opposing Lefts AM Thru Volumes + Opposing Lefts PM Dir VOL x LUF = Total VOL x LUF = Total CLV Dir VOL x LUF = Total VOL x LUF = Total CLV NB NB SB SB EB EB WB WB CLV TOTAL= 762 CLV TOTAL= 746 Level of Service (LOS )= A Level of Service (LOS )= A Scenario ID - BACK2 AM V/C =0.48 PM V/C =0.47
38 qt, \rev1\addendum\clv\2.xls-clv, f08/15/18 CRITICAL LANE VOLUME (CLV) METHODOLOGY for MSHA E/W Road: Morris Drive Date of Count: 9/12/2017 N/S Road: MD 197 Day of Count: Tuesday Conditions: Total Traffic Analyst: Qiang Tian MD 197 Peak: 7:15-8:15 Peak: 5:30-6: PM AM R T L TR T T L MORRIS DRIVE R R LT T 3 7 L AM PM adjusted lefts adjusted lefts PM AM L 2 3 T LT R R MORRIS DRIVE L T T TR L T R AM PM Capacity Analysis Morning Peak Hour MD 197 Evening Peak Hour Thru Volumes + Opposing Lefts AM Thru Volumes + Opposing Lefts PM Dir VOL x LUF = Total VOL x LUF = Total CLV Dir VOL x LUF = Total VOL x LUF = Total CLV NB NB SB SB EB EB WB WB CLV TOTAL= 766 CLV TOTAL= 781 Level of Service (LOS )= A Level of Service (LOS )= A Scenario ID - TOT2 AM V/C =0.48 PM V/C =0.49
39 qt, \rev1\addendum\clv\3.xls-clv, f08/15/18 CRITICAL LANE VOLUME (CLV) METHODOLOGY for MSHA E/W Road: Greenview Drive Date of Count: 9/12/2017 N/S Road: MD 197 Day of Count: Tuesday Conditions: Existing Traffic Analyst: Qiang Tian MD 197 Peak: 7:15-8:15 Peak: 5:30-6: PM AM T L R R L 0 0 AM PM GREENVIEW DRIVE T T TR T R AM PM Capacity Analysis Morning Peak Hour MD 197 Evening Peak Hour Thru Volumes + Opposing Lefts AM Thru Volumes + Opposing Lefts PM Dir VOL x LUF = Total VOL x LUF = Total CLV Dir VOL x LUF = Total VOL x LUF = Total CLV WB WB NB NB SB SB CLV TOTAL= 531 CLV TOTAL= 568 Level of Service (LOS )= A Level of Service (LOS )= A Scenario ID - EXIST3 CLV V/C =0.33 CLV V/C =0.36
40 qt, \rev1\addendum\clv\3.xls-clv, f08/15/18 CRITICAL LANE VOLUME (CLV) METHODOLOGY for MSHA E/W Road: Greenview Drive Date of Count: 9/12/2017 N/S Road: MD 197 Day of Count: Tuesday Conditions: Background Traffic Analyst: Qiang Tian MD 197 Peak: 7:15-8:15 Peak: 5:30-6: PM AM T L R R L 0 0 AM PM GREENVIEW DRIVE T T TR T R AM PM Capacity Analysis Morning Peak Hour MD 197 Evening Peak Hour Thru Volumes + Opposing Lefts AM Thru Volumes + Opposing Lefts PM Dir VOL x LUF = Total VOL x LUF = Total CLV Dir VOL x LUF = Total VOL x LUF = Total CLV WB WB NB NB SB SB CLV TOTAL= 568 CLV TOTAL= 606 Level of Service (LOS )= A Level of Service (LOS )= A Scenario ID - BACK3 CLV V/C =0.36 CLV V/C =0.38
41 qt, \rev1\addendum\clv\3.xls-clv, f08/15/18 CRITICAL LANE VOLUME (CLV) METHODOLOGY for MSHA E/W Road: Greenview Drive Date of Count: 9/12/2017 N/S Road: MD 197 Day of Count: Tuesday Conditions: Total Traffic Analyst: Qiang Tian MD 197 Peak: 7:15-8:15 Peak: 5:30-6: PM AM T L R R L 0 0 AM PM GREENVIEW DRIVE T T TR T R AM PM Capacity Analysis Morning Peak Hour MD 197 Evening Peak Hour Thru Volumes + Opposing Lefts AM Thru Volumes + Opposing Lefts PM Dir VOL x LUF = Total VOL x LUF = Total CLV Dir VOL x LUF = Total VOL x LUF = Total CLV WB WB NB NB SB SB CLV TOTAL= 650 CLV TOTAL= 643 Level of Service (LOS )= A Level of Service (LOS )= A Scenario ID - TOT3 CLV V/C =0.41 CLV V/C =0.4
42 qt, \rev1\addendum\clv\4.xls-clv, f08/15/18 CRITICAL LANE VOLUME (CLV) METHODOLOGY for MSHA E/W Road: Clubhouse Boulevard/Bowie Road Date of Count: 9/12/2017 N/S Road: MD 197 Day of Count: Tuesday Conditions: Existing Traffic Analyst: Qiang Tian MD 197 Peak: 7:15-8:15 Peak: 5:30-6: PM AM R T L R T T L BOWIE ROAD R R LT T 3 3 L L AM PM adjusted lefts PM AM 0 0 L 0 0 T R FR CLUBHOUSE BOULEVARD L T T TR L T R AM PM Capacity Analysis Morning Peak Hour MD 197 Evening Peak Hour Thru Volumes + Opposing Lefts AM Thru Volumes + Opposing Lefts PM Dir VOL x LUF = Total VOL x LUF = Total CLV Dir VOL x LUF = Total VOL x LUF = Total CLV NB NB SB SB EB EB WB WB CLV TOTAL= 985 CLV TOTAL= 888 Level of Service (LOS )= A Level of Service (LOS )= A Scenario ID - EXIST4 AM V/C =0.62 PM V/C =0.56
43 qt, \rev1\addendum\clv\4.xls-clv, f08/15/18 CRITICAL LANE VOLUME (CLV) METHODOLOGY for MSHA E/W Road: Clubhouse Boulevard/Bowie Road Date of Count: 9/12/2017 N/S Road: MD 197 Day of Count: Tuesday Conditions: Background Traffic Analyst: Qiang Tian MD 197 Peak: 7:15-8:15 Peak: 5:30-6: PM AM R T L R T T L BOWIE ROAD R R LT T 3 3 L L AM PM adjusted lefts PM AM 0 0 L 0 0 T R FR CLUBHOUSE BOULEVARD L T T TR L T R AM PM Capacity Analysis Morning Peak Hour MD 197 Evening Peak Hour Thru Volumes + Opposing Lefts AM Thru Volumes + Opposing Lefts PM Dir VOL x LUF = Total VOL x LUF = Total CLV Dir VOL x LUF = Total VOL x LUF = Total CLV NB NB SB SB EB EB WB WB CLV TOTAL= 1,045 CLV TOTAL= 949 Level of Service (LOS )= B Level of Service (LOS )= A Scenario ID - BACK4 AM V/C =0.65 PM V/C =0.59
44 qt, \rev1\addendum\clv\4.xls-clv, f08/15/18 CRITICAL LANE VOLUME (CLV) METHODOLOGY for MSHA E/W Road: Clubhouse Boulevard/Bowie Road Date of Count: 9/12/2017 N/S Road: MD 197 Day of Count: Tuesday Conditions: Total Traffic Analyst: Qiang Tian MD 197 Peak: 7:15-8:15 Peak: 5:30-6: PM AM R T L R T T L BOWIE ROAD R R LT T 3 3 L L AM PM adjusted lefts PM AM 0 0 L 0 0 T R FR CLUBHOUSE BOULEVARD L T T TR L T R AM PM Capacity Analysis Morning Peak Hour MD 197 Evening Peak Hour Thru Volumes + Opposing Lefts AM Thru Volumes + Opposing Lefts PM Dir VOL x LUF = Total VOL x LUF = Total CLV Dir VOL x LUF = Total VOL x LUF = Total CLV NB NB SB SB EB EB WB WB CLV TOTAL= 1,138 CLV TOTAL= 991 Level of Service (LOS )= B Level of Service (LOS )= A Scenario ID - TOT4 AM V/C =0.71 PM V/C =0.62
45 qt, \rev1\addendum\clv\5.xls-clv, f10/03/18 CRITICAL LANE VOLUME (CLV) METHODOLOGY for MSHA E/W Road: Golf Club Entrance/Clubhouse Blvd Date of Count: 9/21/2017 N/S Road: Greenview Drive Day of Count: Thursday Conditions: Existing Traffic Analyst: Qiang Tian GREENVIEW DRIVE Peak: 7:30-8:30 Peak: 5:00-6: PM AM R T L RT L CLUBHOUSE BLVD RTL R 1 13 T 1 27 L 0 1 AM PM adjusted lefts adjusted lefts 0 1 PM AM L T LT R R LTR GOLF CLUB ENTRANCE adjusted lefts L T R 57 AM PM Capacity Analysis Morning Peak Hour GREENVIEW DRIVE Evening Peak Hour Thru Volumes + Opposing Lefts AM Thru Volumes + Opposing Lefts PM Dir VOL x LUF = Total VOL x LUF = Total CLV Dir VOL x LUF = Total VOL x LUF = Total CLV NB NB SB SB EB EB WB WB CLV TOTAL= 160 CLV TOTAL= 167 Level of Service (LOS )= A Level of Service (LOS )= A Scenario ID - EXIST5 AM V/C =0.1 PM V/C =0.1
46 qt, \rev1\addendum\clv\5.xls-clv, f10/03/18 CRITICAL LANE VOLUME (CLV) METHODOLOGY for MSHA E/W Road: Golf Club Entrance/Clubhouse Blvd Date of Count: 9/21/2017 N/S Road: Greenview Drive Day of Count: Thursday Conditions: Background Traffic Analyst: Qiang Tian GREENVIEW DRIVE Peak: 7:30-8:30 Peak: 5:00-6: PM AM R T L RT L CLUBHOUSE BLVD RTL R 1 14 T 1 28 L 0 1 AM PM adjusted lefts adjusted lefts 0 1 PM AM L T LT R R LTR GOLF CLUB ENTRANCE adjusted lefts L T R 59 AM PM Capacity Analysis Morning Peak Hour GREENVIEW DRIVE Evening Peak Hour Thru Volumes + Opposing Lefts AM Thru Volumes + Opposing Lefts PM Dir VOL x LUF = Total VOL x LUF = Total CLV Dir VOL x LUF = Total VOL x LUF = Total CLV NB NB SB SB EB EB WB WB CLV TOTAL= 167 CLV TOTAL= 174 Level of Service (LOS )= A Level of Service (LOS )= A Scenario ID - BACK5 AM V/C =0.1 PM V/C =0.11
47 qt, \rev1\addendum\clv\5.xls-clv, f10/03/18 CRITICAL LANE VOLUME (CLV) METHODOLOGY for MSHA E/W Road: Golf Club Entrance/Clubhouse Blvd Date of Count: 9/21/2017 N/S Road: Greenview Drive Day of Count: Thursday Conditions: Total Traffic Analyst: Qiang Tian GREENVIEW DRIVE Peak: 7:30-8:30 Peak: 5:00-6: PM AM R T L RT L CLUBHOUSE BLVD RTL R T L 0 1 AM PM adjusted lefts adjusted lefts 0 2 PM AM L T LT R R LTR GOLF CLUB ENTRANCE adjusted lefts L T R 59 AM PM Capacity Analysis Morning Peak Hour GREENVIEW DRIVE Evening Peak Hour Thru Volumes + Opposing Lefts AM Thru Volumes + Opposing Lefts PM Dir VOL x LUF = Total VOL x LUF = Total CLV Dir VOL x LUF = Total VOL x LUF = Total CLV NB NB SB SB EB EB WB WB CLV TOTAL= 306 CLV TOTAL= 330 Level of Service (LOS )= A Level of Service (LOS )= A Scenario ID - TOT5 AM V/C =0.19 PM V/C =0.21
48 CRITICAL LANE VOLUME (CLV) METHODOLOGY for MSHA E/W Road Name: Cherry Lane Date of Count: 9/21/2017 N/S Road Name: MD 197 Day of Count: Thursday Conditions: Existing Traffic Analyst: Qiang Tian qt, \rev1\addendum\clv\6.xls-clv, f08/15/18 MD 197 AM Peak: 07:30-8:30 PM Peak: 04:00-5: PM AM R T RT T T U CHERRY LANE L PM AM L L R R R L L T T T L T AM PM Capacity Analysis Morning Peak Hour MD 197 Evening Peak Hour Thru Volumes + Opposing Lefts AM Thru Volumes + Opposing Lefts PM Dir VOL x LUF = Total VOL x LUF = Total CLV Dir VOL x LUF = Total VOL x LUF = Total CLV EB EB NB NB SB SB CLV TOTAL= 1,007 CLV TOTAL= 1,102 Level of Service (LOS )= B Level of Service (LOS )= B Scenario ID - EXIST6 CLV V/C =0.63 CLV V/C =0.69
49 CRITICAL LANE VOLUME (CLV) METHODOLOGY for MSHA E/W Road Name: Cherry Lane Date of Count: 9/21/2017 N/S Road Name: MD 197 Day of Count: Thursday Conditions: Background Traffic Analyst: Qiang Tian qt, \rev1\addendum\clv\6.xls-clv, f08/15/18 MD 197 AM Peak: 07:30-8:30 PM Peak: 04:00-5: PM AM R T RT T T U CHERRY LANE L PM AM L L R R R L L T T T L T AM PM Capacity Analysis Morning Peak Hour MD 197 Evening Peak Hour Thru Volumes + Opposing Lefts AM Thru Volumes + Opposing Lefts PM Dir VOL x LUF = Total VOL x LUF = Total CLV Dir VOL x LUF = Total VOL x LUF = Total CLV EB EB NB NB SB SB CLV TOTAL= 1,066 CLV TOTAL= 1,170 Level of Service (LOS )= B Level of Service (LOS )= C Scenario ID - BACK6 CLV V/C =0.67 CLV V/C =0.73
50 CRITICAL LANE VOLUME (CLV) METHODOLOGY for MSHA E/W Road Name: Cherry Lane Date of Count: 9/21/2017 N/S Road Name: MD 197 Day of Count: Thursday Conditions: Total Traffic Analyst: Qiang Tian qt, \rev1\addendum\clv\6.xls-clv, f08/15/18 MD 197 AM Peak: 07:30-8:30 PM Peak: 04:00-5: PM AM R T RT T T U CHERRY LANE L PM AM L L R R R L L T T T L T AM PM Capacity Analysis Morning Peak Hour MD 197 Evening Peak Hour Thru Volumes + Opposing Lefts AM Thru Volumes + Opposing Lefts PM Dir VOL x LUF = Total VOL x LUF = Total CLV Dir VOL x LUF = Total VOL x LUF = Total CLV EB EB NB NB SB SB CLV TOTAL= 1,103 CLV TOTAL= 1,193 Level of Service (LOS )= B Level of Service (LOS )= C Scenario ID - TOT6 CLV V/C =0.69 CLV V/C =0.75
51 qt, \rev1\addendum\clv\7.xls-clv, f08/15/18 CRITICAL LANE VOLUME (CLV) METHODOLOGY for MSHA E/W Road: Old Stagecoach Road/Contee Road Date of Count: 9/12/2017 N/S Road: MD 197 Day of Count: Tuesday Conditions: Existing Traffic Analyst: Qiang Tian MD 197 Peak: 7:00-8:00 Peak: 5:00-6: PM AM R T L TR T T L CONTEE ROAD R R LT T L AM PM adjusted lefts adjusted lefts PM AM L 30 1 T LT R R OLD STAGECOACH ROAD L L T T R L T R AM PM Capacity Analysis Morning Peak Hour MD 197 Evening Peak Hour Thru Volumes + Opposing Lefts AM Thru Volumes + Opposing Lefts PM Dir VOL x LUF = Total VOL x LUF = Total CLV Dir VOL x LUF = Total VOL x LUF = Total CLV NB NB SB SB EB EB WB WB CLV TOTAL= 1,444 CLV TOTAL= 1,231 Level of Service (LOS )= D Level of Service (LOS )= C Scenario ID - EXIST7 AM V/C =0.9 PM V/C =0.77
52 qt, \rev1\addendum\clv\7.xls-clv, f08/15/18 CRITICAL LANE VOLUME (CLV) METHODOLOGY for MSHA E/W Road: Old Stagecoach Road/Contee Road Date of Count: 9/12/2017 N/S Road: MD 197 Day of Count: Tuesday Conditions: Background Traffic Analyst: Qiang Tian MD 197 Peak: 7:00-8:00 Peak: 5:00-6: PM AM R T L TR T T L CONTEE ROAD R R LT T L AM PM adjusted lefts adjusted lefts PM AM L 31 1 T LT R R OLD STAGECOACH ROAD L L T T R L T R AM PM Capacity Analysis Morning Peak Hour MD 197 Evening Peak Hour Thru Volumes + Opposing Lefts AM Thru Volumes + Opposing Lefts PM Dir VOL x LUF = Total VOL x LUF = Total CLV Dir VOL x LUF = Total VOL x LUF = Total CLV NB NB SB SB EB EB WB WB CLV TOTAL= 1,520 CLV TOTAL= 1,316 Level of Service (LOS )= E Level of Service (LOS )= D Scenario ID - BACK7 AM V/C =0.95 PM V/C =0.82
53 qt, \rev1\addendum\clv\7.xls-clv, f08/15/18 CRITICAL LANE VOLUME (CLV) METHODOLOGY for MSHA E/W Road: Old Stagecoach Road/Contee Road Date of Count: 9/12/2017 N/S Road: MD 197 Day of Count: Tuesday Conditions: Total Traffic Analyst: Qiang Tian MD 197 Peak: 7:00-8:00 Peak: 5:00-6: PM AM R T L TR T T L CONTEE ROAD R R LT T L AM PM adjusted lefts adjusted lefts PM AM L 31 1 T LT R R OLD STAGECOACH ROAD L L T T R L T R AM PM Capacity Analysis Morning Peak Hour MD 197 Evening Peak Hour Thru Volumes + Opposing Lefts AM Thru Volumes + Opposing Lefts PM Dir VOL x LUF = Total VOL x LUF = Total CLV Dir VOL x LUF = Total VOL x LUF = Total CLV NB NB SB SB EB EB WB WB CLV TOTAL= 1,553 CLV TOTAL= 1,340 Level of Service (LOS )= E Level of Service (LOS )= D Scenario ID - TOT7 AM V/C =0.97 PM V/C =0.84
54 qt, \rev1\addendum\clv\7.xls-clv (imp), f08/15/18 CRITICAL LANE VOLUME (CLV) METHODOLOGY for MSHA E/W Road: Old Stagecoach Road/Contee Road Date of Count: 9/12/2017 N/S Road: MD 197 Day of Count: Tuesday Conditions: Total Traffic Analyst: Qiang Tian w. Improvement MD 197 Peak: 7:00-8:00 Peak: 5:00-6: PM AM R T L RT T T L CONTEE ROAD RT R L T L AM PM adjusted lefts PM AM L LT 31 1 T R R R OLD STAGECOACH ROAD L L T T R L T R AM PM MD 197 Capacity Analysis Morning Peak Hour Evening Peak Hour Thru Volumes + Opposing Lefts AM Thru Volumes + Opposing Lefts PM Dir VOL x LUF = Total VOL x LUF = Total CLV Dir VOL x LUF = Total VOL x LUF = Total CLV NB NB SB SB EB EB WB WB CLV TOTAL= 1,392 CLV TOTAL= 1,331 Level of Service (LOS )= D Level of Service (LOS )= D Scenario ID - TOT7 AM V/C =0.87 PM V/C =0.83
55 qt, \rev1\addendum\clv\8.xls-clv, f08/15/18 CRITICAL LANE VOLUME (CLV) METHODOLOGY for MSHA E/W Road: MD 198 Date of Count: N/S Road: Laurel Plaza Entrance/Access Day of Count: Conditions: Existing Traffic Analyst: Qiang Tian LAUREL PLAZA ENTRANCE PM AM R T L TR L MD 198 TR R T T T L L AM PM PM AM L L T T T 15 3 R TR L TR MD 198 L T R AM PM ACCESS Capacity Analysis Morning Peak Hour Evening Peak Hour Thru Volumes + Opposing Lefts AM Thru Volumes + Opposing Lefts PM Dir VOL x LUF = Total VOL x LUF = Total CLV Dir VOL x LUF = Total VOL x LUF = Total CLV NB NB SB SB EB EB WB WB CLV TOTAL= 744 CLV TOTAL= 969 Level of Service (LOS )= A Level of Service (LOS )= A Scenario ID - EXIST8 AM V/C =0.47 PM V/C =0.61
Traffic Impact Analysis Chatham County Grocery Chatham County, NC
 Chatham County Grocery Chatham County, NC TABLE OF CONTENTS 1. INTRODUCTION... 1 1.1. Location and Study Area... 1 1.2. Proposed Land Use and Access... 2 1.3. Adjacent Land Uses... 2 1.4. Existing ways...
Traffic Impact Study WestBranch Residential Development Davidson, NC March 2016
 Traffic Impact Study WestBranch Residential Development Davidson, NC March 216 TRAFFIC IMPACT STUDY FOR THE WestBranch Residential Development LOCATED IN DAVIDSON, NC Prepared For: Lennar Carolinas, LLC
Traffic Impact Analysis Walton Acres at Riverwood Athletic Club Clayton, NC
 Traffic Impact Analysis Walton Acres at Riverwood Athletic Club Clayton, NC 1. TABLE OF CONTENTS INTRODUCTION...1 1.1. Site Location and Study Area...1 1.2. Proposed Land Use and Site Access...2 1.3.
Harrah s Station Square Casino
 Transportation Analysis Harrah s Station Square Casino Pittsburgh, Pennsylvania Submitted To: City of Pittsburgh and Pennsylvania Gaming Control Board Prepared By: DKS Associates GAI Consultants December
INDUSTRIAL BUILDING 3009 HAWTHORNE ROAD CITY OF OTTAWA TRANSPORTATION OVERVIEW REVISED. Prepared for: Canada Inc.
 INDUSTRIAL BUILDING 3009 HAWTHORNE ROAD CITY OF OTTAWA TRANSPORTATION OVERVIEW REVISED Prepared for: 7849648 Canada Inc. Octiober 1, 2015 114-598 Overview_2.doc D. J. Halpenny & Associates Ltd. Consulting
INDUSTRIAL BUILDING 1660 COMSTOCK ROAD CITY OF OTTAWA TRANSPORTATION OVERVIEW. Prepared for:
 INDUSTRIAL BUILDING 1660 COMSTOCK ROAD CITY OF OTTAWA TRANSPORTATION OVERVIEW Prepared for: Simluc Contractors Limited 2550 Blackwell Street, Ottawa K1B 5R1 October 18, 2013 113-584 Overview_1.doc D. J.
Traffic Impact Study Little Egypt Road Development Denver, North Carolina June 2017
 Traffic Impact Study Little Egypt Road Development Denver, North arolina June 2017 N. Little Egypt Road DQ\ QDQFLQJ VDOHV RU RWKHU SHUIRUPDQFH EDVHG FULWHULD Proposed Site Driveways Site Driveway 1 TRAFFI
TRAFFIC IMPACT STUDY And A TRAFFIC SIGNAL WARRANT ANALYSIS FOR A SENIOR LIVING AND APARTMENT DEVELOPMENT
 TRAFFIC IMPACT STUDY And A TRAFFIC SIGNAL WARRANT ANALYSIS FOR A SENIOR LIVING AND APARTMENT DEVELOPMENT DEERFIELD TOWNSHIP, WARREN COUNTY, OHIO Nantucket Circle and Montgomery Road () Prepared for: ODLE
Traffic Circulation Study for Neighborhood Southwest of Mockingbird Lane and Airline Road, Highland Park, Texas
 ARIZONA TEXAS NEW MEXICO OKLAHOMA February 13, 2015 Mr. Meran Dadgostar P.E., R.S. Town of Highland Park 4700 Drexel Dr. Highland Park, Texas 75205 Re: Traffic Circulation Study for Neighborhood Southwest
5858 N COLLEGE, LLC N College Avenue Traffic Impact Study
 5858 N COLLEGE, LLC nue Traffic Impact Study August 22, 2016 Contents Traffic Impact Study Page Preparer Qualifications... 1 Introduction... 2 Existing Roadway Conditions... 5 Existing Traffic Conditions...
MEETING FACILITY 2901 GIBFORD DRIVE CITY OF OTTAWA TRANSPORTATION BRIEF. Prepared for: Holiday Inn Express 2881 Gibford Drive Ottawa, ON K1V 2L9
 MEETING FACILITY 2901 GIBFORD DRIVE CITY OF OTTAWA TRANSPORTATION BRIEF Prepared for: Holiday Inn Express 2881 Gibford Drive Ottawa, ON K1V 2L9 December 18, 2012 112-566 Brief_1.doc D. J. Halpenny & Associates
NO BUILD TRAFFIC OPERATIONS
 3. 23 NO BUILD TRAFFIC OPERATIONS This section addresses the operations of the transportation system and details how it would be expected to function under year 23 No Build conditions with the projected
Troutbeck Farm Development
 Troutbeck Farm Development Willistown Township, Chester County PA For Submission To: Willistown Township Last Revised: October, 4 TPD# INLM.A. 5 E. High Street Suite 65 Pottstown, PA 9464 6.36.3 TPD@TrafficPD.com
MEDICAL/OFFICE BUILDING 1637 BANK STREET OTTAWA, ONTARIO TRANSPORTATION OVERVIEW. Prepared for:
 MEDICAL/OFFICE BUILDING 1637 BANK STREET OTTAWA, ONTARIO TRANSPORTATION OVERVIEW Prepared for: 2434984 Ontario Inc. 13-5510 Canotek Road Ottawa, Ontario K1J 9J5 June 4, 2015 115-613 Report_2.doc D. J.
OFFICE/RETAIL DEVELOPMENT 1625 BANK STREET OTTAWA, ONTARIO TRANSPORTATION BRIEF. Prepared for: Canada Inc.
 OFFICE/RETAIL DEVELOPMENT 1625 BANK STREET OTTAWA, ONTARIO TRANSPORTATION BRIEF Prepared for: 9402209 Canada Inc. December 15, 2015 115-625 Report_2.doc D. J. Halpenny & Associates Ltd. Consulting Transportation
PINESTONE TRAFFIC IMPACT STUDY Travelers Rest, South Carolina
 PINESTONE TRAFFIC IMPACT STUDY Travelers Rest, South Carolina Prepared for Longbranch Development Prepared by January 13, 219 ii Table of Contents Subject Page Signature Page... i Table of Contents...
HILTON GARDEN INN HOTEL HOTEL EXPANSION 2400 ALERT ROAD, OTTAWA TRANSPORTATION BRIEF. Prepared for:
 HILTON GARDEN INN HOTEL HOTEL EXPANSION 2400 ALERT ROAD, OTTAWA TRANSPORTATION BRIEF Prepared for: Bona Building & Management Co. Ltd. Place Vanier, 333 North River Road Vanier, Ontario K1L 8B9 October
List of Attachments. Location Map... Site Plan... City of Lake Elsinore Circulation Element... City of Lake Elsinore Roadway Cross-Sections...
 List of Attachments Exhibits Location Map... Site Plan... City of Lake Elsinore Circulation Element... City of Lake Elsinore Roadway Cross-Sections... Existing Lane Geometry and Traffic Controls... Existing
QUICKIE C STORE AND GAS BAR 1780 HERON ROAD OTTAWA, ONTARIO TRANSPORTATION BRIEF. Prepared for:
 QUICKIE C STORE AND GAS BAR 1780 HERON ROAD OTTAWA, ONTARIO TRANSPORTATION BRIEF Prepared for: Quickie Convenience Stores Larny Holdings Ltd. c/o PBC Group April 15, 2015 115-615 Report_1.doc D. J. Halpenny
Erickson Living at Limestone Valley
 Erickson Living at Limestone Valley Howard County, Maryland July 28, 27 Adequate Road Facilities Test Evaluation and Traffic Study Prepared for: Erickson Living Steven Montgomery Vice President of Development
Traffic Impact Study. Westlake Elementary School Westlake, Ohio. TMS Engineers, Inc. June 5, 2017
 TMS Engineers, Inc. Traffic Impact Study Westlake Elementary School Westlake, Ohio June 5, 2017 Prepared for: Westlake City Schools - Board of Education 27200 Hilliard Boulevard Westlake, OH 44145 TRAFFIC
Walmart (Store # ) 60 th Street North and Marion Road Sioux Falls, South Dakota
 60 th Street North and Marion Road Sioux Falls, South Dakota") Walmart (Store #4865-00) 60 th Street North and Marion Road Sioux Falls, South Dakota Prepared for: Wal-Mart Stores, Inc. Bentonville, Arkansas Prepared by: Kimley-Horn and Associates, Inc. ã2013 Kimley-Horn
Walmart (Store #4865-00) 60 th Street North and Marion Road Sioux Falls, South Dakota Prepared for: Wal-Mart Stores, Inc. Bentonville, Arkansas Prepared by: Kimley-Horn and Associates, Inc. ã2013 Kimley-Horn
FAIRFIELD INN & SUITES HOTEL 135 THAD JOHNSON PRIVATE OTTAWA TRANSPORTATION BRIEF. Prepared for:
 FAIRFIELD INN & SUITES HOTEL 135 THAD JOHNSON PRIVATE OTTAWA TRANSPORTATION BRIEF Prepared for: Bona Building & Management Co. Ltd. Place Vanier, 333 North River Road Vanier, Ontario K1L 8B9 August 12,
TRAFFIC IMPACT STUDY
 TRAFFIC IMPACT STUDY for the GLEN ELLEN COUNTRY CLUB SENIOR RESIDENTIAL REDEVELOPMENT 84 Millis, Massachusetts Prepared by: McMahon Associates, Inc. Prepared for: Toll Brothers, Inc. August 216 DRAFT
OTTAWA TRAIN YARDS PHASE 3 DEVELOPMENT CITY OF OTTAWA TRANSPORTATION IMPACT STUDY. Prepared for:
 OTTAWA TRAIN YARDS PHASE 3 DEVELOPMENT CITY OF OTTAWA TRANSPORTATION IMPACT STUDY Prepared for: The Ottawa Train Yards Inc. 223 Colonnade Road South, Suite 212 Nepean, Ontario K2E 7K3 January 17, 2012
URBAN QUARRY HEADQUARTERS 2717 STEVENAGE DRIVE CITY OF OTTAWA TRANSPORTATION OVERVIEW. Prepared for: Urban Quarry 4123 Belgreen Drive, Ottawa K1G 3N2
 URBAN QUARRY HEADQUARTERS 2717 STEVENAGE DRIVE CITY OF OTTAWA TRANSPORTATION OVERVIEW Prepared for: Urban Quarry 4123 Belgreen Drive, Ottawa K1G 3N2 February 27, 2014 113-584 Overview_1.doc D. J. Halpenny
Traffic Impact Statement
 Traffic Impact Statement Mixed Use Development, US 41 and Old Trail Drive aka Tide-Starbucks 4900 9 th Street North General Development Site Plan (GDSP) Collier County, FL 10/6/2015 Prepared for: Prepared
Marina Loft (DRC 51-R-12)
") Marina Loft (DRC 51-R-12) traffic study prepared for: Cymbal Development OCtober 2012 Traf Tech October 1, 2012 Mr. Asi Cymbal - President Cymbal Development 3470 North Miami Avenue Upper Suite Miami,
Marina Loft (DRC 51-R-12) traffic study prepared for: Cymbal Development OCtober 2012 Traf Tech October 1, 2012 Mr. Asi Cymbal - President Cymbal Development 3470 North Miami Avenue Upper Suite Miami,
Place Vanier 250 Montreal Road Transportation Impact Study Addendum. Prepared for Broccolini Construction September 20 th, 2012
 Update for the May 31 st, 2012 Traffic Impact Study Prepared for Broccolini Construction 111-23596-00 September 20 th, 2012 2611 Queensview Drive, Suite 300, Ottawa, Ontario CANADA K2B 8K2 Telephone: 613-829-2800
THE LANDMARK AT TALBOT PARK
 TRAFFIC IMPACT STUDY FOR THE LANDMARK AT TALBOT PARK IN NORFOLK, VA INTERMODAL ENGINEERING, P.C. OCTOBER, 200 The Landmark at Talbot Park is a proposed redevelopment of the existing apartments along the
THIS PAGE LEFT BLANK INTENTIONALLY
 GA SR 25 Spur at Canal Road Transportation Impact Analysis PREPARED FOR GLYNN COUNTY, GEORGIA 1725 Reynolds Street, Suite 300 Brunswick, Georgia 31520 PREPARED BY 217 Arrowhead Boulevard Suite 26 Jonesboro,
Glenn Avenue Corridor Traffic Operational Evaluation
 Glenn Avenue Corridor Traffic Operational Evaluation PREPARED FOR: THE CITY OF AUBURN PREPARED BY: DECEMBER 2007 Glenn Avenue Corridor Study--Auburn, Alabama TABLE OF CONTENTS Introduction... 1 Background
REDEVELOPMENT TRAFFIC IMPACT STUDY
 REDEVELOPMENT TRAFFIC IMPACT STUDY For Wendy s Parker, Colorado January 215 Prepared for: Sterling Design Associates, LLC 29 W. Littleton Boulevard #3 Littleton, Colorado 812 Prepared by: 1233 Airport
HOLIDAY INN HOTEL 235 KING EDWARD AVENUE CITY OF OTTAWA TRANSPORTATION BRIEF. Prepared for:
 HOLIDAY INN HOTEL 235 KING EDWARD AVENUE CITY OF OTTAWA TRANSPORTATION BRIEF Prepared for: Momentum Planning & Communications 1165 Greenlawn Crescent Ottawa, ON K1L 6C2 June 29, 2015 115-618 Brief_1.doc
COMMERCIAL DEVELOPMENT 2015 ROBERTSON ROAD OTTAWA, ONTARIO TRANSPORTATION BRIEF. Prepared for:
 COMMERCIAL DEVELOPMENT 2015 ROBERTSON ROAD OTTAWA, ONTARIO TRANSPORTATION BRIEF Prepared for: First Bay Properties Inc. 311 Richmond Road, Suite 203 Ottawa, ON K1Z 6X3 August 8, 2017 117-663 Brief_1.doc
Transportation Impact Study for Abington Terrace
 Transportation Impact Study for Abington Terrace Abington Township, Montgomery County, PA Sandy A. Koza, P.E., PTOE PA PE License Number PE059911 Prepared by McMahon Associates, Inc. 425 Commerce Drive,
APARTMENT BUILDING DEVELOPMENT 1161 HERON ROAD OTTAWA, ONTARIO TRANSPORTATION IMPACT STUDY. Prepared for:
 APARTMENT BUILDING DEVELOPMENT 1161 HERON ROAD OTTAWA, ONTARIO TRANSPORTATION IMPACT STUDY Prepared for: 1649362 Ontario Inc. c/o Manor Park Management 231 Brittany Drive, Suite D Ottawa ON K1K 0R8 July
Technical Memorandum TRAFFIC IMPACT STUDY. RIDLEY ROAD CONVENIENCE STORE Southampton County, VA. Prepared for: Mr. David Williams.
 Technical Memorandum TRFFIC IMPCT STUDY RIDLEY ROD CONVENIENCE STORE Southampton County, V Prepared for: Mr. David Williams By: Charles Smith, P.E., PTOE EPR Charlottesville, V July 2014 1 TBLE OF CONTENTS
Traffic Impact Study. Roderick Place Columbia Pike Thompson s Station, TN. Transportation Group, LLC Traffic Engineering and Planning
 F i s c h b a c h Transportation Group, LLC Traffic Engineering and Planning Traffic Impact Study Roderick Place Columbia Pike Thompson s Station, TN Prepared March 2016 Ms. Gillian L. Fischbach, P.E.,
DUNBOW ROAD FUNCTIONAL PLANNING
 DUNBOW ROAD FUNCTIONAL PLANNING Final Report August 3, 216 #31, 316 5th Avenue NE Calgary, AB T2A 6K4 Phone: 43.273.91 Fax: 43.273.344 wattconsultinggroup.com Dunbow Road Functional Planning Final Report
joint access drive. will be
 Date: To: From: Subject: June 22, 2015 Bradley Reiner, PE Bowman Consulting David R. Kline, PE, PTOE, Incline Associates Thornton Self-Storage Traffic Analysis (DRAFT) - Thornton, Colorado INTRODUCTION
ORLEANS GARDENS SHOPPING CENTRE 1615 ORLEANS BOULEVARD CITY OF OTTAWA, ONTARIO TRANSPORTATION IMPACT STUDY. Prepared for:
 ORLEANS GARDENS SHOPPING CENTRE 1615 ORLEANS BOULEVARD CITY OF OTTAWA, ONTARIO TRANSPORTATION IMPACT STUDY Prepared for: Orleans Gardens Shopping Centre Inc. 2851 John Street, Suite 1 Markham, ON K3R 5R7
6060 North Central Expressway Mixed-Use Site Dallas, Texas
 Volume 1 Traffic Impact Analysis 6060 North Central Expressway Mixed-Use Site Dallas, Texas April 30, 2018 Kimley-Horn and Associates, Inc. Dallas, Texas Project #063238300 Registered Firm F-928 Traffic
Draft Report. Traffic Impact Study. Superstore, Wal-Mart, and Kent Development. Yarmouth, Nova Scotia. Prepared for
 oad & Traffic Management Road & Traffic Management R Atlantic Traffic Engineering Specialists Draft Report Traffic Impact Study Superstore, Wal-Mart, and Kent Development Yarmouth, Nova Scotia Prepared
EXECUTIVE SUMMARY. Page 1 of 6
 EXECUTIVE SUMMARY The purpose of this report is to identify conformance with the original traffic impact study for the proposed retail development on Lot 5 of Riverdale Retail Filing No. 1 located on the
The proposed development is located within 800m of an existing Transit Station where infill developments and intensification are encouraged.
 Stantec Consulting Ltd. 1331 Clyde Avenue, Suite 4 Ottawa ON K2C 3G4 Tel: (613) 722-442 Fax: (613) 722-2799 May 14, 213 File: 1638823 Robinson Park Development Corp. 5699 Power Road Ottawa, ON, K1G 3N4
List of Exhibits...ii
 One Brickell Traffic Study TABLE OF CONTENTS List of Exhibits...ii EXECUTIVE SUMMARY...1 1. INTRODUCTION...2 1.1 Study Area...2 1.2 Study Objective...5 2. EXISTING TRAFFIC CONDITIONS...6 2.1 Data Collection...6
ALLEY 24 TRAFFIC STUDY
 ALLEY 24 TRAFFIC STUDY in City of Frostburg, Maryland January 2013 3566 Teays Valley Road Hurricane, WV Office: (304) 397-5508 www.denniscorporation.com Alley 24 Traffic Study January 2013 Frostburg, Maryland
Design Traffic Technical Memorandum
 State Road 7 Extension PD&E Study Design Traffic Technical Memorandum Palm Beach County, FL October 2010 State Road 7 Extension PD&E Study Design Traffic Technical Memorandum Palm Beach County, FL Prepared
Shockoe Bottom Preliminary Traffic and Parking Analysis
 Shockoe Bottom Preliminary Traffic and Parking Analysis Richmond, Virginia August 14, 2013 Prepared For City of Richmond Department of Public Works Prepared By 1001 Boulders Pkwy Suite 300, Richmond, VA
FRONT RANGE CROSSINGS TRAFFIC IMPACT STUDY
 FRONT RANGE CROSSINGS TRAFFIC IMPACT STUDY Prepared for: City of Thornton And Colorado Department of Transportation Prepared by: 11 Blake Street, Suite 2 Denver, Colorado 822 Contact: Brian Bern, PE, PTOE
Grant Avenue Streetscape
 REPORT TYPE GOES HERE Grant Avenue Streetscape PREPARED FOR City of Manassas 9027 Center Street Manassas, VA 20110 PREPARED BY 8300 Boone Boulevard Suite 700 Vienna, Virginia 22182 571.389.8121 July 31,
TRANSPORTATION IMPACT STUDY
 Dundas MEP Developments Inc. City of Toronto 219 and 231 Dundas Street East, Proposed Mixed-Use Development TRANSPORTATION IMPACT STUDY 9782/2 April 216 LEA Consulting Ltd. Consulting Engineers & Planners
STILLWATER AVENUE CORRIDOR STUDY Old Town, Maine
 Draft Study STILLWATER AVENUE CORRIDOR STUDY Old Town, Maine SUBMITTED TO: BANGOR AREA COMPREHENSIVE TRANSPORTATION SYSTEM SUBMITTED BY: I MAY 23, 2017 DRAFT STILLWATER AVENUE STUDY FINAL REPORT Table
Donahue Drive Corridor Traffic Operational Evaluation
 Donahue Drive Corridor Traffic Operational Evaluation PREPARED FOR: THE CITY OF AUBURN PREPARED BY: JANUARY 2007 Donahue Drive Corridor Study--Auburn, Alabama TABLE OF CONTENTS Introduction... 1 Background
MEMORANDUM. Our project study area included the following locations:
 MEMORANDUM Date: To: From: Subject: Najib O. Habesch Nick M. Fomenko, PE, PTOE Bushnell Park North Traffic Assessment BETA Project #: 4461 As part of our contract to undertake the design of the Bushnell
TRAFFIC STUDY GUIDELINES Clarksville Street Department
 TRAFFIC STUDY GUIDELINES Clarksville Street Department 9/1/2009 Introduction Traffic studies are used to help the city determine potential impacts to the operation of the surrounding roadway network. Two
Ownership Lots 17 & 18 (Part of Lot 14), Montgomery Auto Sales Park
, Montgomery Auto Sales Park") Traffic Impact Analysis Ownership Lots 17 & 18 (Part of Lot 14), Montgomery Auto Sales Park Silver Spring, MD Lot 17: Site Plan No. 821413 Lot 18: Site Plan No. 821414 Filing Number: 13-TS-1198527A Prepared
Traffic Impact Analysis Ownership Lots 17 & 18 (Part of Lot 14), Montgomery Auto Sales Park Silver Spring, MD Lot 17: Site Plan No. 821413 Lot 18: Site Plan No. 821414 Filing Number: 13-TS-1198527A Prepared
Queensgate Drive Corridor Traffic Study
 January 2015 Prepared for: City of Richland Prepared by: J-U-B ENGINEERS, Inc. 2810 W. Clearwater Avenue, Suite 201 Kennewick, Washington 99336 Table of Contents Introduction and Background... 1 Existing
FINAL DESIGN TRAFFIC TECHNICAL MEMORANDUM
 FINAL DESIGN TRAFFIC TECHNICAL MEMORANDUM July 2014 FINAL (SR 43) Project Development and Environment Study From State Road 60 (Adamo Drive) to I-4 (SR 400) Hillsborough County, Florida Work Program Item
Subject: Solberg Avenue / I-229 Grade Separation: Traffic Analysis
 MEMORANDUM Transportation Bill Troe, AICP Jason Carbee, AICP 12120 Shamrock Plaza Suite 300 Omaha, NE 68154 (402) 334-8181 (402) 334-1984 (Fax) To: Project File Date: Subject: Solberg Avenue / I-229 Grade
Figure 1: Vicinity Map of the Study Area
 ARIZONA TEXAS NEW MEXICO OKLAHOMA May 5, 2016 Mr. Anthony Beach, P.E. BSP Engineers 4800 Lakewood Drive, Suite 4 Waco, Texas 76710 Re: Intersection and Access Analysis along Business 190 in Copperas Cove
MEMORANDUM. Matt Folden, AICP, MNCPPC Rebecca Torma, MCDOT. Nancy Randall, AICP, PTP Barbara Mosier, P.E., PTOE Kevin Berger
 To: From: Matt Folden, AICP, MNCPPC Rebecca Torma, MCDOT Nancy Randall, AICP, PTP Barbara Mosier, P.E., PTOE Kevin Berger 1110 Bonifant Street Suite 210, Silver Spring, MD 20910 301-448-1333 WellsandAssociates.com
TABLE TRAFFIC ANALYSIS SCENARIOS
 4.11 TRANSPORTATION The potential traffic impacts of the proposed project are evaluated in the Buena Park Beach/Orangethorpe Mixed Use Project Traffic Analysis (Traffic Analysis) by Austin-Foust Associates
Corporation of the Town of Oakville. December 16, 2013
 Corporation of the Town of Oakville Transportation Impact Analysis and Parking Study for Proposed Secondary School, Oakville Draft Final Report Submitted by: HDR Corporation 100 York Boulevard, Suite 300
NEW YORK CENTRAL PARK SUBDIVISION BLAIS STREET/ST-PIERRE STREET EMBRUN, ONTARIO TRAFFIC IMPACT STUDY. Prepared for:
 NEW YORK CENTRAL PARK SUBDIVISION BLAIS STREET/ST-PIERRE STREET EMBRUN, ONTARIO TRAFFIC IMPACT STUDY Prepared for: Solidex Holdings Limited & Investissement Maurice Lemieux Investments Attn: Mr. Anthony
Gateway Transportation Study
 Gateway Transportation Study Amherst, Massachusetts SUBMITTED TO University of Massachusetts Amherst Town of Amherst SUBMITTED BY Vanasse Hangen Brustlin, Inc. Watertown, Massachusetts March 213 Back of
PRELIMINARY DRAFT WADDLE ROAD / I-99 INTERCHANGE PROJECT ALTERNATIVE ANALYSIS FINAL TRAFFIC SUMMARY REPORT
 PRELIMINARY DRAFT WADDLE ROAD / I-99 INTERCHANGE PROJECT ALTERNATIVE ANALYSIS FINAL TRAFFIC SUMMARY REPORT Prepared by: In Association with: November 2013 EXECUTIVE SUMMARY Patton Township, in partnership
Intersection LOS Intersection level of service (LOS) is defined by the Highway Capacity Manual (HCM) by the following criteria:
 is defined by the Highway Capacity Manual (HCM) by the following criteria:") Page 2 of 9 Intersection LOS Intersection level of service (LOS) is defined by the Highway Capacity Manual (HCM) by the following criteria: Table 1 LOS Definitions Level of Signalized Un-Signalized Definition
Page 2 of 9 Intersection LOS Intersection level of service (LOS) is defined by the Highway Capacity Manual (HCM) by the following criteria: Table 1 LOS Definitions Level of Signalized Un-Signalized Definition
13th High School GOROVE / SLADE. Traffic Impact Study. Prince William County, Virginia. April 17, Transportation Planners and Engineers
 Traffic Impact Study 13th High School Prince William County, Virginia + o t KEVIN D. SITZMAN' * ^ Lie. No. 036524. 4/17/2017 Xv April 17, 2017 Prepared for: Prince William County Public Schools 14715 Bristow
Capital Region Council of Governments
 March 23, 2018 Capital Region Council of Governments PROJECT CONCEPT REPORT Realignment of Swamp and Northfield Road s approaches to Route 44 (Boston Turnpike) Town of Coventry SUMMARY: The Town of Coventry
Bridge Street Corridor Study Report
 Bridge Street Corridor Study Report Prepared for: Prepared by: BRIDGE STREET CORRIDOR STUDY REPORT PREPARED FOR: CITY OF ARROYO GRANDE COMMUNITY DEVELOPMENT DEPARTMENT 300 EAST BRANCH STREET ARROYO GRANDE,
Henderson Avenue Mixed-Use Development
 Zoning Case: Z145-3 Traffic Impact Analysis Henderson Avenue Mixed-Use Development Dallas, TX October 26 th, 216 Kimley-Horn and Associates, Inc. Dallas, Texas Project #644827 Registered Firm F-928 Traffic
INTERSECTION OPERATIONAL ANALYSIS AND NECESSARY RECOMMENDATIONS CIVL 440 Project
 INTERSECTION OPERATIONAL ANALYSIS AND NECESSARY RECOMMENDATIONS CIVL 44 Project INTERSECTION: 16TH AVENUE & EAST MALL FOR AM PEAK HOUR Group Work: Syed Shafaat Ali Shah (2347426) Mohammad Moudud Hasan
FAIRFIELD - RYAN S CORNER TRAFFIC IMPACT ANALYSIS LOUDOUN COUNTY, VIRGINIA
 FAIRFIELD - RYAN S CORNER TRAFFIC IMPACT ANALYSIS LOUDOUN COUNTY, VIRGINIA Submitted on behalf of: Fairfield Residential Prepared by: Wells + Associates, Inc. 1420 Spring Hill Road, Suite 00 McLean, Virginia
7.0 FREEWAYS CONGESTION HOT SPOT PROBLEM & IMPROVEMENT PROJECT ANALYSIS & DEFINITION
 7.0 FREEWAYS CONGESTION HOT SPOT PROBLEM & IMPROVEMENT PROJECT ANALYSIS & DEFINITION 7.1 INTRODUCTION & METHODOLOGY FEASIBILITY REPORT Congestion hot spot problem locations have been assessed using the
Highway 111 Corridor Study
 Highway 111 Corridor Study June, 2009 LINCOLN CO. HWY 111 CORRIDOR STUDY Draft Study Tea, South Dakota Prepared for City of Tea Sioux Falls Metropolitan Planning Organization Prepared by HDR Engineering,
TRANSPORTATION IMPACT STUDY PROPOSED RIVERFRONT 47 MIXED USE DEVELOPMENT
 November 2016 TRANSPORTATION IMPACT STUDY PROPOSED RIVERFRONT 47 MIXED USE DEVELOPMENT & Aspinwall Borough, Sharpsburg Borough & O Hara Township, Allegheny County, Pennsylvania Prepared for: Riverfront
Bistro 6. City of Barrie. Traffic Impact Study for Pratt Hansen Group Inc. Type of Document: Final Report. Project Number: JDE 1748
 City of Barrie Traffic Impact Study for Pratt Hansen Group Inc. Type of Document: Final Report Project Number: JDE 1748 Date Submitted: June 12 th, 2017 06/12/17 John Northcote, P.Eng. Professional License
Meadowlake Ranch Traffic Impact Analysis (LSC #184600) August 27, 2018
 August 27, 2018") LSC TRANSPORTATION CONSULTANTS, INC. 545 East Pikes Peak Avenue, Suite 210 Colorado Springs, CO 80903 (719) 633-2868 FAX (719) 633-5430 E-mail: lsc@lsctrans.com Website: http://www.lsctrans.com Traffic
LSC TRANSPORTATION CONSULTANTS, INC. 545 East Pikes Peak Avenue, Suite 210 Colorado Springs, CO 80903 (719) 633-2868 FAX (719) 633-5430 E-mail: lsc@lsctrans.com Website: http://www.lsctrans.com Traffic
Volume 1 Traffic Impact Analysis. Texas Odyssey TIA Dallas, Texas. Kimley-Horn and Associates, Inc. Dallas, Texas. May 23, 2018
 Volume 1 Traffic Impact Analysis Texas Odyssey TIA Dallas, Texas May 23, 2018 Kimley-Horn and Associates, Inc. Dallas, Texas Project #064529800 Registered Firm F-928 Traffic Impact Analysis Texas Odyssey
TRAFFIC IMPACT STUDY CRITERIA
 Chapter 6 - TRAFFIC IMPACT STUDY CRITERIA 6.1 GENERAL PROVISIONS 6.1.1. Purpose: The purpose of this document is to outline a standard format for preparing a traffic impact study in the City of Steamboat
3.2.2 Proposed Road Network within Phase 1B Lands
 3.2.2 Proposed Road Network within Phase 1B Lands Figure 3.1 also shows the proposed road network within the Premier Gateway Phase 1B Employment Area lands, which features two collector roads providing
TRANSPORTATION ANALYSIS REPORT US Route 6 Huron, Erie County, Ohio
 TRANSPORTATION ANALYSIS REPORT US Route 6 Huron, Erie County, Ohio December 12, 2012 Prepared for: The City of Huron 417 Main Huron, OH 44839 Providing Practical Experience Technical Excellence and Client
DRAFT Davidson Elementary School Expansion Transportation Impact Analysis
 DRAFT Davidson Elementary School Expansion Transportation Impact Analysis Prepared for: Town of Davidson 216 S. Main Street Davidson, NC 28036 Prepared by: Stantec Consulting Services Inc. 2127 Ayrsley
TRAFFIC IMPACT STUDY
 675 Millcreek Drive, Unit 1 Mississauga, Ontario L5N 5M4 T: 416.213.7121 F: 95.89.8499 www.transtech.co TRAFFIC IMPACT STUDY PROPOSED MOSQUE DEVELOPMENT 4269 REGIONAL ROAD 25 TOWN OF OAKVILLE PREPARED
Traffic Impact Study. Crestline Piggly Wiggly Mountain Brook, Alabama. Goodwyn, Mills and Cawood, Inc. Birmingham, Alabama.
 Traffic Impact Study Crestline Piggly Wiggly Mountain Brook, Alabama Prepared for: Goodwyn, Mills and Cawood, Inc. Birmingham, Alabama September 214 Revision 1 October 214 Crestline Piggly Wiggly Mountain
VIVA RETIREMENT COMMUNITIES OAKVILLE TRAFFIC IMPACT STUDY
 VIVA RETIREMENT COMMUNITIES OAKVILLE TRAFFIC IMPACT STUDY VIVA RETIREMENT COMMUNITIES OAKVILLE TRAFFIC IMPACT STUDY DECEMBER 2012 READ, VOORHEES & ASSOCIATES TORONTO, ONTARIO Read, Voorhees & Associates
2. Existing Conditions
 2. Existing Conditions The existing traffic and parking conditions on the site and the surrounding area were reviewed based on the study methodology in Section 1.2. 2.1 Existing Land Use The portion of
Los Coyotes Country Club Development Plan Traffic Impact Analysis
 Los Coyotes Country Club Development Plan Traffic Impact Analysis Prepared For: Phil Martin Associates 2073007450 Los Coyotes Country Club Development Plan Traffic Impact Analysis June 19, 2014 Prepared
Chapter 4 Traffic Analysis
 Chapter 4 Traffic Analysis PURPOSE The traffic analysis component of the K-68 Corridor Management Plan incorporates information on the existing transportation network, such as traffic volumes and intersection
ENKA INTERMEDIATE SCHOOL
 TRANSPORTATION IMPACT ANALYSIS Prepared for Buncombe County Schools ENKA INTERMEDIATE SCHOOL Asheville, NC Project Number: 13-71 8/1/13 www.davenportworld.com DAVENlORT Transportation Impact Analysis Enka
James M. Moore, Director of Planning & Building Services, Town of Fairfax. Victory Village Senior Housing Development Traffic Study
 Traffic Study To: From: James M. Moore, Director of Planning & Building Services, Town of Fairfax David Parisi, PE, TE, Parisi Transportation Consulting Date: October 14, 216 Subject: Victory Village Senior
FORM A PASCO COUNTY ACCESS CONNECTION PERMIT APPLICATION
 FORM 901.3.A PASCO COUNTY ACCESS CONNECTION PERMIT APPLICATION The following information is required from all applicants directly or indirectly accessing any collector or arterial road or as otherwise
AMEC Earth and Environmental. Bovaird Drive Environmental Assessment. Traffic Study Final Report. August Excellence in Transportation Planning
 AMEC Earth and Environmental Bovaird Drive Environmental Assessment Traffic Study Final Report August Excellence in Transportation Planning AMEC Earth and Environmental Bovaird Drive Class EA Traffic
9 Leeming Drive Redevelopment Ottawa, ON Transportation Brief. Prepared By: Stantec Consulting Ltd.
 9 Leeming Drive Redevelopment Ottawa, ON Transportation Brief Prepared By: Stantec Consulting Ltd. TIA GUIDELINES CHECKLIST Report Context Municipal Address Comment: Section 1.1 Location relative to major
Date: September 7, Project #: Re: Spaulding Youth Center Northfield, NH Property. Traffic Impact Study
 To: Ms. Susan C. Ryan Spaulding Youth Center 72 Spaulding Road Northfield, NH 03276 Date: September 7, 2017 Project #: 52455.00 From: Robin Bousa Director of Transportation Systems Re: Spaulding Youth
Intersection Control Evaluation
 Intersection Control Evaluation Lor Ray Drive at Howard Drive in North Mankato, Nicollet County, Minnesota Mankato/North Mankato Area Planning Organization October 2016 SRF No. 016 09243 Table of Contents
CITY OF WEST LAKE HILLS. Forest View Neighborhood Traffic Calming Study
 CITY OF WEST LAKE HILLS 901 South Mopac Expressway Building V, Suite 220 Austin, Texas 78746 Texas P.E. Firm Registration No. F-929 Klotz Associates Final Report Submittal: March 20, 2015 Revised Final
TRAFFIC ASSESSMENT River Edge Colorado
 TRAFFIC ASSESSMENT River Edge Colorado Submitted by: Fehr & Peers 621 17th Street, Ste. 231 Denver, CO 8293 (33) 296-43 December, 21 App. M-2 Traffic Assessment River Edge Colorado December 21 TABLE OF