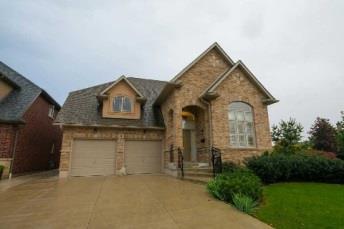
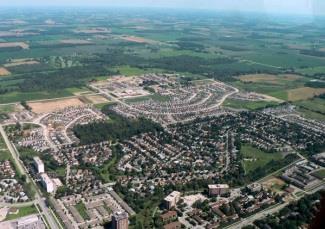
Stoney Creek Neighbourhood Profile
|
|
|
- Shanon Barber
- 5 years ago
- Views:
Transcription


1 Stoney Creek Profile For further information contact: John-Paul Sousa Planning Research Analyst Direct: (519) ext I jpsousa@london.ca Page 1
2 Page 2
3 Population Characteristics & Age Distribution Stoney Creek Total Population ,750 4,050 7,310 9,680 32% Female 1,950 2,130 3,760 5,020 34% Male 1,800 1,920 3,550 4,665 31% Age Structure ,840 2,615 42% 27% 0 to % 8% 5 to % 6% 10 to % 6% 15 to % 7% ,775 1,770 3,430 3,975 16% 41% ,500 2,260 51% 23% % 9% Median Age N.A. N.A. N.A Page 3
4 2011 Census Male Female Total Age Cohort Breakout 0 to % 5 to % 10 to % 15 to % 20 to % 25 to % 30 to % 35 to % 40 to % 45 to % 50 to % 55 to % 60 to % 65 to % 70 to % 75 to % 80 to % % Total 4,650 5,020 9,670 1,500 1, to 4 5 to 9 10 to to to to to to to to to to to to to to to Page 4
5 Marital Status Single 1,190 1,300 2,020 2,080 3% 21% Married 1,400 1,570 3,165 4,165 32% 43% Common-Law % 6% Divorced % 4% Separated % 3% Widowed % 3% Citizenship, Immigration & Ethnic Identity Citizenship Canadian Citizens 3,55 3,685 6,875 9,155 33% 95% Non-Canadian Citizens Immigration Status Canadian Born Population Foreign Born Population Visible Minority Population Aboriginal Identity Population % 6% 3,140 4,050 5,725 7,180 25% 74% ,520 2,460 62% 25% ,065 2, % 25% % 2% Page 5
6 Family Composition Number of Census Families 1,005 1,145 2,165 2,770 28% Family Size - 2 Persons ,020 1,215 19% 44% Family Size - 3 Persons % 24% Family Size - 4 Persons % 23% Family Size - 5 Persons Census Family - Average Size % 8% Family Composition Family Size 5 Persons, 8% Family Size 4 Persons, 23% Family Size 2 Persons, 44% Family Size 3 Persons, 24% Page 6
7 Family Structure & Number of Children Married Couples ,565 2,040 30% Without Children % With Children , % Common-Law % Without Children % With Children % Lone Parent Families % Female Headed % 1 Child % 2 Children % 3 Children Male Headed (-26%) 1 Child (-36%) 2 Children % 3 Children (-33%) Page 7
8 Educational Attainment by Credential No Certificate, Diploma or Degree High School Diploma or Equivalent Apprenticeship, or Trade Certificate College Certificate or Diploma University Certificate or Diploma University -Bachelor's Degree University Degree above bachelor level (M.A. or PhD) N.A. N.A (-4%) 5% N.A. N.A. 1,555 2,165 39% 11% % 2% N.A ,260 1,960 56% 10% N.A. N.A % 2% N.A. N.A. 1,055 1,090 3% 6% N.A. N.A , % 6% Educational Attainment by Highest Credential University Degree above Bachelors, 6% University -Bachelor's Degree, 6% University Certificate or Diploma, 2% College Certificate or Diploma, 10% No Certificate, Diploma or Degree, 5% High School Diploma, 11% Apprenticeship/Trade, 2% Page 8
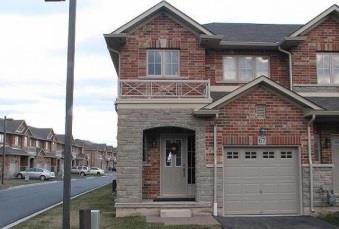
9 Housing by Structure Type & Tenure Total Occupied Dwellings ,605 1,815 3,005 3,815 27% Single-Detached ,645 2,140 30% 56% Semi-Detached % <1% Row House % 13% Duplex % <1% Apartment < 5 Storeys (-55%) 3% Apartment 5 Storeys ,000 1,015 2% 27% Number of Owned Dwellings ,875 2,665 42% Owned as a % of Total 40% 41% 62% 70% Number of Rented Dwellings Rented as a % of Total 965 1,075 1,135 1,165 3% 60% 59% 38% 30% Average # of Rooms Average # of Bedrooms N.A. Average Gross Rent $ $ $ $ % Average Value of Dwelling $166, $164, $223, $281, % Page 9
10 Labour Market Indicators Total Labour Force 15 years ,160 2,375 4,430 5,785 31% Female 1,040 1,160 2,255 2,970 32% 51% Male 1,120 1,215 2,175 2,820 30% 49% Unemployment Rate 11% 5% 6% 6.90% Female 8.00% 6.00% 7.00% 7.40% Male 13.00% 5.00% 6.00% 6.40% Employment Rate N.A. N.A. N.A % Participation Rate 70% 70% 74% 73.9% Female 64% 65% 73% 72.40% Male 77% 76% 76% 75.70% Labour Force by Sector Primary (Agriculture & Resources) Secondary (Construction & Manufacturing % 1% ,005 36% 18% Tertiary Services 1,505 1,945 4,265 4,600 8% 81% Page 10
11 Income Characteristics of Economically Active Population Individual Income Average Income $25, $29, $35, $41, % Median Income $20, $24, $30, $35, % Income by Gender Average Income Male $29, $34, $42, $48, % Average Income - Female $20, $24, $28, $35, % Median Income Male $24, $29, $38, $41, % Median Income - Female Household Income Average Household Income Median Household Income Family Income $15, $19, $24, $32, % $44, $51, $66, $79, % $36, $42, $60, $72, % Average Family Income $50, $64, $76, $93, % Median Family Income $55, $59, $75, $88, % Lone-Parent Families Average Family Income N.A. N.A. N.A. $48, Median Family Income N.A. N.A. N.A. $41, Data Note: Income figures based on previous reporting year and reflects pre-tax income (1995, 2000, 2005 & 2010). Page 11
12 Cnd Dollars, Adjusted for Inflation (2011) $45, Income & Employment Trends, % $40, $35, % $30, % $25, % $20, $15, % $10, % $5, $ Average Individual Income Median Individual Income Unemployment Rate 0.00% Page 12
13 Labour Force by National Occupational Classification Labour Force Management % 11% Business, Finance and Administration (-2%) 16% Natural and Applied Science Fields (-10%) 5% Health Care % Education, Government, Social & Community Services Art, Culture, recreation and Sport Sales and Service Sector Trades, Transport and Equipment Operators Natural Resources and Agriculture Manufacturing and Utilities % 16% % 2% ,000 1,340 34% 24% % 12% % 1% % 6% Page 13
14 Employment Trends by Occupational Breakout, Manufacturing & Utilities, 71% Natural Resources and Agriculture, 70% Sales and Service Sector, 34% Trades, Transport and Equipment Operators, 78% Art, Culture, recreation and Sport, 73% Natural & Applied Science Fields, -10% Health Care, 0% Education, Government, Social & Community Services, 63% Business, Finance and Administration, -2% Management, 42% -20% -10% 0% 10% 20% 30% 40% 50% 60% 70% 80% 90% Page 14
15 Class of Worker As a % Employee 1,945 2,160 4,045 5,360 33% 94% Female 985 1,070 2,095 2,795 Male 960 1,090 1,950 2,565 Self-Employed % Female Male Employment Status Worked Full-Time in 2010 Worked Part-Time in 2010 Active Labour Force N.A. N.A. N.A. 4,450 N.A. 81% N.A. N.A. N.A. 1,055 N.A. 19% Employment Status, 2010 Reference Period Worked Part-Time, 19% Worked Full-Time, 81% Page 15
16 Mode of Transport to Work Automobile -As a Driver 1,530 1,605 3,165 4,130 30% 83% Car-Pool (-9%) 6% Public Transportation % 8% Walked or Bicycled % 4% Other Modes <1% Median Commuting Duration N.A. N.A. N.A. 20 min. Place of Work Worked at Home % 7% Worked at a Fixed Address No Fixed Workplace Address Worked within Municipality Work in a different Municipality 1,715 1,865 3,640 4,520 24% 84% % 9% 1,535 1,660 3,215 N.A N.A. Worked outside Canada <1% Page 16
17 Mobility/Migration Status Lived at the same address 5 years ago Moved sometime with the last 5 years ,645 1,650 1,960 3,830 43% 1,865 2,205 4,800 5,110 (6%) 57% Internal Migrants ,780 1,500 (-16%) 73% - Intra-provincial ,195 1,280 - Inter-provincial External Migrants (22%) 27% Lived at the same address 1 years ago Moved sometime with the last year 2,835 3,065 5,410 7,760 43% 82% ,750 1,755 <1% 18% Internal Migrants (-3%) 86% - Intra-provincial (-22%) - Inter-provincial % External Migrants (-33%) 14% Page 17
18 Place of Birth Total Immigrant Population N.A. N.A. 1,520 2,455 62% 25% Place of Birth by Continent North America (US only) N.A. N.A % 1% Africa N.A. N.A % 2% Asia N.A. N.A ,020 63% 11% Caribbean N.A. N.A % 1% Central and South America N.A. N.A % 2% Europe N.A. N.A % 9% Recent Immigration by Continent, Recent Immigrants N.A. N.A % 4% North America (US only) N.A. N.A % Africa N.A. N.A % 1% Asia N.A. N.A (-24%) 2% Caribbean N.A. N.A (-100%) 0% Central and South America N.A. N.A (-56%) <1% Europe N.A. N.A % <1% Page 18
19 Immigration by Place of Birth India N.A. N.A % 2% 2. China N.A. N.A % 2% 3. Poland 4. South Korea N.A. N.A. N.A. N.A. 80 N.A % 2% 2% 5. Colombia N.A. N.A % 1% 6. United Kingdom N.A. N.A (-35%) 1% 7. Portugal N.A. N.A. N.A % 8. Viet Nam N.A. N.A. N.A. 90 <1% 9. Bosnia & Herzegovina N.A. N.A. N.A Philippines N.A. N.A. N.A. 70 <1% <1% Page 19
20 Period of Immigration Before 1971 N.A. N.A % 3% 1971 to 1980 N.A. N.A % 2% 1981 to 1990 N.A. N.A % 5% 1991 to 2000 N.A. N.A % 6% 2001 to 2011 N.A. N.A ,100% 9% Foreign Born Population by Period of Immigration 2001 to to to to 1980 Before Page 20
21 Language Knowledge of Official Languages English Only 3,450 3,610 6,700 8,835 32% 91% French Only % English and French % 7% Neither English or French % 2% Language Spoken Most Often at Home English 3,420 3,295 6,250 7,740 24% 80% French % <1% Non-Official Language ,435 54% 15% Mother Tongue * English 3,205 3,080 5,610 6,765 21% 70% French % 1% Non-Official Language ,570 2,595 65% 27% * Statistics Canada defines 'mother tongue' as the first language learned in childhood and still understood by the individual at the time of census reporting. Page 21
22 Non-Official Languages Spoken Top 10 Reported 1. Spanish N.A % 4% 2. Chinese* N.A. N.A % 4% 3. Korean N.A % 2% 4. Polish N.A. N.A % 2% 5. Vietnamese N.A. N.A. N.A % 2% 6. Panjabi (Punjabi) N.A. N.A. N.A % 2% 7. Portuguese N.A. N.A % 2% 8. Arabic N.A. N.A % 1% 9. Italian N.A. N.A % 1% 10. Hindi N.A. N.A (-16%) 1% * Refers to Cantonese and Mandarin language speakers as well as others who do not specify otherwise. Page 22
23 Buddhist Christian Hindu Religious Identification Anglican Baptist Catholic Orthodox Lutheran Pentecostal Presbyterian United Church Other Christian Jewish Muslim Sikh Aboriginal Spirituality N.A. N.A. N.A % N.A. N.A. N.A. 5,945 61% N.A. N.A. N.A % N.A. N.A. N.A % N.A. N.A. N.A. 3,275 34% N.A. N.A. N.A % N.A. N.A. N.A % N.A. N.A. N.A % N.A. N.A. N.A % N.A. N.A. N.A % N.A. N.A. N.A % N.A. N.A. N.A % N.A. N.A. N.A. 65 1% N.A. N.A. N.A % N.A. N.A. N.A % N.A. N.A. N.A. 0 0% Page 23
24 Notes: (1) Source Data Statistics Canada Census Data, Customized Profiles. Ottawa, Canada (2) Data also derived from Statistics Canada s National Household Survey (NHS) (3) Customized Community and Profiles tabulated and compiled by the City of London s Planning Division Policy Planning and Research Section. Page 24
Jackson Neighbourhood Profile
 Jackson Profile For further information contact: John-Paul Sousa Planning Research Analyst Direct: (519) 661-2500 ext. 5989 I email: jpsousa@london.ca Page 1 Page 2 Population Characteristics & Age Distribution
Central London Neighbourhood Profile
 Central London Neighbourhood Profile For further information contact: John-Paul Sousa Planning Research Analyst Direct: (519) 661-2500 ext. 5989 I email: jpsousa@london.ca Page 1 Page 2 Population Characteristics
Westminster Neighbourhood Profile
 Westminster Profile For further information contact: John-Paul Sousa Planning Research Analyst Direct: (519) 661-2500 ext. 5989 I email: jpsousa@london.ca Page 1 Page 2 Population Characteristics & Age
East London Neighbourhood Profile
 East London Neighbourhood Profile For further information contact: John-Paul Sousa Planning Research Analyst Direct: (519) 661-2500 ext. 5989 I email: jpsousa@london.ca Page 1 Page 2 Population Characteristics
Huron Heights Neighbourhood Profile
 Huron Heights Neighbourhood Profile For further information contact: John-Paul Sousa Planning Research Analyst Direct: (519) 661-2500 ext. 5989 I email: jpsousa@london.ca Page 1 Page 2 Population Characteristics
Southcrest Neighbourhood Profile
 Southcrest Neighbourhood Profile For further information contact: John-Paul Sousa Planning Research Analyst Direct: (519) 661-2500 ext. 5989 I email: jpsousa@london.ca Page 1 Page 2 Population Characteristics
Fox Hollow Neighbourhood Profile
 Fox Hollow Profile For further information contact: John-Paul Sousa Planning Research Analyst Direct: (519) 661-2500 ext. 5989 I email: jpsousa@london.ca Page 1 Page 2 Population Characteristics & Age
Hamilton Road Neighbourhood Profile
 Hamilton Road Neighbourhood Profile For further information contact: John-Paul Sousa Planning Research Analyst Direct: (519) 661-2500 ext. 5989 I email: jpsousa@london.ca Page 1 Page 2 Population Characteristics
University Of Maryland
 2000 Census Census Data 200 Census Change 2000 to 200 SUBJECT Number Percent SUBJECT Number Percent Number Percent TOTAL POPULATION 437 TOTAL POPULATION 246-9 -43.7 White 283 64.8 White 65 67. -8-4.7 Black
Community Social Profile Wellesley, Wilmot and Woolwich
 Community Trends for 2013 in Cambridge, North Dumfries, Wellesley, Wilmot and Woolwich Community Social Profile - Wellesley, Wilmot and Woolwich Published December 2014 Community Social Profile Wellesley,
2011 Census Profile for Loxley CP with Stratford included as a comparison geography
 Demography Number Percentage Rank () Number Percentage Rank (5) Demography Number Percentage Rank () Number Percentage Rank (5) Total Population 399 N/A 120,485 3 Males 198 49.6% N/A 58,497 48.6% 5 Females
Vancouver Demographic Report Victoria-Fraserview
 January 2019 Vancouver Demographic Report Victoria-Fraserview The Vancouver Early Years Partnership (VEYP) and the Human Early Partnership (HELP) collaborated on a research project to produce detailed
Five Ways the 2016 Census Affects Marketers
 Five Ways the 2016 Census Affects Marketers February 15, 2018 Dr. Doug Norris Senior Vice President and Chief Demographer Rupen Seoni Senior Vice President and Practice Leader Today s presenters Dr. Doug
Vancouver Demographic Report Shaughnessy/Arbutus-Ridge
 Vancouver Demographic Report Shaughnessy/Arbutus-Ridge January 2019 The Vancouver Early Years Partnership (VEYP) and the Human Early Partnership (HELP) collaborated on a research project to produce detailed
nipigon.net Township of Nipigon 2018 Community Profile
 nipigon.net Township of Nipigon V 1.0 February 2018 2018 Nipigon nipigon.net nipigon.net Township of Nipigon nipigon.net Township of Nipigon nipigon.net Township of Nipigon nipigon.net Township of Nipigon
REPORT OF THE ENGINEERING & PLANNING DEPARTMENT PLANNING DIVISION
 REPORT OF THE ENGINEERING & PLANNING DEPARTMENT PLANNING DIVISION 2008 09 22 TO: Mayor John Rowswell and Members of City Council SUBJECT: Official Plan Review 2008 Part 1 - Population and Household Projections
Oakmont: Who are we?
 Oakmont: Who are we? A Snapshot of our community from the April 2010 US Census Contents Age and Gender... 1 Marital Status... 2 Home Ownership and Tenure... 3 Past Demographic Characteristics... 5 Income
Situational Analysis (Final)
") Situational Analysis (Final) City of Kawartha Lakes Office of Economic Development April-17 Table of Contents Kawartha Lakes at a Glance... - 1 - Statistical Highlights... - 3 - Demographics Analysis...
Situational Analysis (Final) City of Kawartha Lakes Office of Economic Development April-17 Table of Contents Kawartha Lakes at a Glance... - 1 - Statistical Highlights... - 3 - Demographics Analysis...
Not For Sale. An American Profile: The United States and Its People
 An American Profile: The United States and Its People Not For Sale 1 759_EM_AmPro_ptg1.indd 1 Not For Sale 759_EM_AmPro_ptg1.indd 2 An American Profile: The United States and Its People 3 Table 1 Population,
An Overview of the Canadian Labour Market
 An Overview of the Canadian Labour Market ECO339Y Department of Economics University of Toronto 2006/2007 Table 1 Percentage of Selected Groups in Low Income, After Tax (92 LICOs Base), Canada 1980-2003
Characteristics of the Labor Force - Poteau Area
 Not Not Number of respondents 275 42 614 71 543 391 55 Estimated Adults 21,257 2,956 47,302 5,554 41,747 29,188 3,881 Males 54.5 30.2 54.1 51.6 54.4 38.8 29.4 Females 45.5 69.8 45.9 48.4 45.6 61.2 70.6
Christian Brothers University Memphis, TN
 Memphis, TN Academic Statistics 2013-14 Office of Institutional Research & Effectiveness Fall 2013 Quick Facts Fall 2013 Enrollment Status Headcount FTE Full Time Part Time Day 1,003 981.1 Day 966 37 Professional
An American Profile: The United States and Its People
 An American Profile: The United States and Its People 1 153641_EM_AmPro.indd 1 12/16/8 11:1:32 PM An American Profile: The United States and Its People 3 Table 1 Population, Percentage Change, and Racial
2018 Citizen Perspectives Survey Report
 ISC: UNRESTRICTED ATTACHMENT 2 OPC2018-0977 2018 Citizen Perspectives Survey Report August 21, 2018 Presented by the Corporate Research Team Customer Service & Communications The City of Calgary Methodology
FULL PROFILE Census, 2018 Estimates with 2023 Projections Calculated using Weighted Block Centroid from Block Groups Realm Realty Lat/Lon: 3
 FULL PROFILE 2000-2010 Census, 2018 Estimates with 2023 Projections Calculated using Weighted Block Centroid from Block Groups Realm Realty Lat/Lon: 30.0027/-90.1613 RF1 Lakeside Shopping Center Metairie,
A Profile of Plaistow South Big Local Area
 A Profile of Plaistow South Big Local Area DRAFT2 GENERAL DESCRIPTION Plaistow South Big Local is situated in the London Borough of Newham, in east London. It is comprised of 5 of the 8 Local Super Output
Residential Demographic Multipliers
 Rutgers University, Center for Urban Policy Research Residential Demographic Multipliers Estimates of the Occupants of New Housing (Residents, School-Age Children, Public School-Age Children) by State,
In 2018 a total of 56,127 students received an ATAR, 934 fewer than in The gender balance was similar to 2017.
 ATAR 2018 Preliminary report on the Scaling of the 2018 NSW Higher School Certificate This preliminary report has been prepared to provide some information on the calculation of the Australian Tertiary
Housing Market Update Greater Moncton. Housing market intelligence you can count on
 Housing Market Update Greater Moncton Housing market intelligence you can count on Housing Market Drivers Multi-Residential/Rental Market New Home Market Single Family Homes Resale Market 2013/2014 Outlook
WOMEN IN THE NWT - SUMMARY
 In 16, 44,469 people lived in the Northwest Territories (NWT) with females accounting for just under half (49%) of the population. The NWT population consists of almost equal numbers of Indigenous (First
Larry Kessler, Ph.D. Boyd Center for Business & Economic Research University of Tennessee
 Larry Kessler, Ph.D. Boyd Center for Business & Economic Research University of Tennessee The U.S. economy has now enjoyed 7 years of economic growth since the Great Recession Real GDP grew by 1.2% in
Town of Whitby Official Plan Review OVERVIEW
 Town of Whitby Official Plan Review Presentation at Special Meeting of Council Whitby (Municipal Building) November 28 th, 2007 Brooklin (St. Thomas Anglican Church) December 6 th, 2007 OVERVIEW What is
Utah s Demographic Transformation
 Utah s Demographic Transformation A View into the Future Pamela S. Perlich, Ph.D. University Of Utah December 3, 2009 Based on a paper with the same title, available on-line: www.bebr.utah.edu Utah: Trend
GLOBAL BAROMETER OF HOPE AND DESPAIR FOR 2011
 GLOBAL BAROMETER OF HOPE AND DESPAIR FOR 2011 Volume 1: Statistical Report Findings based on responses from more than 64,000 scientifically selected cross-section of Men and Women from all socioeconomic
FOR LEASE HARMS ROAD INDUSTRIAL PARK Harms Road, Houston Texas 77041
 FOR LEASE HARMS ROAD INDUSTRIAL PARK 7206-7214 Harms Road, Houston Texas 77041 Property Statistics: Single-tenant Industrial Park Tilt wall construction with stone facade Crane ready Heavy power, grade
GOV ER N ME NT OF BE RMUDA Cabinet Office Department of Statistics BERMUDA DIGEST OF STATISTICS
 GOV ER N ME NT OF BE RMUDA Cabinet Office Department of Statistics 017 BERMUDA DIGEST OF STATISTICS BERMUDA DIGEST OF STATISTICS 2017 No. 40 (figures up to and including 2016 when available) Cedar Park
Texas Housing Markets: Metropolitan vs. Border Communities. September 22, 2014
 Texas Housing Markets: Metropolitan vs. Border Communities Luis Bernardo Torres Ruiz, Ph.D. Research Economist El Paso Branch Dallas Federal Rio Grande Economic Association September 22, 2014 Contents
TOWARDS A FAIRER ISLINGTON
 www.islington.gov.uk State Brand of Handbook Equalities in Islington Your guide to Islington Council s identity and how to apply it Annual Report 2016 TOWARDS A FAIRER ISLINGTON Contents Introduction 3
Lewisham Pharmaceutical Needs Assessment Appendix B - Lewisham The Place
 Lewisham Pharmaceutical Needs Assessment 2018 Appendix B - Lewisham The Place Lewisham is the 13 th largest borough in London by population size and the 5 th largest in Southwark Inner London Source: MYE
The GRPS Cultural Landscape GRPS Office of Equity and Inclusion
 The GRPS Cultural Landscape GRPS Office of Equity and Inclusion We Welcome You! Our Cultural Landscape Background Nationally, the U.S. population is becoming more racially/ethnically diverse. Source: Pew
2017 Nebraska Profile
 2017 Nebraska Profile State, 9 NEW Regions, 93 Counties, plus 31 Cities Three Volumes Demographic Change in the State Economic Influences at Work Housing Statistics and Trends Summary of Findings Discuss
By making use of SAFRIM (South African Inter-Industry Macro-Economic Model) By Jeaunes Viljoen, Conningarth Economists, 1
 By Jeaunes Viljoen, Conningarth Economists, 1") By making use of SAFRIM (South African Inter-Industry Macro-Economic Model) By Jeaunes Viljoen, Conningarth Economists, South Africa 10/13/2011 1 1960: The economy experienced high growth rates mining
By making use of SAFRIM (South African Inter-Industry Macro-Economic Model) By Jeaunes Viljoen, Conningarth Economists, South Africa 10/13/2011 1 1960: The economy experienced high growth rates mining
Issues in the Long-Term Economic Outlook for Canada
 Policy and Economic Analysis Program Rotman School of Management University of Toronto Issues in the Long-Term Economic Outlook for Canada Office of the Chief Actuary Canada Pension Plan Seminar September
Figure 1a. Top 1% income share: China vs USA vs France
 22% 20% 18% 16% Figure 1a. Top 1% income share: China vs USA vs China USA 14% 12% 10% 8% 6% 4% 1978 1982 1986 1990 1994 1998 2002 2006 2010 2014 Distribution of pretax national income (before taxes and
2016 Census of Agriculture Results
 5.2 2016 Census of Agriculture Results Theresa Duynstee REGIONAL PLANNER, PARKS, PLANNING AND ENVIRONMENT Regional Planning Committee September 8, 2017 2016 Census of Agriculture Products 2 Census of Agriculture
HEALTH INSURANCE COVERAGE STATUS American Community Survey 1-Year Estimates
 S2701 HEALTH INSURANCE COVERAGE STATUS 2014 American Community Survey 1-Year Estimates Supporting documentation on code lists, subject definitions, data accuracy, and statistical testing can be found on
Puget Sound Regional Forecast Chris Mefford Community Attributes
 2015 Puget Sound Regional Forecast Chris Mefford Community Attributes 3 1,000s The Regional Economy has added jobs consistently for nearly 5 full years. In a few months, this will be the longest streak
Joint Strategic Needs Assessment (JSNA) Picture of Lewisham 2018
 Picture of Lewisham 2018") Joint Strategic Needs Assessment (JSNA) Picture of Lewisham 2018 Lewisham s Population Lewisham is the 13 th largest borough in London by population size and the 5 th largest in Southwark Inner London
Joint Strategic Needs Assessment (JSNA) Picture of Lewisham 2018 Lewisham s Population Lewisham is the 13 th largest borough in London by population size and the 5 th largest in Southwark Inner London
The Outlook for Real Estate and Residential Construction. Patrick M. Barkey, Director Bureau of Business and Economic Research University of Montana
 The Outlook for Real Estate and Residential Construction Patrick M. Barkey, Director Bureau of Business and Economic Research University of Montana Montana s Real Estate Performance: Getting Back to Boom
Community Outreach Resource Center
 Community Outreach Resource Center Tier 1 Report: Gillespie County Child & Adolescent Health Child Abuse Rates in Gillespie County 23 7 Gillespie County Children Living in Poverty 23 7 Rate per 1, 14.
2011 Census Snapshot: Method of Travel to work in London
 CIS 2014-06 2011 Census Snapshot: Method of Travel to work in London March 2014 Introduction On 26 th of March 2014, the Office for National Statistics (ONS) published a series of tables looking at the
Labour Market Segmentation in Poland. Artur Gajdos Department of Spatial Econometrics University of Lodz
 Labour Market Segmentation in Poland Artur Gajdos Department of Spatial Econometrics University of Lodz gajdos@uni.lodz.pl Lisbon, 24 November 2016 Agenda Introduction Labour market facts Policy reforms
Field dates: September 27 October 13, 2010
 Focus ada 2010 Detailed Data Tables Field dates: September 27 October 13, 2010 pn 6702 Prepared by: Environics Research Group 336 MacLaren Street Ottawa, Ontario K2P 0M6 Focus ada 2010 Index of Questions
INTERNATIONAL STUDENT STATISTICAL SUMMARY Spring 2017 (Final)
") INTERNATIONAL STUDENT STATISTICAL SUMMARY Spring 2017 (Final) Prepared By: Mr. Jay Ward, Associate Director Office of International Programs San Francisco State University Non-Matriculated SP 17 SP 16
INTERNATIONAL STUDENT STATISTICAL SUMMARY Spring 2017 (Final) Prepared By: Mr. Jay Ward, Associate Director Office of International Programs San Francisco State University Non-Matriculated SP 17 SP 16
Ancestry groups in Australia: a descriptive overview
 University of Wollongong Research Online Centre for Multicultural Studies Working Papers Faculty of Law, Humanities and the Arts 1991 groups in Australia: a descriptive overview F L. Jones Australian National
Social Development Index 2018 ( )
") Social Development Index 2018 (23-5-2018) Social Development Index 2018 Introduction to Social Development Index Introduction to Social Development Index (SDI) A system of objective indicators including:
Social Development Index 2018 (23-5-2018) Social Development Index 2018 Introduction to Social Development Index Introduction to Social Development Index (SDI) A system of objective indicators including:
More of the Same; Or now for Something Completely Different?
 More of the Same; Or now for Something Completely Different? C2ER Place cover image here Richard Wobbekind Chief Economist and Associate Dean for Business and Government Relations June 14, 2017 Real GDP
College/high school median annual earnings gap,
 College/high school median annual earnings gap, 1979 2012 In constant 2012 dollars 70,000 dollars Household gap $30,298 to $58,249 60,000 50,000 40,000 Male gap $17,411 to $34,969 30,000 20,000 10,000
Christian Brothers University Memphis, TN
 Memphis, TN Academic Statistics 2013-14 Office of Institutional Research & Effectiveness Fall 2013 Quick Facts Fall 2013 Enrollment Status Headcount FTE Full Time Part Time Day 1,003 981.1 Day 966 37
I. World trade in Overview
 I. Table I.1 Growth in the volume of world merchandise exports and production by major product group, 1995-3 ( change) 1995-21 22 23 World merchandise exports 7. -.5 3. 4.5 Agricultural products 3.5 2.5
WHERE ARE ARIZONA DEMOGRAPHICS TAKING US? HOW GROWING SLOWER, OLDER AND MORE DIVERSE AFFECTS REAL ESTATE
 WHERE ARE ARIZONA DEMOGRAPHICS TAKING US? HOW GROWING SLOWER, OLDER AND MORE DIVERSE AFFECTS REAL ESTATE March 2017 Tom Rex Office of the University Economist and Center for Competitiveness and Prosperity
DEVELOPMENT AID AT A GLANCE
 DEVELOPMENT AID AT A GLANCE STATISTICS BY REGION 5. EUROPE 2018 edition All the data in this report are available at: http://www.oecd.org/dac/financing-sustainable-development/ 5.1. ODA TO EUROPE - SUMMARY
Re: Algae/Cyanobacteria Bloom in St. Lucie, Martin, Palm Beach and Lee Counties.
 July 18, 2016 Richard L. Scott Governor, State of Florida 400 S Monroe St Tallahassee, FL 32399 Re: Algae/Cyanobacteria Bloom in St. Lucie, Martin, Palm Beach and Lee Counties. Dear Governor Scott: I am
universities, which is at least an average grade of C+ in the Kenya Certificate of Secondary Education (KCSE).
.") Bachelor of technology in Institutional Catering and Accommodation Management The aim of this programme is to offer education and training in catering and institutional management and to equip the candidates
Bachelor of technology in Institutional Catering and Accommodation Management The aim of this programme is to offer education and training in catering and institutional management and to equip the candidates
National Transfer Accounts in Mexico
 National Transfer Accounts in Mexico Policy implications: labor market Iván Mejía Guevara imejiag@stanford.edu Stanford University 12th Global Meeting of the NTA Network, Mexico City, July 23-27, 2018
2011 Origin-Destination Survey Bicycle Profile
 TRANS Committee 2011 Origin-Destination Survey National Capital Region December 2012 TRANS Committee Members: City of Ottawa, including OC Transpo Ville de Gatineau Société de transport de l Outaouais
INFIELD, tutti in campo!
 With the patronage of: Embassy of India Rome Municipality of Pontinia INFIELD, tutti in campo! Foto di Marcello Scopelliti INFIELD, tutti in campo! Title of the project INFIELD, tutti in campo! Lead Organization
PARKS, RECREATION AND CULTURE. Your ad here. Sixteen Mile Sports Complex Video Scoreboard Advertising
 PARKS, RECREATION AND CULTURE Your ad here Sixteen Mile Sports Complex Video Scoreboard Advertising Last updated February 2016 About Oakville Vision: To be the most livable town in Canada According to
2014 Entering Freshman Survey
 2014 Entering Freshman Survey Content Methodology Background Profile High School Experiences Expected First-Year Experiences Other Methodology aimed to collect information about entering students background,
Motorized Transportation Trips, Employer Sponsored Transit Program and Physical Activity
 Motorized Transportation Trips, Employer Sponsored Transit Program and Physical Activity Ugo Lachapelle Msc. Lawrence D. Frank, PhD Active Living Research Washington, DC April 12, 2008 Outline Background:
Vision - Britain's Ocean City One of Europe's most vibrant waterfront cities where an outstanding quality of life is enjoyed by everyone
 PLYMOUTH Economy Nina Sarlaka, Enterprise & Inward Investment Manager Vision - Britain's Ocean City One of Europe's most vibrant waterfront cities where an outstanding quality of life is enjoyed by everyone
MANITOBA'S ABORIGINAL COMMUNITY: A 2001 TO 2026 POPULATION & DEMOGRAPHIC PROFILE
 MANITOBA'S ABORIGINAL COMMUNITY: A 2001 TO 2026 POPULATION & DEMOGRAPHIC PROFILE MBS 2005-4 JULY 2005 TABLE OF CONTENTS I. Executive Summary 3 II. Introduction.. 9 PAGE III. IV. Projected Aboriginal Identity
UDI Capital Region: Growth & Change
 UDI Capital Region: Growth & REAL ESTATE thoughtful Andrew Ramlo, VP, Market Intelligence Rennie Group Today's Roadmap: - Current Market Stats - The Drivers To - To 2021 & Beyond Current Market stats ALL
GENDER INEQUALITY IN THE LABOR MARKET
 Table 1.1 Four Measures of Gender Equality, Country Rankings, Mid-1990s Full-Time Occupational Wage Employment Work Integration Equality (1 to 21) (1 to 15) (1 to 18) (1 to 12) Sweden 1 14 6 8 Finland
Class, ethnicity and unemployment in Britain ( )
") Class, ethnicity and unemployment in Britain (1972-2011) For presentation at the ESDS LFS User meeting, RSS, London 10 December 2012 Yaojun Li Institute for Social Change Manchester University Email: Yaojun.Li@Manchester.ac.uk
Class, ethnicity and unemployment in Britain (1972-2011) For presentation at the ESDS LFS User meeting, RSS, London 10 December 2012 Yaojun Li Institute for Social Change Manchester University Email: Yaojun.Li@Manchester.ac.uk
Daniel Alonso-Soto and Hugo Ñopo
 How does Latin America stand on schooling premium? What does it reveal about its education quality in the long run? Evidence from immigrants in the U.S. Daniel Alonso-Soto and Hugo Ñopo The One Slide Presentation
Hunter and Angler Expenditures, Characteristics, and Economic Effects, North Dakota,
 Agribusiness and Applied Economics Report No. 507-S January 2003 Hunter and Angler Expenditures, Characteristics, and Economic Effects, North Dakota, 2001-2002 Dean A. Bangsund and F. Larry Leistritz*
U.S. Overview. Gathering Steam? Tuesday, October 1, 2013
 U.S. Overview Gathering Steam? Tuesday, October 1, 2013 Uneven global economic recovery Annual real GDP growth projections (%) Projections 2013 2014 World 3.1 3.1 3.8 United States 2.2 1.7 2.7 Euro Area
Studies in non-standard employment in Canada
 Studies in non-standard employment in Canada Geoff Bowlby, Director, Labour Statistics Division November 1, 2008 Defining non-standard employment According to Krahn s broad definition of non-standard employment
The Nordic countries in figures
 The Nordic countries in figures 2010 Order your Nordic Statistica Yearbook 2010 on www.norden.org Nordic countries in figures 2010 ANP 2010:773 T RY K S A G N R. 541-618 Nordic countries in figures 2010
Fishing Industry in Prince Edward Island January 2009
 Fishing Industry in Prince Edward Island January 2009 INDUSTRY HIGHLIGHTS Did you know??? There are two lobster seasons in PEI: the Spring season and the Fall fishery. There were 22.9 million pounds of
Understanding YOUR GROWTH Demographics
 Understanding YOUR GROWTH Demographics Outline 1. Bowling Demographic Snapshot 2. Youth Bowlers 3. Adult Bowling Segments 4. Local-Center Demographics Bowling Demographic Snapshot Bowler Overview 2009
A quick look at the construction sector
 A quick look at the construction sector No. new res consents per annum 45,000 40,000 35,000 30,000 25,000 20,000 15,000 10,000 5,000 0 Builds per 1,000 people 16.00 14.00 12.00 10.00 8.00 6.00 4.00 2.00
2011 Transportation Tomorrow Survey. Data Presentation
 2011 Transportation Tomorrow Survey Data Presentation Participating Agencies Conduct of the Survey Supporting Agencies of TTS Agency 1986 1991 1996 2001 2006 2011 Mininstry of Transportation, Ontario Y
Wincanton Parish Profile 2017
 Wincanton Profile 2017 Introduction Wincanton is the most easterly town in Somerset almost on the borders of Dorset and Wiltshire. Many of the buildings only date from the 18 th century, due to the Great
2020 K Street NW, Suite 410 Washington, DC (202)
") 2020 K Street NW, Suite 410 Washington, DC 20006 (202) 463-7300 Interview dates: October 24 25, 2013 Interviews: 1,008 adults CONDUCTED BY IPSOS PUBLIC AFFAIRS These are findings of an Ipsos online poll
2020 K Street NW, Suite 410 Washington, DC 20006 (202) 463-7300 Interview dates: October 24 25, 2013 Interviews: 1,008 adults CONDUCTED BY IPSOS PUBLIC AFFAIRS These are findings of an Ipsos online poll
Portuguese, English, and. Bulgarian, English, French, or
 Country Language Fiber Content Algeria Arabic Angola Portuguese, English, and French (optional) Optional Argentina Spanish Armenia Armenian Optional Australia English Austria German Bahrain Arabic or English
2009 Master Plan & Reexamination Report Verona, New Jersey
 2009 Master Plan & Reexamination Report Verona, New Jersey MASTER PLAN TOWNSHIP OF VERONA, NEW JERSEY PREPARED FOR THE PLANNING BOARD OF THE TOWNSHIP OF VERONA, NJ PREPARED BY KASLER ASSOCIATES, PA 34
More than half the world lives on less than $2 a day
 More than half the world lives on less than $2 a day PRB s 2005 World Population Data Sheet reveals persisting global inequalities in health and well-being Presentation by Bill Butz, Carl Haub, Linda Jacobsen,
Europass website activity report 2014 (Iceland, Icelandic)
") Europass website activity report 2014 (Iceland, Icelandic) State of play: 2015 Visits from Iceland during 2014 Page 1 of 14 Month Visits 1,337 866 909 544 428 282 253 363 389 488 746 372 6,977 European
Europass website activity report 2014 (Iceland, Icelandic) State of play: 2015 Visits from Iceland during 2014 Page 1 of 14 Month Visits 1,337 866 909 544 428 282 253 363 389 488 746 372 6,977 European
Population & Demographics
 Population & Demographics Conditions and Trends When looking at trends in the total number of people living in Windham (population) and at the characteristics of the people who live here by factors such
Economic Growth in the Trump Economy
 Economic Growth in the Trump Economy Presented to State Data Center Conference William F. Fox, Director November 18, 2016 GDP Grows, Though Slowly 10.0 8.0 Percentage Change, Previous Qtr, SAAR 6.0 4.0
2017 RELIABILITY STUDY STYLE INSIGHTS
 2017 RELIABILITY STUDY STYLE INSIGHTS TABLE OF CONTENTS Introduction...................................................................... 1 Style Insights Summary...........................................................
The National Citizen Survey. Bowling Green, KY. Technical Appendices
 The National Citizen Survey Bowling Green, KY Technical Appendices 2014 National Research Center, Inc. Boulder, CO International City/County Management Association Washington, DC Contents Appendix A: Complete
Deerfield Beach Livability Study Area
 Florida International University FIU Digital Commons Broward County MPO Community Background Reports 5-1-2011 Deerfield Beach Livability Follow this and additional works at: http://digitalcommons.fiu.edu/mpo_broward
2014 Economic Indicators, Trends & Observations. 51 South Main Street Janesville, WI P F RockCountyAlliance.
 2014 Economic Indicators, Trends & Observations 51 South Main Street Janesville, WI 53545 P.608.757.5598 F.608.757.5586 RockCountyAlliance.com Indicators, Trends & Observations National Level State of
Fast Facts: Recreational Scuba Diving and Snorkeling
 Fast Facts: Recreational Scuba Diving and Snorkeling There are between 2.7 to 3.5 million active scuba divers in the US with as many as 6 million active scuba divers worldwide (Source: Sports and Fitness
Bowling Green, KY Technical Appendices
 Bowling Green, KY Technical Appendices 2018 2955 Valmont Road Suite 300 777 North Capitol Street NE Suite 500 Boulder, Colorado 80301 Washington, DC 20002 n-r-c.com 303-444-7863 icma.org 800-745-8780 Contents
City and Regional Residential Preference Survey Results for Toronto and Vancouver: A CLASP Final Report
 City and Regional Residential Preference Survey Results for Toronto and Vancouver: A CLASP Final Report Prepared for: Toronto Public Health Prepared by: Project: Dr. Larry Frank, President Mr. Jim Chapman
Figure 1: Canadian Real Exports and Imports 1981Q1 2009Q2, Quarterly
 Figure 1: Canadian Real Exports and Imports 1981Q1 2009Q2, Quarterly Exports and Imports (Millions of 2002 $) 100000 300000 500000 1981 1985 1989 1993 1997 2001 2005 2009 Exports Imports Exports and Imports