2016 Mid-Year Economic Update
|
|
|
- Bernard Rice
- 6 years ago
- Views:
Transcription

1 2016 Mid-Year Economic Update Featuring: Brian Lewandowski, University of Colorado Boulder Jenel Stelton-Holtmeier, Modern Distribution Management Sponsored by: June 14, 2016
2 Introduction Macroeconomic Overview 2016 Economic Benchmarks for Wholesale Distribution Q&A Agenda


3 Speakers Brian Lewandowski Associate Director, Business Research Division Leeds School of Business, University of Colorado Boulder Jenel Stelton-Holtmeier Editor Modern Distribution Management
4 Speakers Brian Lewandowski Associate Director, Business Research Division Leeds School of Business, University of Colorado Boulder Jenel Stelton-Holtmeier Editor Modern Distribution Management

5 The 2016 Mid-Year Economic Update: Economic Headwinds or Tailwinds? Place cover image here Brian Lewandowski Associate Director, Business Research Division June 14, 2016
6 Economic Benchmarks for Wholesale Distribution and the Economic Outlook Today s Discussion Economic outlook Sales and inventory trends Specific industries Highlights from the 2016 Economic Benchmarks report About the Economic Benchmarks for Wholesale Distribution report data Foundational data from U.S. Census Bureau, Bureau of Labor Statistics and Bureau of Economic Analysis Based on latest Wholesale Trade Survey and Economic Census Include revenue growth forecasts
7 Core Wholesale Distribution Revenue Growth YoY Percent Change 15.0% 10.0% 5.0% 0.0% -5.0% -10.0% -15.0% -20.0% Note: Core excludes the agriculture and the oil and gas sectors.
8 Revisions to Wholesale Trade 2015 and 2016 Estimates for the Year 2014 $Millions Change in Sales Estimates -100,000-50, , ,000 Electrical & Electronic Goods Petroleum & Petroleum Products Drugs & Druggists' Sundries Miscellaneous Durable Goods Metals & Minerals, Except Petroleum Furniture & Home Furnishings Farm Product Raw Materials Apparel, Piece Goods, & Notions Motor Vehicle & Motor Vehicle Parts & Hardware, & Plumbing & Heating Beer, Wine, & Distilled Alcoholic Beverages Miscellaneous Nondurable Goods Paper & Paper Products Chemicals & Allied Products Lumber & Other Construction Materials Grocery & Related Products Professional & Commercial Equipment &.Computer & Computer Peripheral Machinery, Equipment, & Supplies Percentage Change -20%-15%-10%-5% 0% 5% 10% 15% 20% 25%
9 Summary of 2015 Performance by Sector Major Sector (Largest to Smallest Sector Revenues) Actual Revenues (2015) Real Revenues* (2015) Revenue Gap (Actual - Real) Pharmaceutical Wholesalers 13.2% 8.0% 5.2% Grocery and Foodservice Wholesale Distributors 0.3% 1.3% -1.0% Electrical and Electronics Wholesalers 3.9% 4.3% -0.4% Oil and Gas Products Wholesale Distributors -34.8% 7.3% -42.1% Motor Vehicles and Motor Vehicle Parts Wholesale Distributors 5.2% 4.1% 1.1% Industrial Distributors -2.4% -2.8% 0.4% Other Consumer Products Wholesale Distributors 3.6% 5.8% -2.2% Computer Equipment and Software Wholesale Distributors -1.2% 1.6% -2.8% Agricultural Products Wholesale Distributors -13.5% 1.0% -14.5% Miscellaneous Durable Goods Wholesale Distributors -11.2% -4.4% -6.8% Commercial Equipment and Supplies Wholesale Distributors 1.9% 3.3% -1.3% Apparel and Piece Goods Wholesale Distributors 2.5% 2.2% 0.2% Metal Service Centers -15.4% -2.3% -13.1% Beer, Wine and Liquor Wholesalers 4.0% 3.7% 0.3% Hardware, Plumbing, and Heating Equipment/Supplies Wholesalers 5.2% 4.2% 1.1% Chemicals and Plastics Wholesale Distributors -3.5% 6.1% -9.6% Building Material and Construction Wholesale Distributors 3.4% 5.8% -2.4% Office Product Wholesalers and Paper Merchants 3.1% 4.2% -1.2% Furniture and Home Furnishing Wholesale Distributors 7.5% 6.2% 1.4% Total -0.7% 2.6% -3.3%
10 Inventory $Millions Core Wholesale Distribution Nominal Inventory Value 3-Mo. Moving Ave Core Wholesale Distribution Inventory-to-Sales Ratio 600, , , , , ,
11 Real GDP Growth Quarterly and Annualized Real GDP Percent Annualized GDP Annualized GDP Annualized GDP Present Quarterly GDP Sources: Bureau of Economic Analysis and June 2015 NABE Forecast.
12 Real GDP and Potential GDP Trillions, USD 22 Actual Projected Recession 8 Months Recession 18 Months Potential GDP 14 Real GDP Source: Congressional Budget Office, Budget and Economic Outlook, Fiscal Years 2015 to 2025.
13 National Employment Thousands, Month-over- Month Recession 8 Months Recession 18 Months 3-Month Moving Average Sources: Bureau of Labor Statistics (Seasonally Adjusted), National Bureau of Economic Research, Moody s Analytics, and the BRD.

14 Employment Recovery Pre-Recession Peak to April 2016 Source: Bureau of Labor Statistics (Seasonally Adjusted).
15 Employment Losses and Recovery 3-Year Growth Professional and Business Services Trade, Transportation, and Utilities Education and Health Services Leisure and Hospitality Construction Financial Activities Manufacturing Other Services Government Information Mining and Logging -1,000, , ,000 1,000,000 1,500,000 2,000,000 Sources: Bureau of Labor Statistics (Seasonally Adjusted).
16 Job Gains by Wholesale Distribution Sector June 2010 April 2016 Metal Service Centers Chemicals and Plastics Distributors Electrical and Electronics Wholesalers Sporting Goods, Toys/Hobby and Jewelry Wholesaler-Distributors Other Consumer Products (periodicals, tobacco + florist) Wholesalers Oil and Gas Products Wholesalers Computer, Commercial and Medical Equipment Wholesalers and Distributors Pharmaceutical Wholesalers Agricultural Products Wholesalers Office Product Wholesalers and Paper Merchants Industrial Distributors Beer, Wine and Liquor Wholesaler-Distributors Building Material Wholesalers and Distributors Apparel Wholesalers Plumbing and HVAC Wholesalers Furniture and Home Furnishings Wholesalers Motor Vehicle Aftermarket Parts and Supplies Wholesalers Grocery and Foodservice Wholesaler- Distributors Computer and Computer Peripheral Equipment and Software -5.0% 0.0% 5.0% 10.0% 15.0% 20.0% 25.0% 30.0% Percent Change Source: Bureau of Labor Statistics (Seasonally Adjusted).
17 Jobs Deficit by Wholesale Distribution Sector From Pre-recession Peak Office Product Wholesalers and Paper Merchants Other Consumer Products (periodicals, tobacco + florist) Wholesalers Electrical and Electronics Wholesalers Building Material Wholesalers and Distributors Furniture and Home Furnishings Wholesalers Motor Vehicle Aftermarket Parts and Supplies Wholesalers Sporting Goods, Toys/Hobby and Jewelry Wholesaler-Distributors Computer and Computer Peripheral Equipment and Software Computer, Commercial and Medical Equipment Wholesalers and Distributors Pharmaceutical Wholesalers Beer, Wine and Liquor Wholesaler-Distributors Grocery and Foodservice Wholesaler- Distributors Apparel Wholesalers Chemicals and Plastics Distributors Plumbing and HVAC Wholesalers Metal Service Centers Industrial Distributors Oil and Gas Products Wholesalers Agricultural Products Wholesalers Thousands Source: Bureau of Labor Statistics (Seasonally Adjusted).
18 Labor Underutilization Percentage of Labor Force Average U-6 U-6 9.7% 8.0 U Average U-3 5.7% 4.0 U-3 4.7% Source: Bureau of Labor Statistics (Seasonally Adjusted).
19 Initial and Continuing Claims Continuing Claims 7,000,000 Initial Claims 700,000 6,000,000 5,000,000 Initial Claims (Right Axis) Continuing Claims (Left Axis) 600, ,000 4,000, ,000 3,000,000 Average Initial Claims 300,000 2,000, ,000 1,000, , Source: Bureau of Labor Statistics.
20 Interest Rates (Forecast) Percent Year Treasury Month Treasury Source: Moody s Analytics.
21 Household Debt Growth $ Billions 1,500 1, Home Mortgage Debt Consumer Credit Debt Source: U.S. Flow of Funds Account, Z.1 data release.
22 Household Debt Growth Financial Obligations Ratio 19 Debt Service Ratio Financial Obligations Ratio (Left Axis) Debt Service Ratio (Right Axis) Q Q Q Q Q Q Q Q Q Q Q Q Q Q Q Q Q Q Q Q Q Source: Federal Reserve Board.
23 Percent of Balance 90+ Days Delinquent by Loan Type Percent 16% 14% 12% Credit Card 10% Student Loan 8% 6% Auto All 4% 2% Mortgage Home Equity Line 0% 2003 Q Q Q Q Q Q Q Q Q4
24 Household Wealth $ Trillions Other Assets Mutual Funds Corporate Equities Real Estate Total Liabilities Source: Federal Reserve Board, Balance Sheet of Households and Nonprofit Organizations (B.101) (Not Seasonally Adjusted).
25 Real Disposable Personal Income U.S. Total $ Billions, SAAR Per Capita 13,000 40,000 12,000 38,000 11,000 36,000 10,000 34,000 9,000 32,000 8,000 30,000 7, ,000 Source: Bureau of Economic Analysis, Personal Income and Its Disposition, SAAR (Chained 2009 dollars).
26 Index of Consumer Confidence 1985= Recession 8 months Recession 8 months Recession 18 months Sources: The Conference Board and National Bureau of Economic Research.
27 Vehicle Sales and Retail Sales Thousands, SAAR 25,000 Vehicle Sales Retail and Food Services Sales Annual Percent Change , ,000 10,000 5, Sources: Autodata Corp., Motor Intelligence, U.S. Census Bureau (Seasonally Adjusted Annual Rate).
28 U.S. Income and Consumption Percent Change 4.0 Disposable Personal Income Percent Change 4.0 Personal Consumption % 2.4% % 2.5% Sources: Bureau of Economic Analysis and Blue Chip Economic Indicators.

29 National FHFA Home Price Growth Year-over-Year 2016 Source: Federal Housing Finance Agency Home Price Index, All Transactions Index.
30 Housing Affordability Index Composite Source: National Association of Realtors, Composite Index.
31 Houses For Sale and Months' Supply New SF Home Inventory (thousands) 700 Months of Supply SF Homes for Sale Housing Supply Source: New Houses Sold and For Sale, U.S. Census Bureau.
32 U.S. Building Permits Seasonally Adjusted Annual Rate Thousands 2, % 2,000 Multifamily MF Share (Right Axis) 50.0% 1,500 1, Single Family 40.0% 30.0% 20.0% 10.0% % Source : U.S. Census Bureau, New Privately Owned Housing Units Authorized by Building Permits in Permit-Issuing Places (SAAR).
33 National Housing Starts Millions Sources: U.S. Census Bureau and Consensus Forecasts.
34 ISM Indices 70 ISM Manufacturing Index 70 ISM Non-Manufacturing Index Source: Institute for Supply Management (ISM).
35 The FED QE 1 QE 2 Fed promises near zero interest rates until mid-2013, 2014, 2015?, 2016? Operation Twist Swaps Tapering Ends $ Millions 5,000,000 4,500,000 4,000,000 3,500,000 3,000,000 2,500,000 2,000,000 1,500,000 1,000, ,000 Other Assets Mortgage Backed Securities Federal Agency Debt Securities Treasury Securities Interest Rate Hike(s) Source: Federal Reserve Balance Sheet.
36 Commercial Crude Oil Storage Millions of Barrels June 3, 2016: Average Source: Energy Information Association (EIA), Weekly U.S. Ending Stocks excluding SPR of Crude Oil.
37 WTI Oil Price Dollars per Barrel $ $ $ July 3, 2008: $ June 6, 2014: $ $ $80.00 $60.00 $40.00 Average June 5, 2015: $59.11 $20.00 June 6, 2016: $49.71 $ Source: Energy Information Association (EIA), Cushing, OK WTI Spot Price FOB.
38 WTI Oil Price Forecast June 2016 Dollars per Barrel $ $ $80.00 $60.00 $40.00 $20.00 Historical Price EIA Forecast Lower CI Upper CI Moody's Baseline Forecast $ Source: Energy Information Association (EIA), SPEO, Cushing, OK WTI; Moody s Analytics.
39 Henry Hub Natural Gas Spot Price Dollars per Million BTU $16.00 $14.00 $12.00 $10.00 $8.00 $6.00 July 4, 2008: $13.20 June 6, 2014: $4.66 June 5, 2015: $2.60 $4.00 Average $2.00 Average June 6, 2016: $0.00 $ Source: Energy Information Association (EIA), Weekly Henry Hub Natural Gas Spot Price (Dollars per Million Btu).

40 Business Cycles
41 Business Cycle End of WWII Peace Time End of Korean War Steel Strike Monetary Policy Monetary Policy OPEC Oil Embargo Interest Rates Savings and Loan Tech Financial Sources: National Bureau of Economic Research and the Business Research Division.
42 Employment Losses and Recovery Peak to Trough Months to Recovery % -6% -4% -2% 0% Percentage Change Number of Months Sources: Bureau of Labor Statistics (Seasonally Adjusted), National Bureau of Economic Research, and the Business Research Division.
43 S&P 500 End of WWII 2,500 End of Korean War Steel Strike OPEC Monetary Policy Monetary Policy Peace Time Oil Interest Embargo Rates Savings and Loan Tech Financial 2,000 S&P 500 1,500 1, Sources: Bloomberg and the National Bureau of Economic Research.
44 Economic Growth and Recessions Percent Change 8 Personal Consumption Expenditures 6 4 Year-over-Year SAAR SAAR Government Spending Year-over-Year SAAR Percent Change Fixed Business Investment Year-over-Year SAAR Sources: Bureau of Economic Analysis, the National Bureau of Economic Research, and the Business Research Division. SAAR Goods Exports
45 The Underlying Cause??? SAAR 135 Broad Dollar Index Rig Count 2,500 2,000 1,500 1, Gas Wells Oil Wells Baker Hughes Rig Count SAAR 16 China Real GDP Percent Interest Rates 30-Year Fixed Mortgage 10-Year Treasury 3-Month Treasury Sources: Bureau of Economic Analysis, International Monetary Fund, Baker-Hughes, BofA Merrill Lynch, BofA Merrill Lynch US High Yield Option-Adjusted Spread, National Bureau of Economic Research.

46 Thank You
47 Misc. Durable Goods Subsectors (defined by primary products) Metal Scrap Diamonds, Jewelry, and Precious Stones/Metals Sporting and Recreational Goods and Supplies Toy and Hobby Goods and Supplies Pre-recorded Media (CDs, DVDs, & Videotapes) Misc. Other Durable Goods Misc. Home Furnishings and Wood Millwork Non-Lumber Forest Products Musical Instruments and Supplies Source: 2016 Economic Benchmarks for Wholesale Distribution 2016 Gale Media, Inc. All Rights Reserved.
48 Industrial Subsectors (defined by primary products) General Purpose Industrial Machinery and Equipment Construction Machinery and Equipment Farm and Garden Machinery and Equipment Materials Handling Machinery, Equipment, and Parts Aircraft and Aeronautical Equipment and Supplies Service Establishment Equipment and Supplies Other Industrial Machinery and Equipment Metalworking Machinery, Equipment, and Parts General Line Industrial MRO Supplies Industrial Containers and Supplies Oil Well, Refinery, and Pipeline Equipment and Supplies Food Processing Machinery, Equipment, and Parts Fluid Power Machinery, Equipment, and Parts Other Transportation Equipment and Supplies Mechanical Power Transmission (Bearings) Supplies Marine Machinery, Equipment, and Supplies Industrial Valves and Fittings (except Fluid Power) Custodial and Janitorial Equipment and Supplies Welding Supplies Source: 2016 Economic Benchmarks for Wholesale Distribution 2016 Gale Media, Inc. All Rights Reserved.
49 Industrial Subsectors (defined by primary products) Average Revenue per Employee General Purpose Industrial Machinery and Equipment $515,300 Farm and Garden Machinery and Equipment $631,300 Aircraft and Aeronautical Equipment and Supplies $1,404,200 Other Industrial Machinery and Equipment $651,600 General Line Industrial MRO Supplies $727,700 Oil Well, Refinery, and Pipeline Equipment and Supplies $737,700 Fluid Power Machinery, Equipment, and Parts $439,800 Mechanical Power Transmission (Bearings) Supplies $793,000 Industrial Valves and Fittings (except Fluid Power) $609,700 Custodial and Janitorial Equipment and Supplies $313,300 Welding Supplies $474,500 Weighted Average (all 19 subsectors) $604,800 Source: 2016 Economic Benchmarks for Wholesale Distribution 2016 Gale Media, Inc. All Rights Reserved.
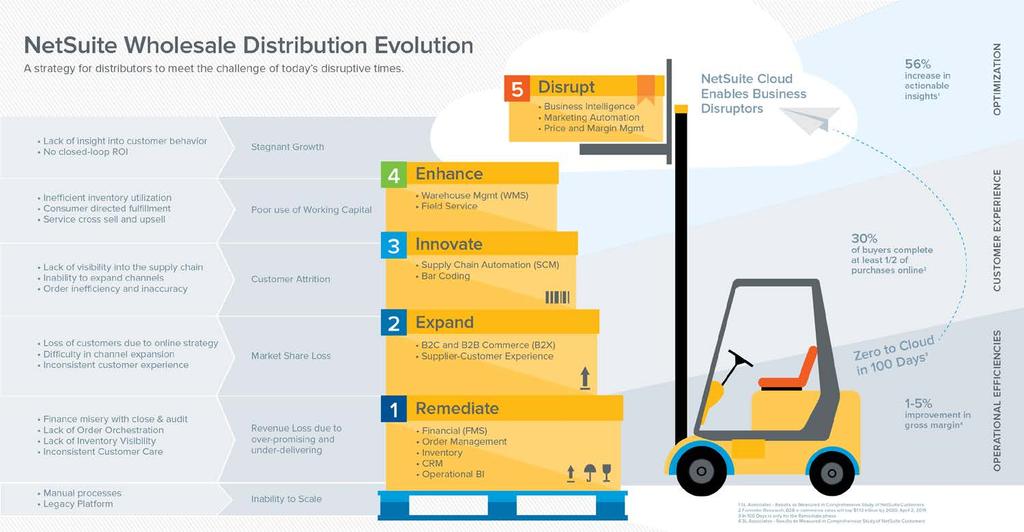
50 NETSUITE #1 CLOUD ERP First Cloud ERP - founded in 1998 Publicly-traded on NYSE N More than 4,700 employees $741.1M revenue in FY15 Grown by 30%+ in each of the last 14 consecutive quarters Used by 30,000+ organizations Used in 160+ countries 400+ new clients in the last quarter Accumulated best practice reduces time to value 40+ recent IPOs run NetSuite 8

51 WHY TODAY S BUSINESSES CHOOSE NETSUITE ERP Designed for Modern Business Built In Platform Enables Flexibility Unified Data Model Delivers Business Intelligence For All Commerce Omnichannel Built for Your Industry 9


52 Commitment to the Wholesale Distribution Industry Vertical Focus Specific Functionality 21st Century Choice Thousands of Distribution Customers Dedicated Distribution Experts In: - Implementation - Account Management - Support - Product Management - Executive Team Inventory Management Order Management Procurement Warehousing Demand Planning Shipping Fulfillment Lead-to-Cash Ecommerce Reporting/Analytics
53 11
54 Transformative Results from Distributors Actionable Insights +56 % Inventory Costs -30 % Gross Margin +1-5 % IT Support Costs -75 % Results as Measured in Comprehensive Study of NetSuite Customers Conducted By: SL Associates
55 Questions? 2016 Mid-Year Economic Update Sponsored by: June 14, 2016
The 2015 Mid-Year Economic Update
 Download slides here at www.mdm.com/slides or email info@mdm.com The 2015 Mid-Year Economic Update Brian Lewandowski and Thomas P. Gale June 18, 2015 Produced by: Sponsored by: Download slides here at
2019 Economic Outlook: Will the Recovery Ever End?
 2019 Economic Outlook: Will the Recovery Ever End? Advantage Bank Place cover image here Richard Wobbekind Senior Economist and Associate Dean for Business and Government Relations November 15 th, 2018
Big Changes, Unknown Impacts
 Big Changes, Unknown Impacts Boulder Economic Forecast Place cover image here Richard Wobbekind Senior Economist and Associate Dean for Business and Government Relations January 17, 2018 Real GDP Growth
 www.colorado.edu/leeds/brd CAREER ADVANCING DEGREES FROM LEEDS EVENING MBA PROGRAM FOR WORKING PROFESSIONALS #1 PART-TIME MBA Program in Colorado according to U.S. News & World Report Engage in a collaborative
10 County Conference. Richard Wobbekind. Executive Director Business Research Division & Senior Associate Dean Leeds School of Business
 10 County Conference Richard Wobbekind Executive Director Business Research Division & Senior Associate Dean Leeds School of Business Hmm... (http://myfallsemester.blogspot.com) Real GDP Growth Percent
More of the Same; Or now for Something Completely Different?
 More of the Same; Or now for Something Completely Different? C2ER Place cover image here Richard Wobbekind Chief Economist and Associate Dean for Business and Government Relations June 14, 2017 Real GDP
Colorado Economic Update
 Colorado Economic Update Steamboat Economic Summit Place cover image here Brian Lewandowski Associate Director, Business Research Division October 21, 2016 Recession 8 Months Recession 18 Months Real GDP
Economic Outlook March Economic Policy Division
 Economic Outlook March 212 Economic Policy Division Real GDP Outlook Percent Change, Annual Rate 2 1 1 - -1 197 197 198 198 199 199 2 2 21 U.S. GDP Actual and Potential Quarterly, Q1 197 to Q4 211 Real
Colorado Counties Treasurers Association
 Colorado Counties Treasurers Association Place cover image here Richard Wobbekind Executive Director, Business Research Division June 21, 2016 Real GDP Growth Quarterly and Annualized Real GDP 1990-2016
Dr. Richard Wobbekind Executive Director, Business Research Division and Senior Associate Dean for Academic Programs University of Colorado Boulder
 Dr. Richard Wobbekind Executive Director, Business Research Division and Senior Associate Dean for Academic Programs University of Colorado Boulder Member FDIC VectraBank.com Economic Outlook 2015 Richard
How Much Wind Is in the Sails?
 How Much Wind Is in the Sails? Erie Chamber of Commerce Place cover image here Richard Wobbekind Senior Economist and Associate Dean for Business and Government Relations September 20, 2017 Real GDP Growth
The U.S. Economic Outlook
 The U.S. Economic Outlook Presented to: Maquiladora Industry Outlook Conference September 29 2006 Presented by: Patrick Newport Principal, U.S. Macroeconomic Service 781-301-9125 patrick.newport@globalinsight.com
2014 Economic Forecast: Boulder & Beyond. Keynote Presentation
 2014 Economic Forecast: Boulder & Beyond Keynote Presentation Business Research Division Richard Wobbekind Executive Director Business Research Division & Senior Associate Dean Leeds School of Business
What s Ahead for The Colorado Economy?
 What s Ahead for The Colorado Economy? Colorado Counties Inc. Place cover image here Richard Wobbekind Senior Economist and Associate Dean for Business and Government Relations November 28, 2017 Real GDP
The Houston Economy Jesse Thompson Regional Business Economist The Federal Reserve Bank of Dallas, Houston Branch January 2017
 The Houston Economy Jesse Thompson Regional Business Economist The Federal Reserve Bank of Dallas, Houston Branch January 2017 Image from http://peoplesguidetohouston.wordpress.com/category/uncategorized/
U.S. Overview. Gathering Steam? Tuesday, October 1, 2013
 U.S. Overview Gathering Steam? Tuesday, October 1, 2013 Uneven global economic recovery Annual real GDP growth projections (%) Projections 2013 2014 World 3.1 3.1 3.8 United States 2.2 1.7 2.7 Euro Area
Economic Growth in the Trump Economy
 Economic Growth in the Trump Economy Presented to State Data Center Conference William F. Fox, Director November 18, 2016 GDP Grows, Though Slowly 10.0 8.0 Percentage Change, Previous Qtr, SAAR 6.0 4.0
The U.S. Economy How Serious A Downturn? Nigel Gault Group Managing Director North American Macroeconomic Services
 The U.S. Economy How Serious A Downturn? Nigel Gault Group Managing Director North American Macroeconomic Services Growth Is Cooling; But a Soft Landing Is Likely (Real GDP, annualized rate of growth)
MAINTAINING MOMENTUM:
 MAINTAINING MOMENTUM: 2018 National Economic Update September 12, 2018 noun mo men tum \ mō-ˈmen-təm, mə- \ 1 b : the strength or force that allows something to continue or to grow stronger or faster as
The US Economic Outlook
 IHS ECONOMICS US Outlook The US Economic Outlook November 2014 ihs.com Rafael Amiel, Director latin America Economics +1 215 789 7405, rafael.amiel.ihs.com 2014 IHS The US economy is gaining momentum Growth
Telling Canada s story in numbers Elizabeth Richards Analytical Studies Branch April 20, 2017
 Recent Developments in the Canadian Economy: How have the decline in oil prices and a weaker Canadian dollar affected Canada s economy? www.statcan.gc.ca Telling Canada s story in numbers Elizabeth Richards
Real GDP Growth Quarterly Real GDP
 Real GDP Growth Quarterly Real GDP Percent Change, SAAR 10.0 8.0 6.0 4.0 2.0 0.0-2.0-4.0-6.0-8.0-10.0 1990 1992 1994 1996 1998 2000 2002 2004 2006 2008 2010 2012 2014 2016 Sources: Bureau of Economic Analysis
The Houston Economy Jesse Thompson Regional Business Economist The Federal Reserve Bank of Dallas, Houston Branch February 2017
 The Houston Economy Jesse Thompson Regional Business Economist The Federal Reserve Bank of Dallas, Houston Branch February 2017 Image from http://peoplesguidetohouston.wordpress.com/category/uncategorized/
colorado.edu/business/brd
 colorado.edu/business/brd Big Changes, Unknown Impacts Southwest Business Forum Place cover image here Richard Wobbekind Senior Economist and Associate Dean for Business and Government Relations January
Deficit Reduction and Economic Growth: Are They Mutually Exclusive Goals? Tuesday, May 1, 2012; 2:30 PM - 3:45 PM
 Deficit Reduction and Economic Growth: Are They Mutually Exclusive Goals? Tuesday, May 1, 2012; 2:30 PM - 3:45 PM Moderator: Gillian Tett, U.S. Managing Editor, Financial Times Speakers: Jared Bernstein,
Canadian Teleconference: Can the Canadian Economy Survive the Turmoil in the United States?
 Canadian Teleconference: Can the Canadian Economy Survive the Turmoil in the United States? Nigel Gault Chief U.S. Economist Dale Orr Canadian Macroeconomic Services Copyright 2008 Global Insight, Inc.
Bob Costello Chief Economist & Vice President American Trucking Associations. Economic & Motor Carrier Industry Update.
 Bob Costello Chief Economist & Vice President American Trucking Associations Economic & Motor Carrier Industry Update February 26, 2013 The Worst Recession Since the Great Depression 0% Loss from Peak
RBC Economics Financial Update Dawn Desjardins
 RBC Economics Financial Update Dawn Desjardins CICA/RBC Q4 2011 Business Monitor Economic Results Overview Business and Economic Optimism Begin to Stablize 100 % 80 % 60 % 40 % 20 % 0 % National Optimism
2019 ECONOMIC FORECAST AND FINANCIAL MARKET UPDATE
 2019 ECONOMIC FORECAST AND FINANCIAL MARKET UPDATE January 14, 2019 Scott Colbert, CFA Executive Vice President Director of Fixed Income & Chief Economist scott.colbert@commercebank.com GLOBAL GROWTH EXPECTATIONS
From Recession to Recovery
 From Recession to Recovery Monday, April 26, 2010 8:00 AM - 9:15 AM Moderator Michael Klowden, President and CEO, Milken Institute Speakers Mohamed El-Erian, CEO and Co-Chief Investment Officer, Pacific
Muhlenkamp & Company. Webinar December 1, Ron Muhlenkamp, Portfolio Manager Jeff Muhlenkamp, Portfolio Manager Tony Muhlenkamp, President
 Muhlenkamp & Company Webinar December 1, 2016 Ron Muhlenkamp, Portfolio Manager Jeff Muhlenkamp, Portfolio Manager Tony Muhlenkamp, President Muhlenkamp & Company, Inc. Intelligent Investment Management
President and Chief Executive Officer Federal Reserve Bank of New York Washington and Lee University H. Parker Willis Lecture in Political Economics
 The U.S. Economic Outlook Chartspresented by WilliamC Dudley Charts presented by William C. Dudley President and Chief Executive Officer Federal Reserve Bank of New York Washington and Lee University H.
National and Virginia Economic Outlook Professor Robert M. McNab Dragas Center for Economic Analysis and Policy Strome College of Business
 National and Virginia Economic Outlook Professor Robert M. McNab Dragas Center for Economic Analysis and Policy Strome College of Business October 24, 2018 The forecasts and commentary do not constitute
Economy On The Rebound
 Economy On The Rebound Robert Johnson Associate Director of Economic Analysis November 17, 2009 robert.johnson@morningstar.com (312) 696-6103 2009, Morningstar, Inc. All rights reserved. Executive
10 County Conference. Richard Wobbekind. Executive Director Business Research Division & Senior Associate Dean Leeds School of Business
 10 County Conference Richard Wobbekind Executive Director Business Research Division & Senior Associate Dean Leeds School of Business Real GDP Growth Percent Quarterly and Annualized Real GDP 1990-2014
The Economic Outlook. Economic Policy Division
 The Economic Outlook Economic Policy Division Glass Half Full Six plus years of moderate growth Real GDP Outlook Percent Change, Annual Rate 10 5 0-5 -10 1980 1985 1990 1995 2000 2005 2010 2015 Glass Half
Your Texas Economy. Current through: Tuesday, Nov 20, 2018
 Your Texas Economy Current through: Tuesday, Nov 20, 2018 Overview of Texas Economy The Texas economy is growing robustly in 2018 2018 job growth through October is 2.9 percent annualized compared to 2.1
Bob Costello Chief Economist & Vice President American Trucking Associations. Economic & Motor Carrier Industry Trends. September 10, 2013
 Bob Costello Chief Economist & Vice President American Trucking Associations Economic & Motor Carrier Industry Trends September 10, 2013 The Freight Economy Washington continues to be a headwind on economic
The Houston Economy Jesse Thompson Regional Business Economist The Federal Reserve Bank of Dallas, Houston Branch June 2016
 The Houston Economy Jesse Thompson Regional Business Economist The Federal Reserve Bank of Dallas, Houston Branch June 2016 Image from http://peoplesguidetohouston.wordpress.com/category/uncategorized/
The United States: Fiscal Facts and Fantasies. Presented by: Nigel Gault Chief U.S. Economist IHS Global Insight
 The United States: Fiscal Facts and Fantasies Presented by: Nigel Gault Chief U.S. Economist IHS Global Insight Subdued Recovery: Tailwinds Battling Headwinds The U.S. Recovery: Tailwinds More sectors
The Economic Outlook. Economic Policy Division
 The Economic Outlook Economic Policy Division Glass Half Full Six years of steady growth Real GDP Outlook Percent Change, Annual Rate 10 5 0-5 -10 1980 1985 1990 1995 2000 2005 2010 2015 Glass Half Full
Reading the Tea Leaves: Investing for 2010 and Beyond
 Reading the Tea Leaves: Investing for 2010 and Beyond Wednesday, April 28, 2010; 8:00 AM - 9:15 AM Moderator: Maria Bartiromo, Anchor, CNBC's Closing Bell With Maria Bartiromo Speakers: Nick Calamos, President
BC Pension Forum. Economic Outlook. Presented by: Ben Homsy, CFA Portfolio Manager
 BC Pension Forum Economic Outlook Presented by: Ben Homsy, CFA Portfolio Manager 1694 1704 1713 1723 1732 1741 1751 1760 1770 1779 1788 1798 1807 1817 1826 1836 1845 1854 1864 1873 1883 1892 1901 1911
Real gross domestic growth
 Real gross domestic growth United States, 2000 prices Compound annual growth rate 10 5 0-5 -10 81 83 85 87 89 91 93 95 97 99 01 03 05 07 Sources: BEA, Global Insight. Consumer sentiment University of Michigan,
Your Texas Economy. Last updated: January 30, 2018
 Your Texas Economy Last updated: January 30, 2018 Texas economy strong in 2017 2017 job growth was 2.4% Overview 2015/2016 job growth was much weaker due to the oil bust (1.3% and 1.2%, respectively) 2014
11 th Annual Oregon Economic Forum!
 11 th Annual Oregon Economic Forum! (almost) Beyond! Macroeconomics Portland, OR! October 16, 2014! Expansion Continues! Five Years and More!! Recession Indicators Nonfarm Payrolls Real Personal Income
Europe June Craig Menear. Chairman, CEO & President. Diane Dayhoff. Vice President, Investor Relations
 Europe June 2016 Craig Menear Chairman, CEO & President Diane Dayhoff Vice President, Investor Relations Forward Looking Statements and Non-GAAP Financial Measurements Certain statements contained in today
Texas Economic Outlook: Recovery in 2010 Keith Phillips Federal Reserve Bank of Dallas San Antonio Office
 Texas Economic Outlook: Recovery in 2010 Keith Phillips Federal Reserve Bank of Dallas San Antonio Office The views expressed in this presentation are strictly those of the author and do not necessarily
U.S. Economy in a Snapshot
 U.S. Economy in a Snapshot Economic Press Briefing: May 19, 2016 The views expressed here are those of the presenter and do not necessarily represent the views of the Federal Reserve Bank of New York or
Economic & Financial Market Outlook
 Economic & Financial Market Outlook BC Pension Forum March 1, 2013 Chris Lawless, Chief Economist Overview Global forces Recent economic performance ~ US, Europe, Japan, China ~ Other emerging markets
Railroads and the Economy
 Railroads and the Economy North East Association of Rail Shippers April 27, 2016 Railroads Help Keep Coal- Based Electricity A cynic is a man who, when he smells flowers, looks around for a coffin. -H.L.
Global Economic Outlook. Kellie Maske, Sr. Economics Fellow FedEx Corporate Economics September 2011
 Kellie Maske, Sr. Economics Fellow FedEx Corporate Economics U.S. Outlook: Moderate Growth Overall 6 4 US Real GDP Growth 2 % Change 0 (2) (4) Forecast (6) (8) Bars = QOQ% Annualized Line = YOY% (10) 2005
ABA Commercial Real Estate Lending Committee
 ABA Commercial Real Estate Lending Committee Commercial Real Estate Outlook The Good, the Bad and the Ugly January 16, 2019 Rob Strand Senior Economist American Bankers Association aba.com 1-800-BANKERS
2018 Economic Outlook Forum Daraius Irani, Ph.D. Chief Economist, Regional Economic Studies Institute VP, Division of Strategic Partnerships and
 2018 Economic Outlook Forum Daraius Irani, Ph.D. Chief Economist, Regional Economic Studies Institute VP, Division of Strategic Partnerships and Applied Research Towson University November 29, 2018 $19,000
Agriculture and the Economy: A View from the Chicago Fed
 Agriculture and the Economy: A View from the Chicago Fed March 3, 2016 Riverside, Iowa David Oppedahl Senior Business Economist 312-322-6122 david.oppedahl@chi.frb.org Federal Reserve System Twelve District
The Global Economy: Sustaining Momentum
 The Global Economy: Sustaining Momentum David J. Stockton Senior Fellow Peterson Institute for International Economics Chief Economist Monetary Policy Analytics October 5, 2017 What s Driving the Global
2018 Annual Economic Forecast Dragas Center for Economic Analysis and Policy
 2018 Annual Economic Forecast Dragas Center for Economic Analysis and Policy PRESENTING SPONSOR EVENT PARTNERS 2 The forecasts and commentary do not constitute an official viewpoint of Old Dominion University,
The Great Economic Reset
 The Great Economic Reset CMTA Annual Conference Squaw Creek Lake Tahoe April 13, 2016 Presented by Douglas C. Robinson, RCM Robinson Capital Management LLC SEC Registered Investment Advisory Firm Advisory
MUSTAFA MOHATAREM Chief Economist, General Motors
 MUSTAFA MOHATAREM Chief Economist, General Motors INTRODUCTION The U.S. economy continues to grow at a gradual but also erratic pace The current recovery is one of the slowest in the post-wwii U.S. history.
Economic Outlook: fear over fundamentals
 ECONOMICS I RESEARCH Economic Outlook: fear over fundamentals April 2016 Craig Wright (SVP & Chief Economist) (416) 974-7457 craig.wright@rbc.com Volatility index Market volatility index, (VIX) 90 80 70
Larry Kessler, Ph.D. Boyd Center for Business & Economic Research University of Tennessee
 Larry Kessler, Ph.D. Boyd Center for Business & Economic Research University of Tennessee The U.S. economy has now enjoyed 7 years of economic growth since the Great Recession Real GDP grew by 1.2% in
Composition of Federal Spending
 *For Institutional Use Only* Demographic and Economic Trends: Growth, Debt and Promises Douglas C. Robinson RCM Robinson Capital Management LLC SEC Registered Investment Advisory Firm Advisory services
Shifting International Trade Routes A National Economic Outlook. February 1, 2011
 Shifting International Trade Routes A National Economic Outlook February 1, 2011 Today s Objectives Endeavor to provide a broad context for today s program by briefly touching on: Some good news Some not
PROVINCE OF SASKATCHEWAN INVESTOR PRESENTATION
 PROVINCE OF SASKATCHEWAN INVESTOR PRESENTATION May 2018 THE SASKATCHEWAN DIFFERENCE Economic Stability Diversified economy balances cyclicality of resources Growing population Majority government with
The U.S. Economic Outlook
 The U.S. Economic Outlook Nigel Gault Chief U.S. Economist, IHS Global Insight FTA Revenue Estimation & Tax Research Conference Charleston, West Virginia October 17, 2011 What Has Happened to the Recovery?
A comment on recent events, and...
 A comment on recent events, and... where we are in the current economic cycle November 15, 2016 Mark Schniepp Director Likely Trump Policies $4 to $5 Trillion in tax cuts over 10 years to corporations,
Opportunities in a Challenging Global Business Environment: Can the World Avoid a Double-Dip?
 Opportunities in a Challenging Global Business Environment: Can the World Avoid a Double-Dip? Ross DeVol Chief Research Officer (310) 570 4615 rdevol@milkeninstitute.org www.milkeninstitute.org Presentation
Economic Overview. Melissa K. Peralta Senior Economist April 27, 2017
 Economic Overview Melissa K. Peralta Senior Economist April 27, 2017 TTX Overview TTX functions as the industry s railcar cooperative, operating under pooling authority granted by the Surface Transportation
Economic Update and Outlook
 Economic Update and Outlook NAIOP Vancouver Chapter November 15, 2012 Helmut Pastrick Chief Economist Central 1 Credit Union Outline: Global, U.S., and Canadian economic conditions Canada economic and
Alternative Measures of Economic Activity. Jan J. J. Groen, Officer Research and Statistics Group
 Alternative Measures of Economic Activity Jan J. J. Groen, Officer Research and Statistics Group High School Fed Challenge Student Orientation: February 1 and 2, 217 Outline Alternative indicators: data
Global economy maintaining solid growth momentum. Canada leading the pack
 Global economy maintaining solid growth momentum Canada leading the pack Dawn Desjardins (Deputy Chief Economist) (416) 974-6919 dawn.desjardins@rbc.com September 2017 Brighter global outlook gains traction
THE ECONOMIC, CLIMATE, FISCAL, POWER, AND DEMOGRAPHIC IMPACT OF A NATIONAL FEE-AND- DIVIDEND CARBON TAX
 THE ECONOMIC, CLIMATE, FISCAL, POWER, AND DEMOGRAPHIC IMPACT OF A NATIONAL FEE-AND- DIVIDEND CARBON TAX Regional Economic Models, Inc. Study Authors Scott Nystrom, M.A. Regional Economic Models, Inc. (REMI)
2015 Economic Forecast & Industry Outlook. Robert A. Kleinhenz, Ph.D. Chief Economist, Kyser Center for Economic Research, LAEDC October 8, 2014
 2015 Economic Forecast & Industry Outlook Robert A. Kleinhenz, Ph.D. Chief Economist,, LAEDC October 8, 2014 Outline U.S. Economy California Economy Southern California Economy & Industries Five-Year Outlook
Northwest Economic Research Center College of Urban and Public Affairs Forecast Breakfast Economic Outlook
 Northwest Economic Research Center College of Urban and Public Affairs 2019 Forecast Breakfast Economic Outlook 1/10/2019 2 U.S. ECONOMY 1/10/2019 3 1980 1982 1984 1986 1988 1990 1992 1994 1996 1998 2000
Zions Bank Economic Overview
 Zions Bank Economic Overview WIB Education Summit September 19, 2017 National Economic Conditions Dow Breaks 22,000 The Trump Bump Dow Reaches New Heights Following U.S. Presidential Election Source: Federal
The ABA Advantage: Economic Issues Update & ABA Resources
 The ABA Advantage: Economic Issues Update & ABA Resources aba.com 1-800-BANKERS Meet the team Jim Chessen Chief Economist Curtis Dubay Senior Economist Brittany Kleinpaste Vice President of Economic Policy
U.S. Oil & Gas Industry Chartbook
 U.S. Oil & Gas Industry Chartbook BBVA Research USA Houston, TX July 2015 DISCLAIMER This document was prepared by Banco Bilbao Vizcaya Argentaria s (BBVA) BBVA Research U.S. on behalf of itself and its
Mexico Stands to Benefit From. With Relative Ease. Jesus Cañas Federal Reserve Bank of Dallas Laredo, Texas May 2014
 Mexico Stands to Benefit From With Relative Ease Jesus Cañas Federal Reserve Bank of Dallas Laredo, Texas May 2014 Outline 2013 worst than expected Economy back on growth track in 2014 Why we care about
U.S. and Colorado Economic Outlook National Association of Industrial and Office Parks. Business Research Division Leeds School of Business
 U.S. and Colorado Economic Outlook National Association of Industrial and Office Parks Presented by the Business Research Division Leeds School of Business University of Colorado at Boulder U.S. Economic
Carol Tomé CFO and Executive Vice President, Corporate Services
 Carol Tomé CFO and Executive Vice President, Corporate Services Financial Overview December 6, 2017 1 Discussion Overview Fiscal 2017 Financial Guidance Our View of the Economy and State of the U.S. Housing
Muhlenkamp & Company. Webcast August 30, Ron Muhlenkamp, Portfolio Manager Jeff Muhlenkamp, Portfolio Manager Tony Muhlenkamp, President
 Muhlenkamp & Company Webcast August 30, 2018 Ron Muhlenkamp, Portfolio Manager Jeff Muhlenkamp, Portfolio Manager Tony Muhlenkamp, President Muhlenkamp & Company, Inc. Intelligent Investment Management
U.S. Oil & Gas Industry Chartbook
 U.S. Oil & Gas Industry Chartbook BBVA Research USA Houston, TX September 2015 DISCLAIMER This document was prepared by Banco Bilbao Vizcaya Argentaria s (BBVA) BBVA Research U.S. on behalf of itself and
INDUSTRY IN FIGURES July/2018
 INDUSTRY IN FIGURES July/2018 1. Industry performance (short-term indicators) Main industrial indicators Variable May18/Apr18 (%) seasonally adjusted May18/May17 (%) Accumulated rate in the last 12 months;
Inland Empire International Trade Economic Forecast
 Inland Empire International Trade Economic Forecast Mira Farka Adrian Fleissig Institute for Economic and Environmental Studies Orange County / Inland Empire Regional SBDC Network California State University,
The Auction Market In 2015 & 2016 Review & Forecast. Dr. Ira Silver NAAA Economist
 The Auction Market In 2015 & 2016 Review & Forecast Dr. Ira Silver NAAA Economist silver@naaa.com Agenda Economic conditions Economic outlook Light vehicle sales Light vehicle sales outlook NAAA 2015 Annual
INDUSTRY IN FIGURES June/2018
 INDUSTRY IN FIGURES June/2018 1. Industry performance (short-term indicators) Main industrial indicators Variable Apr18/Mar18 (%) seasonally adjusted Apr18/Apr17 (%) Accumulated rate in the last 12 months;
INDUSTRY IN FIGURES November/2018
 INDUSTRY IN FIGURES November/2018 1. Industry performance (short-term indicators) Main industrial indicators Variable Sep18/Aug18 (%) seasonally adjusted Sep18/Sep17 (%) Accumulated rate in the last 12
Dr. James P. Gaines Research Economist recenter.tamu.edu
 Texas Uncertain Economy in a World of Uncertain Oil Prices Dr. James P. Gaines Research Economist recenter.tamu.edu National Economic Recovery still Going 2 U.S. Outlook Expected GDP growth still modest:
As Good as it Gets. The Aging Expansion Powers On... but for How Much Longer? Andrew J. Nelson Chief Economist USA, Colliers International
 As Good as it Gets The Aging Expansion Powers On... but for How Much Longer? Andrew J. Nelson Chief Economist USA, Colliers International #NMHCstudent @ApartmentWire Ten Years After: A Full if Imperfect
Montana Manufacturing: 2015 Outlook. Todd A. Morgan, CF
 Montana Manufacturing: 2015 Outlook Todd A. Morgan, CF Montana & U.S. Manufacturing Employment 1990-2014 MT workers 28,000 US workers 21,000,000 24,000 18,000,000 20,000 15,000,000 Montana U.S. 16,000
Wenlin Liu, Senior Economist. Stateof Wyoming. Economic Analysis Division State of Wyoming 1
 WYOMING DEMOGRAPHIC AND ECONOMIC TREND LCCC LIFE Program April 7, 2012 Cheyenne, Wyoming Wenlin Liu, Senior Economist Economic Analysis Division Stateof Wyoming Economic Analysis Division State of Wyoming
Economic Outlook for Canada: Economy Confronting Capacity Limits
 ECONOMICS I RESEARCH Economic Outlook for Canada: Economy Confronting Capacity Limits Presentation to the Responsible Distribution Canada 32 nd Annual General Meeting May 29, 2018 Paul Ferley (Assistant
A Primer on Factors Affecting Farmland Values
 A Primer on Factors Affecting Farmland Values Federal Reserve Bank of Chicago David Oppedahl Business Economist 312-322-6122 david.oppedahl@chi.frb.org The economy hit bottom in June 2009, with hesitant
THE MOST INFORMATIVE EVENT COVERING REAL ESTATE INVESTMENTS
 THE MOST INFORMATIVE EVENT COVERING REAL ESTATE INVESTMENTS 2014 U.S. Economic, Capital Markets, and Retail Market Overview and Outlook Retail Trends 2014 U.S. Economic Overview and Outlook Total Employment
The Economy: A View from the (Atlanta) Fed (Staff)
 Fed (Staff)") The Economy: A View from the (Atlanta) Fed (Staff) 2018 Alabama Economic Outlook Montgomery, AL January 11, 2018 2 The new supply-side economics? In their discussion of monetary policy, participants saw
The Economy: A View from the (Atlanta) Fed (Staff) 2018 Alabama Economic Outlook Montgomery, AL January 11, 2018 2 The new supply-side economics? In their discussion of monetary policy, participants saw
U.S. Oil & Gas Industry Chartbook
 U.S. Oil & Gas Industry Chartbook BBVA Research USA Houston, TX August 2015 DISCLAIMER This document was prepared by Banco Bilbao Vizcaya (BBVA) BBVA Research U.S. on behalf of itself and its affiliated
Houston and Tomball Economic and. Housing Outlook. recenter.tamu.edu. Dr. James P. Gaines Research Economist
 Houston and Tomball Economic and Dr. James P. Gaines Research Economist Housing Outlook recenter.tamu.edu THE CURRENT SITUATION The Future Just Ain t What It Used to Be! Yogi Berra National Economic Recovery
The Future of Retailing in the Philippines to 2018
 Comprehensive data overview of the market, with retail sales value and forecasts to 2018 Report Code: RT0185MR Report Price: US$4,950 (Single Copy) www.conlumino-winesandspirits.com Summary "The Future
Powered Lawn Mower Market in United Kingdom to Market Size, Development, and Forecasts
 Powered Lawn Mower Market in United Kingdom to 2019 - Market Size, Development, and Forecasts Published: 5/2015 Global Research & Data Services Table of Contents List of Tables Table 1 Demand for powered
An Agricultural Update
 An Agricultural Update May 22, 2018 Indianapolis, IN David Oppedahl Senior Business Economist 312-322-6122 david.oppedahl@chi.frb.org Personal consumption shares 40% 30% 20% 10% 0% 1950 1960 1970 1980