Parauco. Consolidating its Expansion in the Region
|
|
|
- Janis Bradley
- 6 years ago
- Views:
Transcription
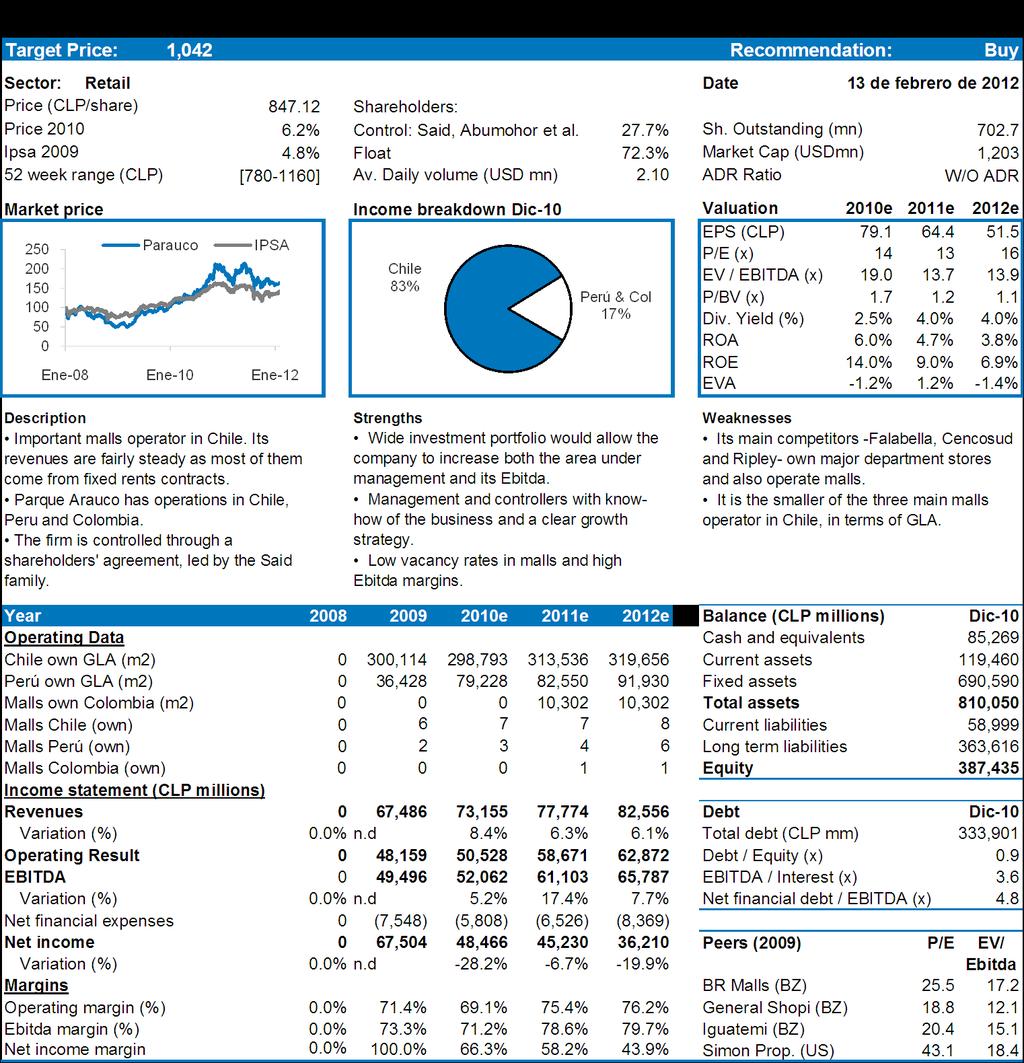
1 Parauco Target Price: CLP 1,042 Recommendation: Buy Risk: Low February 13th, 2012 Sector: Retail Update Report Analyst: Andrea Puebla C. Consolidating its Expansion in the Region Recommendation and Investment Thesis Parque Arauco is a leading developer and operator of shopping centers in the Andean region with operations in Chile, Peru and Colombia. In Chile it was the forerunner of the industry, currently operates 8 shopping centers and achieved an EBITDA of more than CLP 43,900 million as YTD 3Q11. Among its objectives, the company is looking forward to becoming one of the largest shopping center developer in Latin America by We have upgraded our target price of Parauco for EOY2012 to CLP 1,042, which given the closing price at December 2011 of CLP represents an expected upside of more than 23.03% in a 12 months horizon with a BUY recommendation. Our recommendation is based on a defensive business model, arising from its close to 85% fixed revenues, coming from a large multi-tenant base that provides stability to the flows of the company. It also has good growth potential thanks to its expansion plans in Chile, Peru and Colombia, countries that have good economic outlook for the coming years. This would increase the GLA and EBITDA of the company. The updated target price includes a USD 700 million CAPEX plan for the period with allocations to Chile, Peru and Colombia. Inside this investment plan, Colombia has USD 344 million allocated to the construction of Parque La Colina and Bucaramanga; Peru has a USD 110 million allocated to Megaplaza Chimbote and Parque El Golf and finally Chile has allocated USD 36 million to the construction of Arauco Quilicura. Assumptions Among the key assumptions, we consider the incorporation of a chain of six Stripcenters for 1Q 2012 of Parque Arauco, accounting approximately USD 3.5 million annually in EBITDA. For this year 2012, consider the opening of two new shopping centers, Chimbote and Mega Express Villa El Salvador in Peru. Looking to the year 2013, we included in our assumptions the opening of two new shopping centers (Quilicura - Chile and Bucaramanga - Colombia) of sizes close to 30,000 m2. Finally, for the years 2014 and 2015, we expect the entry of two new operations, La Colina in Colombia and Parque El Golf in Lima with 67,000 m2 and 26,000 m2 respectively. 1
2 Investment Projects Country Mall City Investment Area Ebitda USDmn M2 GLA (1) USDmn Inauguration Ownership Peru Megaexpress Villa El Salvador 11 9, semester % Stripcenters Varias Localidades 92 81, % Megaplaza Chimbote Chimbote 26 28, semester % Parque El Golf Lima 85 26, semester % Chile Arauco Quilicura Santiago 36 29, semester % Stripcenters Varias Localidades 20 12, semester % Colombia La Colina Bogotá , semester % Bucaramanga Bucaramanga , semester % (1): GLA: Gross Leaseable Area Source: CorpResearch Parauco has a strategic land bank to ensure its future growth and recovery of assets. In Chile, the company has about 100,000 m2 in Quilicura, which already has begun construction of Mall Arauco Quilicura the wich will be opened during the first half of In Peru, the land is valued at about USD 30 million, with about 390,000 m2. In Colombia, the land add 117,000 m2, for construction of malls in Bucaramanga and Bogota. Lands Value USD mn M2 Chile 6 98,000 Arauco Premium Outlet 3 26,000 Arauco Quilicura 3 72,000 Peru ,000 Parque El Golf 8 15,000 La Unión 9 179,000 Otros Perú 9 86,000 Colombia ,000 Bucaramanga 12 13,000 Bogota 33 34,000 Barranquilla 8 70,000 Total ,000 Source: CorpResearch, Parauco 2
3 Details of operations Chile Within the portfolio of Parque Arauco is Arauco Quilicura, whose construction is underway and is scheduled to open in The total investment for this project, owned 100% by Parque Arauco, amounts to USD 36 million and is expected to contribute USD 4 million annually in EBITDA when it reaches maturity in terms of sales and employment. With a smaller format of malls, Parque Arauco will compete in the segment Stripcenters, in partnership with AURUS, real estate division. This company will be controlled by Parque Arauco, who provide 51% of this new property and begin to consolidate the first quarter of AURUS provide six Stripcenters, which total 12,000 m2, and the company seeks to build five additional years through This investment will mean the company to increase its EBITDA by USD 3.5 million annually. Another investment that is underway is the expansion of Mall Arauco Maipú for 1Q The company will expand its capacity to gross rentable square feet by adding a new anchor store of 14,000 m2. Peru Parque Arauco announced as an essential event on August 4, 2011 a strategic alliance with Cencosud, where the latter will participate as their formats tenant neighborhood shopping centers and Parauco developed in the future and will run for 10 years, which Parque Arauco allows to have an additional anchor store. The company also began to acquire new land for the construction of shopping centers with a smaller format, with the intention of opening between 10 and 12 commercial spaces by One of the major projects that are on the verge of being opened is Megaplaza Chimbote, which will have 28,000 m2 gross leaseable and an investment of approximately USD 26 million. Parque Arauco's participation in this project is 33.5%, but with the power of his administration and consolidation of results. EBITDA expected for this project amounts to USD 2.5 million annually and will be operational during the first half By 2014, it expects to open the sixth mega project of the company in Peru, with a gross leasable area of 26,000 m2 and an investment of USD 85 million. This project, Parque El Golf, will be located in Lima and is expected to contribute USD 9 million annually. Colombia Colombia is today the most attractive country for Chilean retailers, and Parque Arauco not be absent from the commercial development of that country. Build at least two new shopping centers with an investment estimated to reach USD 410 million. The second mall Parque Arauco in Colombia will open by 2013 in the city of Bucaramanga. An investment of USD 100 million and contribute USD 10 million 3
4 in EBITDA. Moreover, with a view to 2015, the company aims to build one of the largest shopping centers has held, with 67,000 m2 gross leaseable and an investment of USD 244 million. The latter will be built in Bogota under the name of Parque La Colina and contribute USD 27 million to EBITDA Valuation Discounted Cash Flow The valuation was performed by DCF, which were discounted from the year 2013 in order to set a price target for the end of Flows were projected to 2020 and from that year and projected flows in perpetuity with a growth rate of 0.6% supported by the development potential in the countries involved, especially in Peru and Colombia, where penetration rates remain low malls. In 2010, Colombia had a 51% penetration of the formal market in relation to total sales of trade, while Peru was 15%, well below 70% of Chile. Target Price We set a target price of CLP 1,042 per share by the end of This means an increase of 23.03% over the closing price of December 2011, which was , therefore our recommendation is Buy. EV / EBITDA On average Parque Arauco has traded between 2002 and 2010 to an EV/EBITDA of 12.1 times. By 2012 we project a multiple of 13.9 times, which is higher than historical, but consistent with the projections of the company.therefore, the company is currently trading at a discount of 14.8%. P/ U Parque Arauco has traded on average during the period between 2002 and 2010 a multiple P/E of 24.1 times, eliminating outliers, the average is16.5 times. We project a multiple P/E for 2012 of 16.4 times, consistent with the historical average has shown the company. 4
5 Parauco Financial Statements Background Operational e 2012e 2013e 2014e 2015e 2016e 2017e 2018e 2019e 2020e GLA total 529, , , , , , , , , , ,000 GLA proportional 378, , , , , , , , , , ,002 GLA: Gross Leaseable Area Income Statements e 2012e 2013e 2014e 2015e 2016e 2017e 2018e 2019e 2020e Revenues 73,155 77,774 82,556 84, , , , , , , ,808 Operating Results 50,528 58,671 62,872 64,858 79,288 98, , , , , ,988 Ebitda 52,062 61,103 65,787 68,027 84, , , , , , ,374 R no operating.+imptos+int. Min. (4,592) (7,933) (20,687) (21,245) (24,518) (25,396) (23,513) (21,223) (18,975) (16,554) (14,705) Earning 48,466 45,230 36,210 37,940 48,061 63,723 67,208 70,236 72,984 76,421 78,270 Source: CorpResearch and Company Reports Asset discount rate (WACC) Chile Peru Colombia Risk free rate (BCU10) 2.90% Country risk Risk premium 5.5% Tax Rate 20.0% 30.0% 35.0% Chile inflation 3.0% Debt / Assets 20.0% 30.0% 30.0% Nominal rate of debt 7.7% Equity Discount Rate 11.9% 12.5% 12.2% Beta 1.08 Wacc 10.8% 10.4% 10.1% Weights 47% 45% 9% Weighted average nominal WACC 10.5% WACC real 7.31% Source: CorpResearch FCD (CLP mn) Present value of cash flow 335,875 Discount rate 7.31% Present value perp 728,933 Perpetual growth 0.6% Value Shareholder 1,064,807 (+) Cash 22,122 (-) Net debt 354,546 (=) Equity 732,384 Number of Shares (mn) Price CLP/share 1,042 Source: CorpResearch 5
6 6
7 Appedix A Operating assumptions by mall (Chile and Colombia) Chile e 2012e 2013e 2014e 2015e 2016e 2017e 2018e 2019e 2020e Kennedy, Santiago Ebitda CLPmn 28,241 27,983 27,984 27,984 27,984 27,984 27,984 27,984 27,984 27,984 27,984 Ebitda margin 86.8% 88.9% 88.9% 88.9% 88.9% 88.9% 88.9% 88.9% 88.9% 88.9% 88.9% M2 108, , , , , , , , , , ,000 Arauco Maipú, Santiago Ebitda CLPmn 4,738 5,688 6,059 5,816 5,932 6,051 6,172 6,295 6,421 6,550 6,550 Ebitda margin 70.1% 73.5% 75.0% 75.0% 75.0% 75.0% 75.0% 75.0% 75.0% 75.0% 75.0% M2 60,236 69,000 69,000 69,000 69,000 69,000 69,000 69,000 69,000 69,000 69,000 Plaza El Roble, Chillán Ebitda CLPmn 2,678 2,857 2,886 2,944 3,003 3,063 3,124 3,186 3,250 3,315 3,315 Ebitda margin 76.0% 76.1% 75.0% 75.0% 75.0% 75.0% 75.0% 75.0% 75.0% 75.0% 75.0% M2 24,664 25,000 25,000 25,000 25,000 25,000 25,000 25,000 25,000 25,000 25,000 Paseo Estación, Santiago Ebitda CLPmn 8,689 8,781 8,377 8,289 8,454 8,623 8,796 8,972 9,151 9,334 9,334 Ebitda margin 75.7% 76.4% 75.0% 75.0% 75.0% 75.0% 75.0% 75.0% 75.0% 75.0% 75.0% M2 67,914 67,000 67,000 67,000 67,000 67,000 67,000 67,000 67,000 67,000 67,000 Marina Arauco, Viña del Mar Ebitda CLPmn 10,786 12,147 12,086 12,081 12,323 12,569 12,821 13,077 13,339 13,605 13,605 Ebitda margin 97.1% 95.6% 95.6% 95.6% 95.6% 95.6% 95.6% 95.6% 95.6% 95.6% 95.6% M2 58,285 72,000 72,000 72,000 72,000 72,000 72,000 72,000 72,000 72,000 72,000 Mall Center, Curicó Ebitda CLPmn 3,368 3,548 3,628 3,659 3,733 3,807 3,883 3,961 4,040 4,121 4,121 Ebitda margin 96.6% 93.6% 93.7% 93.7% 93.7% 93.7% 93.7% 93.7% 93.7% 93.7% 93.7% M2 48,864 50,000 50,000 50,000 50,000 50,000 50,000 50,000 50,000 50,000 50,000 Arauco San Antonio Ebitda CLPmn 1,365 2,611 2,671 2,676 2,729 2,784 2,839 2,896 2,954 3,013 3,013 Ebitda margin 60.0% 74.5% 75.0% 75.0% 75.0% 75.0% 75.0% 75.0% 75.0% 75.0% 75.0% M2 26,713 30,000 30,000 30,000 30,000 30,000 30,000 30,000 30,000 30,000 30,000 * Stripcenters Ebitda CLPmn Margen Ebitda 60.0% 65.0% 70.0% 75.0% 75.0% 75.0% 75.0% 75.0% 75.0% M2 12,000 12,000 12,000 12,000 12,000 12,000 12,000 12,000 12,000 * Quilicura Ebitda CLPmn Ebitda margin 60% 65% 70% 75% 75% 75% 75% M2 29,000 29,000 34,000 34,000 34,000 34,000 34,000 Colombia e 2012e 2013e 2014e 2015e 2016e 2017e 2018e 2019e 2020e Parque Arboleda, Pereira Ebitda USDmn 7,511 7,436 7,808 8,198 9,223 10,329 10,846 11,388 11,957 11,957 Ebitda margin 74% 70% 70% 70% 75% 80% 80% 80% 80% 80% M2 34,000 34,000 34,000 34,000 34,000 34,000 34,000 34,000 34,000 34,000 * Bucaramanga Ebitda USDmn Margen Ebitda 65.0% 70.0% 75.0% 80.0% 80.0% 80.0% 80.0% 80.0% M2 30,000 30,000 30,000 30,000 30,000 30,000 30,000 30,000 * La Colina, Bogotá Ebitda USDmn Margen Ebitda 65% 70% 75% 80% 80% 80% M2 67,000 67,000 67,000 67,000 67,000 67,000 Source: CorpResearch and company reports, *Malls construction assumed by CorpResearch 7
8 Appedix B Operating assumptions by mall (Perú) Perú e 2012e 2013e 2014e 2015e 2016e 2017e 2018e 2019e 2020e Mega Plaza norte, Lima Ebitda USDmn 36,676 41,699 41,787 45,110 46,012 46,932 47,871 48,829 49,805 50,801 50,801 Margen Ebitda 75.4% 78.7% 75.0% 75.0% 75.0% 75.0% 75.0% 75.0% 75.0% 75.0% 75.0% M2 75,515 83,000 83,000 89,000 89,000 89,000 89,000 89,000 89,000 89,000 89,000 M. Express Villa, Lima Ebitda USDmn 1,510 1,776 1,567 1,552 1,583 1,615 1,647 1,680 1,713 1,748 1,748 Margen Ebitda 66.3% 85.2% 75.0% 75.0% 75.0% 75.0% 75.0% 75.0% 75.0% 75.0% 75.0% M2 6,000 6,000 6,000 6,000 6,000 6,000 6,000 6,000 6,000 6,000 6,000 Larcomar, Lima Ebitda USDmn 17,199 17,916 17,430 20,149 20,552 20,963 21,382 21,810 22,246 22,691 22,691 Margen Ebitda 62.3% 61.8% 60.0% 68.0% 68.0% 68.0% 68.0% 68.0% 68.0% 68.0% 68.0% M2 26,000 26,000 26,000 26,000 26,000 26,000 26,000 26,000 26,000 26,000 26,000 Parque Lambramani, Areq. Ebitda USDmn 1,637 1,908 2,913 2,971 3,030 3,091 3,153 3,216 3,280 3,280 Margen Ebitda 16.6% 20.0% 30.0% 30.0% 30.0% 30.0% 30.0% 30.0% 30.0% 30.0% M2 27,000 27,000 29,000 29,000 29,000 29,000 29,000 29,000 29,000 29,000 * M. Express Villa, El Salvador Ebitda USDmn Margen Ebitda 60.0% 65.0% 70.0% 75.0% 75.0% 75.0% 75.0% 75.0% 75.0% M2 9,000 9,000 9,000 9,000 9,000 9,000 9,000 9,000 9,000 * Chimbote Ebitda USDmn Margen Ebitda 60.0% 65.0% 70.0% 75.0% 75.0% 75.0% 75.0% 75.0% 75.0% M2 28,000 28,000 28,000 28,000 28,000 28,000 28,000 28,000 28,000 * Stripcenters Ebitda USDmn Margen Ebitda 65% 70% 75% 75% 75% 75% 75% 75% M2 90,000 90,000 90,000 90,000 90,000 90,000 90,000 90,000 * El Golf Ebitda USDmn Margen Ebitda 60.0% 65.0% 70.0% 75.0% 75.0% 75.0% 75.0% M2 26,000 26,000 26,000 26,000 26,000 26,000 26,000 Source: CorpResearch and company reports, *Malls construction assumed by CorpResearch 8
9 Glossary Term Definition / Translation Calculation EBITDA Earnings Before Interests, Taxes, Depreciation and Amortization Operational Income plus Depreciation and Amortization EBITDAR Earnings Before Interests, Taxes, Depreciation, Amortization and Rents Operational Income plus Depreciation and Amortization plus rent of fixed assets. It is used the at transport industries to reverse the rent of airplanes or ships. EV Enterprise Value Market capitalization plus Net Financial Debt plus EV/EBITDA Valuation multiple. While greater it is, more expensive it is the stock Minority Interest EV divided by Ebitda FCF Free Cash Flow Operational Income plus Depreciation and Amortization minus tax minus capital expenditures plus (minus) working capital variation. Free-float Percentage of stocks that can be freely traded in the market Percentage of stock that does not belong to controller s shareholders. Margin Operational Ebitda Net Percentage of sales Operational Income / Revenue Ebitda / Revenue Net Income / Revenue P/E Price / Earnings Market Price divided by EPS P/B Price to Book value ratio Market price divided by the accounting value of the stock. Dividend Yield The return in terms of dividends of investing in equities Dividends distributed in a year divided by the market price. FCF yield Free Cash Flow Return. FCF / Market Price ROA Return on Assets Net Income / Total Assets ROE Return on Equity Net Income / Accounting capitalization EPS Earnings Per Share Net Income / Shares outstanding YtD Year to Date Percentage variation year to date x Times Stocks recommendations: these are established according to the stock yield relative to the IPSA.We recommend Hold, when we expect the share to have a yield in line with the IPSA; Buy, when the yield expected for the share is above to that expected for the IPSA; and Sell, when the yield expected for the share is below to that expected for the IPSA. We define a yield to be In line with the IPSA when it is within a range whose scope is equivalent to a third of the variation expected for the index, with a minimum of 5%. 9
10 CorpResearch Álvaro Donoso CorpResearch Director Economic Research Sebastián Cerda Executive CorpResearch Director and Economic Studies Director Nicolas Birkner Senior Economic Analyst Daniela Game Economic Analyst Natalie Charles Investments Analyst Juan Ortiz Economic Analyst Equities Research Cristóbal Lyon Strategies Director Carlos Ferruz Analyst - Energy carlos.ferruz@corpgroup.cl Andrea Puebla Analyst - Retail and Banks andrea.puebla@corpgroup.cl María José Ortiz Analyst - Natural Resources and Transport mariajose.ortiz@corpgroup.cl Rosario Norte 660 Floor 17, Las Condes, Santiago, Chile. Telephone: (562)
Recommendation BRL BRL % + HOLD. Stock Chart SMALL UPSIDE Target Price. Current Price. Target Price (10/19) RENT3
 RENT3") TEAM K Recommendation Target Price BRL 44.40 Current Price Target Price BRL 41.00 +8.30% + HOLD (10/19) Stock Chart 50 43 RENT3 44.40 36 29 22 SMALL UPSIDE Sep 15 Dec 15 Mar 16 Jun 16 Sep 16 Source: Bloomberg,
TEAM K Recommendation Target Price BRL 44.40 Current Price Target Price BRL 41.00 +8.30% + HOLD (10/19) Stock Chart 50 43 RENT3 44.40 36 29 22 SMALL UPSIDE Sep 15 Dec 15 Mar 16 Jun 16 Sep 16 Source: Bloomberg,
Q PRESENTATION 18 OCTOBER 2018
 Q3 2018 PRESENTATION 18 OCTOBER 2018 Group Highlights Q3 2018 Very strong growth in revenue and operating profit outside of Denmark. In Denmark, acceptance of self-cleaning in September allows Atea to
Capital Markets How are investors reacting to the crisis? What tto expect tin the coming years? José Ramón Valente March, 2009
 Capital Markets How are investors reacting to the crisis? What tto expect tin the coming years? José Ramón Valente March, 2009 World growth over its historical rate World GDP (Real annual % grow th) 3.6
Europe June Craig Menear. Chairman, CEO & President. Diane Dayhoff. Vice President, Investor Relations
 Europe June 2016 Craig Menear Chairman, CEO & President Diane Dayhoff Vice President, Investor Relations Forward Looking Statements and Non-GAAP Financial Measurements Certain statements contained in today
Fact Sheet for Q3 and January-September 2012 October 24, 2012
 Fact Sheet for Q3 and January-September 2012 October 24, 2012 Contents Daimler Group Stock Market Information 3 Earnings and Financial Situation 4-13 Information for Divisions Mercedes-Benz Cars 14-17
How to Explain Car Rental to Banks and Investors
 How to Explain Car Rental to Banks and Investors Scott White Senior Managing Director, Head of Investment Banking C.L. King & Associates March 8-9, 2011 Las Vegas Hilton 1 My Background 18 Years Advising
Carol Tomé CFO and Executive Vice President, Corporate Services
 Carol Tomé CFO and Executive Vice President, Corporate Services Financial Overview December 6, 2017 1 Discussion Overview Fiscal 2017 Financial Guidance Our View of the Economy and State of the U.S. Housing
Web.com Completes Acquisition of Yodle Deal strengthens Web.com s portfolio of products that help small businesses compete and succeed online
 Web.com Group, Inc. 12808 Gran Bay Parkway West Jacksonville, FL 32258 T: (904) 680-6600 F: (904) 880-0350 NASDAQ: WEB Web.com Completes Acquisition of Yodle Deal strengthens Web.com s portfolio of products
2013 ARGUS DCF Certification Class Professor Thibodeau. ARGUS Certification Exam Preparation Course Professor Tom Thibodeau 8 October 2013
 ARGUS Certification Exam Preparation Course Professor Tom Thibodeau 8 October 2013 1. Thursday, October 10, 2013 A. Overview i. Structure of the Course ii. Multiple Choice Overview Part I B. Chapters 1
General Meeting of Shareholders
 General Meeting of Shareholders Heerenveen, 20 April 2006 1 Agenda Accell Group in 2005 Share price Financials Outlook 2 Further growth Turnover + 8%, organic turnover growth 5% Accell exceeded the top
NSI Preliminary results
 NSI Preliminary results Full Year 2017 30 January 2018 NSI will be the leading specialist in the Dutch office market, with a strong and efficient platform that will drive returns through pro-active asset
Annual results 2017 and strategy update. 09 March 2018
 Annual results 2017 and strategy update 09 March 2018 Agenda 1. Highlights & Group performance 2017 2. Strategy update 3. Outlook 2018 March 9, 2018 Accell Group N.V. presentation annual results 2017 1
Presentation half-year results 2012
 Presentation half-year results 2012 Okura Hotel, Amsterdam 26 July 2012 René J. Takens, CEO Hielke H. Sybesma, CFO Jeroen M. Snijders Blok, COO Agenda 1. Accell Group in H1 2012 2. Accell Group share 3.
Exhibit #MH-156. ELECTRIC OPERATIONS (MH10-2) PROJECTED OPERATING STATEMENT (In Millions of Dollars) For the year ended March 31 REVENUES
 PROJECTED OPERATING STATEMENT (In Millions of Dollars) For the year ended March 31 REVENUES") PROJECTED OPERATING STATEMENT 2011 2012 2013 2014 2015 2016 2017 2018 2019 2020 REVENUES General Consumers at approved rates 1,194 1,223 1,235 1,254 1,265 1,279 1,296 1,307 1,320 1,336 additional * - 42
PROJECTED OPERATING STATEMENT 2011 2012 2013 2014 2015 2016 2017 2018 2019 2020 REVENUES General Consumers at approved rates 1,194 1,223 1,235 1,254 1,265 1,279 1,296 1,307 1,320 1,336 additional * - 42
XV Capital Market Event Credicorp Capital. Rodrigo Larrain, CFO Lima, 27 of Sept. 2017
 XV Capital Market Event Credicorp Capital Rodrigo Larrain, CFO Lima, 27 of Sept. 2017 CENCOSUD: Regional Leadership in Retail JV COLOMBIA 3ER SUPERMARKETS 2DO HOME IMPROVEMENT JV PERU 4TH SUPERMARKETS
Television Francaise 1 (TF1)
") March 11, 2012 Television Francaise 1 (TF1) BUY, TARGET PRICE 9.7 (upside +10.2%) MARKET DATA Stock price (closing 8/3/13) 8.8 Shares nb in M 210.3 Market value (M ) 1,850 Net Cash M ) -235.4 EV adjusted
March 11, 2012 Television Francaise 1 (TF1) BUY, TARGET PRICE 9.7 (upside +10.2%) MARKET DATA Stock price (closing 8/3/13) 8.8 Shares nb in M 210.3 Market value (M ) 1,850 Net Cash M ) -235.4 EV adjusted
Annual results Accell Group 2016
 Annual results Accell Group 2016 Amsterdam, 10 March 2017 René J. Takens, CEO Hielke H. Sybesma, CFO Agenda 1. Key results 2016 2. Strategy 3. Outlook 10 March 2017 Accell Group N.V. presentation annual
FIRST QUARTER 2014 RESULTS APPROVED
 Press Release Mediaset Board of Directors Meeting 13 May 2014 FIRST QUARTER 2014 RESULTS APPROVED Consolidated results Net revenues: 820.8 million Operating profit (EBIT): 29.6 million Net debt: down to
Tuesday, 27 May, 14 1
 1 Paul Godfrey, C.M. Chairman, RioCan Real Estate Investment Trust 2 Forward Looking Statements Certain information to be discussed during this annual and special meeting, or in the management presentation
Xcel Energy (Baa3/BBB-)
") January 28, 2004 Fixed Income Research Recommendation: Market Perform Credit Trend: Improving Jacob P. Mercer, CFA Senior Research Analyst 612-303-1609 jacob.p.mercer@pjc.com Mark D. Churchill Associate
January 28, 2004 Fixed Income Research Recommendation: Market Perform Credit Trend: Improving Jacob P. Mercer, CFA Senior Research Analyst 612-303-1609 jacob.p.mercer@pjc.com Mark D. Churchill Associate
Preliminary Unaudited Financial Results for 2016
 REGULATORY ANNOUNCEMENT March 9 th, 2017 Fortuna Entertainment Group N.V. Preliminary Unaudited Financial Results for 2016 Amsterdam - Fortuna Entertainment Group N.V. announces its preliminary unaudited
INTERIM FINANCIAL STATEMENTS
 AMERICAN GREEN INC INTERIM FINANCIAL STATEMENTS (UNAUDITED) For the three and nine months ended March 31, 2016 and 2015 AMERICAN GREEN INC. UNAUDITED CONSOLIDATED BALANCE SHEET AT MARCH 31, 2016 ASSETS
Colombia: Economic Adjustment and Outlook. Andres-Mauricio Velasco Technical Deputy Minister of Finance, Republic of Colombia February 2018
 Colombia: Economic Adjustment and Outlook Andres-Mauricio Velasco Technical Deputy Minister of Finance, Republic of Colombia February 2018 What is Colombian Ministry of Finance s outlook and funding strategies
Earnings per share. Full year dividend. Return on equity p p 19.6%
 Earnings per share 22.20p Return on equity 19.6% Full year dividend 14.35p Who New Position Background Net release from operations 1,411m Adjusted operating profit 1,628m Profit after tax 1,265m Earnings
Acushnet Holdings Corp. Company Report
 2017, Belle Chang & David Weber, CFA May 2, 2018 Acushnet Holdings Corp. Company Report We recommend an Overweight in Acushnet Holdings. Acushnet, the manufacturer of Titleist and FootJoy branded golf
ANNUAL MEETING OF SHAREHOLDERS. May 3, 2018
 ANNUAL MEETING OF SHAREHOLDERS May 3, 2018 1 Agenda 1. Opening of the Meeting 2. Chairman, Secretary and Scrutineers 3. Notice of Meeting 4. Scrutineer s Report 5. Minutes of Previous Meeting 6. Annual
Half year results Accell Group 2017
 Half year results Accell Group 2017 Hielke Sybesma, Interim CEO & CFO Jeroen Snijders Blok, COO Jeroen Both, CSCO July 21, 2017 Agenda 1. Key results H1 2017 2. Strategy 3. Outlook July 21, 2017 Accell
Fundamental Certainty
 Fundamental Certainty.or No? a presentation at: R. Mark Woodworth PKF Hospitality Research, LLC May 7, 2013 mark.woodworth@pkfc.com Hotel Horizons Forecasting Model Smith Travel Research Historical rooms
AMERICAN GREEN INC INTERIM FINANCIAL STATEMENTS
 AMERICAN GREEN INC INTERIM FINANCIAL STATEMENTS (UNAUDITED) For the three months ended September 30, 2017 and 2016 AMERICAN GREEN INC. UNAUDITED CONSOLIDATED BALANCE SHEET AT SEPTEMBER 30, 2017 ASSETS
NIIT Technologies FZ-LLC, Dubai
 Balance Sheet as at I Notes As at As at As at As at PARTICULARS AED AED EQUITY AND LIABILITIES 1 Shareholders funds Share capital 3 5,000,000 90,084,500 5,000,000 84,865,500 Reserves and surplus 4 (209,271)
AMERICAN GREEN INC INTERIM FINANCIAL STATEMENTS (UNAUDITED)
") AMERICAN GREEN INC INTERIM FINANCIAL STATEMENTS (UNAUDITED) For the six months ended December 31, 2017 and 2016 AMERICAN GREEN INC. UNAUDITED CONSOLIDATED BALANCE SHEET AT DECEMBER 31, 2017 ASSETS CURRENT
AMERICAN GREEN INC INTERIM FINANCIAL STATEMENTS (UNAUDITED) For the six months ended December 31, 2017 and 2016 AMERICAN GREEN INC. UNAUDITED CONSOLIDATED BALANCE SHEET AT DECEMBER 31, 2017 ASSETS CURRENT
AMERICAN GREEN INC INTERIM FINANCIAL STATEMENTS
 AMERICAN GREEN INC INTERIM FINANCIAL STATEMENTS (UNAUDITED) For the nine months ended March 31, 2018 and 2017 AMERICAN GREEN INC. UNAUDITED CONSOLIDATED BALANCE SHEET AT MARCH 31, 2018 ASSETS CURRENT ASSETS:
Presentation first-half results 2010
 Presentation first-half results 2010 Okura Hotel, Amsterdam 23 July 2010 René J. Takens, CEO Hielke H. Sybesma, CFO Jeroen M. Snijders Blok, COO Agenda 1. Accell Group in H1 2010 2. Segments and countries
Annual Stockholders Meeting May 12, President s Report 2013 Results of Operations
 Annual Stockholders Meeting May 12, 2014 President s Report 2013 Results of Operations 1 2013 GDP Growth Philippines +7.2% Thailand +2.9% Malaysia +4.7% Singapore +4.1% Indonesia +5.8% Source: Bangko Sentral
Welcome to William Hill
 1 Welcome to William Hill 2 Today s running order Highlights and year-to-date overview Ralph Topping Financial results Simon Lane Online overview Ralph Topping Henry Birch Current trading, summary and
Discounted Cash Flow Analysis. Basic Information. Smith Investment Group. Property Address: 456 Sample St, Sampletown, SA, Year Built: 1995
 Discounted Cash Flow Analysis Prepared For: Company: Prepared By: Company: Mr. John Smith Smith Investment Group Sample Underwriter Sample Analysis Basic Information Property Name: Sample Retail Property
M e d i a s e t G r o u p
 M e d i a s e t G r o u p 9 th November 2004 2004 9-Month Results MEDIASET 2004 9M Whole Day Audience Trend 24H Individuals Jan- Sep Jan- Sep excluding EUROCUP OTHER SATELLITE OTHER TERRESTRIAL 43.3% 44.2%
Bouygues press release
 Paris, 27 August Bouygues press release Good commercial performance and improved financial results at Bouygues Telecom Strong international momentum of construction businesses Improvement in the Group's
Recommendation: Long ELY Current Price: $14 (11/10) Target Price: $18 Expected Return: 27% November 17th, 2017 Tyler Dunaway, CFA David Huff, CFA
 Target Price: $18 Expected Return: 27% November 17th, 2017 Tyler Dunaway, CFA David Huff, CFA") Recommendation: Long ELY Current Price: $14 (11/10) Target Price: $18 Expected Return: 27% November 17th, 2017 Tyler Dunaway, CFA David Huff, CFA Robert Powell Long: ELY 2 Company Overview ELY is a golf
Recommendation: Long ELY Current Price: $14 (11/10) Target Price: $18 Expected Return: 27% November 17th, 2017 Tyler Dunaway, CFA David Huff, CFA Robert Powell Long: ELY 2 Company Overview ELY is a golf
Accell Group. power in branding and distribution. Business profile. René Takens (CEO) Two segments: - Bicycles, Bicycle Parts & Accessories - Fitness
 Two segments: - Bicycles, Bicycle Parts & Accessories - Fitness") Accell Group power in branding and distribution Brussels/Antwerp, René Takens (CEO) Wouter de Vreeze (Manager M&A/IR) 1 Business profile Two segments: - Bicycles, Bicycle Parts & Accessories - Fitness
Accell Group power in branding and distribution Brussels/Antwerp, René Takens (CEO) Wouter de Vreeze (Manager M&A/IR) 1 Business profile Two segments: - Bicycles, Bicycle Parts & Accessories - Fitness
2010 Credit Suisse Holiday Conference December 7, 2010
 2010 Credit Suisse Holiday Conference December 7, 2010 Forward Looking Statements The Company claims the protection of the safe-harbor for forward-looking statements within the meaning of the Private Securities
J.P. Morgan Ultimate Services Investor Conference November 15, 2016
 J.P. Morgan Ultimate Services Investor Conference November 15, 2016 Max Messmer Chairman and CEO Keith Waddell Vice Chairman, President and CFO Company Background Originated in 1948 as boutique financial
July, Q18 Quarterly Results Update Fideicomiso F/2157 FMTY14
 July, 2018 2Q18 Quarterly Results Update Fideicomiso F/2157 FMTY14 1 1 Second Quarter 2018 Highlights 2Q18 cash distribution of Ps $0.274 per share is the highest quarterly distribution paid since inception
Crefo No Registration No. J40/13885/2013 Tax No. RO Status Active 275 S
 Page 1 from 11 Company identification E-P RAIL SRL Telephone +40 31 4229315 +40 723 393243 B-dul Lacul Tei 31-33 E-mail office@e-prail.ro 20796 Bucuresti Sector 2 WEB www.e-prail.ro Romania Crefo No. 893269
Forward Looking Information
 May 2017 Forward Looking Information Advisory In the interests of providing Tidewater Midstream and Infrastructure Ltd. ( Tidewater or the Corporation ) shareholders and potential investors with information
Unlevered Project Cashflows
 Energy Price Energy Price 1 2 3 4 5 6 7 8 9 10 11 12 13 14 15 16 17 18 19 20 21 22 23 24 25 26 27 28 29 30 31 32 33 34 35 36 37 38 39 40 41 42 43 44 45 46 47 48 49 50 51 52 53 54 55 56 57 58 59 60 61 62
VGi Global Media PCL. 4Q 14/15 & FY 14/15 Earnings Presentation 11 May Prepared by Investor Relations Department
 VGi Global Media PCL 4Q 14/15 & FY 14/15 Earnings Presentation 11 May 2015 Prepared by Investor Relations Department VGi Global Media PCL Agenda SECTION 1 SECTION 2 Industry Overview 4Q 14/15 & FY 14/15
Accordia Golf Trust / AGT
 COVERAGE INITIATED ON: 2016.06.13 Shared Research Inc. has produced this report by request from the company discussed in the report. The aim is to provide an owner s manual to investors. We at Shared Research
Are Internet Stocks Over- Valued?
 Are Internet Stocks Over- Valued? Paul A. Gompers Harvard Business School pgompers@hbs.edu THURSDAY, JUNE 3, 1999 Internet Stock Index S&P 500 INTERNET STOCKS: WHAT A RIDE IT HAS BEEN! Amazon.com: Can
2016 AT A GLANCE
 Jungfraubahn Holding AG 2016 AT A GLANCE www.jungfrau.ch/business-report "The Jungfrau Railway Group achieved its second best result, which was supported by a solid group profit of CHF 30.9 million." Urs
2016 1H Results Presentation. Milan, 28 th July 2016
 2016 1H Results Presentation Milan, 28 th July 2016 Broadcasting & Advertising ITALY 1H 2016 Macro-economic indicators GDP & HH EXPENDITURE y.o.y growth rate, Source: ISTAT GOOD & SERVICE CONSUMPTION y.o.y
XPO Logistics, Inc. XPO NYSE Buy Trucking/Logistics
 One Year Price Chart November 15, 2013 Pays Reasonable Price for Another Last-Mile Acquisition; Reiterate Buy XPO Logistics, Inc. XPO NYSE Buy Trucking/Logistics Company Update Acquires Optima Service
BC Pension Forum. Economic Outlook. Presented by: Ben Homsy, CFA Portfolio Manager
 BC Pension Forum Economic Outlook Presented by: Ben Homsy, CFA Portfolio Manager 1694 1704 1713 1723 1732 1741 1751 1760 1770 1779 1788 1798 1807 1817 1826 1836 1845 1854 1864 1873 1883 1892 1901 1911
Forward Looking Information
 April 2017 Forward Looking Information Advisory In the interests of providing Tidewater Midstream and Infrastructure Ltd. ( Tidewater or the Corporation ) shareholders and potential investors with information
OPAP. Company Presentation Capital Link, December 7 th, 2011
 OPAP Company Presentation Capital Link, December 7 th, 2011 1 Agenda 1. Company Overview 2. Financial Overview 3. Recent Developments 4. Strategy 5. Summary 2 Company Overview The leading Greek gaming
Solid results first half year 2004 Accell Group
 Solid results first half year 2004 Accell Group René Takens (CEO), Hielke Sybesma (CFO) Amsterdam, 21 July 2004 1 Business goes well Autonomous Strong positioning of Accell Group s brands Effective marketing
Investor Presentation Q4 FY 2018
 Investor Presentation Q4 FY 2018 2 nd May, 2018 Content 1. India Business 4. Financials 2. Global Business 5. Recognitions 3. Infrastructure 2 nd May 2018 2 of 34 India Business 2 nd May 2018 3 of 34 India
The U.S. Economy How Serious A Downturn? Nigel Gault Group Managing Director North American Macroeconomic Services
 The U.S. Economy How Serious A Downturn? Nigel Gault Group Managing Director North American Macroeconomic Services Growth Is Cooling; But a Soft Landing Is Likely (Real GDP, annualized rate of growth)
FINANCIAL ANALYSIS. Stoby
 FINANCIAL ANALYSIS Stoby INVESTMENTS AND FINANCING Investments planned over the period : Investments 2018 2019 2020 2021 Intangible assets Company creation 1 500 Web platform development 8 290 Accounting
Q Financial Report Presentation
 Nourishing the future Q3 2014 Financial Report Presentation Andrés Lyon, CEO Cristián García-Huidobro, CFO Santiago, November 7, 2014 Agenda I. Highlights II. III. IV. Financial Statements Productive Performance
REACHING EVERY KIWI SKY NETWORK TELEVISION ANNUAL RESULTS 2018
 REACHING EVERY KIWI SKY NETWORK TELEVISION ANNUAL RESULTS 2018 125.0 120.0 UNDERLYING NET PROFIT 115.0 Millions 110.0 116.3 119.3 105.0 100.0 2017 2018 Page 2 OPERATING COSTS Millions 601.2 553.9 2017
Brookfield Asset Management O AK T R E E ACQUISITION M A R C H 1 3,
 Brookfield Asset Management O AK T R E E ACQUISITION M A R C H 1 3, 2 0 19 Transaction Summary On March 13, 2019, Brookfield Asset Management ( BAM ) and Oaktree Capital Group ( OAK ) announced an agreement
(712 HK - HK$2.47) Comtec. Overweight. More New Orders to Provide Downside Protection. Company Note 5 October 2010
 Comtec. Overweight. More New Orders to Provide Downside Protection. Company Note 5 October 2010") COMPANY BACKGROUND, which commenced its solar business in 2004, manufactures and sells monocrystalline wafers to solar cell manufacturers worldwide. Based in Nanhui District, Shanghai, it had 741 employees
COMPANY BACKGROUND, which commenced its solar business in 2004, manufactures and sells monocrystalline wafers to solar cell manufacturers worldwide. Based in Nanhui District, Shanghai, it had 741 employees
2018 Full Year Results Presentation. 31 August 2018
 2018 Full Year Results Presentation 31 August 2018 Disclaimer Important Notice and Disclaimer Disclaimer The material in this presentation has been prepared by Reece Limited (ABN 49 004 313 133) ( Reece")
Spring Press Conference February 23, Name of chairman
 Spring Press Conference February 23, 2006 Disclaimer This presentation contains forward looking statements which reflect Management s current views and estimates. The forward looking statements involve
Relevance of Questions from past Level III Essay Exams
 This document attempts to identify questions from past Level III essay exams which are still relevant in 2018. There is no guarantee that the information presented here is 100% accurate. If you have any
SAFE HARBOR STATEMENT
 SAFE HARBOR STATEMENT Except for the historical information contained herein, this presentation contains forward-looking statements that involve known and unknown risks, uncertainties and other unknown
SILK ROAD ENTERTAINMENT, INC. (A Development Stage Company) UNAUDITED BALANCE SHEET AT DECEMBER 31, 2018 ASSETS. CURRENT ASSETS: Cash $ 93,218
 UNAUDITED BALANCE SHEET AT DECEMBER 31, 2018 ASSETS. CURRENT ASSETS: Cash $ 93,218") (A Development Stage Company) UNAUDITED BALANCE SHEET AT DECEMBER 31, 2018 ASSETS CURRENT ASSETS: Cash $ 93,218 OTHER ASSETS: Intellectual Property 1,680,018 Total assets $ 1,773,236 LIABILITIES CURRENT
(A Development Stage Company) UNAUDITED BALANCE SHEET AT DECEMBER 31, 2018 ASSETS CURRENT ASSETS: Cash $ 93,218 OTHER ASSETS: Intellectual Property 1,680,018 Total assets $ 1,773,236 LIABILITIES CURRENT
Annual Results 2002 Accell Group N.V. Amsterdam, 20 February 2003
 Annual Results 2002 Accell Group N.V. Amsterdam, 20 February 2003 Agenda Summary results Important developments in 2002 Accell Group share Financials Sales & Marketing Outlook Summary results (x million)
Presentation First-half results 2007
 Presentation First-half results 2007 Okura Hotel, Amsterdam 20 July 2007 René J. Takens, CEO Hielke H. Sybesma, CFO Jeroen M. Snijders Blok, COO 1 Agenda Summary Development segments and countries in first
Dunlop Sports Co. Ltd.
 Dunlop Sports Co. Ltd. (Stock Code :7825 Tokyo Stock Exchange) Second Quarter of FY Financial Results Briefing Material August 7, First Half Earnings Summary of Consolidated Financial Results Overseas
Interim report Q November 2017
 Interim report Q3 2017 14 November 2017 1 Highlights Q3 2017 Positive developments in core business and Hartmann Technology Revenue grew due to technology sales and higher volumes Profitability impacted
Mediaset Board Meeting 8 November 2011 RESULTS APPROVED FOR THE FIRST NINE MONTHS OF 2011
 Press Release Mediaset Board Meeting 8 November 2011 RESULTS APPROVED FOR THE FIRST NINE MONTHS OF 2011 Consolidated results Net revenues: 3.040.5 million Net profit: 166.6 million Italy Net revenues:
Deutsche Bank. Consensus Report. 13 March 2018
 Deutsche Bank Consensus Report 13 March 2018 Deutsche Bank Group P&L (in m) Average Minimum Maximum # est. Average Minimum Maximum # est. Average Minimum Maximum # est. Average Minimum Maximum # est. Revenues
Financial results for Q4 and the full year 2016
 Financial results for Q4 and the full year 2016 16 March 2017 Cyfrowy Polsat S.A. Capital Group Disclaimer This presentation may include forward-looking statements, understood as all statements (other
G E S T E V I S I Ó N T E L E C I N C O S. A. 2nd March 2006 ANALYST PRESENTATION
 G E S T E V I S I Ó N T E L E C I N C O S. A. 2nd March 2006 ANALYST PRESENTATION 1 INTERNATIONAL FINANCIAL REPORTING STANDARDS The consolidated financial results for the twelve months of 2005 are presented
1Q15 Opportunity Day. 14th May 2015 Stock Exchange of Thailand
 1Q15 Opportunity Day 14th May 2015 Stock Exchange of Thailand Agenda Key Highlights Financial Highlights Industry Outlook & Moving Forward 2 Key Highlights 3 Key Achievements Record high performance of
Autohellas 2017 Financial Results & Performance
 Autohellas 2017 Financial Results & Performance Table of Contents 1. Company Overview (3-4) 2. Financial Results 2017 / Performance (5-6) 3. Segment Analysis (7-11) 4. RAC Greece (12-16) 5. LTR / LEASE
Results presentation Audited results for the twelve months ended 31 July Rian du Plessis, CEO
 Results presentation Audited results for the twelve months ended Rian du Plessis, CEO Agenda Five year track record Investor proposition Key financial features Key operational features Tellytrack and piracy
Interim report Q Conference call, 30 August 2017 CEO Ulrik Kolding Hartvig CFO Marianne Rørslev Bock
 Interim report Q2 2017 Conference call, 30 August 2017 CEO Ulrik Kolding Hartvig CFO Marianne Rørslev Bock 1 Highlights Higher volumes outweighed by phasing in Hartmann Technology Group revenue declined
Pacific Sunwear. 35th Annual Bank of America Consumer Conference
 Pacific Sunwear 35th Annual Bank of America Consumer Conference Safe Harbor Disclaimer This presentation will include forward looking statements within the meaning of the safe harbor provisions of Federal
HARLEY DAVIDSON Enjoy the Ride
 HARLEY DAVIDSON Enjoy the Ride Fia Consulting Alex Nicholas Rodrigo Vanessa Agenda Executive Summary Market Analysis Key Issue Recommendation Implementation Risks Financial Executive Summary $ USD $ 2Mi
FOR SALE BILLBOARD EASEMENT OFF US Laurelwood Rd, Santa Clara, CA 95054
 All Sperry Van Ness Offices Independently Owned & Operated. The information listed above has been obtained from sources we believe to be reliable, however, we accept no responsibility for its correctness.
FY 2017 Results Presentation H Results Presentation. Milan, 24 th April Milan, 27 th July 2018
 FY 2017 Results Presentation Milan, 24 th April 2018 2018 1H Results Presentation Milan, 27 th July 2018 FY 2017 Results Presentation Milan, 24 th April 2018 Audience & Advertising gen-16 feb-16 mar-16
Regulatory Update. April 2017
 Regulatory Update April 2017 Disclaimer This Presentation has been prepared by ADMIE Holding and is a presentation of general background information about ADMIE (IPTO) S.A. regulatory issues provided solely
Business Outlook Report 2017
 Business Outlook Report 217 Adam Davey Market Intelligence Manager Sponsored By: 7.3.217 Agenda 1 Oil and Gas Markets 2 Supply Chain Outlook - Revenues - Share Price 3 Upstream Outlook - Capex - Opex -
SPECIAL DIVIDEND OF MUELLER INDUSTRIES, INC.
 MUELLER INDUSTRIES, INC. SPECIAL DIVIDEND OF MUELLER INDUSTRIES, INC. This document is being provided to stockholders of Mueller Industries, Inc. (a corporation that we refer to as Mueller, we, our or
financial year objectives surpassed. Men s/women s teams: 5 trophies in league and cup play. Record net profit: 20.
 2007-08 financial year objectives surpassed Men s/women s teams: 5 trophies in league and cup play Record net profit: 20.1 million Record EBITDA: 59.8 million Lyon, 22 September 2008 SPORTING RESULTS Exceptional
FY 2017 Results Presentation Q Results Presentation. Milan, 24 th April Milan, 15 th May 2018
 FY 2017 Results Presentation Milan, 24 th April 2018 2018 1Q Results Presentation Milan, 15 th May 2018 FY 2017 Results Presentation Milan, 24 th April 2018 Audience & Advertising gen-16 feb-16 mar-16
HALF-YEAR RESULTS 2018
 HALF-YEAR RESULTS 2018 HALF-YEAR RESULTS 2018 07/25/2018 1 This presentation contains certain forward-looking statements based on current expectations, forecasts and assumptions that involve risks and
Half year results Accell Group N.V.
 Half year results Accell Group N.V. René Takens (CEO), Hielke Sybesma (CFO), Jeroen Snijders Blok (COO) Amsterdam, 1 Agenda Summary results Accell Group in 1st half year 2005 Share Accell Group Financial
The Great Eastern Shipping Co. Ltd. Debt Investors Meet September 2016
 The Great Eastern Shipping Co. Ltd. Debt Investors Meet September 2016 Corporate Profile The Great Eastern Shipping Company Shipping (Bulk) Offshore (Through wholly-owned subsidiary Greatship (India) Limited)
2019 ECONOMIC FORECAST AND FINANCIAL MARKET UPDATE
 2019 ECONOMIC FORECAST AND FINANCIAL MARKET UPDATE January 14, 2019 Scott Colbert, CFA Executive Vice President Director of Fixed Income & Chief Economist scott.colbert@commercebank.com GLOBAL GROWTH EXPECTATIONS
2010 First Half Results Presentation. 29 th July 2010
 2010 First Half Results Presentation 29 th July 2010 1 ITALY TV Consumption trend (2003-2010) Average Daily minutes 261 259 258 260 Individuals 255 239 242 257 237 238 244 248 234 235 15-64 years 221 224
Big Changes, Unknown Impacts
 Big Changes, Unknown Impacts Boulder Economic Forecast Place cover image here Richard Wobbekind Senior Economist and Associate Dean for Business and Government Relations January 17, 2018 Real GDP Growth
Accell Group profit up by 15% in 2009
 Number of pages: 11 PRESS RELEASE Accell Group profit up by 15% in 2009 Heerenveen (the Netherlands), 26 February 2010 - Accell Group N.V. booked a further rise in turnover and profit in 2009. Turnover
Canadian Teleconference: Can the Canadian Economy Survive the Turmoil in the United States?
 Canadian Teleconference: Can the Canadian Economy Survive the Turmoil in the United States? Nigel Gault Chief U.S. Economist Dale Orr Canadian Macroeconomic Services Copyright 2008 Global Insight, Inc.
Deutsche Bank. Consensus Report. 14 August 2018
 Deutsche Bank Consensus Report 14 August 2018 Deutsche Bank Group P&L (in m) Average Minimum Maximum # est. Average Minimum Maximum # est. Average Minimum Maximum # est. Average Minimum Maximum # est.
Fairway Group Holdings Corp. Jared Ziment, Max Lipscomb January 11, 2015
 Fairway Group Holdings Corp. Jared Ziment, Max Lipscomb January 11, 2015 Table of Contents I. Sourcing & Investment Thesis II. Company Overview III. Valuation IV. Conclusion V. Appendix 2 I. Sourcing &
Macro-economic risk and the outlook for aviation
 Macro-economic risk and the outlook for aviation 25 th January 2018, Dublin Brian Pearce, Chief Economist, IATA www.iata.org/economics Macro matters 24% 20% Global GDP and RPK growth 12% 10% 16% 12% 8%