Inequality in America : The 1% in International and Historical Perspective
|
|
|
- Moses Martin
- 6 years ago
- Views:
Transcription
1 Inequality in America : The 1% in International and Historical Perspective Thomas Piketty Paris School of Economics Columbia University, September
2 Inequality & capitalism in the long run Long run distributional trends = key question asked by 19 C economists Many came with apocalyptic answers Ricardo-Marx: a small group in society (land owners or capitalists) will capture an ever growing share of income & wealth no balanced development path can occur During 20 C, a more optimistic consensus emerged: growth is a rising tide that lifts all boats (Kuznets 1953; cold war context)
3 But inequality since 1970s destroyed this fragile consensus (US : 60% of total growth was absorbed by top 1%) 19 C economists raised the right questions; we need to adress these questions again; we have no strong reason to believe in balanced development path world financial crisis also raised doubts about balanced devt path will stock options & bonuses, or oil-rich countries, or China, or tax havens, absorb an ever growing share of world ressources in 21 C capitalism?
4 Convergence vs divergence Convergence forces do exist: diffusion of knowledge btw countries (fostered by econ & fin integration) & wth countries (fostered by adequate educ institutions) But divergence forces can be stronger: (1) When top earners set their own pay, there s no limit to rent extraction top income shares can diverge (2) The wealth accumulation process contains several divergence forces, especially with r > g a lot depends on the net-of-tax global rate of return r on large diversified portfolios : if r=5%-6% in (=what we observe in for large Forbes fortunes, or Abu Dhabi sovereign fund, or Harvard endowment), then global wealth divergence is very likely
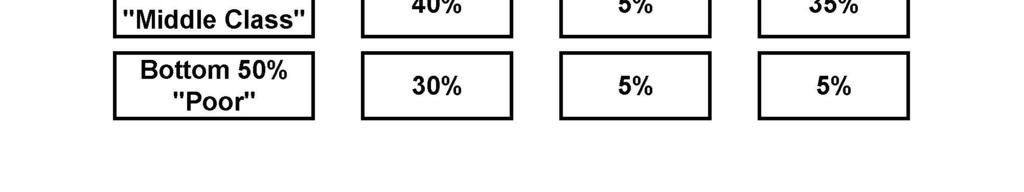
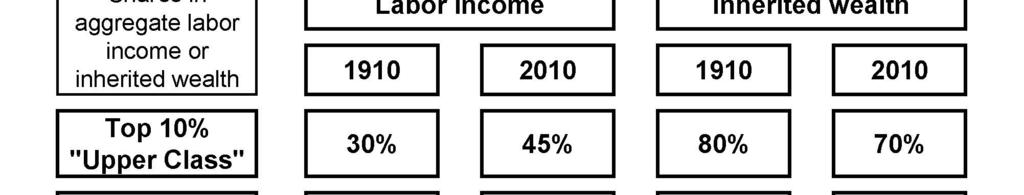
5 This lecture: Inequality in America Inequality in the US is now larger than ever before in American history. About 50% of national income goes to the top 10% (incl. 20% to top 1%), i.e. approximately the same record high level as UK or France around Does US inequality keep a distinctive meritocratic character, or is the New World simply becoming like Old Europe? As compared to UK or France 1910, current US inequality has a different structure: it is more based upon labor income and less upon inherited wealth. But: This difference is a matter of degree and should not be exagerated. US wealth concentration is very large. US wealthincome ratios might also reach record levels in the future. Key difference with Europe = population growth. The enormous rise in top labor incomes has little to do with merit. Modern US inequality puts enormous pressure on loosers (meritocratic extremism). At least Belle Epoque or Ancien Régime inequality did not really pretend to be fair.
6
7 50% 45% 40% 35% 30% 25% Share of total income going to Top 10% FIGURE 1 The Top Decile Income Share in the United States, Source: Piketty and Saez (2003), series updated to Income is defined as market income including realized capital gains (excludes government transfers).
8 Share of total income going to Top 10% 50% 45% 40% 35% 30% 25% Including capital gains Excluding capital gains FIGURE 1 The Top Decile Income Share in the United States, Source: Piketty and Saez (2003), series updated to Income is defined as market income including realized capital gains (excludes government transfers).
9 25% 20% 15% 10% 5% 0% Top 1% (incomes above $352,000 in 2010) Top 5-1% (incomes between $150,000 and $352,000) Top 10-5% (incomes between $108,000 and $150,000) FIGURE 2 Decomposing the Top Decile US Income Share into 3 Groups, Share of total income accruing to each group
10 Share of total income going to top 10% (incl. realized capital gains 50% 45% 40% 35% 30% Top Decile Income Shares U.S. U.K. Germany France 25% Source: World Top Incomes Database, Missing values interpolated using top 5% and top 1% series.
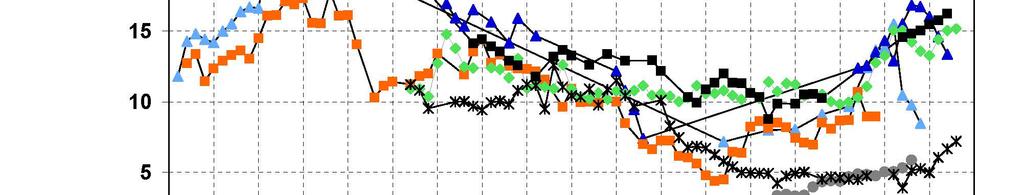
11 Top 1% share: English Speaking countries (U-shaped), Top Percentile Share (in percent) United States United Kingdom Canada Australia Ireland New Zealand
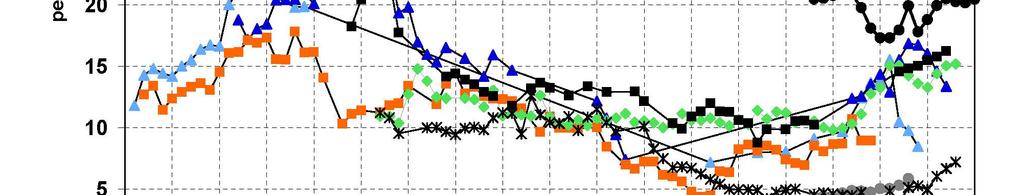
12 Top 1% share: Continental Europe and Japan (L-shaped), Top Percentile Share (in percent) France Germany Netherlands Switzerland Japan Sweden
13 Top 1% share: Continental Europe, North vs South (L-shaped), Top Percentile Share (in percent) France Germany Spain Italy Sweden
14
15
16 US 2010 vs Old Europe 1910 US income inequality in 2010 is as large as UK-France at the eve of World War 1: about 50% of national income goes to top 10% (incl. 20% to top 1%) Does this imply that the structure of inequality is the same? Not necessarily. In UK-France 1910, inequality was largely based upon inherited wealth: «rentier society» In US 2010, inequality is more based upon labor income: «superstar society» But this is a matter of degree: concentration of inherited wealth is currently very high in the US, and is rising
17
18
19 Main difference btw US and Europe: aggregate wealthincome larger in Europe, bc higher pop growth in US Key mechanism: wealth-income ratio β = s/g If saving rate s=10% & growth rate g=3%, then β 300% But if s=10% & g=1.5%, then β 600% Back in 1800, the US was already a country where wealth mattered much less than in Europe: abundant land is worth less, so that new world had more land in volume, but less land in value (more precisely: wealth mattered less in the US if we neglect slavery system; complex legacy for US inequality)
20 800% Private wealth / national income ratios % USA 600% Europe 500% 400% 300% 200% 100% Authors' computations using country national accounts. Private wealth = non-financial assets + financial assets - financial liabilities (household & non-profit sectors)
21 800% Private wealth / national income ratios in Europe, % Germany 600% France 500% UK 400% 300% 200% 100% Authors' computations using country national accounts. Private wealth = non-financial assets + financial assets - financial liabilities (household & non-profit sectors)
22 National wealth in : Old vs New world 800% (% national income) 700% 600% 500% 400% 300% 200% Other domestic capital Housing Slaves Agricultural Land 100% 0% UK France US South US North
23 Why did US top labor incomes rise so much? It is hard to account for observed cross-country variations with a purely technological, marginalproduct story: technical change also occurred in Europe & Japan, so why inequality in US only? One popular view among some economists: US today = working rich get their marginal product (globalization, superstars) Europe today (& US 1970s) = market prices for high skills are distorted downwards (social norms, etc.) very naïve view of the top end labor market & very ideological: we have zero evidence on the marginal product of top executives; it could well be that prices are distorted upwards
24 A more realistic view: grabbing hand model = - marginal products are unobservable - top executives have an obvious incentive to convince shareholders & subordinates that they are worth a lot - no market convergence because constantly changing corporate & job structure (+ costs of experimentation competition failure) when pay setters set their own pay, there s no limit to rent extraction... unless confiscatory tax rates at the very top (memo: US top tax rate (1m$+) = 82%)
25 100% Top Income Tax Rates Top marginal income tax rate applying to top income 90% 80% 70% 60% 50% 40% 30% 20% 10% 0% U.S. U.K. Germany France Source: World Top Incomes Database, 2012.
26 Explaining long run changes in inequality requires looking at political and cultural change As a country, the US has been «playing yo-yo» with the rich over the 20th century: - In the 1920s-1970s, the US invented steeply progressive income and estate taxation. One objective was to avoid the excessive wealth concentration associated to Europe. - In the 1970s-2010s, the US dismantled progressive taxation. One objective was to renew with govt-free 19 c US. «America is back». Catch-up by Europe/Japan. Pb: US growth is not better than US growth or Europe growth Extreme concentration of labor rewards does not seem to be the best way to organize 21 c skill based economy
27
28 Summing up American inequality will keep its distinctive character as long as the US remains the New world, i.e. as long as population growth is much larger than Europe and if the US renews with its equal-opportunity tradition and institutions: massive investment in skills, progressive taxation to prevent excessive concentration of wealth and economic power Otherwise the US inequality model can become the worst of all worlds: large concentration of wealth + large concentration of labor income + extremist meritocratic discourse putting pressure on loosers
29 100% 90% 80% 70% U.S. U.K. France Top Inheritance Tax Rates % 50% Germany 40% 30% 20% 10% 0%
30 800% Private wealth / national income ratios, % 600% USA Germany UK Canada Japan France Italy Australia 500% 400% 300% 200% 100% Authors' computations using country national accounts. Private wealth = non-financial assets + financial assets - financial liabilities (household & non-profit sectors)
31 Private wealth / national income ratios, (incl. Spain) 800% 700% USA Japan Germany France UK Italy Canada Spain Australia 600% 500% 400% 300% 200% 100% Authors' computations using country national accounts. Private wealth = non-financial assets + financial assets - financial liabilities (household & non-profit sectors)
32 800% 700% Private vs governement wealth, (% national income) USA Japan Germany France 600% UK Canada Italy Australia 500% 400% 300% 200% 100% Private wealth Government wealth 0% -100% Authors' computations using country national accounts. Government wealth = non-financial assets + financial assets - financial liabilities (govt sector)
33 800% The changing nature of national wealth, UK (% national income) 700% 600% 500% 400% 300% 200% Net foreign assets Other domestic capital Housing Agricultural land 100% 0% National wealth = agricultural land + housing + other domestic capital goods + net foreign assets
34 800% The changing nature of national wealth, France (% national income) 700% 600% 500% 400% 300% 200% Net foreign assets Other domestic capital Housing Agricultural land 100% 0% National wealth = agricultural land + housing + other domestic capital goods + net foreign assets
35 600% 500% The changing nature of national wealth, US Net foreign assets Other domestic capital Housing Agricultural land (% national income) 400% 300% 200% 100% 0% National wealth = agricultural land + housing + other domestic capital goods + net foreign assets
36 600% 500% The changing nature of national wealth, US (incl. slaves) Net foreign assets Other domestic capital Housing Slaves Agricultural land (% national income) 400% 300% 200% 100% 0% National wealth = agricultural land + housing + other domestic capital goods + net foreign assets
37 600% The changing nature of national wealth, Canada (% national income) 500% 400% 300% 200% Net foreign liabilities Other domestic capital Housing Agricultural land 100% 0% National wealth = agricultural land + housing + other domestic capital - net foreign liabilites
Top Incomes and the Great Recession: Recent Evolutions and Policy Implications
 13TH JACQUES POLAK ANNUAL RESEARCH CONFERENCE NOVEMBER 8 9, 2012 Top Incomes and the Great Recession: Recent Evolutions and Policy Implications Thomas Piketty Paris School of Economics Emmanuel Saez University
Top incomes in historical and international perspective: Recent developments
 Top incomes in historical and international perspective: Recent developments Facundo Alvaredo EMod/Nuffield College & Conicet & Paris School of Economics Inequality in the and Europe Top Incomes, Poverty
44 Economic Perspectives
 44 Economic Perspectives Source: Kotlikoff (1988), p. 44 In Hundreds 70 Of Dollars 60 50.. 40. 30 ;-*** * s EARNINGS 20 -CONSUMPTION 10 10 20 30 40 50 60 70 Age 1910 1920 1930 1940 1950 1960 Year Fig.
Rising Income Inequality
 Rising Income Inequality Prof. Lutz Hendricks Econ520 February 21, 2017 1 / 37 The issues Income inequality has been rising for the past 35 years. Why has this happened? What could be done about it? We
Seven Lean Years Explaining Persistent Global Economic Weakness
 Seven Lean Years Explaining Persistent Global Economic Weakness 9 June 2015 Bank of Canada and European Central Bank Conference Tim Lane Deputy Governor Bank of Canada The global economy remains weak and
Wealth Inequality in the United States since 1913
 Wealth Inequality in the United States since 1913 Emmanuel Saez (UC Berkeley) Gabriel Zucman (LSE) JRCPPF 4 th Annual Conference 19 February 2015 Is rising inequality in the United States only a labor
Figure 1a. Top 1% income share: China vs USA vs France
 22% 20% 18% 16% Figure 1a. Top 1% income share: China vs USA vs China USA 14% 12% 10% 8% 6% 4% 1978 1982 1986 1990 1994 1998 2002 2006 2010 2014 Distribution of pretax national income (before taxes and
Concentration trends in Europe
 Concentration trends in Europe Professor Tommaso Valletti Chief Competition Economist, DG COMP Disclaimer: The views expressed are those of the authors and cannot be regarded as stating an official position
Session 4. Growth. The World Economy Share of Global GDP Year 2011 (PPP)
") Session 4. Growth Stylized Facts on Standards of Living across Countries Characterizing Growth over 1 Years: The US Economy Growth Dynamics of the G7 Countries and the OECD Economies Characterizing Growth
Session 4. Growth Stylized Facts on Standards of Living across Countries Characterizing Growth over 1 Years: The US Economy Growth Dynamics of the G7 Countries and the OECD Economies Characterizing Growth
Grasshoppers, Ants and Locusts: the future of the world economy
 Ralph Miliband Series on the Restructuring of World Power Grasshoppers, Ants and Locusts: the future of the world economy Martin Wolf Associate editor and chief economics commentator, Financial Times Professor
sector: recent developments VÍTOR CONSTÂNCIO
 The economy and the banking sector: recent developments VÍTOR CONSTÂNCIO January 2006 Recent performance of the economy and prospects Factors behind the period of slow growth Challenges to the Banking
Impacts of the Global Economy on Asia Pacific Travel. 29 June 2007 John Walker
 Impacts of the Global Economy on Asia Pacific Travel 29 June 2007 John Walker jwalker@oxfordeconomics.com Oxford Economics Founded in 1981 Over 300 clients including blue chip companies and government
Distributional National Accounts: Methods and Estimates for the United States
 Distributional National Accounts: Methods and Estimates for the United States Thomas Piketty (PSE) Emmanuel Saez (UC Berkeley) Gabriel Zucman (UC Berkeley) November 2016 There is a large disconnect today
The Rise of China and Breaking out the Middle- Income Trap in Latin America and the Caribbean countries: A New Structural Economics Approach
 The Rise of China and Breaking out the Middle- Income Trap in Latin America and the Caribbean countries: A New Structural Economics Approach Justin Yifu Lin Senior Vice President and Chief Economist The
Figure 1: Gini coefficient
 0.50 Figure 1: Gini coefficient Gini coefficient 0.45 0.40 0.35 0.30 All Workers Men Women 1940 1950 1960 1970 1980 1990 2000 Source: Kopczuk, Saez, Song QJE'10: Wage earnings inequality Year Top 10% Pre-
A New Gilded Age? Recent Trends in Top Income Shares in Canada
 A New Gilded Age? Recent Trends in Top Income Shares in Canada Mike Veall veall@mcmaster.ca Thanks to many at Statistics Canada, but especially André Bernard, Brian Murphy, Eric Olson, Paul Roberts, Habib
Macroeconomics Measurements
 Macroeconomics Measurements Thomas Chaney Sciences Po Thomas Chaney (Sciences Po) Macroeconomics Measurements 1 / 33 Housekeeping issues Instructor: Thomas Chaney (myself) Email: thomas.chaney@gmail.com
Canada s Standard of Living in 2042: Will Policy Keep Pace with Technology?
 Carleton University, Ottawa March 2-4, 2017 Canada s Standard of Living in 2042: Will Policy Keep Pace with Technology? Christopher Gunn, Carleton University Hashmat Khan, Carleton University Conference
Happiness trends in 24 countries,
 Happiness trends in 4 countries, 1946-006 The following graphs shows the trends in happiness levels found in 4 countries, using comparable data from all available surveys for countries having at least
Economic Outlook March Economic Policy Division
 Economic Outlook March 212 Economic Policy Division Real GDP Outlook Percent Change, Annual Rate 2 1 1 - -1 197 197 198 198 199 199 2 2 21 U.S. GDP Actual and Potential Quarterly, Q1 197 to Q4 211 Real
Great Depressions of the Twentieth Century Project
 Great Depressions of the Twentieth Century Project Timothy J. Kehoe and Edward C. Prescott www.greatdepressionsbook.com Cole and Ohanian, The Great Depression in the United States from a Neoclassical Perspective,
The structure of the euro area recovery
 The structure of the euro area recovery Rolf Strauch, Chief Economist JPMorgan Investor Seminar, IMF Annual Meetings Washington, October 2017 The euro area: a systemic player in global trade Trade openness
Henley Global Masterclasses 2017 Henley Business School, Greenlands, Henley-on-Thames Friday 12 May 2017
 The End of the Golden Era for Global Investing Prof Sotiris Tsolacos International Capital Markets Association (ICMA) Centre and School of Real Estate & Planning Henley Global Masterclasses 2017 Henley
Assessing Australia s Innovative Capacity in the 21 st Century
 Assessing Australia s Innovative Capacity in the 21 st Century Professor Joshua Gans MBS & IPRIA University of Melbourne November, 2003 This presentation is based on the National Innovative Capacity Project,
RBC Economics Financial Update Dawn Desjardins
 RBC Economics Financial Update Dawn Desjardins CICA/RBC Q4 2011 Business Monitor Economic Results Overview Business and Economic Optimism Begin to Stablize 100 % 80 % 60 % 40 % 20 % 0 % National Optimism
College/high school median annual earnings gap,
 College/high school median annual earnings gap, 1979 2012 In constant 2012 dollars 70,000 dollars Household gap $30,298 to $58,249 60,000 50,000 40,000 Male gap $17,411 to $34,969 30,000 20,000 10,000
2016 LERA Winter Meetings Inequality in Japan Session. Top Income Shares and Income Mobility in Japan. Chiaki Moriguchi*
 2016 LERA Winter Meetings Inequality in Japan Session Top Income Shares and Income Mobility in Japan Chiaki Moriguchi* chiaki@ier.hit-u.ac.jp Institute of Economic Research, Hitotsubashi University Second
The Eurozone integration, des-integration and possible future developments
 The Eurozone integration, des-integration and possible future developments 18 th Monetary Policy Workshop at the Berlin School of Economcs and Law, 12 13 October 2017 Overview Position 1: The euro itself
It s the economy stupid!
 It s the economy stupid! (and it doesn t have to be this way!) October 28, 2011 Alameda, CA Sylvia A. Allegretto, PhD Center on Wage & Employment Dynamics University of California, Berkeley The critical
The Herzliya Indices. National Security Balance The Civilian Quantitative Dimension. Herzliya Conference Prof. Rafi Melnick, IDC Herzliya
 The Herzliya Indices National Security Balance The Civilian Quantitative Dimension Herzliya Conference 2015 Prof. Rafi Melnick, IDC Herzliya 1990 1991 1992 1993 1994 1995 1996 1997 1998 1999 2000 2001
The Economy of Finland
 The Economy of Finland Aug 30st 2013, Finnish Ministry of Foreign Affairs Presentation for the American Fulbright Grantees Petteri Rautaporras, Economist at the Federation of Finnish Technology Industries
Outline. Overview of globalization. Global outlook for real economic activity & inflation. Risks to the outlook
 2017 International Economic Outlook Everett Grant Research Economist Globalization & Monetary Policy Institute Federal Reserve Bank of Dallas October 2017 The views expressed are those of the author and
The productivity puzzle: why improving labour productivity is critical for Europe s economic (and political) stability
 stability") The productivity puzzle: why improving labour productivity is critical for Europe s economic (and political) stability P. Subacchi, M. Colagrossi Nomura Foundation Macro Economy Research Conference PRODUCTIVITY,
The productivity puzzle: why improving labour productivity is critical for Europe s economic (and political) stability P. Subacchi, M. Colagrossi Nomura Foundation Macro Economy Research Conference PRODUCTIVITY,
India: Can the Tiger Economy Continue to Run?
 India: Can the Tiger Economy Continue to Run? India s GDP is on the rise US$ trillions Nominal GDP (left axis) GDP growth (right axis) 3.0 2.5 2.0 1.5 1.0 0.5 0.0 1990 1992 1994 1996 1998 2000 2002 2004
Airlines, the economy and air transport demand
 Airlines, the economy and air transport demand Brian Pearce, Chief Economist, IATA www.iata.org/economics Airline Industry Economics Advisory Workshop 2016 1 Returns for airlines investors lower this year;
Deficit Reduction and Economic Growth: Are They Mutually Exclusive Goals? Tuesday, May 1, 2012; 2:30 PM - 3:45 PM
 Deficit Reduction and Economic Growth: Are They Mutually Exclusive Goals? Tuesday, May 1, 2012; 2:30 PM - 3:45 PM Moderator: Gillian Tett, U.S. Managing Editor, Financial Times Speakers: Jared Bernstein,
Taxation, Globalization and the Welfare State. Sven Steinmo University of Colorado
 Taxation, Globalization and the Welfare State Sven Steinmo University of Colorado Former Social Democratic Chancellor of Germany, Helmut Schmidt The welfare state is such a good idea (but given globalization)
BC Pension Forum. Economic Outlook. Presented by: Ben Homsy, CFA Portfolio Manager
 BC Pension Forum Economic Outlook Presented by: Ben Homsy, CFA Portfolio Manager 1694 1704 1713 1723 1732 1741 1751 1760 1770 1779 1788 1798 1807 1817 1826 1836 1845 1854 1864 1873 1883 1892 1901 1911
The Shifts and the Shocks Martin Wolf, Associate Editor & Chief Economics Commentator, Financial Times
 The Shifts and the Shocks Martin Wolf, Associate Editor & Chief Economics Commentator, Financial Times Peterson Institute for International Economics 9 th October 2014 Washington DC The Shifts and the
The Economic Outlook. Economic Policy Division
 The Economic Outlook Economic Policy Division Glass Half Full Six years of steady growth Real GDP Outlook Percent Change, Annual Rate 10 5 0-5 -10 1980 1985 1990 1995 2000 2005 2010 2015 Glass Half Full
RISI LATIN AMERICAN CONFERENCE. (São Paulo, 16 August 2016) The Latin American Economy: Some Successes, Many Disappointments
 The Latin American Economy: Some Successes, Many Disappointments") RISI LATIN AMERICAN CONFERENCE (São Paulo, 16 August 2016) The Latin American Economy: Some Successes, Many Disappointments Andrea Boltho Magdalen College University of Oxford and Oxford Economics GDP
RISI LATIN AMERICAN CONFERENCE (São Paulo, 16 August 2016) The Latin American Economy: Some Successes, Many Disappointments Andrea Boltho Magdalen College University of Oxford and Oxford Economics GDP
Assessing household balance sheet and risks three challenges 1
 IFC Satellite meeting at the ISI Regional Statistics Conference on Is the household sector in Asia overleveraged: what do the data say? Kuala Lumpur, Malaysia, 15 November 2014 Assessing household balance
A record Quarter and Year for the Group
 14 January 2019 2018 and FY18 Trading Update Steve Ingham Kelvin Stagg Chief Executive Officer Chief Financial Officer A record Quarter and Year for the Group LSE: PAGE.L Website: http://www.page.com/investors
This Time is Different: Eight Centuries of Financial Folly
 This Time is Different: Eight Centuries of Financial Folly Carmen M. Reinhart, University of Maryland, NBER, and CEPR Kenneth S. Rogoff, Harvard University and NBER (Princeton University Press, forthcoming
Economic & Financial Market Outlook
 Economic & Financial Market Outlook BC Pension Forum March 1, 2013 Chris Lawless, Chief Economist Overview Global forces Recent economic performance ~ US, Europe, Japan, China ~ Other emerging markets
The U.S. Economic Recovery: Why so weak and what should be done? William J. Crowder Ph.D.
 The U.S. Economic Recovery: Why so weak and what should be done? William J. Crowder Ph.D. Weak Recovery? It s no secret that the U.S. economy has still not fully recovered from the financial crisis and
The Great Convergence: China, India and the new global economy. Mark Thirlwell Program Director, International Economy July 2006
 The Great Convergence: China, India and the new global economy Mark Thirlwell Program Director, International Economy July 2006 India Two views of the largest economies in 2005 Top 12 economies by GDP,
Global growth forecasts Key countries/regions,
 Global growth forecasts Key countries/regions, 2014-2018 Percent 7 6 5 4 3 2 1 0 Developing Asia Sub-Saharan Africa Middle East and North Africa Latin America and the Caribbean United States Euro area
A Giant Producer, & An Emerging Giant Consumer/Investor. Hong Liang
 A Giant Producer, & An Emerging Giant Consumer/Investor China s Role in Global Trade and Investment Hong Liang Chief Economist, Head of Research October, 2016 I China: A global manufacturing power house,
Puget Sound Regional Forecast Chris Mefford Community Attributes
 2015 Puget Sound Regional Forecast Chris Mefford Community Attributes 3 1,000s The Regional Economy has added jobs consistently for nearly 5 full years. In a few months, this will be the longest streak
Federal Reserve Bank of Dallas, FIRM (Financial Institution Relationship Management)
") The Economic Roller Coaster: Where Have We Been? And Where Are We Going? Thomas F. Siems, Ph.D. Senior Economist and Director of Economic Outreach Federal Reserve Bank of Dallas Economic Summit Dallas
The Economic Roller Coaster: Where Have We Been? And Where Are We Going? Thomas F. Siems, Ph.D. Senior Economist and Director of Economic Outreach Federal Reserve Bank of Dallas Economic Summit Dallas
Outlook 2008/09 Life In the Aftermath of the Great Global Credit Crisis. May 8 th, Presented by:
 Outlook 2008/09 Life In the Aftermath of the Great Global Credit Crisis May 8 th, 2008 Presented by: Patricia Croft, Vice President & Chief Economist Phillips, Hager & North Investment Management Limited
16. Key Facts about Long Run Economic Growth
 Fletcher School, Tufts University 16. Key Facts about Long Run Economic Growth E212 Macroeconomics Prof. George Alogoskoufis How we Measure and Compare Living Standards Living standards are usually measured
MONETARY AND FISCAL POLICIES DURING THE NEXT RECESSION
 OXYGEN EVENTS CONFERENCE GALA PERFORMANCE 2017 MONETARY AND FISCAL POLICIES DURING THE NEXT RECESSION - THE CASE OF ROMANIA - Ph.D. Andrei RĂDULESCU Senior Economist, Banca Transilvania Researcher, Institute
National Transfer Accounts in Mexico
 National Transfer Accounts in Mexico Policy implications: labor market Iván Mejía Guevara imejiag@stanford.edu Stanford University 12th Global Meeting of the NTA Network, Mexico City, July 23-27, 2018
To receive a Certificate of Completion, please provide information requested in the session sign-in sheet for each session attended
 Welcome Session A1 Tourism Basics: How to Understand and Benefit from Domestic and International Tribal Tourism Research and Data Tuesday, September 18, 2018 10:30am - 12:00pm To receive a Certificate
Household Wealth: Panel Study of Income Dynamics (Thousands of 1999 dollars)
") Household Wealth: Panel Study of Income Dynamics (Thousands of 1999 dollars) Business 26.6 0.0 12.2% 217.8 62.5 30.9 0.0 13.4% 230.9 53.8 Checking / Savings 19.5 3.2 80.8% 24.2 6.4 23.9 3.4 81.2% 29.4
Household Wealth: Panel Study of Income Dynamics (Thousands of 1999 dollars) Business 26.6 0.0 12.2% 217.8 62.5 30.9 0.0 13.4% 230.9 53.8 Checking / Savings 19.5 3.2 80.8% 24.2 6.4 23.9 3.4 81.2% 29.4
The U.S. Economic Outlook
 The U.S. Economic Outlook Presented to: Maquiladora Industry Outlook Conference September 29 2006 Presented by: Patrick Newport Principal, U.S. Macroeconomic Service 781-301-9125 patrick.newport@globalinsight.com
Macroeconomic Imbalances in
 Macroeconomic Imbalances in the Euro Area Jürgen von Hagen Rome, 21 May 2011 Europe: Growing imbalances within, balanced without 8 6 4 2 0-2 -4-6 10 Figure 1A: Current Account Balances IE EL FR FI IT SE
First Lecture Capitalism: A Brief History
 Nitzan / 3270 GPE I I. Capitalism: A Brief History / 1 First Lecture Capitalism: A Brief History Definition Economic system? Private ownership / profit motive / wage labour Beginnings 16 th century: Feudal
Rossana Merola ILO, Research Department
 Raising tax revenues without harming equity and employment Rossana Merola ILO, Research Department G-24 Special Workshop on Growth and Reducing Inequality Geneva, 5 th - 6 th September 2017 The views expressed
THE ICELANDIC ECONOMY AN IMPRESSIVE RECOVERY BUT WHAT CHALLENGES LIE AHEAD?
 THE ICELANDIC ECONOMY AN IMPRESSIVE RECOVERY BUT WHAT CHALLENGES LIE AHEAD? FROM BUST TO BOOM. AN EPIC BUST After 16 years of growth with a short pause for breath in 2002, the Icelandic economy entered
The outlook: what we know, the known unknowns and the unknown unknowns
 The outlook: what we know, the known unknowns and the unknown unknowns 24 April 2017 Seoul Brian Pearce, Chief Economist, IATA www.iata.org/economics Airline Industry Economics Advisory Workshop 2016 1
Stocks and Bonds Track Aging Population:
 Stocks and Bonds Track Aging Population: 1952-2008 8 85.00% 7 6 5 4 3 2 1 Correlation: 93% Stocks and Bonds as a Percentage of Household Liquid Financial Assets (left scale) Population 35 Years and Over
Peter Ch. Löschl, ABA Invest in Austria June Austria Investment Climate Reasons to Invest in Austria - Perspectives
 Peter Ch. Löschl, ABA Invest in Austria June 2016 Austria Investment Climate Reasons to Invest in Austria - Perspectives Strong Economy in the Heart of Europe Area: 83,872 km² People: 8.5 m. GDP growth:
The U.S. & Global Economic Outlook Greg Ip, U.S. Economics Editor, The Economist Remarks to The American Sportfishing Association
 The U.S. & Global Economic Outlook Greg Ip, U.S. Economics Editor, The Economist Remarks to The American Sportfishing Association Hilton Head, S.C. Oct. 9, 2012 How We Got Here Great Moderation = More
An early warning system to predict house price bubbles
 An early warning system to predict house price bubbles Christian Dreger, Konstantin Kholodilin DIW Berlin Why is the topic relevant? Bubbles in housing prices can impede the real economic evolution Prices
The Aftermath of Global Financial Crises
 The Aftermath of Global Financial Crises Carmen M. Reinhart, University of Maryland, NBER, and CEPR Brookings Institution Washington DC, April 20, 2009 This talk is based on several works with Kenneth
Facing the Crisis in Southern Europe: Demographic, Political and Social Service Dilemmas
 Facing the Crisis in Southern Europe: Demographic, Political and Social Service Dilemmas Manuel Aguilar Hendrickson Universitat de Barcelona manuel.aguilar.hendrickson@ub.edu The Roatch Lecture The Roatch-Haskell
URBAN LAND INSTITUTE
 URBAN LAND INSTITUTE 2012 ULI FALL MEETING (Denver, 18 October 2012) The Global Economic Outlook Dark clouds on the horizon Andrea Boltho Magdalen College University of Oxford Oxford Economics and REAG
III. Importance of Revenue Administration
 Outline of Presentation I. Trends in Revenue Mobilization II. Growth Friendly Tax Policy III. Importance of Revenue Administration 2 I. Trends in Revenue Mobilization Trends in Overall Revenues - Median
US imports from emerging economies have grown rapidly
 US imports from emerging economies have grown rapidly Ratio to GDP (current dollars) 0.07 US merchandise imports, 1978 2008 0.06 0.05 0.04 0.03 0.02 Industrial Non-OPEC other 0.01 0 OPEC = Organization
U.S. Overview. Gathering Steam? Tuesday, October 1, 2013
 U.S. Overview Gathering Steam? Tuesday, October 1, 2013 Uneven global economic recovery Annual real GDP growth projections (%) Projections 2013 2014 World 3.1 3.1 3.8 United States 2.2 1.7 2.7 Euro Area
The international. ski market
 LV/18/05/2014 Abstract The international ski market Presentation to ISIA Congress 17 May 2014 - Vuokatti Market metrics Skier : one person practising ski, snowboard or other downhill slide, independent
Commodity Endowment Funds
 Commodity Endowment Funds Moscow March 9-10 Roberts L. Grava Jennifer Johnson-Calari World Bank rgrava@worldbank.org jjohnsoncalari@worldbank.org Challenges of managing commodity revenues Macro issues
JOINT INDUSTRY FORECAST
 JOINT INDUSTRY FORECAST January 2018 10-YEAR GOALS NET NEW JOBS CAPITAL INVESTMENT PER CAPITA INCOME Current: 144,599 Current: $8.9B Current: 24.4% Goal: 150,000 Pace: 184,594 Goal: $8B Pace: $11.1B Goal:
By making use of SAFRIM (South African Inter-Industry Macro-Economic Model) By Jeaunes Viljoen, Conningarth Economists, 1
 By Jeaunes Viljoen, Conningarth Economists, 1") By making use of SAFRIM (South African Inter-Industry Macro-Economic Model) By Jeaunes Viljoen, Conningarth Economists, South Africa 10/13/2011 1 1960: The economy experienced high growth rates mining
By making use of SAFRIM (South African Inter-Industry Macro-Economic Model) By Jeaunes Viljoen, Conningarth Economists, South Africa 10/13/2011 1 1960: The economy experienced high growth rates mining
Spanish Financial System: Main Features
 Spanish Financial System: Main Features Amaya Altuzarra, Jesus Ferreiro, Catalina Gálvez, Carmen Gómez, Ana González, Patricia Peinado, Carlos Rodríguez, Felipe Serrano Department of Applied Economics
Spring Press Conference February 23, Name of chairman
 Spring Press Conference February 23, 2006 Disclaimer This presentation contains forward looking statements which reflect Management s current views and estimates. The forward looking statements involve
Global economy s strong momentum intact despite elevated level of uncertainty. Canada headed for another year of solid growth
 ECONOMICS I RESEARCH Global economy s strong momentum intact despite elevated level of uncertainty Canada headed for another year of solid growth Dawn Desjardins (Deputy Chief Economist) (416) 974-6919
Korea s Education Reform. Ju Ho Lee, KDI School
 Korea s Education Reform Ju Ho Lee, KDI School Table of Contents I. Virtuous Circle II. Number One in Human Capital? III. Education Bubbles IV. Education reform V. Powerhouse of Global Talents Socio-Economic
Oil Crises and Climate Challenges 30 Years of Energy Use in IEA Countries
 Crises and 30 Years of Energy Use in IEA Countries Fridtjof Unander, International Energy Agency ISED Meeting, UN, 13 September 2004 Aim of the Study Review of trends in energy use and CO 2 emissions since
The U.S. Economy How Serious A Downturn? Nigel Gault Group Managing Director North American Macroeconomic Services
 The U.S. Economy How Serious A Downturn? Nigel Gault Group Managing Director North American Macroeconomic Services Growth Is Cooling; But a Soft Landing Is Likely (Real GDP, annualized rate of growth)
Global economic cycle has slowed
 Year-on-year % change Confidence index, 50= no change Global economic cycle has slowed 25% 70 20% International trade growth 65 15% 10% Industrial production growth 60 5% 55 0% 50-5% Business confidence
Outlook for airline markets and industry performance
 Outlook for airline markets and industry performance June 2016 Brian Pearce Chief Economist International Air Transport Association % change over previous year Confidence index. 50 = no change The already
Can Manufacturing Still be a Driver of
 Can Manufacturing Still be a Driver of Inclusive Growth? Robert Z Lawrence Albert L Williams Professor of Trade and Investment Harvard Kennedy School Senior Fellow, MasterCard Center for Inclusive Growth
Building on Kyoto: Towards a Realistic Global Climate Change Agreement and What Australia Should Do
 Building on Kyoto: Towards a Realistic Global Climate Change Agreement and What Australia Should Do Warwick J. McKibbin & Peter J. Wilcoxen ANU Public Lecture, 3 July 2008 Overview Climate Science Lessons
The Australia US FTA: implications for international education
 The Australia US FTA: implications for international education Prepared for The Path to Cultural Understanding and Development 18th IDP Australian International Education Conference, Sydney 5-8 October
The Western Heritage Since th Edition, AP Edition 2014
 A Correlation of The Western Heritage Since 1300 11th Edition, AP Edition 2014 Advanced Placement Course Topic Outline AP is a trademark registered and/or owned by the College Board, which was not involved
Complete Streets 101: The Basics
 Complete Streets 101: The Basics Michigan Municipal League - Capital Conference March 21, 2017 Chip Smith, AICP - Senior Planner - Wade Trim Inc. and City Council member City of Ann Arbor 2017 MML Capital
Chief Economist s Report
 Chief Economist s Report 22 February 2017 IATA Legal Symposium, Washington Brian Pearce Chief Economist, IATA Airline Industry Economics Advisory Workshop 2016 1 Themes 1. World economy still stuck on
Living with limits: growth, resources and climate change Martin Wolf, Associate Editor & Chief Economics Commentator, Financial Times
 Living with limits: growth, resources and climate change Martin Wolf, Associate Editor & Chief Economics Commentator, Financial Times Grantham Institute for Climate Change Annual Lecture 2011 3 rd November
Austria: Key Economic Features
 Austria: Key Economic Features and EU Guanghua School of Management Josef Christl, Macro-Consult 16. Oktober 2017 Austria: a small, but rich country Population, mn. GDP per capita PPP, USD 1600 60000 1400
Market Update. Randy Tinseth Vice President, Marketing Boeing Commercial Airplanes. Copyright 2016 Boeing. All rights reserved.
 Market Update The statements contained herein are based on good faith assumptions are to be used for general information purposes only. These statements do not constitute an offer, promise, warranty or
A Primer on Factors Affecting Farmland Values
 A Primer on Factors Affecting Farmland Values Federal Reserve Bank of Chicago David Oppedahl Business Economist 312-322-6122 david.oppedahl@chi.frb.org The economy hit bottom in June 2009, with hesitant
Avoiding the Blind Alley China s Economic Overhaul and its Global Implications
 Avoiding the Blind Alley China s Economic Overhaul and its Global Implications Daniel Rosen Partner dhrosen@rhg.com NYU Stern China Research Luncheon New York December 1, 2014 10 East 40 th Street, Suite
Comment on: Productivity Growth, Wage Growth and Unions by Kügler, Schönberg and Schreiner
 Comment on: Productivity Growth, Wage Growth and Unions by Kügler, Schönberg and Schreiner Michael C. Burda Humboldt-Universität zu Berlin, CEPR and IZA ECB Forum Sintra, 20 June 2018 What this paper does
Turkey: Recent Developments and Future Prospects. ISBANK Economic Research Division November 2018
 Turkey: Recent Developments and Future Prospects ISBANK Economic Research Division November 2018 Macroeconomic Outlook Strong Economic Growth Cycle GDP of 851 bn USD (2017), 10.6k USD (2017) per capita
Poland: Europe s economic outperformer. Piotr Bujak Chief Economist at Nordea Bank Polska PKO Bank Polski Group. Copenhagen, 29 April 2014
 Poland: Europe s economic outperformer Piotr Bujak Chief Economist at Nordea Bank Polska PKO Bank Polski Group Copenhagen, 29 April 2014 Poland crisis-proof economic front-runner 300 250 200 % Cumulated
A Financial Systems Resilience Index for South Africa: Joining the Twin Peaks
 A Financial Systems Resilience Index for South Africa: Joining the Twin Peaks Professor Christine Oughton SOAS University of London co12@soas.ac.uk KEY ISSUES FOR EFFECTIVE MACROPRUDENTIAL POLICYMAKING