The economic value of the EU shipping industry. Andrew P Goodwin
|
|
|
- Lauren Gordon
- 6 years ago
- Views:
Transcription


1 The economic value of the EU shipping industry Andrew P Goodwin 2 nd April 2014
2 Introduction

 90% IMO estimate of the value of world trade")
3 Shipping is a vital facilitator of world trade 135 % Increase in world GDP in the last two decades 180 % Increase in world seaborne trade over the same period 3.5 trillion Value of EU s trade with the rest of the world in /6 EU share of world goods trade (external trade flows with RoW) 90% IMO estimate of the value of world trade carried by sea 3
4 Study objectives 1. Analyse the recent evolution of the EU fleet 2. Assess the economic contribution of the shipping industry Directly Through its European supply chain Through the spending of workers and those in the supply chain 3. Estimate the impact of measures permitted under the Community guidelines on state aid to maritime transport 4. Review the contribution of maritime academies 4
 Service and offshore support vessels (e.g.")
 Towage and")
5 Definitions The shipping industry Transport of goods by sea (containerised and non-containerised) Transport of persons by sea (on ferries and cruise ships) Service and offshore support vessels (e.g. ships laying or repairing undersea cables or pipelines; prospecting for oil; conducting oceanographic research; diving assistance; undertaking undersea work; servicing offshore wind farms, oil and gas platforms) Towage and dredging at sea The EU + 5
6 The EU fleet
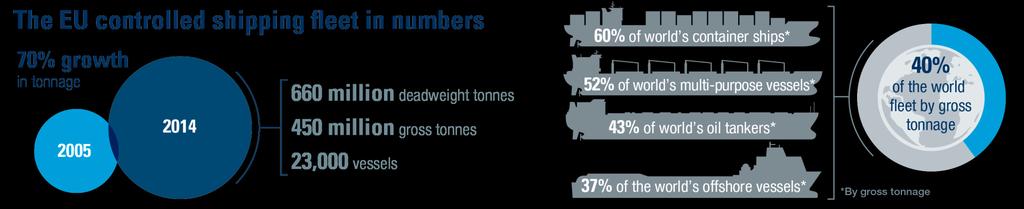
7 Between the start of 2005 and the start of 2014, EU controlled tonnage expanded by more than 70 per cent Position on 1 Jan Index, 2005= m GT 660m DWT 23,000 vessels Source: Clarkson Research Services Ltd. Number of vessels Gross tonnage Deadweight tonnage 7
8 The EU controls 40 per cent of world gross tonnage and 39 per cent of world deadweight tonnage 45 Per cent Number of vessels Gross tonnage Deadweight tonnage Source: Clarkson Research Services Ltd. 8
9 Greece has the largest controlled fleet within Europe, equivalent to 36 per cent of gross tonnage. Germany represents a further 21 per cent Greece Germany Norway Italy Denmark UK Netherlands France Belgium Sweden Cyprus Finland Spain Poland Croatia Other Gross tonnage (millions) Deadweight tonnage (millions) Source: Clarkson Research Services Ltd. 9


10 The EU controlled fleet is dominated by three types of vessel LNG & LPG Roll-on, Roll-off Ferries Cruise Other Chemical tankers Pure car carriers Bulkers Multi-purpose vessels Offshore 28% Container ships 25% 25% Oil tankers Source: Clarkson Research Services Ltd. 10
11 Whilst the EU controls 40 per cent of the world fleet overall, the share is much greater for some types of vessel Roll-on, Roll-off Container ships Ferries Multi-purpose vessels Oil tankers Chemical tankers Offshore Bulkers Pure car carriers LNG & LPG Cruise EU as % of world gross tonnage Other Source: Clarkson Research Services Ltd. Average 11
12 The strongest growth between 2005 and 2014 was recorded amongst offshore vessels. The EU now controls 37 per cent of the world offshore fleet % change in gross tonnage, Offshore Container ships LNG & LPG Cruise Bulkers Pure car carriers Oil tankers Chemical tankers Ferries Multi-purpose vessels Roll-on, Roll-off Other Source: Clarkson Research Services Ltd. 12


 DWT, 000s (right scale) Source:")
13 per cent of the world fleet was under the flag of an EU country in % million DWT As % of world (left scale) DWT, 000s (right scale) Source: UNCTAD 13
14 Eight of the top 25 largest operated fleets in the world belong to EU countries. Three EU countries are in the top five Japan Greece China Germany Denmark South Korea U.S.A. Singapore Hong Kong Taiwan Switzerland Norway Bermuda U.K. France Italy Turkey Canada Russia India Indonesia Malaysia Sweden Brazil Iran Source: IHS Fairplay Gross tonnage (millions)
15 Economic impact analysis
16 The study assesses the economic impact of the EU shipping industry across three channels Direct impact e.g. Freight services Passenger services Towing & dredging Service and offshore support activities Renting and leasing Indirect impact e.g. Ship building Ship repairs Port services Insurance Shipping-related financial and legal services, etc. Induced impact e.g. Food and beverages Other consumer goods Restaurants Recreation services etc. Total economic impact 16
17 The economic contribution of shipping has been assessed across three metrics Gross value added contribution to GDP The contribution to the economy of each individual producer, industry or sector. Aggregated across all industries to form the basis of GDP Employment Measured on a headcount basis Tax revenues Employee income taxes Employee and employer social security contributions Tonnage and corporation tax VAT on employees consumption

18 The study has drawn on existing research, official statistics and the Oxford Economics Global Input-Output model Direct impact Previous national studies Eurostat national accounts and Structural Business Statistics datasets Estimation to align time periods and sector definitions Indirect impact Induced impact Oxford Economics Global Input-Output model Impact of the shipping industry on firms in its supply chain Induced impact of spending by shipping industry employees and those in the supply chain Estimates impacts that occur within countries, and crosscountry impacts amongst other EU countries


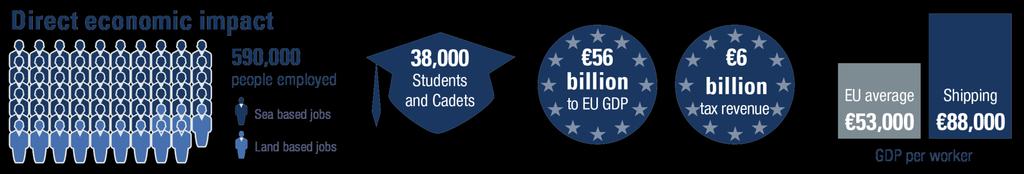
19 The EU shipping industry is estimated to have directly employed 590,000 people in 2012 This means shipping employs more people than Travel agents & tour operators Forestry & logging Air transport 530, , ,000 19
20 Almost two-thirds of shipping employees are employed in freight transport 400, , , , , , , , ,000 50,000 0 Freight transport (incl. towing & dredging) Passenger transport 54,000 Service & offshore support vessels 7,000 Renting & leasing Source: Oxford Economics 20


21 In 2012, the EU shipping industry is estimated to have directly contributed 56 billion to EU GDP 47bn to EU GDP in % 56bn to EU GDP in GDP per worker EU average 53,000 Shipping 88,000 Water supply 86,000 Film & TV 84,000 Air transport 71,000 Land transport 44,000 21
22 The total GDP contribution of the European shipping industry in 2012 is estimated to have been 145 billion bn 145bn Direct Indirect Induced Total Source: Oxford Economics 22
23 The shipping industry also supported employment for an estimated 2.3 million people 2, s 2.3m 2, ,500 1,000 1,126 1, Direct Indirect Induced Total Source: Oxford Economics 23


24 The shipping industry has significant multiplier effects across the wider EU economy 1m 1.6m For every 1 million the shipping industry contributes to GDP itself, it creates another 1.6 million elsewhere in the economy For every direct job the shipping industry creates, another 2.8 are created elsewhere in the EU economy 24
25 The shipping industry supported total tax revenues of around 41 billion in 2012 Tax revenues estimated bn 41bn Employee income taxes Employee and employer social security contributions Tonnage and corporation tax VAT on employees consumption Direct Indirect Induced Total Source: Oxford Economics 25
26 The impact of measures permitted under the Commission s guidelines on state aid to maritime transport


27 Over and above its role in facilitating trade, the shipping industry has a number of unique features and wider benefits for the EU Inherent mobility Core of the wider maritime cluster Security of energy supply Military support & peacekeeping Safety standards Trained seafarers 27
28 The UK introduced a tonnage tax in By 2012 the UK controlled fleet had more than tripled in size 40,000 35,000 30,000 25,000 20,000 15,000 10,000 5,000 DWT (000s) No tonnage tax Tonnage tax 0 Controlled fleet Source: UK Chamber of Shipping, Oxford Economics 28
29 The UK introduced a tonnage tax in By 2012 the UK controlled fleet had more than tripled in size 40,000 35,000 30,000 25,000 20,000 DWT (000s) No tonnage tax Tonnage tax 15,000 10,000-85% 5,000 0 Controlled fleet Controlled fleet, 'No state aid' scenario Source: UK Chamber of Shipping, Oxford Economics 29
30 France introduced a tonnage tax in 2003, and simplified its social security exemptions in ,000 DWT (000s) No tonnage tax Tonnage Tax 10,000 8,000 6,000-61% 4,000 2,000 0 Controlled fleet Controlled fleet, 'No state aid' scenario Source: ISL Bremen; counter-factual scenario estimated by Oxford Economics 30
31 Germany introduced a tonnage tax and a separate wage retention scheme in , ,000 DWT (000s) No tonnage tax Tonnage tax 100,000 80,000-68% 60,000 40,000 20,000 0 Controlled fleet Controlled fleet, 'No state aid' scenario Source: ISL Bremen; counter-factual scenario estimated by Oxford Economics 31


32 Sweden introduced social security and income tax incentives in 2001, but has not introduced a tonnage tax 8,000 Flagged fleet, 000 DWT Controlled fleet, 000 DWT 25,000 7,000 6, % of world fleet under Swedish flag 20,000 5,000 4, % of world fleet under Swedish flag 15,000 3,000 10,000 2,000 1,000 5, Flagged fleet (left scale) Controlled fleet (right scale) Source: UNCTAD, ISL Bremen 32

 Employment Employment")
33 Applying this approach to nine countries suggests the economic contribution of the EU shipping industry could have been 50 per cent lower in 2012 without state aid measures 160,000 GVA, m Employment 2,500, , , ,000 80,000 60,000 40,000 20,000 Induced Indirect Direct 2,000,000 1,500,000 1,000, ,000 0 Source: Oxford Economics GVA GVA (counterfactual) Employment Employment (counterfactual) 0 33
34 The contribution of maritime academies


35 It is estimated that there were around 38,000 students/cadets in maritime academy type training across the EU and Norway in % since
36 Summary


37 37 The economic value of the EU shipping industry
Global Construction Outlook: Laura Hanlon Product Manager, Global Construction Outlook May 21, 2009
 Global Construction Outlook: Short-term term Pain, Long-term Gain Laura Hanlon Product Manager, Global Construction Outlook May 21, 2009 What This Means for You The world is set to be hit this year with
Business opportunities in Turkish Maritime Industry Marco Rensma Director MEYS Emerging Markets Research Istanbul, 24 May 2012
 Business opportunities in Turkish Maritime Industry Marco Rensma Director MEYS Emerging Markets Research Istanbul, 24 May 2012 Content presentation 1. Introduction MEYS Emerging Markets Research 2. Global
Economic Outlook March Economic Policy Division
 Economic Outlook March 212 Economic Policy Division Real GDP Outlook Percent Change, Annual Rate 2 1 1 - -1 197 197 198 198 199 199 2 2 21 U.S. GDP Actual and Potential Quarterly, Q1 197 to Q4 211 Real
THE WORLD COMPETITIVENESS SCOREBOARD 2011
 THE WORLD COMPETITIVENESS SCOREBOARD 2011 98.557 94.063 92.588 92.011 90.782 90.219 89.259 87.824 86.475 86.418 86.313 85.707 84.380 84.120 81.629 81.619 81.100 80.278 79.799 78.499 77.599 77.101 76.827
INTERTANKO Asian Panel. MD s Report. Hong Kong October International Association of Independent Tanker Owners
 INTERTANKO Asian Panel MD s Report Hong Kong October 2018 International Association of Independent Tanker Owners A true Members Association FORUM for Members to meet and share information and best practice
Global economic cycle has slowed
 Year-on-year % change Confidence index, 50= no change Global economic cycle has slowed 25% 70 20% International trade growth 65 15% 10% Industrial production growth 60 5% 55 0% 50-5% Business confidence
Max Sort Sortation Option - Letters
 Max Sort Sortation Option - Letters Western Europe Prices Product Code PS5 PS6 Austria* 0.330 7.550 0.330 7.400 Belgium* 0.370 3.700 0.370 3.540 Denmark* 0.620 5.350 0.620 4.215 Finland* 0.385 4.400 0.385
Lithuanian export: is it time to prepare for changes? Aleksandr Izgorodin Expert
 Lithuanian export: is it time to prepare for changes? Aleksandr Izgorodin Expert Export is the main locomotive behind growth in LT economy Lithuania: change in real GDP and its components, % 78,2 71,8
AREA TOTALS OECD Composite Leading Indicators. OECD Total. OECD + Major 6 Non Member Countries. Major Five Asia. Major Seven.
 Reference series Composite leading indicators OECD Composite Leading Indicators AREA TOTALS 7-03- 19 OECD Total 19 OECD + Major 6 Non Member Countries 19 Major Seven 19 Major Five Asia 19 Euro area 19
Opportunities in a Challenging Global Business Environment: Can the World Avoid a Double-Dip?
 Opportunities in a Challenging Global Business Environment: Can the World Avoid a Double-Dip? Ross DeVol Chief Research Officer (310) 570 4615 rdevol@milkeninstitute.org www.milkeninstitute.org Presentation
I. World trade in Overview
 I. Table I.1 Growth in the volume of world merchandise exports and production by major product group, 1995-3 ( change) 1995-21 22 23 World merchandise exports 7. -.5 3. 4.5 Agricultural products 3.5 2.5
Impacts of the Global Economy on Asia Pacific Travel. 29 June 2007 John Walker
 Impacts of the Global Economy on Asia Pacific Travel 29 June 2007 John Walker jwalker@oxfordeconomics.com Oxford Economics Founded in 1981 Over 300 clients including blue chip companies and government
International Trade Economic Forecasts An Overview of Orange County and Southern California Exports
 International Trade Economic Forecasts An Overview of Orange County and Southern California Exports Mira Farka Adrian R. Fleissig Institute for Economic and Environmental Studies Orange County / Inland
January Deadline Analysis: Domicile
 January Deadline Analysis: Domicile Applicants by domicile at the 15 January deadline D.1.1 Applicants by domicile group UK EU (excluding UK) Not EU All domiciles 20% 10% -0% -10% -20% -30% -40% -50% 2009
New rules, new opportunities: a potential for growth
 #TV year New rules, new opportunities: a potential for growth June 19th, 2015 Jacques Balducci Eurodata TV Worldwide Deputy Sales Director Worldwide TV viewing remains strong World daily viewing time Average
Assessing Australia s Innovative Capacity in the 21 st Century
 Assessing Australia s Innovative Capacity in the 21 st Century Professor Joshua Gans MBS & IPRIA University of Melbourne November, 2003 This presentation is based on the National Innovative Capacity Project,
DEVELOPMENT AID AT A GLANCE
 DEVELOPMENT AID AT A GLANCE STATISTICS BY REGION 5. EUROPE 2018 edition All the data in this report are available at: http://www.oecd.org/dac/financing-sustainable-development/ 5.1. ODA TO EUROPE - SUMMARY
Some Facts About Output
 Some Facts About Output GNP as a Percentage of GDP in 2009 Country % Kuwait 110,38 United Kingdom 102 Japan 103,14 United States 99,24 China 100,87 Germany 101,41 Mexico 98,34 Poland 96,76 Ireland 81,19
sector: recent developments VÍTOR CONSTÂNCIO
 The economy and the banking sector: recent developments VÍTOR CONSTÂNCIO January 2006 Recent performance of the economy and prospects Factors behind the period of slow growth Challenges to the Banking
Shipbuilding Market Overview
 Shipbuilding Market Overview Cargotec Capital Markets Day, Helsinki, 17 th November 2011. Steve Gordon, Clarkson Research Services Limited (CRSL) The information supplied herewith is believed to be correct
June Deadline Analysis: Domicile
 June Deadline Analysis: Domicile Applicants by domicile at the 30 June deadline I.1.1 Applicants by domicile group Difference between cycle and 2017 cycle UK EU (excluding UK) Not EU All domiciles 10%
Israel Innovation Authority
 Israel Innovation Authority Danny Biran VP, International Division innovationisrael.org.il Hi-Tech - Major Impact on the Israeli Economy of Employees Of Business Sector GDP of Exports 4.3 Global Leadership
Session 18: The new equine economy: growth in new sectors and activities in the 21st Century
 The 64th Annual Meeting of the European Association for Animal Production August 26 th -30 th 2013, Nantes, France Session 18: The new equine economy: growth in new sectors and activities in the 21st Century
Dry Bulk Shipping in Indonesia Opportunities & Outlook
 Dry Bulk Shipping in Indonesia Opportunities & Outlook Mare Forum, Jakarta 27 Peter Malpas 29 th November 27 Introduction Indonesia Key Facts Land Area 1,919,44 km2 = World s s 16 th Largest Population
Market Insights. March 29, 2019
 March 29, 2019 Economic Overview 2 Global & Regional Growth Forecasts IMF GDP Forecasts (% change YoY) 2010 2011 2012 2013 2014 2015 2016 2017 2018 Advanced Economies 1.2% 1.4% 2.1% 2.3% 1.7% 2.4% 2.3%
Market Insights. June 30, 2018
 June 30, 2018 Economic Overview 2 Global & Regional Growth Forecasts IMF GDP Forecasts (% change YoY) 2010 2011 2012 2013 2014 2015 2016 2017 2018 Advanced Economies 1.7% 1.2% 1.3% 2.1% 2.3% 1.7% 2.3%
Maximizing Tourism Marketing Investments A Canadian Perspective
 Maximizing Tourism Marketing Investments A Canadian Perspective Understanding the potential of markets Economics: GDP; Inflation; Unemployment; Employment; Disposable Income; Private Consumption; Consumer
World exports as a share of GDP
 World exports as a share of GDP 35% 30% 25% 20% 15% 1991 1993 1995 1997 1999 2001 2003 2005 2007 2009 Source: WTO, World Bank. World goods and service exports US$ trillions Commercial services (L) Total
Beer statistics edition. The Brewers of Europe
 Beer statistics 2016 edition The Brewers of Europe Beer statistics 2016 edition The Brewers of Europe November 2016 ISBN 978-2-9601382-7-6 EAN 9782960138276 1 TABLE OF CONTENTS Foreword by President
Inland Empire International Trade Economic Forecast
 Inland Empire International Trade Economic Forecast Mira Farka Adrian Fleissig Institute for Economic and Environmental Studies Orange County / Inland Empire Regional SBDC Network California State University,
The Australia US FTA: implications for international education
 The Australia US FTA: implications for international education Prepared for The Path to Cultural Understanding and Development 18th IDP Australian International Education Conference, Sydney 5-8 October
India: Can the Tiger Economy Continue to Run?
 India: Can the Tiger Economy Continue to Run? India s GDP is on the rise US$ trillions Nominal GDP (left axis) GDP growth (right axis) 3.0 2.5 2.0 1.5 1.0 0.5 0.0 1990 1992 1994 1996 1998 2000 2002 2004
Fibre to the Home: Taking your life to new horizons!
 Fibre to the Home: Taking your life to new horizons! Hartwig Tauber, Director General FTTH Council Europe Press Conference - Milan, 13 January 2011 FTTH Council Europe Photo by Nicolo Baravalle FTTH Council
Architecture - the Market
 2 Architecture - the Market Architect: Ibelings van Tilburg architecten Project: De Karel Doorman Winner of the BNA Building of the Year 2013 Public Prize Photographer: Ossip van Duivenbode Place: Rotterdam
German Machine Tool Industry - Key Figures
 German Machine Tool Industry - Key Figures Mill. EUR %-Change 1-2Q 1-2Q 1-2Q 2014 2015 2016 2017 2017 2018 2016 2017 2018 Production total 14.486 15.087 15.007 16.006 7.062 7.820-1 +7 +11 Metal working
Universities and the Education Revolution. Professor Richard Larkins Chair, Universities Australia VC and President Monash University
 Universities and the Education Revolution Professor Richard Larkins Chair, Universities Australia VC and President Monash University Role of Universities in Prosperity Third largest earner of export dollars
Beer statistics edition. The Brewers of Europe
 Beer statistics 2017 edition The Brewers of Europe Beer statistics 2017 edition The Brewers of Europe December 2017 ISBN 978-2-9601382-9-0 EAN 9782960138290 1 TABLE OF CONTENTS Foreword by President
Peter Ch. Löschl, ABA Invest in Austria June Austria Investment Climate Reasons to Invest in Austria - Perspectives
 Peter Ch. Löschl, ABA Invest in Austria June 2016 Austria Investment Climate Reasons to Invest in Austria - Perspectives Strong Economy in the Heart of Europe Area: 83,872 km² People: 8.5 m. GDP growth:
The Herzliya Indices. National Security Balance The Civilian Quantitative Dimension. Herzliya Conference Prof. Rafi Melnick, IDC Herzliya
 The Herzliya Indices National Security Balance The Civilian Quantitative Dimension Herzliya Conference 2015 Prof. Rafi Melnick, IDC Herzliya 1990 1991 1992 1993 1994 1995 1996 1997 1998 1999 2000 2001
EUROPEAN RIDERS, HORSES AND SHOWS AT THE FEI 2012
 EUROPEAN RIDERS, HORSES AND SHOWS AT THE FEI 2012 Presentation to the EEF Sports Forum Essen, 21 st March 2013 1 Introduction In 2010 the Small Nations Working Group started this study, to know exactly
Big data analytics for enrichment of rural area content tourism in Okhotsk sub-prefecture of Japan
 Big data analytics for enrichment of rural area content tourism in Okhotsk sub-prefecture of Japan Ali Bakdur, Fumito Masui, Michal Ptaszynski Kitami Institute of Technology, Dept. of Computer Science,
ADDITIONAL MARKET OUTLOOK for the year ended 31 December 2015
 ADDITIONAL MARKET OUTLOOK for the year ended 31 December 2015 SOUTH AFRICAN PORT VOLUMES 2015 TEUs 2015 2014 Volume Variance % Deep sea landed full 1 471 927 1 386 381 85 546 6.17 Deep sea landed empty
Japanese Market Potential
 Growth Strategy (announced on 14 June 2013) : Japan is BACK. Overall Target: 2% Real GDP Growth in the next 10 years JPY1.5 million Increase of GNI/capita after 10 years Unleash the Potential of Private
The Baltic economies: Current situation and future trends, possibilities and pitfalls
 The Baltic economies: Current situation and future trends, possibilities and pitfalls Riga, 15 October 2015 Morten Hansen Head of Economics Department, Stockholm School of Economics in Riga Member of the
World real GDP growth in 2010 Annual percent change
 World real GDP growth in 2010 Annual percent change 1 or more 6-1 3-6% 0-3% Less than No data Source: International Monetary Fund. World real GDP growth in 2011 Annual percent change 1 or more 6-1 3-6%
Simon Stonehouse. Hull Underwriter Brit Insurance plc
 Simon Stonehouse Hull Underwriter Brit Insurance plc Issues IUMI Facts & Figures Shipping Climate Shipbuilding Fleet Crew Maintenance and Repair A few issues to watch out for! Report of the Facts an Figures
U.S. Civilian Unemployment Rate
 Chart 1 U.S. Civilian Unemployment Rate 11 10 9 8 % 7 6 5 4 3 2 14710147101471014710147101471014710147101471014710147101471014710147101471014710147101471014710147101471014710147101471014710147 1990 1991
Trade and Economic Trends
 Trade and Economic Trends Marine Terminal Management Training Program Paul Bingham Managing Director, Global Commerce & Transportation IHS Global Insight Long Beach, CA September 21, 2009 The Global Recession
Beer statistics edition. The Brewers of Europe
 Beer statistics 2015 edition The Brewers of Europe Beer statistics 2015 edition The Brewers of Europe Editor: Marlies Van de Walle October 2015 ISBN 978-2-9601382-5-2 EAN 9782960138252 1 TABLE OF CONTENTS
Session 4. Growth. The World Economy Share of Global GDP Year 2011 (PPP)
") Session 4. Growth Stylized Facts on Standards of Living across Countries Characterizing Growth over 1 Years: The US Economy Growth Dynamics of the G7 Countries and the OECD Economies Characterizing Growth
Session 4. Growth Stylized Facts on Standards of Living across Countries Characterizing Growth over 1 Years: The US Economy Growth Dynamics of the G7 Countries and the OECD Economies Characterizing Growth
Airlines, the economy and air transport demand
 Airlines, the economy and air transport demand Brian Pearce, Chief Economist, IATA www.iata.org/economics Airline Industry Economics Advisory Workshop 2016 1 Returns for airlines investors lower this year;
Arms industry statistics
 BRIEFING PAPER Number CBP 7842, 21 December 2016 Arms industry statistics By Rachel Kift and Rob Page Contents: 1. Global defence export market 2. UK defence export market www.parliament.uk/commons-library
16. Key Facts about Long Run Economic Growth
 Fletcher School, Tufts University 16. Key Facts about Long Run Economic Growth E212 Macroeconomics Prof. George Alogoskoufis How we Measure and Compare Living Standards Living standards are usually measured
Overview of market trends through 2005 Forecasts for 2006 and 2007
 Overview of market trends through 2005 Forecasts for 2006 and 2007 Ed Pepke, Ph.D. Forest Products Marketing Specialist Food and Agricultural Organization & UN Economic Commission for Europe Geneva, Switzerland
China s Industrial Capabilities and Trade
 China s Industrial Capabilities and Trade Loren Brandt Thomas Rawski June 16, 2005 Key Facts: China, 2003 Population: 1.3 billion (1 st ) GNP: $US 1.4 trillion (3 rd ) Foreign Trade: $US 850.1 (3rd) GNP
Guy Bisson, Ampere Analysis
 Global Cable Trends: Poland s place in the world of cable Guy Bisson, Ampere Analysis October 2017 1 Multi-play RGUs (m) Globally, cable leads in multi-play subscriptions with over 800m multi-play RGUs
CURRENT DEMOGRAPHIC SITUATION IN LATVIA
 CURRENT DEMOGRAPHIC SITUATION IN LATVIA Peteris Zvidrins University of Latvia Workshop Very old people s housing and housing and health situation in Latvia 21 May, 2013 Population and its change in 10
U.S. Overview. Gathering Steam? Tuesday, October 1, 2013
 U.S. Overview Gathering Steam? Tuesday, October 1, 2013 Uneven global economic recovery Annual real GDP growth projections (%) Projections 2013 2014 World 3.1 3.1 3.8 United States 2.2 1.7 2.7 Euro Area
The globalisation of sporting events: Myth or reality?
 Khalifa Stadium, Qatar. Photo: Igor Magic The globalisation of sporting events: Myth or reality? Søren Bang, Play the Game 203, 30 October 203 The globalisation of sporting events: Myth or reality? Photo:
Monthly Digest February 2016 No. 2016/04. Copyrights Statistics Botswana 2016
 STATISTICS BOTSWANA BOTSWANA INTERNATIONAL MERCHANDISE TRADE STATISTICS Monthly Digest February 2016 No. 2016/04 Copyrights Statistics Botswana 2016 Contact Statistician: Malebogo Rakgantswana Email: mrakgantswana@gov.bw
Austria: Key Economic Features
 Austria: Key Economic Features and EU Guanghua School of Management Josef Christl, Macro-Consult 16. Oktober 2017 Austria: a small, but rich country Population, mn. GDP per capita PPP, USD 1600 60000 1400
The Economic Dimension Of Sport
 The Economic Dimension Of Sport Dr. Anna Kleissner SportsEconAustria 14/09/2015 Presentation for the Committee on Culture and Education 1 Structure of the Presentation 1. Economic Definition of Sport 2.
The World Did Not End in Q1
 The World Did Not End in Q1 Sam Wilkin Senior Advisor, Business Research Blog: www.samwilkin.com 06.2015 1 2 3 4 5 Exports to Russia: 10% of Finnish exports; 4% of Finnish GDP 1. Global Economic Weather
The Economy of Finland
 The Economy of Finland Aug 30st 2013, Finnish Ministry of Foreign Affairs Presentation for the American Fulbright Grantees Petteri Rautaporras, Economist at the Federation of Finnish Technology Industries
OECD employment rate increases to 68.4% in the third quarter of 2018
 Paris, 17th January 2019 News Release: 3rd Quarter 2018 OECD employment rate increases to 68.4% in the third quarter of 2018 The OECD area employment rate the share of the working-age population with jobs
The Great Convergence: China, India and the new global economy. Mark Thirlwell Program Director, International Economy July 2006
 The Great Convergence: China, India and the new global economy Mark Thirlwell Program Director, International Economy July 2006 India Two views of the largest economies in 2005 Top 12 economies by GDP,
STORM FORECASTS: The only independent source of animal health and animal agriculture historical market data and forecasts
 The only independent source of animal health and animal agriculture historical market data and forecasts June 2016 1 What is STORM FORECASTS? STORM FORECASTS is the only independent source of animal health
Stockholm s tourism industry. November 2016
 Stockholm s tourism dustry. November 2016 Durg the month of November ca 1.1 million guest were recorded at commercial accommodations the county of Stockholm. This was an crease of 5 compared to November
Seven Lean Years Explaining Persistent Global Economic Weakness
 Seven Lean Years Explaining Persistent Global Economic Weakness 9 June 2015 Bank of Canada and European Central Bank Conference Tim Lane Deputy Governor Bank of Canada The global economy remains weak and
The Changing Global Economy Impacts on Seaports and Trade Dr. Walter Kemmsies
 The Changing Global Economy Impacts on Seaports and Trade Dr. Walter Kemmsies Chief Economist, PAGI Group, JLL (Port, Airport & Global Infrastructure) Agenda Where are we in the cycle? What are the barriers
DEVELOPMENT AID AT A GLANCE
 DEVELOPMENT AID AT A GLANCE STATISTICS BY REGION 6. OCEANIA 2018 edition All the data in this report are available at: http://www.oecd.org/dac/financing-sustainable-development/ 6.1. ODA TO OCEANIA - SUMMARY
Stockholm s tourism industry. December 2016
 Stockholm s tourism dustry. December 2016 Durg the month of December ca 0.9 million guest were recorded at commercial accommodations the county of Stockholm. This was an crease of 12 compared to December
Economic potential of Agriculture and Pig production in Baltic region. Mindaugas Jurgelis, analyst 30 May, 2012
 Economic potential of Agriculture and Pig production in Baltic region Mindaugas Jurgelis, analyst 30 May, 2012 1 Global tendencies of food production 2 Food prices near historical peak level FAO food price
Elements for the Biennial Review And Assessment of the World Timber Situation SELECTED DATA AND ANALYSIS.
 Elements for the Biennial Review And Assessment of the World Timber Situation 2015-2016 SELECTED DATA AND ANALYSIS Frances Maplesden Content Results of the 2016 Joint Forest Sector Questionnaire Secondary
Agricultural Trade Office The U.S. Embassy, Seoul
 Agricultural Trade Office The U.S. Embassy, Seoul www.atoseoul.com Data Source: Global Trade Atlas (www.gtis.com), CIF Value Basis, This presentation tracks Korea s imports of agricultural products on
OCEAN2012 Fish Dependence Day - UK
 OCEAN2012 Fish Dependence Day - UK Europeans are now so dependent on fish products originating from external waters that half the fish they consume are sourced outside the EU Fish dependence: The EU s
Car Production. Brazil Mexico. Production in thousands. Source: AMIA Asociacion Mexicana de la industria automotriz.
 Car Production Production in thousands 4000 3000 2000 1000 Brazil Mexico 0 2013 2014 2015 Source: AMIA Asociacion Mexicana de la industria automotriz. Mexico s Expanding Middle Class Percent of population
LOCAL BROADCASTER DUBAI DUBAI SPORTS CHANNEL 01-Nov-13 01:00 02:00 Hlts Day 1 01:00 EUROPE DURATION HH:MM
 A. HIGHLIGHTS LOCAL BROADCASTER DUBAI DUBAI SPORTS CHANNEL 01-Nov-13 01:00 02:00 Hlts Day 1 01:00 02-Nov-13 01:00 02:00 Hlts Day 2 01:00 03-Nov-13 01:00 02:00 Hlts Day 3 01:00 04-Nov-13 01:00 02:00 Hlts
CMMI Maturity Profile Report. 30 June 2017
 CMMI Maturity Profile Report 30 June 2017 Executive Summary Appraisals increased 14% 1 Jan 30 Jun 17 Companies who reappraise continue to increase, currently at 74% 10% of reported appraisals are high
Ministry of Economy and Sustainable Development of Georgia
 Ministry of Economy and Sustainable Development of Georgia Economic Growth 42,000.0 36,000.0 30,000.0 24,000.0 18,000.0 12,000.0 6,000.0 0.0 GDP AND ECONOMIC GROWTH 7.2% 6.2% 6.4% 4.6% 4.8% 3.4% 2.9% 2.8%
Grasshoppers, Ants and Locusts: the future of the world economy
 Ralph Miliband Series on the Restructuring of World Power Grasshoppers, Ants and Locusts: the future of the world economy Martin Wolf Associate editor and chief economics commentator, Financial Times Professor
Desalination From theory to practice People, Papers, Publications. Miriam Balaban EDS Secretary General
 Desalination From theory to practice People, Papers, Publications Gulf WSTA Europe EDS Miriam Balaban EDS Secretary General Europe and the Gulf Region The collaboration between our regions has had significant
The Nordic countries in figures
 The Nordic countries in figures 2010 Order your Nordic Statistica Yearbook 2010 on www.norden.org Nordic countries in figures 2010 ANP 2010:773 T RY K S A G N R. 541-618 Nordic countries in figures 2010
US imports from emerging economies have grown rapidly
 US imports from emerging economies have grown rapidly Ratio to GDP (current dollars) 0.07 US merchandise imports, 1978 2008 0.06 0.05 0.04 0.03 0.02 Industrial Non-OPEC other 0.01 0 OPEC = Organization
The Changing Global Trade Landscape
 The Changing Global Trade Landscape Top 10 Leading Economies in 2050 Nominal GDP Country (US$ Trillion) China 44.5 United States 35.2 India 27.8 Japan 6.7 Brazil 6.1 Russia 5.9 United Kingdom 3.8 Germany
The outlook: what we know, the known unknowns and the unknown unknowns
 The outlook: what we know, the known unknowns and the unknown unknowns 24 April 2017 Seoul Brian Pearce, Chief Economist, IATA www.iata.org/economics Airline Industry Economics Advisory Workshop 2016 1
Energy Security: Markets and Policy
 Energy Security: Markets and Policy Pierre Noël EPRG, University of Cambridge Critical Infrastructure Conference, London, 20 April 2011 Contents Global Oil and the Middle East European Gas and Russia Japan
Agricultural Trade Office The U.S. Embassy, Seoul
 Agricultural Trade Office The U.S. Embassy, Seoul www.atoseoul.com Data Source: Global Trade Atlas (www.gtis.com), CIF Value Basis, This presentation tracks Korea s imports of agricultural products on
DG AGRI DASHBOARD: CITRUS FRUIT Last update:
 14 000 12 000 10 000 8 000 6 000 4 000 2 000 0 1996 1997 1998 1999 2000 2001 2002 2003 2004 2005 2006 2007 2008 2009 2010 2011 2012 2013 2014 2015 2016 Small citrus (group mandarines): clementines, satsumas
Confidence through experience. Track record as of 30 June 2012
 Confidence through experience Track record as of 30 June 2012 Harvesting the full potential of wind Confidence is built through experience. During more than 30 years in the wind industry we have installed
Finland s sawmilling industry
 Finland s sawmilling industry Howard Sidney-Wilmot Stora Enso - Sales Director UK, Ireland & Benelux September 2015 Stora Enso Wood Products 13/10/2015 1 Finland s forest products 19bn total value 11bn
Global Economic Outlook: From Fiscal Cliff to Rushcliffe in 15 minutes. Tom Rogers. Lead Economist, Oxford Economics.
 Global Economic Outlook: From Fiscal Cliff to Rushcliffe in 15 minutes Tom Rogers Lead Economist, Oxford Economics trogers@oxfordeconomics.com 16 th January 2013 Overview External environment showing signs
The New Suez Canal. Massimo DEANDREIS. Cairo, November 29 th SRM Managing Director
 The New Suez Canal Massimo DEANDREIS SRM Managing Director Cairo, November 29 th 2015 Main Topics of the Study The Growth of Mediterranean Trade Strategies and Trends Big Phenomena and the Impact on Ports
Trade Growth - Fundamental Driver of Port Operations and Development Strategies
 Trade Growth - Fundamental Driver of Port Operations and Development Strategies Marine Terminal Management Training Program October 15, 2007 Long Beach, CA Paul Bingham Global Insight, Inc. 1 Agenda Economic
Israel and the OECD. A Comparison Based on. The Herzliya Indices Approach. Presented by. Dr. Zalman Shiffer. The Herzliya Indices Team
 and the A Comparison Based on The Herzliya Indices Approach Presented by Dr. Zalman Shiffer The Herzliya Indices Team Herzliya Conference 2008 1 Team Members Herzliya Indices Team Team Leader Prof. Rafi
China at a glance 2011
 China at a glance 2011 GDP PPP Growth rate Per capita Value US$11.29 trillion 9.2% US$8,400 Ranking 3 7 119 Labor force Imports Exports Value 816.2 million US$1.74 trillion US$1.90 trillion Ranking 1 3
National Transfer Accounts in Mexico
 National Transfer Accounts in Mexico Policy implications: labor market Iván Mejía Guevara imejiag@stanford.edu Stanford University 12th Global Meeting of the NTA Network, Mexico City, July 23-27, 2018
COOPERATIVE EXTENSION Bringing the University to You
 COOPERATIVE EXTENSION Bringing the University to You Special Publication - 06-16 ECONOMIC IMPACT OF TOURISM ON COLORADO RIVER COMMUNITIES INCLUDING: LAUGHLIN BULLHEAD CITY FORT MOHAVE MOHAVE VALLEY GOLDEN
Tanker supply until 2015 OECD working party on shipbuilding Paris by Manager Research and Projects Paris 4-5 December
 Tanker supply until 215 OECD working party on shipbuilding Paris by Erik.Ranheim@INTERTANKO.com Manager Research and Projects Paris 4-5 December 28 Tanker contracting bn $/ bn $ 5 4 3 2 1 Handy Panamax
Turkey: Recent Developments and Future Prospects. ISBANK Economic Research Division November 2018
 Turkey: Recent Developments and Future Prospects ISBANK Economic Research Division November 2018 Macroeconomic Outlook Strong Economic Growth Cycle GDP of 851 bn USD (2017), 10.6k USD (2017) per capita