Tuesday, January 11, :11 AM (CST)
|
|
|
- Cora Barrett
- 6 years ago
- Views:
Transcription

1 Tuesday, January 11, :11 AM (CST)

2 -Assessment of current water conditions - Precipitation Forecast - Recommendations for Drought Monitor
3
4 Upper Colorado Normal Precipitation Upper Colorado River Basin Normal Monthly Precipitation 6 5 KREMMLING GRAND LAKE 6 SSW BERTHOUD SUMMIT Precipitation (in) Jan Feb Mar Apr May Jun Jul Aug Sep Oct Nov Dec Month
5
6
7
8
9 Upper Colorado Headwaters 136% of average
10

11 Upper Colorado River Basin

12 Green River Basin above Flaming Gorge
13 Snowpack % of average to date: 108% Seasonal average: 56%

14 Duchesne River Basin
15 Snowpack % of average to date: 188% Seasonal average: 88%

16 Upper Colorado above Kremmling
17 Snowpack % of average to date: 134% Seasonal average: 62%

18 San Juan Basin
19 Snowpack % of average to date: 110% Seasonal average: 52%


20 Michael Lewis USGS

21 7-day average discharge compared to historical discharge for the day of the year (January 9)
22 -Upper Colorado River Basin- Comparison of 7-day Average Discharge For January 8, Percentage of streamgages in discharge category Discharge Category high much above normal above normal normal below normal much below Low
23 Colorado River near CO-UT State Line 29 th Percentile 83% of Normal Green River at Green River, UT Ice Affected San Juan River near Bluff, UT 41 st Percentile 92% of Normal
24

25 Flaming Gorge December Reservoir Storage Max Capacity Ave Thousand AF

26 600 Lake Granby December Reservoir Storage 500 Max Capacity 400 Thousand AF Ave


27 160 Green Mountain December Reservoir Storage 140 Max Capacity 120 Thousand AF Ave
28 300 Lake Dillon December Reservoir Storage 250 Max Capacity Ave Thousand AF
29 900 Blue Mesa December Reservoir Storage 800 Max Capacity 700 Thousand AF Ave
30 Navajo Lake December Reservoir Storage Max Capacity Ave Acre Feet

31 Lake Powell December Reservoir Storage Max Capacity Ave Acre Feet
32

33 Temperature Departure from Normal 12/1/ /31/2010

34 Temperature Departure from Normal 1/1/2011 1/10/2011

35

36
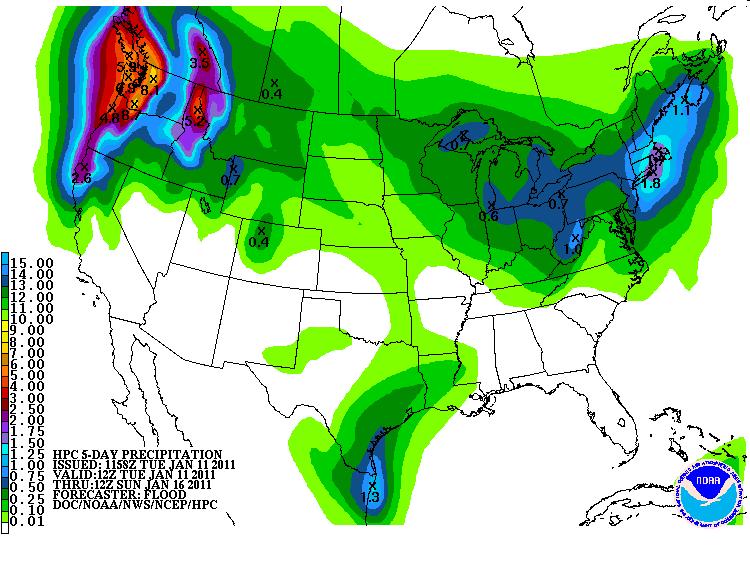
37 5 Day QPF

38
39
40 NIDIS Weekly Climate, Water and Drought Assessment Summary Upper Colorado River Basin January 11, 2011
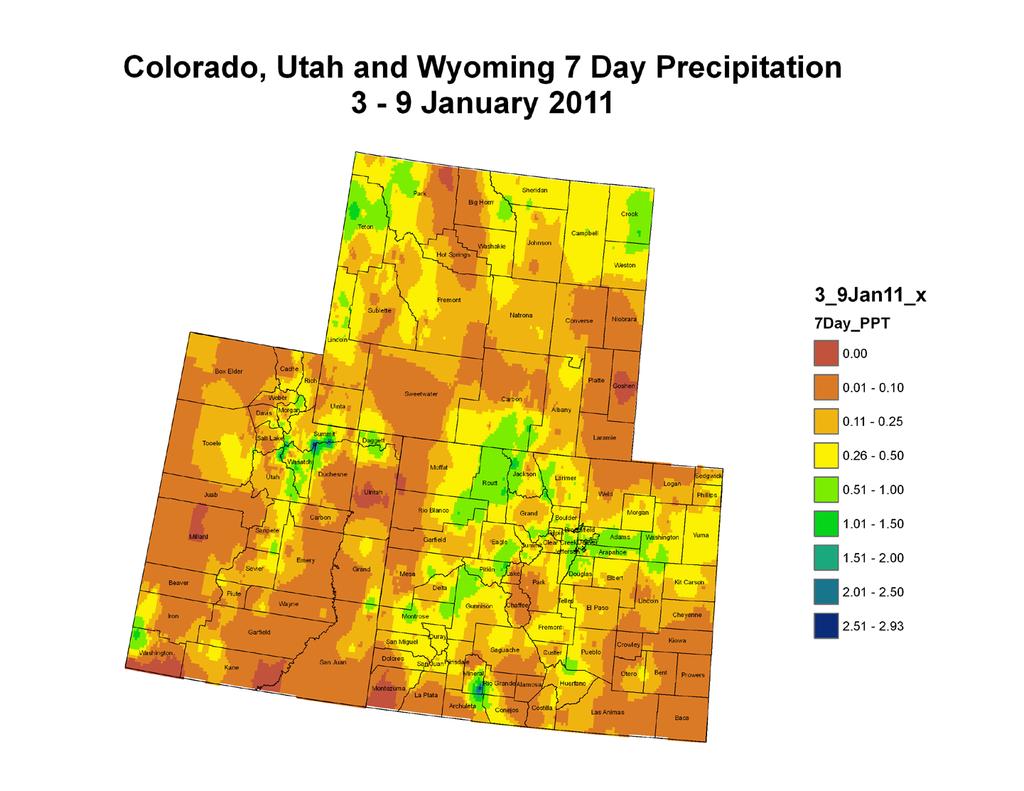
41 Precipitation and Snowpack Figure 1: December 2011 Precipitation as Percentage of Average Figure 2: Water Year 2011 Precipitation as Percentage of Average Figure 3: 7 Day Precipitation for 3 9 January The majority of the Upper Colorado River Basin (UCRB) has received well above average precipitation for both December (Figure 1) and the water year overall (Figure 2). For the water year, the UCRB ranges from 91 to greater than 300 % of average. The exceptions to this include the valley areas on the Western slope and the majority of Colorado s Eastern plains, which are currently under drought designation by the U.S. Drought Monitor. Over that past week (Figure 3), the entire UCRB did receive some beneficial moisture, however it was below average for the mountains. It did finally benefit the Eastern plains of Colorado, however precipitation amounts were generally less than 0.50 and require no improvements to the current drought depiction. The Upper Colorado headwaters are at 136% of average for the water year.
42 Figure 4: Snotel One Week Change in Water Year Precipitation Percent of Average. Figure 5: Snotel Water Year Precipitation Percentile Ranking. Snotel weekly change in water year precipitation percents of average decreased at nearly all locations in the UCRB (Figure 4). The mountains did receive precipitation over the past week, however it was not enough to keep up with the normal precipitation for this time of year. The largest decreases were seen in Duchesne and Uintah counties in Utah due to their percents of average being so high the previous week. Figure 5 shows the percentile rankings for Snotel water year precipitation. These rankings are excellent for the UCRB with many of the Utah stations ranking above 90 (and many at 100), this indicates that it is one of the wettest starts to the Water Year at these locations. The NRCS reports this to be the best start to a Water Year since The exception to this is the Rio Grande basin, which is still showing percentile rankings in the range.
. Figure 7 shows time series for key sites in the UCRB.")


43 Streamflow Seven day average discharge conditions across the UCRB are showing good percentile rankings (Figure 6) with 77% of the gages reporting at or above normal conditions (greater than 25 th percentile). Figure 7 shows time series for key sites in the UCRB. The Colorado River at the CO-UT state line is 83% of normal (29 th percentile) and the San Juan River near Bluff, UT is 92% of normal (41 st percentile). The Colorado River gage did see a slight increase from last week while the San Juan gage decreased slightly from last week. Overall, streamflow conditions are favorable for this time of year. Colorado River near CO-UT State Line 29 th Percentile 83% of Normal Green River at Green River, UT Ice Affected Figure 6: 7-day average discharge compared to historical discharge for January 9 th. San Juan River near Bluff, UT 41 st Percentile 92% of Normal Figure 7: USGS 7 day average discharge time series at the CO UT state line (top), Green River, UT (middle) and Bluff, UT (bottom). Note Green River is ice affected.

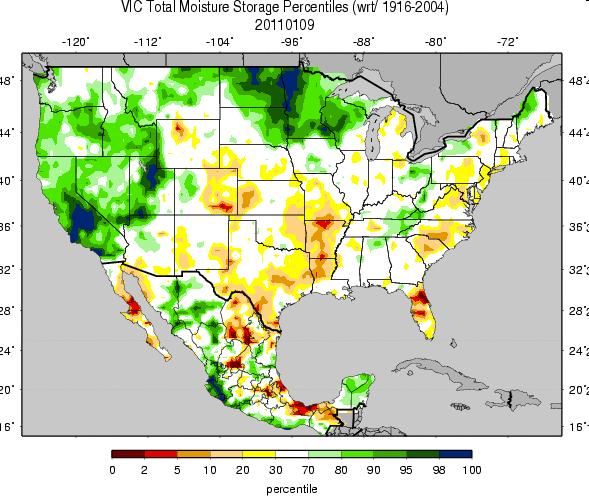
44 Water Supply and Demand Temperatures: Over the past week (Figure 8), temperatures were well below average for the majority of the UCRB, following extended periods of above average temperatures this Winter. The coldest areas were in NW Colorado, NE Utah and SW Wyoming. These areas saw temperature in the range of degrees below average. Cooler temperatures coupled with beneficial moisture have kept soil moisture conditions unchanged (Figure 9). Reservoirs and Flow Forecasts: Thanks in part to generous December precipitation and warm temperatures, December inflow into Lake Powell was 96% of average, greater than originally forecast. Based on early January conditions, the April - July water supply forecasts are currently anticipating above average flows in much of the UCRB. We are currently in a critical period for decision making governing UCRB reservoir operations and releases out of Lake Powell, especially in light of the above average inflow forecasts. Fortunately, reservoirs in the UCRB upstream from Lake Powell are all near or above average for this time of year. Figure 8: Temperature departure from average at NWS Cooperative stations from 1-10 January Figure 9: VIC soil moisture model for 9 January 2011.
.")
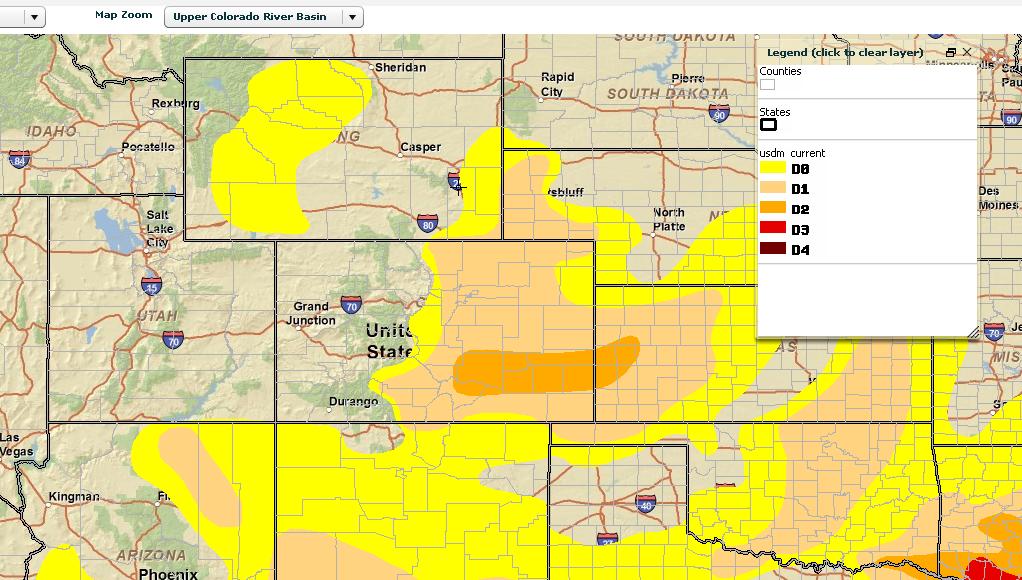
45 Precipitation Forecast The forecast for the UCRB over the next week is rather quiet. Quantitative precipitation forecasts (QPF) show the best chance of precipitation around 0.40 for the UCRB, mainly in the Northern and Central mountains in Colorado and the Green River Basin in Wyoming through Sunday (Figure 10). This pattern is forecast to persist into the next week, providing normal to less than normal precipitation amounts for the mountains for this time of year. Recommendations In light of the excellent snowpack conditions and some beneficial moisture falling on the Eastern Plains, status quo has been recommended for the majority of the UCRB. One area of concern is the D0 around the four corners area ending directly on the Colorado/Utah border (Figure 11). In light of this, it was recommended that the USDM author look at this area to make sure the D0 is accurately depicted. Arizona input suggested the Colorado Plateau is very dry and D0 should remain in that area. No input or suggestions were made for northern New Mexico. Figure 10: 5 Day QPF for the U.S. valid from Tues, Jan 10 th through Sunday, January 16 th. Figure 11: Current U.S. Drought Monitor, showing odd D0 border near the four corners area.
Monthly Webinar 12.07/2010
 Monthly Webinar 12.07/2010 -Assessment of current water conditions - Precipitation Forecast - Recommendations for Drought Monitor Upper Colorado Normal Precipitation Upper Colorado River Basin Normal
Weather and Climate Impacts on Water Supply
 Weather and Climate Impacts on Water Supply Nolan Doesken Colorado Climate Center Atmospheric Science Department Colorado State University http://ccc.atmos.colostate.edu Presented at the South Platte Forum,
CoCoRaHS goes to the Colorado Farm Show
 CoCoRaHS goes to the Colorado Farm Show Nolan J. Doesken Colorado Climate Center, Atmospheric Science Dept, Colorado State University Presented January 25, 2006, Greeley, CO Prepared by Odie Bliss The
Drought! When Do We Know It s Over?
 Drought! When Do We Know It s Over? Nolan J. Doesken Colorado Climate Center Colorado State University http://ccc.atmos.colostate.edu Presented at the 2004 Peak to Prairie Landscape Symposium, February
The State of the Climate Address
 The State of the Climate Address Nolan J. Doesken Colorado Climate Center, Atmospheric Science Dept, Colorado State University Presented to Colorado Water Officials Association, 2005 Annual Meeting, September
Environmental Protection The answer my friend is blowing in the wind
 Environmental Protection The answer my friend is blowing in the wind Nolan Doesken Colorado Climate Center Colorado State University Presented at the Pesticide Conference, November 17, 2005, Denver, CO
Colorado Weather and Climate Update
 Colorado Weather and Climate Update Nolan J. Doesken State Climatologist Colorado Climate Center, Atmospheric Science Department, Colorado State University Presented to Colorado Livestock Association,
The Awesome, Wonderful, Beautiful, Exciting and Terrible Climate of the West What a Hoot!
 The Awesome, Wonderful, Beautiful, Exciting and Terrible Climate of the West What a Hoot! Nolan J. Doesken, State Climatologist Colorado Climate Center Presented to Four States Irrigation Council, 54 th
Drought or Not? Nolan J. Doesken Colorado Climate Center Colorado State University
 Drought or Not? Nolan J. Doesken Colorado Climate Center Colorado State University http://ccc.atmos.colostate.edu Presented at Horticultural Art Society meeting, November 19, 2004, Colorado Springs, Colorado
CUPSIM Water Supply Variability Study All information subject to change.
 . 1 IN A NUTSHELL The CUP Water Supply Variability Study is an opportunistic, proactive example of responsible water system management The CUP is very complex and approaching full demand The study capitalizes
COMPARISON OF FIXED & VARIABLE RATES (25 YEARS) CHARTERED BANK ADMINISTERED INTEREST RATES - PRIME BUSINESS*
 CHARTERED BANK ADMINISTERED INTEREST RATES - PRIME BUSINESS*") COMPARISON OF FIXED & VARIABLE RATES (25 YEARS) Fixed Rates Variable Rates FIXED RATES OF THE PAST 25 YEARS AVERAGE RESIDENTIAL MORTGAGE LENDING RATE - 5 YEAR* (Per cent) Year Jan Feb Mar Apr May Jun Jul
COMPARISON OF FIXED & VARIABLE RATES (25 YEARS) Fixed Rates Variable Rates FIXED RATES OF THE PAST 25 YEARS AVERAGE RESIDENTIAL MORTGAGE LENDING RATE - 5 YEAR* (Per cent) Year Jan Feb Mar Apr May Jun Jul
Drought: What is the Status?
 Drought: What is the Status? Nolan J. Doesken Colorado Climate Center Colorado State University http://ccc.atmos.colostate.edu Presented at 2005 Peak to Prairie Landscape Symposium, February 11, 2005,
Nolan Doesken. Colorado Climate Center.
 Nolan Doesken Colorado Climate Center Presented to: Colorado Conservation Tillage Association, Greeley, CO, February 1-2, 1 2005 http://ccc.atmos.colostate.edu Prepared by Odie Bliss 1 Key Features of
Drought and the Climate of the Ogallala Aquifer
 Drought and the Climate of the Ogallala Aquifer Nolan J. Doesken Colorado Climate Center Colorado State University Presented at Ogallala Symposium, Wray, Colorado February 20, 2006 Prepared by Odie Bliss
Global Climate Change: Just the Facts
 Global Climate Change: Just the Facts Nolan Doesken State Climatologist, Colorado Climate Center Atmospheric Science Department Colorado State University Presented at Club 20 Fall Meeting, Grand Junction,
Agricultural Weather Assessments World Agricultural Outlook Board
 Texas (8) Missouri (7) South Dakota (6) Kansas (5) Nebraska (5) North Dakota (5) Oklahoma (5) Kentucky (4) Montana (4) California (3) Minnesota (3) New York (3) Pennsylvania (3) Tennessee (3) Wisconsin
Agricultural Weather Assessments World Agricultural Outlook Board
 Texas (8) Missouri (7) South Dakota (6) Kansas () Nebraska () North Dakota () Oklahoma () Kentucky (4) Montana (4) California (3) Minnesota (3) New York (3) Pennsylvania (3) Tennessee (3) Wisconsin (3)
Utility Debt Securitization Authority 2013 T/TE Billed Revenues Tracking Report
 Utility Debt Securitization Authority 2013 T/TE Billed Revenues Tracking Report Billing Budgeted Billed Dollar Percent Month Revenues Revenues Variance Variance Jan 2018 11,943,180.68 12,697,662.47 754,481.79
Becky Bolinger NIDIS IMW Drought Early Warning System Webinar November 21, 2017
 NIDIS Intermountain West Dec-Feb Winter Outlook Becky Bolinger NIDIS IMW Drought Early Warning System Webinar November 21, 2017 COLORADO CLIMATE CENTER La Niña Advisory And associated impacts from La Niña
Precipitation Patterns in South Park
 Precipitation Patterns in South Park Nolan J. Doesken, State Climatologist Colorado Climate Center, Atmospheric Science Department, Colorado State University Presented at South Park Symposium, August 3,
MAR DASHBOARD MAR. Compliant % Breakdown Mar % Late % On-time MAR APR MAY JUN JUL AUG SEP OCT NOV DEC
 Positive Response Compliance 215 Compliant 215 Non-Compliant 216 Compliant 216 Non-Compliant 1% 87% 96% 86% 96% 88% 97% 89% 89% 88% 86% 92% 93% 94% 96% 94% 8% 6% 4% 2% 13% JAN 4% 14% FEB 4% 12% 3% 11%
JULY 2013 RIDERSHIP REPORT MTA METRO-NORTH RAILROAD EXECUTIVE SUMMARY
 Ridership Report JULY 2013 RIDERSHIP REPORT MTA METRO-NORTH RAILROAD EXECUTIVE SUMMARY July July 2013 Total MNR System Ridership was 7.346 million vs. 7.439 million in July 2012, a decrease of 92,959 passengers
Colorado River System: Current Conditions and Near-Term Outlook
 Colorado River System: Current Conditions and Near-Term Outlook Colorado River Water Users Association 2013 Annual Conference Las Vegas, NV December 11-13, 2013 resentation Overview Current Drought and
Nolan Doesken Colorado Climate Center
 Nolan Doesken Colorado Climate Center Presented to: Colorado Cattleman s s Association, Pueblo, CO, June 19, 2006 http://ccc.atmos.colostate.edu Prepared by Odie Bliss 1 Let s s Talk About Precipitation
Properties. terc.ucdavis.edu 8
 Physical Properties 8 Lake surface level Daily since 1900 The lowest lake level on record was 6,220.26 feet on Nov. 30, 1992. Since 1900, lake level has varied by more than 10 feet. Lake level typically
Colorado River Drought Response and System Sustainability. Chuck Cullom July 16, 2014
 Colorado River Drought Response and System Sustainability Chuck Cullom July 16, 2014 Study Structure and Schedule Summary of Key Activities Upcoming Meetings Further Discussion, Follow-up Colorado River
Wisconsin 511 Traveler Information Annual Usage Summary January 3, Wisconsin 511 Phone Usage ( )
") Wisconsin 511 Traveler Information 211 Annual Usage Summary January 3, 212 Overall to-date Summary 36 months of operation 1,16,63 total calls the 1 Million mark was passed on December 3, 212 3,627,527
Wisconsin 511 Traveler Information 211 Annual Usage Summary January 3, 212 Overall to-date Summary 36 months of operation 1,16,63 total calls the 1 Million mark was passed on December 3, 212 3,627,527
WIM #37 I-94, MP OTSEGO, MN APRIL 2012 MONTHLY REPORT
 WIM #37 I-94, MP 200.1 OTSEGO, MN APRIL 2012 MONTHLY REPORT In order to understand the vehicle classes and groupings the Mn/DOT Vehicle Classification Scheme and the Vehicle Classification Groupings for
CCoWS. Central Coast Watershed Studies. Summary of Precipitation and Streamflow for Potrero and San Clemente Creeks in 2010
 Central Coast Watershed Studies CCoWS Summary of Precipitation and Streamflow for Potrero and San Clemente Creeks in Water-Year 2010 Santa Lucia Preserve Monterey County, California Publication No. WI-2011-01
Design Criteria Data
 MEMPHIS TN Latitude = 35.35 N WMO No. 723345 Longitude = 89.87 W Elevation = 322 feet Period of Record = 1973 to 1996 Average Pressure = 29.68 inches Hg Design Criteria Data Mean Coincident (Average) Values
Design Criteria Data
 FRESNO CA Latitude = 36.77 N WMO No. 72389 Longitude =119.7 W Elevation = 328 feet Period of Record = 1972 to 1996 Average Pressure = 29.62 inches Hg Design Criteria Data Mean Coincident (Average) Values
Design Criteria Data
 TUCUMCARI NM Latitude = 35.18 N WMO No. 723676 Longitude =13.6 W Elevation = 465 feet Period of Record = 1973 to 1996 Average Pressure = 25.86 inches Hg Design Criteria Data Mean Coincident (Average) Values
Utah Ag Bankers Conference Alfalfa and Dairy Outlook
 Utah Ag Bankers Conference Alfalfa and Dairy Outlook Dillon M Feuz Utah State University Extension Feb 2018 Hay Market Most data provided by USDA- AMS, NASS & FAS 1990 1990 1991 1991 1992 1992 1993 1994
2018 HR & PAYROLL Deadlines
 th (by payment date) EPAF 3rd PARTY FEEDS WTE Approval 2018 HR & PAYROLL s Normal Payroll day s 2017 B1-26 3 * 13-Dec-17 15-Dec-17 n/a n/a n/a 28-Dec-17 29-Dec-17 11:00 AM 16-Dec-2017 29-Dec-2017 JAN 2018
SWISS Traffic Figures May 2004
 SWISS Traffic Figures May 2004 SWISS continues seat load factor improvement in May SWISS s load factor for May was 4.8 percentage points better than for the same period last year. Seat load factor for
SWISS reports stable load factors
 SWISS Corporate Communications Phone: +41 (0)848 773 773 Fax: +41 (0)44 564 2127 communications@swiss.com SWISS.COM Media release Zurich Airport, October 10, 2008 SWISS reports stable load factors SWISS
Bluetongue Disease (BT)
") Bluetongue Disease (BT) Analysis of ADNS data since 01/2018 Reporting period: 2018-01-01 2018-12-09 Data query: 2018-12-10 AGES DSR Austrian Agency for Health and Food Safety www.ages.at Parameters Data
Bluetongue Disease (BT) Analysis of ADNS data since 01/2018 Reporting period: 2018-01-01 2018-12-09 Data query: 2018-12-10 AGES DSR Austrian Agency for Health and Food Safety www.ages.at Parameters Data
September 2017 MLS Statistical Report. Residential Inventory
 September 217 MLS Statistical Report Residential Inventory 2 2 1 1 21 216 217 Summary Inventories: Residential inventory is down 1%, Lots / Land inventory is down 13% and commercial inventory was down
Rice Yield And Dangue Haemorrhagic Fever(DHF) Condition depend upon Climate Data
 Condition depend upon Climate Data") Rice Yield And Dangue Haemorrhagic Fever(DHF) Condition depend upon Climate Data Dr Lai Lai Aung, Assistant Director( Met Service) Dr Khaing Khaing Soe Assistant Director(Public Health) Dr Thin Nwe htwe
Rice Yield And Dangue Haemorrhagic Fever(DHF) Condition depend upon Climate Data Dr Lai Lai Aung, Assistant Director( Met Service) Dr Khaing Khaing Soe Assistant Director(Public Health) Dr Thin Nwe htwe
SEASONAL PRICES for TENNESSEE FEEDER CATTLE and COWS
 SEASONAL PRICES for TENNESSEE FEEDER CATTLE and COWS Tammy L. McKinley Extension Specialist Agricultural & Resource Economics economics.ag.utk.edu AE16-06 July 2016 TABLE OF CONTENTS Seasonal : Introduction...
Hydrological Condition Report including the issues of High Flow Fluctuation in Chiang Saen
 Hydrological Condition Report including the issues of High Flow Fluctuation in Chiang Saen Technical Symposium for ESCIR and MRC on Social Impact Assessment in River Basin Management Sothea KHEM, HENG
NEVADA SLOT MACHINES: HISTORICAL HOLD PERCENTAGE VARIATIONS ANNUAL AND MONTHLY HOLD PERCENTAGES, CENTER FOR GAMING RESEARCH, NOVEMBER 2017
 NEVADA SLOT MACHINES: HISTORICAL HOLD PERCENTAGE VARIATIONS ANNUAL AND MONTHLY HOLD PERCENTAGES, 2004-2017 CENTER FOR GAMING RESEARCH, NOVEMBER 2017 Executive Summary Hold percentage the portion of money
UPPER COLORADO RIVER COMMISSION FIRST ANNUAL REPORT MARCH 20, 1950
 UPPER COLORADO RIVER COMMISSION FIRST ANNUAL REPORT I- I MARCH 20, 1950 The Treasurer of the Commission is bonded to the amount of $40,000 and the Commission's depository has deposited securities with
Zions Bank Municipal Conference Economic Overview August 13, 2015
 Zions Bank Municipal Conference Economic Overview August 13, 2015 Overview National Economic Conditions Utah Economic Conditions Utah is One of the Fastest Growing CA 0.9% States in the Country Percent
WIM #36 MN 36 MP 15.0 LAKE ELMO APRIL 2014 MONTHLY REPORT
 WIM #36 MN 36 MP 15.0 LAKE ELMO APRIL 2014 MONTHLY REPORT In order to understand the vehicle classes and groupings, the MnDOT Vehicle Classification Scheme and the Vehicle Class Groupings for Forecasting
The Arkansas Basin Climate Report Part 1 -- Remembering where we ve come from
 The Arkansas Basin Climate Report Part 1 -- Remembering where we ve come from Nolan Doesken State Climatologist (retired) Colorado Climate Center / Colorado Water Institute Colorado State University Arkansas
Climate Issues A State s s Perspective
 Climate Issues A State s s Perspective Nolan J. Doesken Colorado State Climatologist, President Elect AASC Colorado Climate Center, Colorado State University FYO8 Central Regional MIC/HIC Conference, Kansas
Intermountain West Climate Summary
 Intermountain West Climate Summary A product of The Western Water Assessment Issued October 2010 Vol. 6, Issue 6 ENSO and Intermountain West Water Supply: A Review of Water Year 2010 and Outlook for Water
91 Express Lanes Model Update 2006 State Route 91 Implementation Plan. Gerald V. Nielsten May 18, 2007
 91 Express Lanes Model Update 2006 State Route 91 Implementation Plan Gerald V. Nielsten May 18, 2007 1 Vollmer Associates LLP is now Stantec Inc. Stantec Inc. completed the acquisition of Vollmer Associates
Manufacturers continue capacity expansion as technology orders grow
 Contact: Penny Brown, AMT, 703-827-5275 pbrown@amtonline.org For Release: September 10, 2018 Manufacturers continue capacity expansion as technology orders grow Manufacturing technology orders for July
TECHNICAL MEMORANDUM
 04/21/01 Page 1 TECHNICAL MEMORANDUM SUBJECT: Green River Basin Plan Surface Water Data Collection and Study Period Selection PREPARED BY: Meg Frantz and Linda Williams, Boyle Engineering Introduction
Bird strikes Swedish Airspace
 Bird strikes Swedish Airspace 1998-2005 Nordic Birdstrike Committee Arlanda 2006-09-21 Jörgen Andersson Jörgen Andersson, Swedish CAA 1 Objective Occurrence reports Bird population Birdstrikes between
DEC DASHBOARD. Positive Response Compliance DEC. Compliant Tickets : On-Time Performance Analysis. December % Late.
 Positive Response Compliance 215 Compliant 215 Non-Compliant 216 Compliant 216 Non-Compliant 1% 87% 96% 86% 96% 88% 97% 89% 97% 89% 98% 88% 97% 86% 96% 92% 97% 93% 97% 94% 97% 96% 97% 94% 97% 8% 6% 4%
JAN DASHBOARD. Positive Response Compliance JAN. Compliant Tickets : On-Time Performance Analysis. January % Late.
 Positive Response Compliance 216 Compliant 216 Non-Compliant 217 Compliant 217 Non-Compliant 1% 96% 97% 8% 6% 4% 2% 4% 3% FEB MAR APR MAY JUN JUL AUG SEP OCT NOV DEC 8% Late Compliant Tickets : On-Time
Presented to Idaho Washington Aquifer Collaborative February 11, Spokane River Project License
 Presented to Idaho Washington Aquifer Collaborative February 11, 2014 Spokane River Project License Contact Speed Fitzhugh, Spokane River License Manager Telephone - (509) 495-4998 Email - speed.fitzhugh@avistacorp.com
Appendix ELP El Paso, Texas 2003 Annual Report on Freeway Mobility and Reliability
 (http://mobility.tamu.edu/mmp) Office of Operations, Federal Highway Administration Appendix ELP El Paso, Texas 2003 Annual Report on Freeway Mobility and Reliability This report is a supplement to: Monitoring
2009 Forecast for the Chicago CBD
 TR Mandigo & Company 2009 Forecast for the Chicago CBD Presented to: Council of Chicago Hotel General Managers By Ted Mandigo Director of TR Mandigo & Company 8/4/2009 Let s cut to the chase. There s a
Bicycle Crashes. Number of Bike Crashes. Total Bike Crashes. are down 21% and severe bike crashes down 8% since 2013 (5 years).
.") Bicycle Crashes The City of Fort Collins is well known for its bike culture, and there is a strong focus on encouraging increased riding. Bike safety is an important component of supporting these efforts.
Bicycle Crashes The City of Fort Collins is well known for its bike culture, and there is a strong focus on encouraging increased riding. Bike safety is an important component of supporting these efforts.
2019 Tours & Treks Registration Form
 2019 Tours & Treks Registration Form PLEASE RETURN COMPLETED FORM TO HISTORY COLORADO YOUR NAME: GUEST(S) NAME: ADDRESS: CITY: PHONE NUMBER: ( ) - MEMBER ID: ZIP: EMAIL: For Treks: *Roommates are not guaranteed,
Analyzing the Energy Economy Michael Plante Senior Research Economist
 Federal Reserve Bank of Dallas Analyzing the Energy Economy Michael Plante Senior Research Economist Disclaimer Disclaimer: The statements in this presentation do not represent the official views of the
Staying in Tune with South Florida s Water Cycle for Scientists, Managers, and Policy Makers in 5 Minutes per Week
 Staying in Tune with South Florida s Water Cycle for Scientists, Managers, and Policy Makers in 5 Minutes per Week Robert Sobczak (Big Cypress Nat l Pres), Todd Hopkins (FWS), Kevin Kotun (Everglades National
System Flexibility Indicators
 System Flexibility Indicators Place your chosen image here. The four corners must just cover the arrow tips. For covers, the three pictures should be the same size and in a straight line. Operational Forum
Wind Data Verification Report Arriga 50m
 Page 1 of 11 Site Name Site Details 9531 - Arriga 5m Arriga 5m Date/Time of report generation 27/11/212 4:22 PM Site Number 9531 Mast Height 5m Mast Location 32568 E 811256 N Coordinate System UTM 55K
ENSO Cycle: Recent Evolution, Current Status and Predictions. Update prepared by Climate Prediction Center / NCEP 8 March 2010
 ENSO Cycle: Recent Evolution, Current Status and Predictions Update prepared by Climate Prediction Center / NCEP 8 March 2010 Outline Overview Recent Evolution and Current Conditions Oceanic Niño Index
PUBLIC MEETINGS. Please see the City of Geneva Public Meeting Guide for more information regarding City Council and Committee of the Whole meetings.
 PUBLIC MEETINGS Citizens are welcome and encouraged to attend all City of Geneva public meetings. Public meeting guests are also urged to participate in any of the City s many public meetings that take
3. EXCEL FORMULAS & TABLES
 Fall 2017 CS130 - Excel Formulas & Tables 1 3. EXCEL FORMULAS & TABLES Fall 2017 Fall 2017 CS130 - Excel Formulas & Tables 2 Cell References Absolute reference - refer to cells by their fixed position.
A review of 2015 fatal collision statistics as of 31 December 2015
 A review of fatal collision statistics as of 31 December This report summarises the main trends in road fatalities that have emerged in. This has been prepared by the Road Safety Authority following analysis
Understanding Rider Differences in Mileage and Riding Frequency through the MSF100 Motorcyclists Naturalistic Study.
 2/18/216 Understanding Rider Differences in Mileage and Riding through the MSF1 Motorcyclists Naturalistic Study January 13, 214 Mac McCall Shane McLaughlin Motorcycle Research Group 1 Overview Objective
Multi-day river trips=planning
 Trip Planning(permit rivers) Selway River Main Salmon River Hells Canyon Rogue River Smith River Middle Fork Salmon River Lodore Canyon Yampa River Deso-Gray Canyons Cataract Canyon Grand Canyon Salt River
Key Feature and Challenges from Climate Change for Mekong River Basin
 1 Key Feature and Challenges from Climate Change for Mekong River Basin By Dr. Thanapon Piman Planning Division Basin Development Plan Pragramme Mekong River Commission Secretariat (MRCS) 2 Outline 1)
Cattle and Beef Markets: Short and Long Run Challenges and Opportunities
 Cattle and Beef Markets: Short and Long Run Challenges and Opportunities Derrell S. Peel Breedlove Professor of Agribusiness and Extension Livestock Marketing Specialist Oklahoma State University Major
Cattle Market Outlook & Important Profit Factors for Cattle Producers
 Cattle Market Outlook & Important Profit Factors for Cattle Producers Dr. Scott Brown Agricultural Markets and Policy Division of Applied Social Sciences brownsc@missouri.edu http://amap.missouri.edu $
NOTE ->->-> DUE THURSDAY APRIL 20 TH 2006 THAT IS CORRECT I FORGOT THIS IS EASTER WEEKEND SO I HAVE EXTENDED THE DUE DATE TO THE ABOVE
 GEO 130 NAME OCEANOGRAPHY TEST 3 TAKE HOME TEST SPRING 2006 NOTE ->->-> DUE THURSDAY APRIL 20 TH 2006 THAT IS CORRECT I FORGOT THIS IS EASTER WEEKEND SO I HAVE EXTENDED THE DUE DATE TO THE ABOVE This test
Climate of Colorado. Climatography of the United States No. 60 (updated 1/2003) Prepared by
 Prepared by") Climate of Colorado Climatography of the United States No. 60 (updated 1/2003) Prepared by Nolan J. Doesken, Roger A. Pielke, Sr., and Odilia A.P. Bliss Colorado Climate Center, Atmospheric Science Department,
Climate of Colorado Climatography of the United States No. 60 (updated 1/2003) Prepared by Nolan J. Doesken, Roger A. Pielke, Sr., and Odilia A.P. Bliss Colorado Climate Center, Atmospheric Science Department,
95 Express Annual Operations Report: Fiscal Year
 95 Express Annual Operations Report: Fiscal Year 2014-2015 General The 95 Express Program completed its sixth full Fiscal Year of operations in June 2015. For the FDOT, its Fiscal Year (FY) is from July
Southern Lodging Summit Memphis, TN. Presented by Randy Smith Founder Smith Travel Research
 Southern Lodging Summit Memphis, TN Presented by Randy Smith Founder Smith Travel Research Total US - Key Statistics 12-Months Ending July 2012 % Change Hotels 52.3 k Room Supply 1.8 bn 0.4% Room Demand
REVENUE & RIDERSHIP REPORT SEPTEMBER 2018
 REVENUE & RIDERSHIP REPORT SEPTEMBER 2018 Year-to-date passenger revenue 1.3% above last year Year-to-date ridership 2.1% below last year 1,500 SEPTA RIDERSHIP PERFORMANCE Average Daily Rides in 000's
Albeni Falls Dam Downstream Water Temperature Study Interim Results
 Albeni Falls Dam Downstream Water Temperature Study Interim Results Amy Reese, Chief Water Management Section Seattle District June 24, 2014 US Army Corps of Engineers What we hope to cover today Albeni
Arizona Climate Summary September 2012
 Arizona Climate Summary September 2012 Summary of conditions for August 2012 August 2012 Temperature and Precipitation Summary August 1 st 15 th : During the month of August, at least one location received
DG AGRI DASHBOARD: CITRUS FRUIT Last update:
 14 000 12 000 10 000 8 000 6 000 4 000 2 000 0 1996 1997 1998 1999 2000 2001 2002 2003 2004 2005 2006 2007 2008 2009 2010 2011 2012 2013 2014 2015 2016 Small citrus (group mandarines): clementines, satsumas
Justification for Rainbow Trout stocking reduction in Lake Taneycomo. Shane Bush Fisheries Management Biologist Missouri Department of Conservation
 Justification for Rainbow Trout stocking reduction in Lake Taneycomo Shane Bush Fisheries Management Biologist Missouri Department of Conservation December 14, 2017 Lake Taneycomo was formed by the construction
Arizona Climate Summary
 Arizona Climate Summary March 2012 Summary of conditions for February 2012 February 2012 Temperature and Precipitation Summary February 1 st 17 th : February continued where January left off with a high
Downtown Denver Summer 2013 Pedestrian Count Report
 Downtown Denver Summer 2013 Pedestrian Report Funded by the Downtown Denver Business Improvement District Downtown Denver Partnership, Inc. Research Department Research Department 511 16 th Street, Suite
Meteorology of Monteverde, Costa Rica 2007
 Meteorology of Monteverde, Costa Rica 2007 Technical Report submitted to the Monteverde Institute Andrew J. Guswa, Associate Professor, Picker Engineering Program Amy L. Rhodes, Associate Professor, Department
 A Brief Analysis of the Impact of the El Niño Southern Oscillation (ENSO) Cycle In specific areas around East Timor In the Climate Change section of Seeds of Life, we believe it would be beneficial for
Lake mead current water level
 P ford residence southampton, ny Lake mead current water level Projected Operations. Hourly Schedules (updated daily) Davis Dam & Parker Dam Headgate Rock Dam. 10-Day Lake Mead Outlook. 4-6-2015 The Historic
September 2018 FY Key Performance Report
 September 20 FY 2019 - Key Performance Report Management Notes: The information in this report is based on the FY 2019 Operating Budget, adopted by the Board on June 11, 20. RT s farebox recovery ratio
African swine fever in domestic pigs and wild boar (ASF)
") African swine fever in domestic pigs and wild boar (ASF) Analysis of ADNS data since 01/2018 Reporting period: 2018-01-01 2018-12-09 Data query: 2018-12-10 AGES DSR Austrian Agency for Health and Food
African swine fever in domestic pigs and wild boar (ASF) Analysis of ADNS data since 01/2018 Reporting period: 2018-01-01 2018-12-09 Data query: 2018-12-10 AGES DSR Austrian Agency for Health and Food
Little Spokane River Stream Gage Report: Deadman Creek, Dragoon Creek, and the West Branch of the Little Spokane River
 Little Spokane River Stream Gage Report: Deadman Creek, Dragoon Creek, and the West Branch of the Little Spokane River June 2010 Spokane County Conservation District N. 210 Havana St. Spokane, WA 99202
LAB H - ATMOSPHERE AND CLIMATE LAB II STABILITY AND PRECIPITATION PATTERNS
 Introduction LAB H - ATMOSPHERE AND CLIMATE LAB II STABILITY AND PRECIPITATION PATTERNS This lab will provide students with the opportunity to become familiar with the concepts of atmospheric stability
Short-Term Transit Ridership and Revenue Forecasting
 Short-Term Transit Ridership and Revenue Forecasting presented to The 5 th Transportation Research Board Conference on Innovations in Travel Modeling presented by Cambridge Systematics, Inc. Feng Liu,
CLAIBORNE LOCK AND DAM PERTINENT DATA
 CLAIBORNE LOCK AND DAM PERTINENT DATA GENERAL Location Clarke, Monroe, & Wilcox Counties, Alabama; Alabama River, river mile 72.5 Drainage area Millers Ferry to Claiborne sq. mi. 836 Total drainage area
Wind Resource Assessment for DEADHORSE, ALASKA
 813 W. Northern Lights Blvd. Anchorage, AK 99503 Phone: 907-269-3000 Fax: 907-269-3044 www.akenergyauthority.org Wind Resource Assessment for DEADHORSE, ALASKA Date last modified: 4/18/2006 Compiled by:
Livestock, Poultry, and Dairy: Situation and Outlook
 Livestock, Poultry, and Dairy: Situation and Outlook AAEA Annual Meeting Extension Track August 14, 2012 James G. Robb Director james.robb@lmic.info 29 land Grant Universities: USDA Members: ERS APHIS
KC Scout Kansas City s Bi-State Transportation Management Center
 KC Scout Kansas City s Bi-State Transportation Management Center Operations Report May 216 This report contains statistical and operational data of activities at the Scout TMC for the period Sunday, May
GAZIFÈRE INC. Prime Rate Forecasting Process 2015 Rate Case
 Overview A consensus forecast is used to estimate the prime rate charged by commercial banks. As the prime rate is subject to competitive pressures faced by individual lenders and is set on an individual
Neighborhood Influences on Use of Urban Trails
 Neighborhood Influences on Use of Urban Trails Greg Lindsey, Yuling Han, Jeff Wilson Center for Urban Policy and the Environment Indiana University Purdue University Indianapolis Objectives Present new
October 14, University of Missouri Extension
 October 14, 2014 University of Missouri Extension Pat Guinan October 14, 2014 A benign growing season for much of Missouri, and the Midwest Missouri Monthly Temperature Departure from Average* April 2014
FOR RELEASE: FRIDAY, MARCH 30 AT 5 AM
 Interviews with 1,014 adult Americans conducted by telephone by ORC International on March 24-25, 2012. The margin of sampling error for results based on the total sample is plus or minus 3 percentage
Market Perspectives for the German and European Agricultural Machinery Industry
 Market Perspectives for the German and European Agricultural Machinery Industry Gerd Wiesendorfer VDMA Agricultural Machinery Association 2013-11-12 Agrievolution Economic Committee Page 1 Business climate